 Liang Zhang1,2
 Xiwu Luan2,3*
- 1Cas Key Laboratory of Marine Geology and Environment, Institute of Oceanography, Chinese Academy of Sciences, Qingdao, China
- 2Function Laboratory of Marine Mineral Resources, Qingdao National Laboratory for Marine Science and Technology, Qingdao, China
- 3Qingdao Institute of Marine Geology, China Geological Survey, Qingdao, China
The Okinawa Trough (OT) is an incipient back-arc basin, but its crustal nature is still controversial. Gravity inversion along with sediment and lithospheric mantle density modeling are used to map the regional Moho depth and crustal thickness variations of the OT and its adjacent areas. The gravity inversion result shows that the crustal thicknesses are 17–22 km at the northern OT, 11–19 km at the central OT, and 7–19 km at the southern OT. Because of the crust with a thickness larger than 17 km, the slow southward arc movement, and scarce contemporaneous volcanisms, the northern OT should be in the stage of early back-arc extension. All of the moderate crustal thickness, high heat flow, and intense volcanism at the central OT indicate that this region is probably in the transitional stage from the back-arc rifting to the oceanic spreading. A crust that is only 7 km thick, lithosphere strength as low as the mid-ocean ridge, and MORB-similar basalts at the southern OT demonstrate that the southern OT is at the early stage of seafloor spreading.
Introduction
Crust is the outermost solid shell of the Earth and the crust types vary significantly among different tectonic units, such as continental margins, oceanic basins, and island arcs. The variation of crustal thickness is a critical factor for understanding the processes of continental rifting and breakup, and determining the crust nature for the incipient back-arc basin (Sutra and Manatschal, 2012).
The Okinawa Trough (OT) is a back-arc basin developed under the area of East China Sea. Although a number of studies have been performed to examine its crustal structure (Iwasaki et al., 1990; Nakamura et al., 2003; Gungor et al., 2012; Klingelhoefer et al., 2012; Shang et al., 2017; Qi et al., 2020), it is still controversial if the nature of its crust is continental, transitional, or oceanic (Liu et al., 2016) (Figure 1). Iwasaki et al. (1990) and Nakahigashi et al. (2004) suggested a thinned continental crust at a rifting stage for northern OT based on OBS data. Sibuet et al. (1998) had the same suggestion for southern OT. Han et al. (2007), however, suggested that the central and southern OT are at a transitional stage based on the extremely high heat flow and intense volcanic activities. Arai et al. (2017) and some earlier researchers (Lee et al., 1980; Sibuet et al., 1987) suggested that oceanic spreading have already occurred in OT. Liu et al. (2016) and other earlier researchers (Sibuet et al., 1987; Sibuet et al., 1998) reported the founding of the linear magnetic anomalies in central OT. Also, regarding the oceanic spreading, Kimura (1985) gave an average half spreading rate of 2 cm/year to the southern OT since early Pleistocene. The time of initial rifting of the northern and central OT is considered to be at the Middle Miocene (Gungor et al., 2012; Xu et al., 2014), while that of the southern OT is believed to be just in the Quaternary (Wu et al., 2007; Shang et al., 2017). Until now, the references have no answer to why there is so long a delay time between northern and southern OT (Shang et al., 2017).
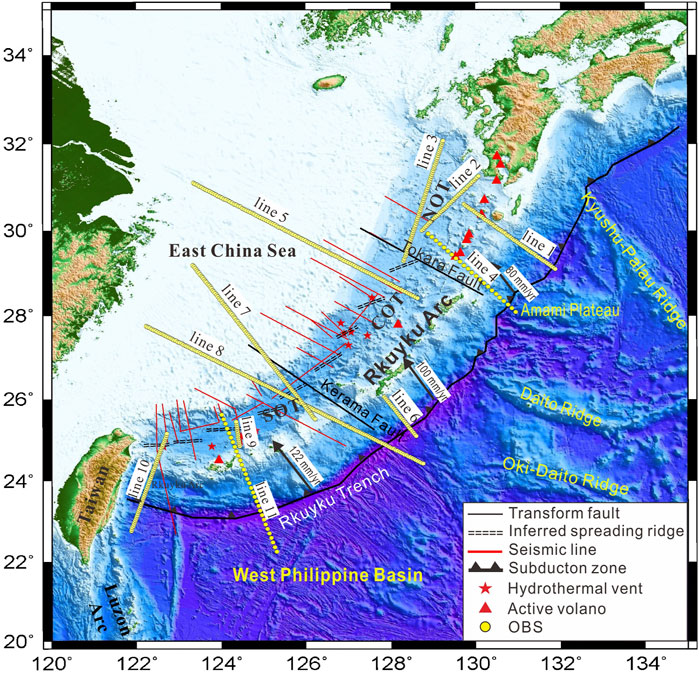
FIGURE 1. Simplified structural map showing the tectonic setting of the Ryukyu trench-arc-basin system and its adjacent region. The base map is the ETOPO1 global relief grid. NOT: northern Okinawa Trough (OT); COT: central OT; SOT: southern OT. The boundaries of the three OT sections are the Tokara Fault and the Kerama Fault (Yan and Shi, 2014).
Many researchers have mapped the Moho of the OT by gravity methods, but their results vary considerably from each other (Hao et al., 2006; Ding et al., 2017; Xuan et al., 2020). In addition, the crustal thickness predicted by gravity method is quite different from the reflection and wide-angle seismic methods in southern OT (Klingelhoefer et al., 2012; Liu et al., 2016). The reason for this difference might be that the low-density anomaly in the mantle due to magma upwelling was not considered in the previous gravity study (Zhou et al., 2001).
Recently, a new alternative gravity inversion method was provided by Bai et al. (2019b), which incorporates sediment and lithospheric mantle density corrections to map the regional Moho topography. Considering the low coverage of deep seismic refraction and broadband seismogram data (Aitken, 2010), here we adopt Bai’s method to map new regional Moho topography of OT by combining it with heat flow, OBSs, and lithospheric strength data, to further examine and discuss the crustal nature of the OT and provide new insight into the ongoing processes of the back-arc basin.
Geologic Setting
The Philippine Sea Plate is characterized by three seafloor highs, known as the Amami Plateau, the Datio Ridge, and the Oki-Daito Ridge to the north (Nishizawa et al., 2014) and relatively flat topography to the south (Taylor and Andrew, 2004). The Philippine Sea Plate is subducting beneath Ryukyu Arc along Ryukyu Trench (Sibuet et al., 1998) with a current subduction rate from ∼8 to ∼13 cm/year from north to south progressively (Argus et al., 2013). The earthquake data indicate that the dip of the Wadat–Benioff zone of the Philippine subduction plate is 25°–27° at the north and 55°–75° at its south.
OT extends ∼1,200 km in the NE-SW direction along and at the back of Ryukyu Arc. It can be divided into northern, central, and southern OT by the Tokara Fault in the north and the Kerama Fault in the south (Fabbri et al., 2004; Gungor et al., 2012) (Figure 1). The depth of seafloor of the southern OT is deeper than that of the central and northern OT, suggesting more rapid subsidence in the south. Seismic data suggest that the southern OT is characterized by well-developed symmetric deep faults, while more diffuse rifting occurred in the north (Gungor et al., 2012). It indicates that the forces along the OT are uneven (Doo et al., 2018). The OT ends at the collision zone between the Luzon Arc and the Taiwan Island since 3.5–4.0 Ma, and this collision probably induced the opening of southern OT (Letouzey and Kimura, 1986; Rateb et al., 2017).
OT has an abnormally high heat flow and intense magmatic activity (Zhang et al., 2019). The average heat flow of the OT based on the 348 available measurements from the global heat flow database of the International Heat Flow Commission is 458 mW/m2, which is much higher than the global average value of 86 mW/m2 (Davies, 2013). The extremely high heat flows (>1,000 mW/m2) in the OT are almost distributed in the central axis of OT, where active volcanoes and hydrothermal vents are developed considerably (Figure 1) (Ishibashi et al., 2015). The geochemistry studies indicate that magmatic activity is affected obviously by fluids derived from the subducting slab dehydration (Guo et al., 2017). Active magmatism at the back-arc and non-spreading central and northern OT may be induced by subducting of the Datio Ridge and the Amami Plateau (Sibuet et al., 1998; Rateb et al., 2017).
The evolution of the OT can be divided into two (Letouzey and Kimura, 1986; Sibuet et al., 1987; Shang et al., 2017) or three stages (Kimura, 1985; Gungor et al., 2012; Liu et al., 2016). The first stage is the initial rifting, triggered by the back-arc normal faulting. The second stage is the passive extension, triggered by the strike-slip pull-apart process or transtensional NNE-trending faults. The third stage is the initial divergence indicated by the newborn oceanic crustal spreading (Liu et al., 2016).
Methodology and Data
The Moho defined as the boundary between crust and mantle is one of the largest density boundaries with the lithosphere (Lai et al., 2016), so gravity method can be used to image the Moho geometry.
The free air gravity anomaly
where
Seawater density is taken as a constant of 1.03 g/cm3, but the density variations of sediment and lithospheric mantle should be modeled in detail. The advantage of this method is that it can remove the gravity effect of density variations of sediments due to compaction and those of lithospheric mantle due to thermal expansion from the observed free air gravity anomaly by density modeling, which is essential for the gravity inversion in the back-arc basin with hot mantle upwelling (Bai et al., 2019b).
Estimating Gravity Effect of the Sediment Layer
The sediment gravity effect is unavoidable for the Moho inversion when the sediment layer is thick. The key issues for estimating gravity effect of the sediment layer are the sedimentary thickness and the density variation. The data and method for mapping sediment thickness variations will be explained in Methodology and Data. The relationship between sediment burial depth, porosity, and density can be used to calculate the sediment density (Sawyer, 1985; López-Coto et al., 2013; Bai et al., 2019a). The porosity variation is a function of buried depth
where
where
Estimating Gravity Effect of the Lithospheric Mantle
The density perturbations of the lithospheric mantle caused by thermal expansion can generate a large gravity anomaly at young oceanic basins and rifted continental margins (Chappell and Kusznir, 2008). There are different lithospheric mantle temperature modeling methods (McKenzie, 1978; Stein and Stein, 1992; Afonso et al., 2008). The gravity effect of density perturbations due to thermal expansion can be modeled based on the thermal expansion coefficient and the temperature structure (McKenzie et al., 2005). The pure shear model by McKenzie (1978) is adopted here for modeling lithospheric temperature field as the work by Chappell and Kusznir (2008).
Crustal age is an important parameter for modeling the temperature structure of lithospheric mantle (Cowie and Kusznir, 2012). The crust of the West Philippine Sea Basin is oceanic, and its age has been interpreted from marine magnetic lineation (Müller et al., 2019). The continental crust is usually much older than that of the oceanic crust, so we assigned the continental crust to have a thermal age of 300 Ma (Currie and Hyndman, 2006). Our tests show that the lithospheric mantle temperature almost does not change when the crustal age varies larger than 300 Ma. Since the crustal nature is unclear at the central and southern OT, a series of thermal ages will be assigned to examine which can yield the Moho inversion result that can best fit with the seismic interpretation.
Mapping Sediment Thickness Variations
The sediment thicknesses data used in this study are partly from the global sediment thickness model for oceans and marginal basins (Straume et al., 2019) and from recent seismic survey by CGS and reported by Fang et al. (2020). Kriging interpolation method is used to merge these two grids. Figure 2 shows the sediment thickness data created and used in this study. The depocenters distribute in NE trending, such as the Xihu and Jilong sags. The maximum sediment thicknesses of the two sags exceed 11 km. In the OT, the maximum sediment thickness decreased from 8 km at the central OT to only 4–5 km at the northern and southern OT.
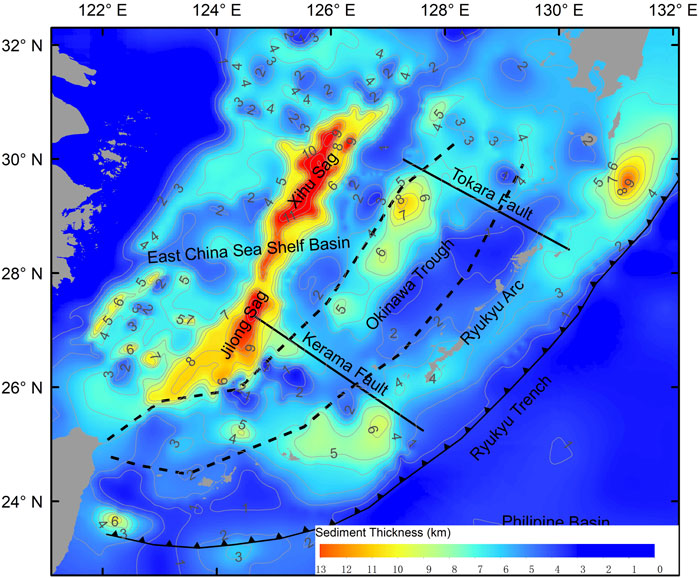
FIGURE 2. The thickness map of the sedimentary layer in our study area. The grid is created via Kriging interpolation method based on the global marine sediment thickness grid (Straume et al., 2019) and recent interpretation results of seismic reflection data (Fang et al., 2020). The black dashed lines represent the boundaries of the Okinawa Trough.
Input Data
The free-air gravity anomalies (Figure 3) are from the 1-min-resolution global free-air gravity model based on the altimetry data by the satellite named Geosat, ERS-1, Envisat, GryoSat-2, and Jason-1 (Sandwell et al., 2014). The bathymetric data used in gravimetric correction are from the ETOPO1, which is also a 1 arc-minute global relief model (Amante and Eakins, 2009). The Moho interpretation results of 11 geophysical (mainly OBS) profiles at the OT and the Ryukyu Arc (Figure 1; Table 1) are collected in order to estimate the gravity inversion uncertainty. The heat flow (Figure 3) can be used to recover the thermal structure of the Earth and the heat flow data are extracted from the global heat flow database of the International Heat Flow Commission.
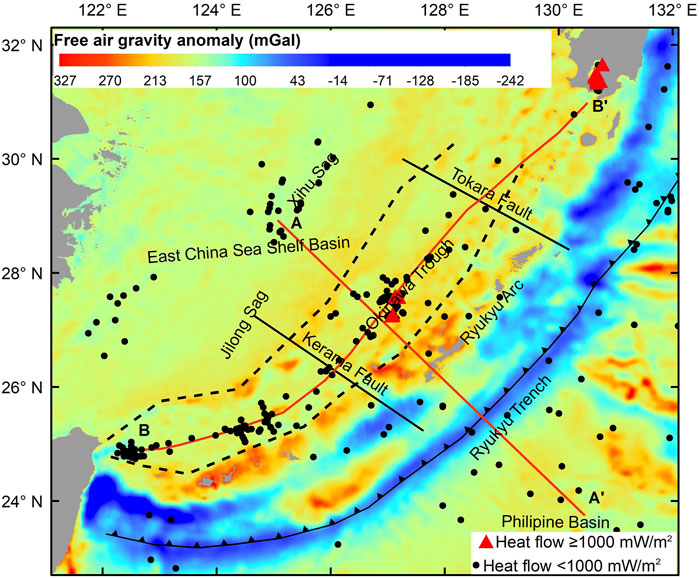
FIGURE 3. The free-air gravity anomalies (Sandwell et al., 2014) and the heat flow stations from the database of the International Heat Flow Commission.
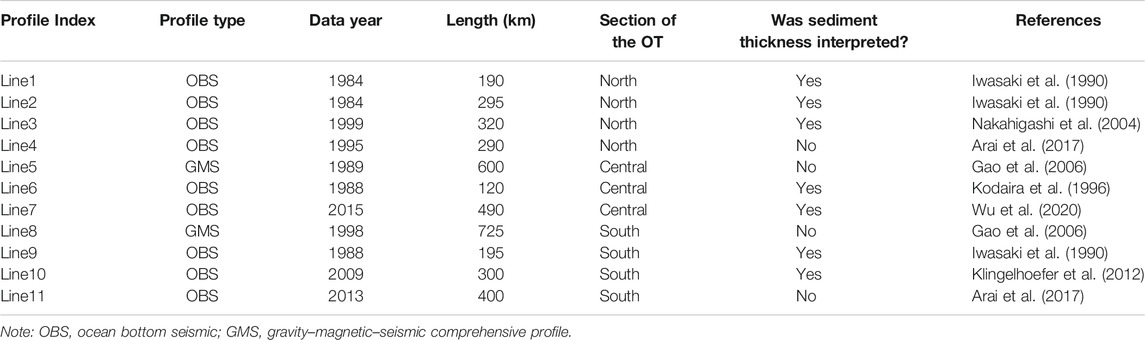
TABLE 1. Information on the geophysical profiles used in this study.
Gravity Inversion Result
According to our tests, when the ages of the southern and central OT are 1 and 10 Ma, respectively, the Moho inversion result can fit with the seismic interpretation best and the RMS between the gravity and seismic results is 2.28 km. The gravity effect of the sediment layer and lithospheric mantle are highly correlated with the sediment thickness and crustal age variations, respectively (Figure 4). Figure 5 shows our final Moho inversion result and the crustal thickness map, and the later one is based on the Moho inversion, bathymetry, and sediment thickness data.
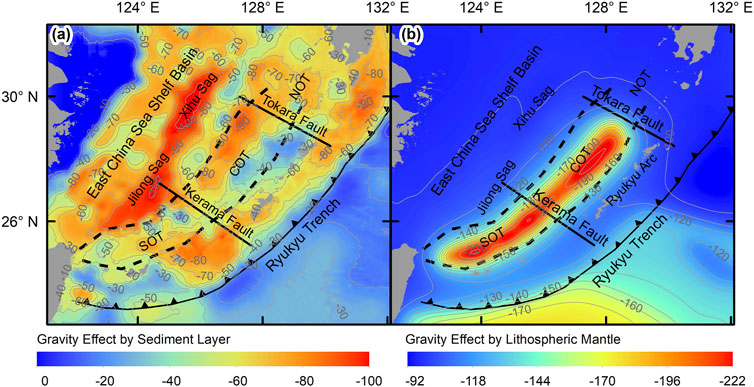
FIGURE 4. Gravity effect induced by sediment density variations relative to normal continental crust density (A) and gravity effect induced by lithospheric mantle density variations relative to normal mantle density (B).
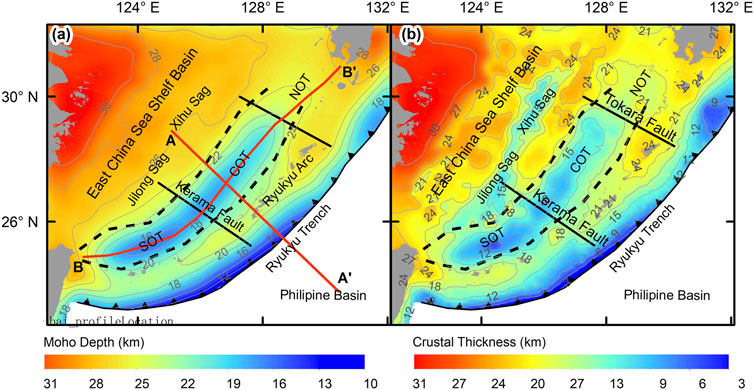
FIGURE 5. Moho depths (A) determined from gravity inversion and crustal thickness (B), which is obtained by subtracting the sea water depth and sediment thickness from the Moho depth. The red thick lines in the left panel represent the locations of the profiles in Figure 7 and Figure 8.
The Moho and crustal thickness are characterized by NE trending lineation, consistent with characteristic of the Ryukyu trench-arc-basin system. The Moho depths are 25–30 km in the East China Sea Shelf Basin and 15–25 km in the OT, respectively (Figure 5A). The southern OT holds shallowest Moho and thinnest crust in the whole OT. The crustal thickness of the northern OT is greater than that of the central OT (Figure 5B). One belt with highly thinned crust locates along the Xihu and Jilong sags, extending in the NE direction in the East China Sea Shelf Basin even though there is no Moho shallowing in this region.
Uncertainty Analysis
We evaluate the reliability of our Moho depth estimates derived from inversion of gravity data against previous seismic imaging studies, and discuss the effect of lithospheric mantle temperature on Moho inversion.
Comparison With Seismic Profiles
The Moho depths interpreted from seismic studies are considered to have a better accuracy than gravity inversion. So, seismic interpretation results are always taken as the reference for estimating gravity inversion uncertainty (Chappell and Kusznir, 2008; Bai et al., 2019b). However, note that the seismic interpretation itself also contains uncertainty. For example, at the intersection point between line 7 and line 8 (Figure 1), the Moho depth from line 7 is 19.0 km (Wu et al., 2020), but that from line 8 is 17.9 km (Gao et al., 2006); thus, the difference between them reaches 1.1 km. Figure 6 shows the comparison between the Moho depths from the collected seismic interpretation and our gravity inversion. The root mean square (RMS) between the Moho depths from interpreted seismic profiles and those from our final gravity inversion at the same sampling stations is 2.28 km. However, the RMS is 4.12 km when ignoring gravity effect induced by both sediment and mantle, and that is 3.16 km when ignoring only the mantle gravity effect.
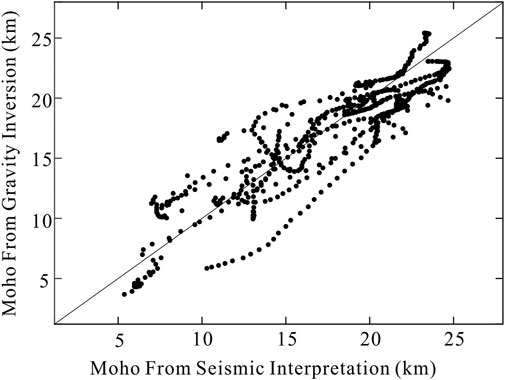
FIGURE 6. Moho depth from gravity inversion vs. that from seismic interpretation. The root mean square (RMS) between them is 2.28 km.
The Effect of Lithospheric Mantle Temperature on Moho Inversion
We set a 0–300 Ma OT crustal age span for testing. At first, each possible age pair for central and southern OT combination will be applied to temperature modeling and gravity inversion by setting age varying step as 10 Ma. When the crustal age of the central and southern OT is 10 and 0 Ma, the gravity inversion can fit with the seismic interpretation best. Then, the age step is reduced to 1 Ma; age varying range for the central OT is narrowed to 20–0 Ma, and that for the southern OT is narrowed to 10–0 Ma. Finally, when the crustal age for the central OT is 10 Ma and that for the southern OT is 1 Ma, the smallest RMS of 2.28 km is derived. Some of the results are listed in Table 2. Please note that, when the lithospheric mantle density perturbations due to temperature variations are ignored for gravity inversion, the RMS will be increased to 2.67 km. Therefore, the lithospheric mantle density modeling based on the age setting for the central and southern OT can improve the Moho inversion accuracy.
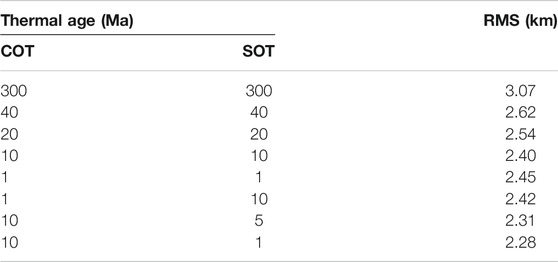
TABLE 2. The root mean square (RMS) between gravity inversion result and seismic interpretation when setting different thermal ages for the central Okinawa Trough (COT) and the southern Okinawa Trough (SOT).
Tectonic Implications
The large-scale Moho and crustal thickness variation trend is an important implication for the tectonic characteristics. There is no corresponding mantle upwelling beneath the Xihu and Jilong sags judging from the Moho depth (Figure 5A and Figure 7), but the crust here has been thinned considerably (Figure 5B and Figure 7). It indicates that the attenuation of the Xihu and the Jilong sag is mainly in the upper crust. However, the mantle has upwelled under the OT and there is also obviously high heat flow at the OT. It means that the crustal thinning at the OT is not contributed by the upper crustal necking predominantly. Therefore, the crustal thinning mechanisms are different between the OT and the Xihu-Jilong sags.
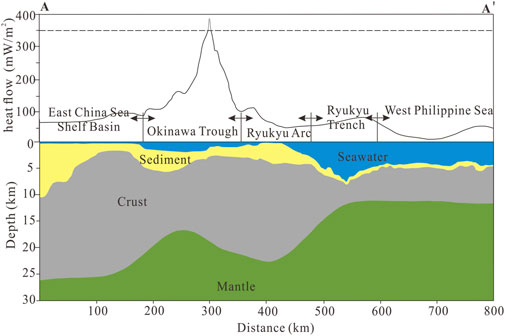
FIGURE 7. The crustal structure and the heat flow along the profile AA′; profile location is shown in Figure 5A. The bathymetry is from ETOPO1, the sediment thickness is extracted from the data shown in Figure 2, and the Moho geometry is from our gravity inversion. The heat flow data are extracted from the global heat flow database of the International Heat Flow Commission. The dashed part of the heat flow curve represents that the heat flow here is much higher than 350 mW/m2.
The crustal thicknesses are 17–22 km at the northern OT, 11–19 km at the central OT, and 7–19 km at the southern OT (Figure 5B). The crustal thickness variations along the OT is quite similar to the Lau-Havre-Taupo back-arc basins (Kimura, 1985; Sibuet et al., 1987; Yan and Shi, 2014), so probably multi-evolution stages from rifting to spreading have been developed along the OT.
The Northern Okinawa Trough
The Moho depth variations at the northern OT agree with the seismic interpretation results of the OBS line 1, line 2, line 3, and line 4 (references are list in Table 1). Even though the velocity structures obtained from the OBSs data also indicate that the northern OT is a thinned continental crust in an arc rifting domain (Arai et al., 2017), the average crustal thickness here is larger than those of the central and southern OT. We suggest that the subduction of the seafloor highs, such as the Kyushu-Palau Ridge and the Amami Plateau, beneath the northern Ryukyu Arc had hampered the back-arc extension at the northern OT. The conversion from subduction to collision causes fore-arc rotation and also results in plate boundary curvature. In addition, GPS measurements show that the southward movement of the northeast Ryukyu Arc is much slower than that in the southwest (Nakamura et al., 2003). Contemporaneous volcanisms are concentrated on the northern Ryukyu Arc and scarcely occur in the northern OT (Figure 1). Therefore, the northern OT should be in the stage of early back-arc extension.
The Central Okinawa Trough
Compared with the northern OT, the crust of the central OT has been highly thinned, with the present thickness of 11–19 km and the Moho depths of 16–23 km. The seismic interpretation along line 7 (Wu et al., 2020) and our gravity inversion result (Figure 8) show an obvious mantle upwelling beneath the axis of the central OT. In addition, the crust here has many similar characters with the oceanic crust, such as extremely high heat flow (Figure 8), hydrothermal fields, and intense volcanism (Figure 1) (Hao et al., 2004). Unlike only arc volcanism at the northern part of the Ryukyu trench-arc-basin system, the volcanism migrated from the arc to the back-arc region at the central OT. This is called the volcanic arc-rift migration phenomenon (VAMP) (Sibuet et al., 1987). A series of NE-trending faults occurred in the region with VAMP (Gungor et al., 2012). It indicates that the magma upwelling is correlated to the extensional faults. Active rifting structures have been observed from seismic reflection data in the Iheya Graben and the adjacent area at the central OT (Ikegami et al., 2015). However, the crust here is still not thin enough for crust break and further seafloor spreading. In addition, the volcanism here is still dispersed. Similar to the northern OT, the subduction of the Datio Ridge and the Oki-Daito Ridge beneath the central Ryukyu Arc also had hampered the spreading of the central OT. Therefore, the central OT is probably in the transitional stage from back-arc rifting to oceanic spreading, characterized by moderate crustal thinning, high heat flow, and intense magmatic activity.
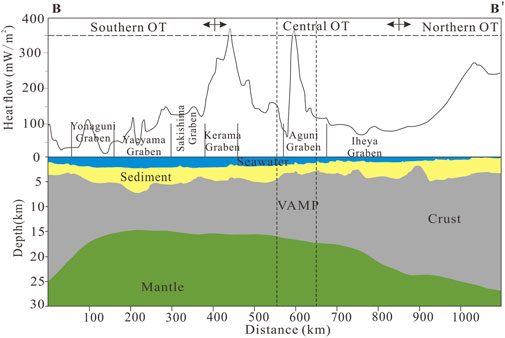
FIGURE 8. The crustal structure and the heat flow along the profile BB′; profile location is shown in Figure 5A. The data sources are the same as those in Figure 7.
The Southern Okinawa Trough
Figure 7B shows that the southern OT has the thinnest average crustal thickness among the three OT sections. However, solely based on the crust thickness, it is difficult to determine whether it is highly thinned continental crust or oceanic crust. We will further discuss this issue from the following three aspects.
1) From the thermal state. In general, the age of the oceanic crust is obviously younger than that of the continental crust. Our lithospheric mantle density modeling result indicates that the lithosphere thermal state of the southern OT is quite similar to the thermal state of the mid-ocean ridge, and so the crust here is apt to be oceanic.
2) From the plate strength. The effective elastic thickness (Te) of the lithosphere at the southern OT estimated from topography and gravity data is 5–7 km. The minimum effective elastic thickness occurred around the Yaeyama Graben with a thickness of 2.5–3.0 km (Fu et al., 2002), which is similar to the Te value of the mid-ocean ridge (Cochran, 1979).
3) From the rock type. Fresh basalts were collected by TV grab on the western end of the Yaeyama Graben, and this graben holds the thinnest crust of the whole OT (Lai et al., 2016). Furthermore, MORB-similar basalts at the southern OT is considered to be an important evidence for seafloor spreading here (Zong et al., 2016).
Therefore, we suggest that the southern OT is at the early stage of seafloor spreading, especially at the Yaeyama Graben.
Comparisons to Other Similar Tectonic Regions
The progressive variations of deformation style along the rift axis as occurred in the OT can be found in other basins, such as the East Gakkel Ridge-Laptev Sea Margin area in the Arctic Ocean (Franke et al., 2001) and the Woodlark Basin off Papua New Guinea in the western Pacific (Benes et al., 1994). The rifting to drifting transitions has generally been suggested as the result of differentiated lithospheric strength and the transfer or shear zones are always the boundaries between the rifting and drifting regions (Dunbar and Sawyer, 1996; Van Wijk and Blackman, 2005). Since the NW-SE-trending Kerama and Tokara faults, which separate the northern-central-southern OT, are thought as the result of the subduction of the high and buoyant topography in the Philippines Sea Plate (Sibuet et al., 1998; Gungor et al., 2012) and no evidence can demonstrate that pre-rifting OT has varying lithospheric strength, we suggest that the diffuse rifting in the OT is also due to the topographic high subduction.
Conclusion
The acoustic sedimentary basement geometry was mapped based on the published sediment thickness grid and recent seismic interpretations. The density variations in the sediment layer and the lithospheric mantle have been modeled for gravity inversion. The crustal thickness of the Ryukyu trench-arc-basin systems was estimated from the high-resolution free-air gravity anomaly.
The variations of the crustal thickness, along with the heat flow, the fault pattern, and the petrology data, indicate that the three sections of the OT are at different back-arc extension stages. The back-arc extension of the northern and central OT had been hampered by the subduction of bathymetry highs in the West Philippine Basin, but the southern section had not.
1) The northern OT holds the thickest crust among the three sections, the slow southward arc movement, and scarce contemporaneous volcanisms. These three facts indicate that the northern OT is in the stage of the early back-arc extension.
2) The central OT holds moderately thinned crustal thickness, extremely high heat flow, and intense volcanism. Therefore, the central OT is probably in the transitional stage from back-arc rifting to oceanic spreading.
3) The thinnest crust at the southern OT is only with 7 km thick. In addition, both the lithosphere thermal state and the lithospheric strength of the southern OT are quite similar to those of the mid-ocean ridge; MORB-similar basalts have been found in the southern OT. Therefore, we suggest that the southern OT is at the early stage of seafloor spreading.
Data Availability Statement
The datasets presented in this study can be found in online repositories. The names of the repository/repositories and accession number(s) can be found in the article/Supplementary Material.
Author Contributions
LZ: Compiled the data, gravity modeling, and writing. XL: Seismic interpretation and writing—review and editing.
Funding
This study is supported by the China-ASEAN Maritime Cooperation Fund Project (No. 12120100500017001), the National Natural Science Foundation of China (Nos. 92055211 and 41406065), the National Program on Global Change and Air-Sea Interaction (GASI-GEOGE-02), and the Taishan Scholar Foundation of Shandong Province (ts201511061). The necessary datasets for reproducing this work can be downloaded from Zhang, Liang (2021), “data Supplementary For Moho geometry of the Okinawa Trough based on gravity inversion and its implications on the crustal nature and tectonic evolution”, Mendeley Data, V1, doi: 10.17632/dt9jkphts6.1.
Conflict of Interest
The authors declare that the research was conducted in the absence of any commercial or financial relationships that could be construed as a potential conflict of interest.
Publisher’s Note
All claims expressed in this article are solely those of the authors and do not necessarily represent those of their affiliated organizations, or those of the publisher, the editors, and the reviewers. Any product that may be evaluated in this article, or claim that may be made by its manufacturer, is not guaranteed or endorsed by the publisher.
References
Afonso, J. C., Fernàndez, M., Ranalli, G., Griffin, W. L., and Connolly, J. A. D. (2008). Integrated Geophysical-Petrological Modeling of the Lithosphere and Sublithospheric Upper Mantle: Methodology and Applications. Geochem. Geophys. Geosyst. 9, a–n. doi:10.1029/2007gc001834
Aitken, A. R. A. (2010). Moho Geometry Gravity Inversion experiment (MoGGIE): A Refined Model of the Australian Moho, and its Tectonic and Isostatic Implications. Earth Planet. Sci. Lett. 297, 71–83. doi:10.1016/j.epsl.2010.06.004
Amante, C., and Eakins, B. W. (2009). in ETOPO1 1 Arc-Minute Global Relief Model: Procedures, Data Sources and AnalysisNational Geophysical Data Center-24 (United States: NOAA). doi:10.7289/V5C8276M
Arai, R., Kodaira, S., Yamada, T., Takahashi, T., Miura, S., Kaneda, Y., et al. (2017). Subduction of Thick Oceanic Plateau and High‐angle normal‐fault Earthquakes Intersecting the Slab. Geophys. Res. Lett. 44, 6109–6115. doi:10.1002/2017GL073789
Argus, D. F., Gordon, R. G., and Demets, C. (2011). Geologically Current Motion of 56 Plates Relative to the No-Net-Rotation Reference Frame. Geochem. Geophys. Geosyst. 12, a–n. doi:10.1029/2011GC003751
Bai, Y., Dong, D., Brune, S., Wu, S., and Wang, Z. (2019a). Crustal Stretching Style Variations in the Northern Margin of the South China Sea. Tectonophysics 751, 1–12. doi:10.1016/j.tecto.2018.12.012
Bai, Y., Gui, Z., Li, M., Dong, D., Wu, S., and Wang, Z. (2019b). Crustal Thickness over the NW Pacific and its Tectonic Implications. J. Asian Earth Sci. 185, 104050. doi:10.1016/j.jseaes.2019.104050
Bai, Y., Williams, S. E., Müller, R. D., Liu, Z., and Hosseinpour, M. (2014). Mapping Crustal Thickness Using marine Gravity Data: Methods and Uncertainties. Geophysics 79, G27–G36. doi:10.1190/geo2013-0270.1
Benes, V., Scott, S. D., and Binns, R. A. (1994). Tectonics of Rift Propagation into a continental Margin: Western Woodlark Basin, Papua New Guinea. J. Geophys. Res. 99, 4439–4455. doi:10.1029/93JB02878
Chappell, A. R., and Kusznir, N. J. (2008). Three-dimensional Gravity Inversion for Moho Depth at Rifted continental Margins Incorporating a Lithosphere thermal Gravity Anomaly Correction. Geophys. J. Int. 174, 1–13. doi:10.1111/j.1365-246X.2008.03803.x
Cochran, J. R. (1979). An Analysis of Isostasy in the World's Oceans: 2. Midocean ridge Crests. J. Geophys. Res. 84, 4713–4729. doi:10.1029/JB084iB09p04713
Cowie, L., and Kusznir, N. (2012). Gravity Inversion Mapping of Crustal Thickness and Lithosphere Thinning for the Eastern Mediterranean. The Leading Edge 31, 810–814. doi:10.1190/tle31070810.1
Currie, C. A., and Hyndman, R. D. (2006). The thermal Structure of Subduction Zone Back Arcs. J. Geophys. Res. 111, B08404. doi:10.1029/2005JB004024
Davies, J. H. (2013). Global Map of Solid Earth Surface Heat Flow. Geochem. Geophys. Geosyst. 14, 4608–4622. doi:10.1002/ggge.20271
Ding, W., Li, J., Wu, Z., Li, S., Lin, X., and Somerville, I. (2017). Late Mesozoic Transition from Andean‐type to Western Pacific‐type of the East China continental Margin-Is the East China Sea Basement an Allochthonous Terrain? Geol. J. 53, 1994–2002. doi:10.1002/gj.3029
Doo, W.-B., Lo, C.-L., Hsu, S.-K., Tsai, C.-H., Huang, Y.-S., Wang, H.-F., et al. (2018). New Gravity Anomaly Map of Taiwan and its Surrounding Regions with Some Tectonic Interpretations. J. Asian Earth Sci. 154, 93–100. doi:10.1016/j.jseaes.2017.12.010
Dunbar, J. A., and Sawyer, D. S. (1996). Three-dimensional Dynamical Model of continental Rift Propagation and Margin Plateau Formation. J. Geophys. Res. 101, 27845–27863. doi:10.1029/96JB01231
Fabbri, O., Monié, P., and Fournier, M. (2004). “Transtensional Deformation at the junction between the Okinawa Trough Back-Arc basin and the SW Japan Island Arc,” in Vertical and Decoupling in the Lithosphere. Editors J. Grocott, K. J. W. Mc Caffrey, G. Taylor, and B. Tikoff (London,UK: Special Publication - Geological Society of London), 227, 297–312. doi:10.1144/GSL.SP.2004.227.01.15
Fang, P., Ding, W., Lin, X., Zhao, Z., Fang, Y., and Li, C. (2020). Neogene Subsidence Pattern in the Multi-Episodic Extension Systems: Insights from Backstripping Modelling of the Okinawa Trough. Mar. Pet. Geology. 111, 662–675. doi:10.1016/j.marpetgeo.2019.08.051
Franke, D., Hinz, K., and Oncken, O. (2001). The Laptev Sea Rift. Mar. Pet. Geology. 18, 1083–1127. doi:10.1016/S0264-8172(01)00041-1
Fu, Y., Li, A., and Qin, Y. (2002). Effective Elastic Thickness of the Oceanic and continental Marginal Lithospheres. Mar. Geology. Quat. Geology. (in Chinese) 22, 68–75. doi:10.16562/j.cnki.0256-1492.2002.03.011
Gao, D., Jinhai, Z., Bo, Y., and Tang, J. (2006). A Study on Lithopshere 3D Structures in the East China Sea and Adjacent Regions. Chin. J. Geology. (in Chinese) 41, 20–26. doi:10.1111/j.1745-4557.2006.00081.x
Gungor, A., Lee, G. H., Kim, H.-J., Han, H.-C., Kang, M.-H., Kim, J., et al. (2012). Structural Characteristics of the Northern Okinawa Trough and Adjacent Areas from Regional Seismic Reflection Data: Geologic and Tectonic Implications. Tectonophysics 522-523, 198–207. doi:10.1016/j.tecto.2011.11.027
Guo, K., Zeng, Z.-G., Chen, S., Zhang, Y.-X., Qi, H.-Y., and Ma, Y. (2017). The Influence of a Subduction Component on Magmatism in the Okinawa Trough: Evidence from Thorium and Related Trace Element Ratios. J. Asian Earth Sci. 145, 205–216. doi:10.1016/j.jseaes.2017.05.033
Han, B., Zhang, X., Pei, J., and Zhang, W. (2007). Characteristics of Crust-Mantle in East China Sea and Adjacent Regions. Prog. Geophys. (in Chinese) 22, 376–382. doi:10.1007/s11442-007-0020-2
Hao, T.-Y., Liu, J.-H., Guo, F., Huang, Z.-X., Xu, Y., Dai, M.-G., et al. (2004). Research on Crust Structure and Lithosphere Property beneath the Okinawa through Area. Chin. J. Geophys. 47, 525–532. doi:10.1002/cjg2.516
Hao, T.-Y., Xu, Y., Xu, Y., Suh, M., Liu, J.-H., Dai, M.-G., et al. (2006). Some New Understandings on the Deep Structure in Yellow Sea and East China Sea. Chin. J. Geophys. 49, 405–416. doi:10.1002/cjg2.849
Ikegami, F., Tsuji, T., Kumagai, H., Ishibashi, J.-i., and Takai, K. (2015). “Active Rifting Structures in Iheya Graben and Adjacent Area of the Mid-okinawa Trough Observed through Seismic Reflection Surveys,” in Subseafloor Biosphere Linked to Hydrothermal Systems: TAIGA Concept. Editors J. i. Ishibashi, K. Okino, and M. Sunamura (Japan, Tokyo: Springer), 361–368. doi:10.1007/978-4-431-54865-2_28
Ishibashi, J.-i., Tsunogai, U., Toki, T., Ebina, N., Gamo, T., Sano, Y., et al. (2015). Chemical Composition of Hydrothermal Fluids in the central and Southern Mariana Trough Backarc basin. Deep Sea Res. Part Topical Stud. Oceanography 121, 126–136. doi:10.1016/j.dsr2.2015.06.003
Iwasaki, T., Hirata, N., Kanazawa, T., Melles, J., Suyehiro, K., Urabe, T., et al. (1990). Crustal and Upper Mantle Structure in the Ryukyu Island Arc Deduced from Deep Seismic Sounding. Geophys. J. Int. 102, 631–651. doi:10.1111/j.1365-246X.1990.tb04587.x
Kimura, M. (1985). Back-arc Rifting in the Okinawa Trough. Mar. Pet. Geology. 2, 222–240. doi:10.1016/0264-8172(85)90012-1
Klingelhoefer, F., Berthet, T., Lallemand, S., Schnurle, P., Lee, C.-S., Liu, C.-S., et al. (2012). P-wave Velocity Structure of the Southern Ryukyu Margin East of Taiwan: Results from the ACTS Wide-Angle Seismic experiment. Tectonophysics 578, 50–62. doi:10.1016/j.tecto.2011.10.010
Kodaira, S., Iwasaki, T., Urabe, T., Kanazawa, T., Egloff, F., Makris, J., et al. (1996). Crustal Structure across the Middle Ryukyu Trench Obtained from Ocean Bottom Seismographic Data. Tectonophysics 263, 39–60. doi:10.1016/S0040-1951(96)00025-X
Kusznir, N. J., Roberts, A. M., and Alvey, A. D. (2018). Crustal Structure of the Conjugate Equatorial Atlantic Margins, Derived by Gravity Anomaly Inversion. Geol. Soc. Lond. Spec. Publications 476, 83–107. doi:10.1144/SP476.5
Lai, Z., Zhao, G., Han, Z., Liu, B., Bu, X., and Leng, C. (2016). Back-arc Magma Processes in the Okinawa Trough: New Insights from Textural and Compositional Variations of Plagioclase in Basalts. Geol. J. 51, 346–356. doi:10.1002/gj.2767
Lee, C.-S., Shor, G. G., Bibee, L. D., Lu, R. S., and Hilde, T. W. C. (1980). Okinawa Trough: Origin of a Back-Arc basin. Mar. Geology. 35, 219–241. doi:10.1016/0025-3227(80)90032-8
Letouzey, J., and Kimura, M. (1986). The Okinawa Trough: Genesis of a Back-Arc basin Developing along a continental Margin. Tectonophysics 125, 209–230. doi:10.1016/0040-1951(86)90015-6
Liu, B., Li, S.-Z., Suo, Y.-H., Li, G.-X., Dai, L.-M., Somerville, I. D., et al. (2016). The Geological Nature and Geodynamics of the Okinawa Trough, Western Pacific. Geol. J. 51, 416–428. doi:10.1002/gj.2774
López-Coto, I., Mas, J. L., and Bolivar, J. P. (2013). A 40-year Retrospective European Radon Flux Inventory Including Climatological Variability. Atmos. Environ. 73, 22–33. doi:10.1016/j.atmosenv.2013.02.043
McKenzie, D., Jackson, J., and Priestley, K. (2005). Thermal Structure of Oceanic and continental Lithosphere. Earth Planet. Sci. Lett. 233, 337–349. doi:10.1016/j.epsl.2005.02.005
McKenzie, D. (1978). Some Remarks on the Development of Sedimentary Basins. Earth Planet. Sci. Lett. 40, 25–32. doi:10.1016/0012-821X(78)90071-7
Müller, R. D., Zahirovic, S., Williams, S. E., Cannon, J., Seton, M., Bower, D. J., et al. (2019). A Global Plate Model Including Lithospheric Deformation along Major Rifts and Orogens since the Triassic. Tectonics 38, 1884–1907. doi:10.1029/2018TC005462
Nakahigashi, K., Shinohara, M., Suzuki, S., Hino, R., Shiobara, H., Takenaka, H., et al. (2004). Seismic Structure of the Crust and Uppermost Mantle in the Incipient Stage of Back Arc Rifting - Northernmost Okinawa Trough. Geophys. Res. Lett. 31, L02614. doi:10.1029/2003GL018928
Nakamura, M., Yoshida, Y., Zhao, D., Katao, H., and Nishimura, S. (2003). Three-dimensional P- and S-Wave Velocity Structures beneath the Ryukyu Arc. Tectonophysics 369, 121–143. doi:10.1016/S0040-1951(03)00172-0
Nishizawa, A., Kaneda, K., Katagiri, Y., and Oikawa, M. (2014). Wide-angle Refraction Experiments in the Daito Ridges Region at the Northwestern End of the Philippine Sea Plate. Earth Planet. Sp 66, 25. doi:10.1186/1880-5981-66-25
Oldenburg, D. W. (1974). The Inversion and Interpretation of Gravity Anomalies. Geophysics 39, 526–536. doi:10.1190/1.1440444
Qi, J., Zhang, X., Wu, Z., Meng, X., Shang, L., Li, Y., et al. (2021). Characteristics of Crustal Variation and Extensional Break-Up in the Western Pacific Back-Arc Region Based on a Wide-Angle Seismic Profile. Geosci. Front. 12, 101082. doi:10.1016/j.gsf.2020.09.011
Rateb, A., Ching, K.-E., Kuo, C.-Y., Rau, R.-J., and Chen, C.-L. (2017). Kinematics of the Tectonic Blocks and Active Faults at the post-orogenic Stage: Northern Taiwan. J. Asian Earth Sci. 149, 29–40. doi:10.1016/j.jseaes.2017.07.055
Sandwell, D. T., Müller, R. D., Smith, W. H. F., Garcia, E., and Francis, R. (2014). New Global marine Gravity Model from CryoSat-2 and Jason-1 Reveals Buried Tectonic Structure. Science 346, 65–67. doi:10.1126/science.1258213
Sawyer, D. S. (1985). Total Tectonic Subsidence: A Parameter for Distinguishing Crust Type at the U.S. Atlantic Continental Margin. J. Geophys. Res. 90, 7751–7769. doi:10.1029/JB090iB09p07751
Shang, L.-N., Zhang, X.-H., Jia, Y.-G., Han, B., Yang, C.-S., Geng, W., et al. (2017). Late Cenozoic Evolution of the East China continental Margin: Insights from Seismic, Gravity, and Magnetic Analyses. Tectonophysics 698, 1–15. doi:10.1016/j.tecto.2017.01.003
Sibuet, J.-C., Deffontaines, B., Hsu, S.-K., Thareau, N., Le Formal, J.-P., and Liu, C.-S. (1998). Okinawa Trough Backarc basin: Early Tectonic and Magmatic Evolution. J. Geophys. Res. 103, 30245–30267. doi:10.1029/98JB01823
Sibuet, J.-C., Letouzey, J., Barbier, F., Charvet, J., Foucher, J.-P., Hilde, T. W. C., et al. (1987). Back Arc Extension in the Okinawa Trough. J. Geophys. Res. 92, 14041–14063. doi:10.1029/JB092iB13p14041
Stein, C. A., and Stein, S. (1992). A Model for the Global Variation in Oceanic Depth and Heat Flow with Lithospheric Age. Nature 359, 123–129. doi:10.1038/359123a0
Straume, E. O., Gaina, C., Medvedev, S., Hochmuth, K., Gohl, K., Whittaker, J. M., et al. (2019). GlobSed: Updated Total Sediment Thickness in the World's Oceans. Geochem. Geophys. Geosyst. 20, 1756–1772. doi:10.1029/2018GC008115
Sutra, E., and Manatschal, G. (2012). How Does the continental Crust Thin in a Hyperextended Rifted Margin? Insights from the Iberia Margin. Geology 40, 139–142. doi:10.1130/G32786.1
Taylor, B., and Goodliffe, A. M. (2004). The West Philippine Basin and the Initiation of Subduction, Revisited. Geophys. Res. Lett. 31, a–n. doi:10.1029/2004GL020136
Van Wijk, J. W., and Blackman, D. K. (2005). Dynamics of continental Rift Propagation: the End-Member Modes. Earth Planet. Sci. Lett. 229, 247–258. doi:10.1016/j.epsl.2004.10.039
Wu, S., Ni, X., and Guo, J. (2007). Balanced Cross Section for Restoration of Tectonic Evolution in the Southwest Okinawa Trough. J. China Univ. Geosciences 18, 1–10. doi:10.1016/S1002-0705(07)60013-2
Wu, Z., Zhang, X., Meng, X., Qi, J., Li, Y., Zhao, W., et al. (2020). A Profile Study of OBS Deep Geological Detect in theEast China Sea. Chin. Sci. Bull. 66, 2728–2744. doi:10.1360/TB-2020-0923
Xu, J., Ben-Avraham, Z., Kelty, T., and Yu, H.-S. (2014). Origin of Marginal Basins of the NW Pacific and Their Plate Tectonic Reconstructions. Earth-Science Rev. 130, 154–196. doi:10.1016/j.earscirev.2013.10.002
Xuan, S., Jin, S., and Chen, Y. (2020). Determination of the Isostatic and Gravity Moho in the East China Sea and its Implications. J. Asian Earth Sci. 187, 104098. doi:10.1016/j.jseaes.2019.104098
Yan, Q., and Shi, X. (2014). Petrologic Perspectives on Tectonic Evolution of a Nascent basin (Okinawa Trough) behind Ryukyu Arc: A Review. Acta Oceanol. Sin. 33, 1–12. doi:10.1007/s13131-014-0400-2
Zhang, L., Luan, X., Zeng, Z., and Liu, H. (2019). Key Parameters of the Structure and Evolution of the Okinawa Trough : Modelling Results Constrained by Heat Flow Observations. Geol. J. 54, 3542–3555. doi:10.1002/gj.3356
Zhang, Y., Ye, J., Kelu, S., Li, L., and Xu, J. (2009). The Burial History and Evolution of Xihu Depression. Geotectonica et Metallogenia 33, 215–223. doi:10.16539/j.ddgzyckx.2009.02.010
Zhou, Z. Y., Liao, Z. T., and Jin, X. C. (2001). Okinawa Trough:The Highest Stage of Continental Tension Rifting in Back-Arc Setting. Mar. Geology. Quat. Geology. (in Chinese) 21, 51–55. doi:10.16562/j.cnki.0256-1492.2001.01.009
Keywords: gravity inversion, density modeling, crustal thickness, Okinawa Trough, multi-stage evolution
Citation: Zhang L and Luan X (2021) Moho Geometry of the Okinawa Trough Based on Gravity Inversion and Its Implications on the Crustal Nature and Tectonic Evolution. Front. Earth Sci. 9:752488. doi: 10.3389/feart.2021.752488
Received: 03 August 2021; Accepted: 23 September 2021;
Published: 03 December 2021.
Edited by:
Tianyao Hao, Institute of Geology and Geophysics, (CAS), ChinaReviewed by:
Luis E. Lara, Servicio Nacional de Geología y Minería de Chile (SERNAGEOMIN), ChileFinnigan Illsley-Kemp, Victoria University of Wellington, New Zealand
Copyright © 2021 Zhang and Luan. This is an open-access article distributed under the terms of the Creative Commons Attribution License (CC BY). The use, distribution or reproduction in other forums is permitted, provided the original author(s) and the copyright owner(s) are credited and that the original publication in this journal is cited, in accordance with accepted academic practice. No use, distribution or reproduction is permitted which does not comply with these terms.
*Correspondence: Xiwu Luan, eGx1YW5AcW5sbS5hYw==