 Letícia Freitas Guimarães
 Amiel Nieto-Torres
 Costanza Bonadonna
 Corine Frischknecht
- 1Geoscience Institute, University of São Paulo, São Paulo, Brazil
- 2Departamento de Vulcanología, Instituto de Geofísica, Universidad Nacional Autónoma de México, Ciudad de Mexico, Mexico
- 3Department of Earth Sciences, University of Geneva, Geneva, Switzerland
Volcanic Risk Ranking (VRR) methods have been developed worldwide as a way to hierarchize the volcanic systems and help target strategies for risk reduction. Such hierarchization is especially important in areas characterized by a large number of active volcanoes but limited resources. This is the case of Latin America, where large populations live nearby almost 300 active volcanoes. Here we assess the volcanic systems in Latin America with at least one eruption in the last 1,000 years based on the VRR strategy presented in a companion paper that accounts for the 4 main risk factors: hazard, exposure, vulnerability and resilience. Our results reveal that, among the 123 volcanoes analyzed, Santiaguito, Tacaná and Fuego are those with the highest score in the 3-factor VRR (H×E×V), while Ecuador, Marchena and Santiago are among the systems with the lowest score. Bárcena and Pinta score zero as there is no exposure. Although vulnerability significantly contributes to the VRR score, hazard and exposure are the main factors that define the risk of Latin American volcanic systems in the proposed 3-factor VRR, while resilience contributes to its reduction in the proposed 4-factor VRR strategy. In this regard, Arenal, Copahue, Villarrica, Ubinas, Irazú and Poás are the systems with the highest number of risk reduction strategies in place. Atitlán, Almolonga and Tecuamburro are the volcanic systems with the highest score in the 4-factor VRR [(H×E×V)/(Res+1)], combining moderate hazard, exposure and vulnerability and low resilience; Bárcena, Pinta, Ecuador, Marchena and Santiago receive the lowest scores due to no or low exposure. Santiaguito, Tacaná, El Chichón and Ceboruco are characterized by high scores in the 3-factor VRR and also stand out as some of those with few risk reduction strategies implemented; thus they have intermediate to high scores also in the 4-factor VRR. Recognizing that hazard is difficult to mitigate and reducing exposure may depend on hardly feasible relocation of infrastructure and already established communities, we emphasize that measures to reduce vulnerability and increase resilience should be promoted (e.g., creating redundancy/accessibility to infrastructure, carrying out risk assessment studies, implementing early warning systems, developing emergency plans and promoting educational activities).
Introduction
In the past decade, the number of people living within 100 km of active volcanoes surpassed the astonishing mark of 1 billion people, which means that around 14.3% of the entire world population is somehow exposed to volcanic hazards (Freire et al., 2019). Although there is a consensus in the scientific community that global volcanic activity is not increasing, the increasing population living in the vicinities of volcanoes, whose growth rate has exceeded the average growth rate of the global population since 1975 (Freire et al., 2019), requires a better understanding of volcanic processes, and greater effectiveness of volcanic risk assessment, communication and management.
In natural disaster research, risk can be defined as the result of the interaction of a given hazard (H) and the exposed elements (E), which are characterized by various dimensions of vulnerability (V) and levels of resilience (R) or, in other words, the combination of all losses potentially resulting from a particular natural disaster (UNDRO, 1991; UNISDR, 2004). The hazard factor concerns the characteristics of the natural phenomenon which, regarding volcanic events, may include a variety of products (e.g. tephra fallout, pyroclastic density currents - PDCs, lava flows, gas, lahars). The hazard assessment of a particular system must consider the occurrence frequency, spatial extension, and intensity of all potential hazards (e.g. Smith, 2013). The exposure factor is related to the number and distribution of people and assets located in a dangerous area, while their propensity to damage in case of a hazardous event is expressed by the vulnerability factor. The vulnerability is a dynamic concept that relies on the set of physical, social, economic and environmental characteristics of a system or a community that increases the associated susceptibility to the impact of a natural hazard (UNISDR 2004; UNISDR, 2009). While these three factors contribute to the risk, the resilience acts to reduce it, since it corresponds to the system’s ability to adapt to changes, overcome disturbances and maintain its functionality either by preserving pre-disaster conditions or tolerating and adapting to larger changes (e.g., Gunderson and Holling, 2002; Gaillard, 2007). Thus, the assessment of volcanic risk is complex as it depends on the analysis of multiple primary (e.g., tephra fallout, PDCs, lava flows) and secondary (e.g., lahars, tsunamis) hazards acting over various temporal and spatial scales (e.g., Connor et al., 2015), of the vulnerability of the exposed elements as well as of the resilience of each system to each of these hazards. Hence, a complete analysis of each factor is fundamental for an overall risk assessment (Aspinall and Blong, 2015). In regions characterized by a large number of active volcanoes such as Latin America and Indonesia, risk assessment of all systems might be impractical. In such a case, a risk ranking strategy that includes all main risk factors helps prioritize the volcanic systems that most require a formal risk assessment and/or the implementation of other risk reduction strategies (e.g., mitigation measures, early warning systems, emergency plans).
Ranking strategies of volcanic risk have been developed worldwide during the last decades with the purpose of identifying the active volcanic systems that represent the greatest threat either globally or locally and, therefore, prioritizing and targeting risk reduction strategies (e.g., Bailey et al., 1983; Lowenstein and Talai, 1984; Uhira, 2003; Magill and Blong, 2005a, Magill and Blong, 2005b; Ewert et al., 2005, Ewert., 2007, Ewert et al., 2018; Lara et al., 2006; Palma et al., 2009; Pereña et al., 2015; Scandone et al., 2016; Macedo et al., 2016; Santamaría and Bernard, 2018; Elissondo et al., 2016; Elissondo et al., 2017); a detailed review is presented in the companion paper (Nieto-Torres et al., 2021). Such rankings are especially useful in regions characterized by a large number of active volcanoes but limited resources (e.g., Latin America), enhancing the need of hierarchization and prioritization of investments. Additionally, the possibility of rapid update of the ranking (when new detailed information is made available) ensures a dynamic assessment of the risk in relation to changes of hazard, exposure and vulnerability and an adaptation of mitigation measures, allowing the reallocation of investments if and when needed.
The existing ranking strategies have already allowed significant advances in the knowledge and hierarchization of volcanic threats (e.g., updates in the American ranking–Ewert et al., 2005; Ewert et al., 2018; Ewert 2007–and in the Chilean ranking–Lara et al., 2006; SERNAGEOMIN 2020). Nonetheless, these rankings do not integrate information on vulnerability and resilience, which are key to a comprehensive characterization of the overall risk posed by volcanic systems and the identification of effective mitigation and response measures. Considering that risk reduction is the ultimate goal when working with natural hazards and their threats, it must be taken into account that although hazard impact can be mitigated, the volcanic event itself cannot be easily controlled or modified, and the exposure cannot be easily reduced by relocating infrastructure and established communities, which could be associated with large economic costs and social distress (e.g., Bowman and Henquinet, 2015; Barclay et al., 2019; De Natale et al., 2020; Iuchi and Matter, 2020). As a consequence, changes in hazard and exposure factors are hardly feasible. On the other hand, reducing vulnerability and increasing resilience are expected to be more effective and should be the first targets in risk reduction strategies. As a result, any risk ranking that aims at prioritizing systems that require the implementation of risk reduction strategies should also include vulnerability and resilience parameters.
In this context, this manuscript, together with the companion paper (Nieto-Torres et al., 2021), aim at developing an inclusive Volcanic Risk Ranking (VRR) method that accounts for key parameters and elements of all the four main risk factors (hazard, exposure, vulnerability and resilience). The first paper (Nieto-Torres et al., 2021) presents the rationale of the proposed method in detail, while this work discusses its application to the volcanic systems in Latin America with activity reported for the last 1,000 years.
The Latin America region represents a great study opportunity; hosting an extensive volcanic arc on its western edge, the continent is characterized by a large number of active volcanoes (almost 300 systems with Holocene activity) coupled with large populations exposed to the associated hazards (Figure 1). Around 10% of the South American population and 70% of the population of México and Central America live within 100 km of an active volcano (Brown et al., 2015; Freire et al., 2019). The volcanism in this region is marked by compositional and morphological diversity (from stratovolcanoes to monogenetic volcanic fields and lava domes), as well as by the variation and alternation of eruptive styles. A dozen large events (VEI ≥5) have occurred in the region in the past 1,000 years (Figure 2) which, together with more recent events of lesser size, demonstrate the potentially devastating consequences of volcanic activity on modern societies (e.g., Chaitén [2008–2010], Arenal [2010], Calbuco [2015], Colima [2017], Sabancaya [2016–2018], Masaya [2018], Fuego [2018]). In particular, the 1985 eruption of Nevado del Ruiz (Colombia), El Chichón in 1982 (México), Santa María (Guatemala) and Mt Pelée (Martinique–here mentioned due to its location and consequent genetic relation to the studied systems) in 1902 are noteworthy since they account for about 3/4 of the deaths related to volcanic events in the 20th century and are responsible for Latin America’s second place in the ranking of regions with the highest volcanic lethality (Tilling, 2009; Delgado-Granados et al., 2015).
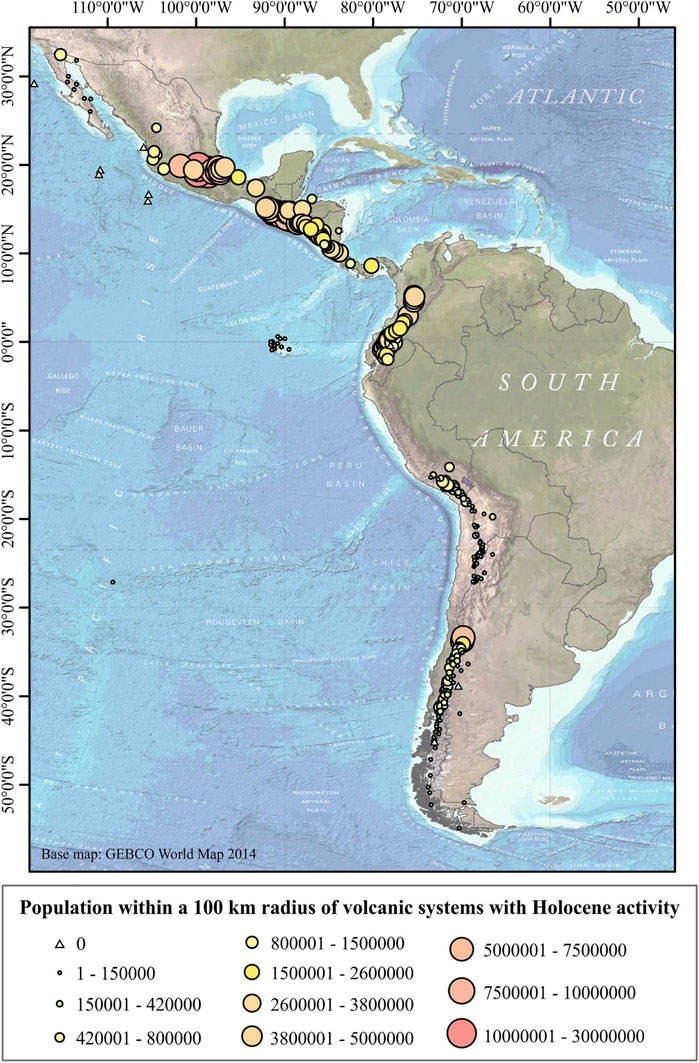
FIGURE 1. Holocene Latin America volcanoes and coupled population considering a 100 km radius threshold. Data were obtained from the Global Volcanism Program (GVP) database (Global Volcanism Program, 2013). Basemap from www.gebco.net.
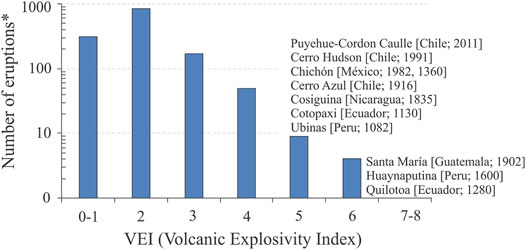
FIGURE 2. Number of volcanic eruptions sorted by VEI in the past 1,000 years. Data compiled from Global Volcanism Program (GVP) database (https://volcano.si.edu), *considering, for all VEIs, both confirmed and uncertain events. The large VEI events (VEI 5 and 6) are displayed in the diagram according to their VEI.
Regardless of the shared official language, the socio-cultural affinity, the increased knowledge of local volcanic systems and the increasing number of volcano observatories and of volcanoes monitored in the region, the large number of volcanoes on borders, the scarcity of economic resources, the different social vulnerabilities faced by different countries and the lack of systematized and integrated information still prevent the risk associated with the volcanism in the Latin American region to be fully assessed (Delgado-Granados et al., 2015). We expect the outcomes of this work to contribute to the optimization of available resources and to the development of strategic lines of action for Disaster Risk Reduction in the region.
Brief Geological Context
The volcanism in Latin America is related to the Ring of Fire, also called the circum-Pacific Belt, a 40,000 km long horseshoe-shaped active belt defined by the tectonic plates’ boundaries that fringes the Pacific Ocean. Around 75% of the Earth’s volcanism and 90% of Earth’s earthquakes occur along its path.
In México, most of the active volcanoes are located along the Transmexican Volcanic Belt, a Miocene-Holocene continental volcanic arc nearly E-W trended, around 1,000 km in length, extending from the Mexican Pacific coast to the Gulf of México, and of irregular width varying between 80 and 230 km (Gómez-Tuena et al., 2007). This volcanic arc transversely overlaps NW-SE-trended mountain ranges such as the Sierra de California, Sierra Madre Occidental, Sierra Madre de Chiapas and the Chiapaneco Volcanic Arc, which also encompass some volcanic systems with Holocene activity (either confirmed or estimated) (Ortega-Gutiérrez et al., 1992; Macías, 2005; Gómez-Tuena et al., 2007; Mora et al., 2007). The Transmexican Volcanic Belt results from the interaction of the Pacific and Cocos plates with the North American and Caribbean plates since the Cretaceous. The migration and consequent overlap of the magmatic arcs represents the response to variations in the interaction (direction and angle of the subduction slab) between these plates (McDowell and Clabaugh, 1979; Damon et al., 1981; Gómez-Tuena et al., 2007; Cadoux et al., 2011; Mora et al., 2012).
The Central American volcanic front (CAVF), a result of the subduction of the Cocos plate beneath the Caribbean plate since the Early Miocene, is around 1,100 km in length. It extends through the whole isthmus, from the México-Guatemala border to Panamá, with a volcanic gap around 200 km long from the SE Costal Rica to the W Panamá. The volcanic range is composed of 50 major volcanic centers and hundreds of other small vents aligned along 7 main segments more or less parallel to the coast (Stoiber and Carr, 1973; Alvarado et al., 2012). The segments’ boundaries are marked by the offset of the chain of active volcanoes; minor alignments with small active volcanic vents may occur transversely to the main chain (Stoiber and Carr, 1973). Local tectonic trends control the volcanic systems’ dynamics and the systems with larger magnitude events or more continuous activity are preferentially located near the segments’ boundaries (Stoiber and Carr, 1973; Alvarado et al., 2012). At least 26 volcanic systems are considered active, i.e., have confirmed eruptive events in the last 10,000 years.
In South America, the Cordillera de Los Andes represents one of the highest and largest (ca. 8,000 km length) subaerial mountain ranges in the planet, whose formation began during the late-Paleozoic (Tilling, 2009). Since the late-Triassic the region has also hosted the largest, although discontinuous, continental volcanic arc whose magmatism is related to the subduction of the Nazca and Antarctica Plates beneath the South America Plate. The volcanic arc can be divided into four segments: the Northern Volcanic Zone (NVZ) from Colombia to Ecuador, the Central Volcanic Zone (CVZ) along southern Peru and Northern Chile, the Southern Volcanic Zone (SVZ) extending from central do southern Chile and finally the Austral Volcanic Zone (AVZ), along the southernmost region of the continent. These segments are separated from each other by volcanically inactive gaps that may be a result of changes in the slabs dip (Barazangi and Isacks, 1976; Pilger, 1984).
The Latin America volcanic arc host around 21% of the volcanoes classified as active during the Holocene by the Global Volcanism Program (GVP) from the Smithsonian Institution (GVP Holocene Volcano List, 2013), and 8 of the 20 top countries with the highest overall volcanic threat defined by Brown et al. (2015) based on the number of active volcanoes, the exposed populations and the average hazard index. The volcanism comprises a wide range of compositions, from basalts to rhyolites, with prevailing intermediate compositions and is mainly characterized by high, steep-sided volcanoes, commonly capped by ice or snow.
According to the GVP database, 123 volcanoes have eruptions reported during the last 1,000 years in Latin America, of which 13 are located in México (1 on the border with Guatemala), 7 in Guatemala, 5 in El Salvador, 10 in Nicaragua, 6 in Costa Rica, 1 in Panamá, 10 in Colombia (1 on the border with Ecuador), 20 in Ecuador, 8 in Peru, 41 in Chile (2 and 5 are located on the borders with Bolivia and Argentina, respectively) and 2 in Argentina (Figure 3); the majority of them (∼67%) are stratovolcanoes. The shifts between eruptive styles, common in the volcanoes of the region, may bring, however, some complexity to the hazard assessment.
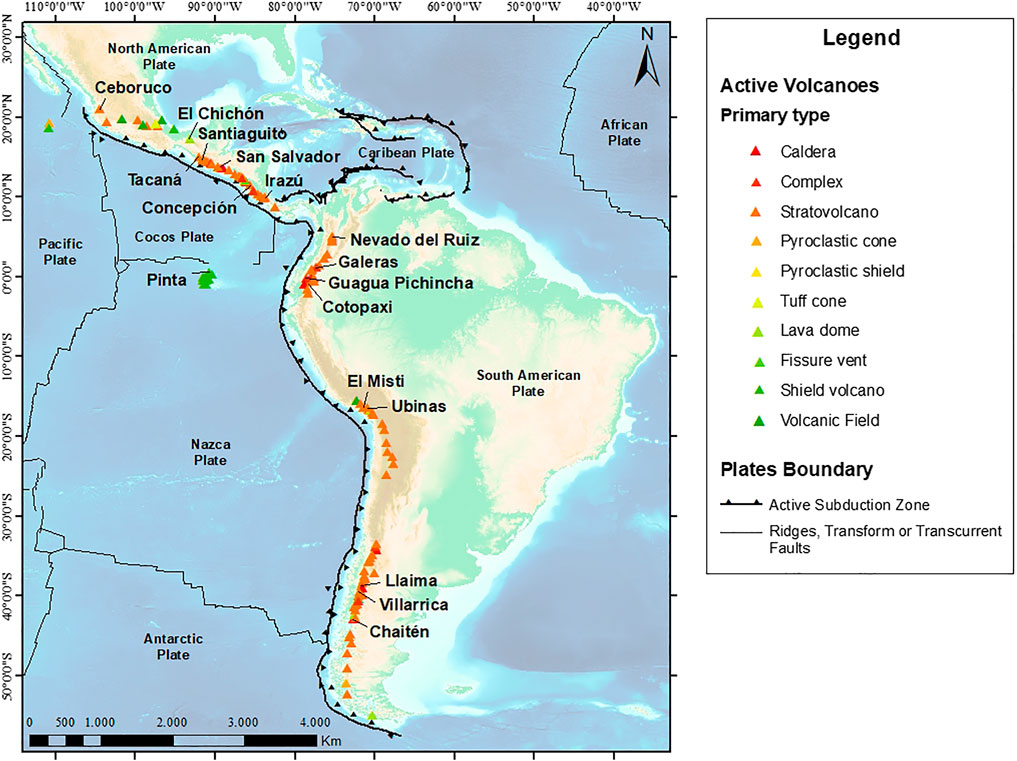
FIGURE 3. Location of the studied volcanoes in Latin America, with recorded activity in the past 1,000 years, classified according to their primary type (data from Global Volcanism Program (GVP) database, Smithsonian Institution, https://volcano.si.edu). The volcanic systems with highest VRR (1) scores of each country and the volcanic system with lowest VRR score (Pinta) are indicated. Base map reproduced from the GEBCO global bathymetric grid 2021, www.gebco.net.
Methods
The VRR method described in the companion paper by Nieto-Torres et al. (2021) and applied here to the Latin America volcanic systems with activity in the last 1,000 years builds on the parameters proposed by Ewert et al. (2005), Ewert (2007), Ewert et al. (2018), but also includes vulnerability and resilience factors. We consider two ranking strategies in order to assess the risk:
1) Assessment of the contribution of the factors that build the risk (a 3-factor VRR from now on referred to as VRR (1)):
2) Assessment of the effect of resilience (a 4-factor VRR, from now on referred to as VRR (2)):
where H, E, V and Res correspond to the sum of all parameters for hazard (H), exposure (E) vulnerability (V) and resilience (Res) factors, respectively. A brief explanation of each factor is given below and the list of all parameters and elements analyzed in each factor is presented in Table 1. Here we distinguish among factors (i.e., H, E, V and Res), parameters (i.e., aspects of each factor) and elements (i.e., attributes of each parameter). After all parameters of each factor have been added, each factor is normalized to 10 in order to guarantee the same weight for all factors considered in both equations. The normalization at a given volcano for H, E and V is based on the following formula:
while for Res it is based on:
where the maximum score is 19, 48, 95 and 18 for hazard, exposure, vulnerability and resilience, respectively. As discussed in Nieto-Torres et al. (2021), in order to avoid a zero denominator that would be associated with systems without any prevention/mitigation/response measures implemented, a value + 1 is added to the resilience score of all volcanic systems before normalization. The maximum scores or the VRR (1) represent the highest magnitude and frequency of all hazards, the largest amount of all exposed elements and their highest vulnerability that would lead to the maximum possible damage; in this way, the final score may vary between 0 (when there is no hazard or exposed elements) and 1,000 (maximum value of H×E×V). For the VRR (2), the maximum resilience theoretical value represents the most resilient system, where optimal mitigation and response measures have been implemented. Thus, as resilience represents the capacity of a community to face and overcome a hazardous event with minimum possible impact, the VRR (2) score will be given by the quotient between the factors that increase the risk and the factor that reduces the risk, varying between 0 and 100.
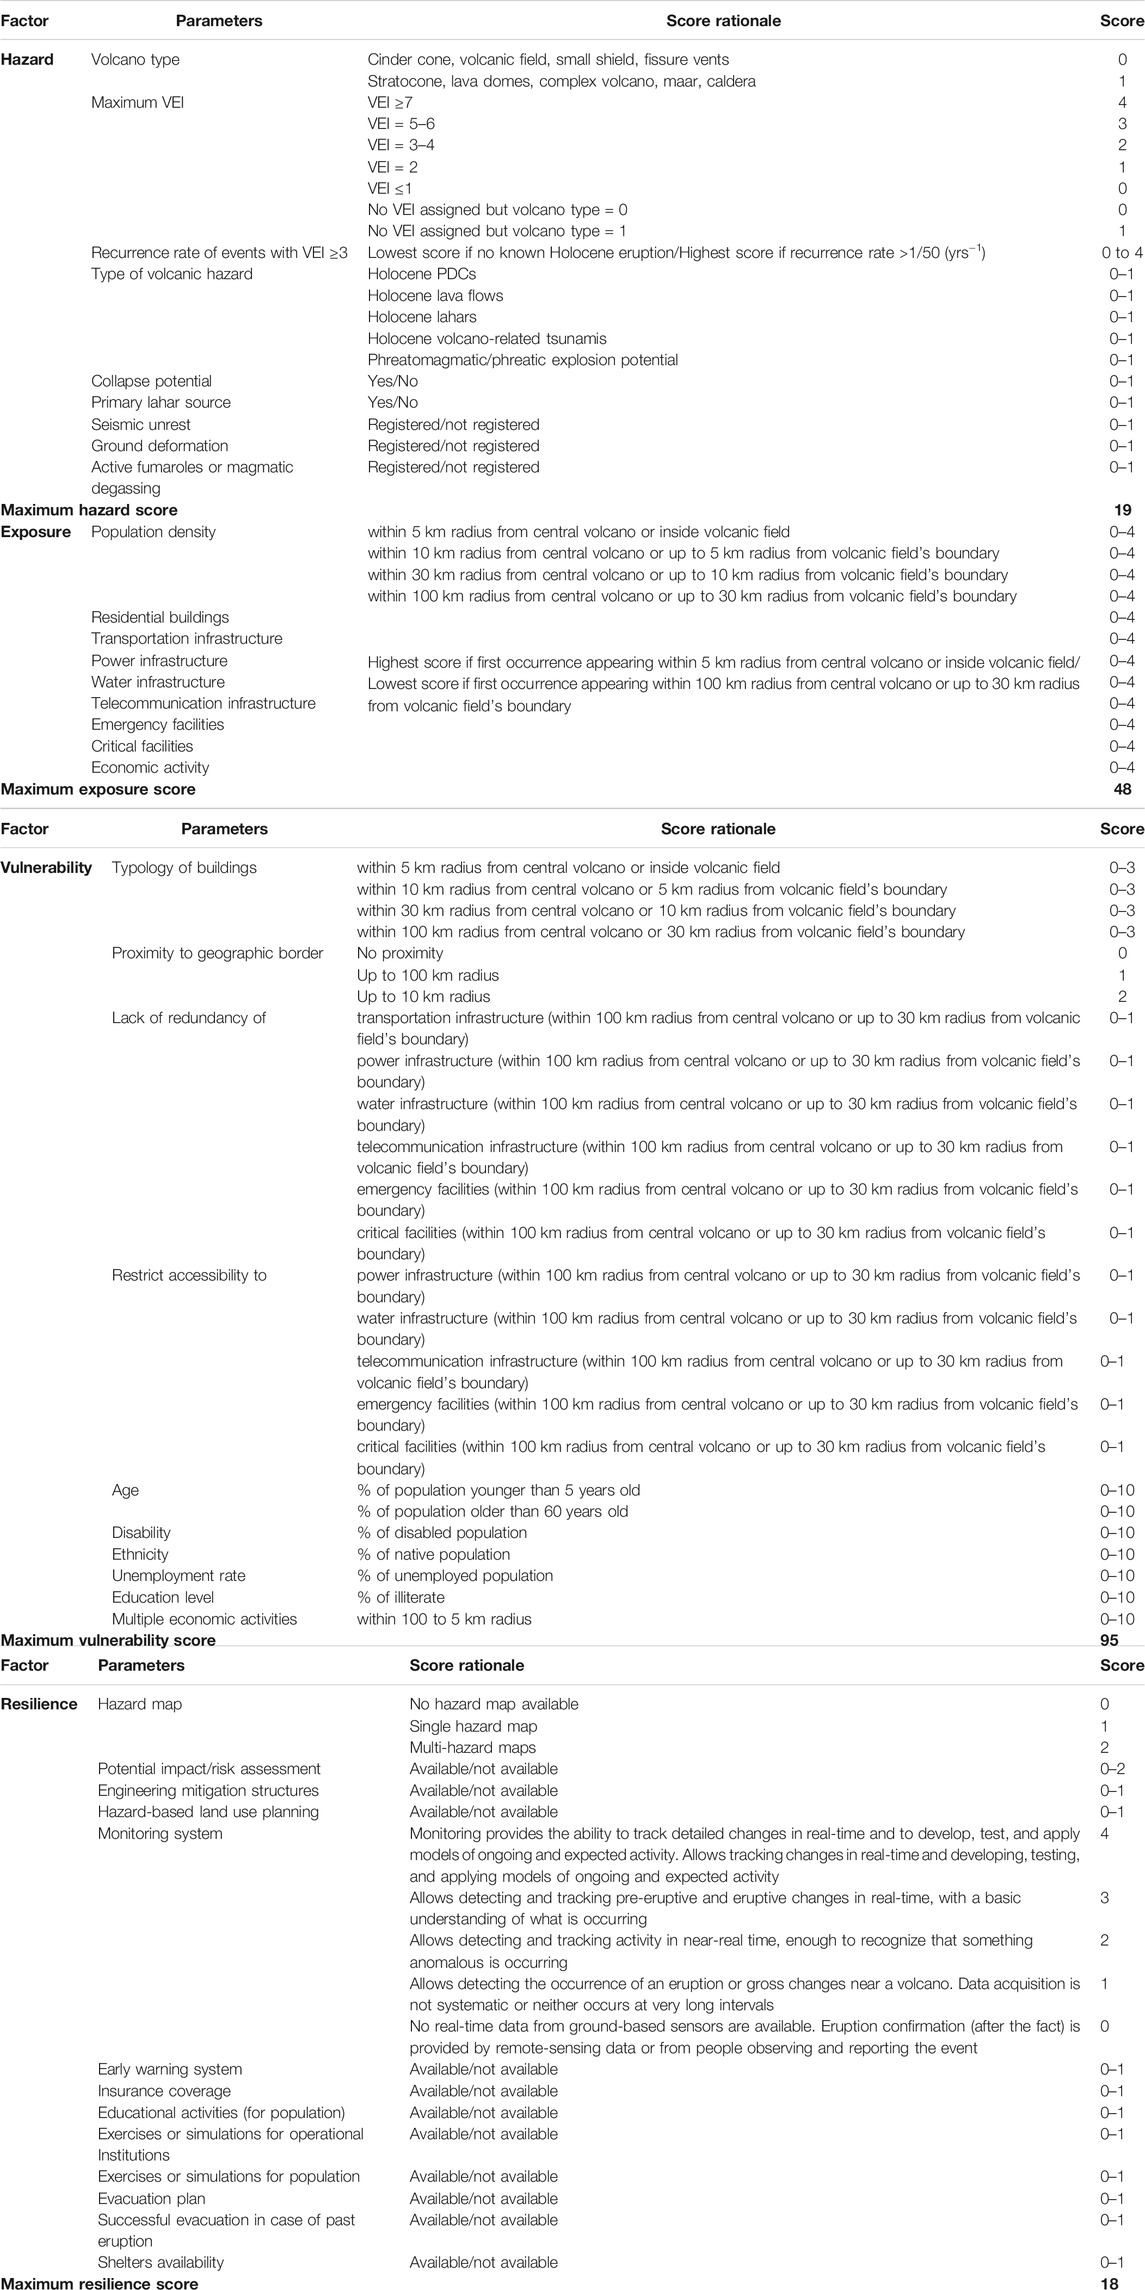
TABLE 1. List of parameters and elements analyzed for each factor (hazard, exposure, vulnerability and resilience) and their respective score ranges.
It is important to stress that a risk ranking is not a hazard or a risk assessment. As a result, the hazard parameters and elements considered in the proposed method relate exclusively to volcanological features and to the potential phenomena associated with a certain system; however, they do not include probabilistic assessments. Systems that present multiple hazards are assigned higher scores, meaning higher hazard. In total, 9 hazard parameters (Table 1) are considered, of which 4 correspond to volcanic products or unrest phenomena, whose score varies between 0 (non-occurrence) and 1 (occurrence). The parameters and their score ranges are (between square brackets): volcano type [0–1], maximum VEI [0–4], recurrence rate [0–4], type of volcanic hazard [0–5 depending on the occurrence of Holocene PDCs, lava flows, lahars, volcano-related tsunami and the hydrothermal explosion potential], sector collapse potential [0–1], existence of primary lahar source [0–1], seismic unrest [0–1], ground deformation [0–1], active fumarole or magmatic degassing [0–1]. The assessment of the various parameters considered here relies primarily on the GVP volcano database, being modified or updated when necessary with local research institution data (Table 2). It is important to highlight that, although the present work evaluates only volcanic systems with confirmed eruptions in the last 1,000 years, the analysis considers the entire Holocene activity record.
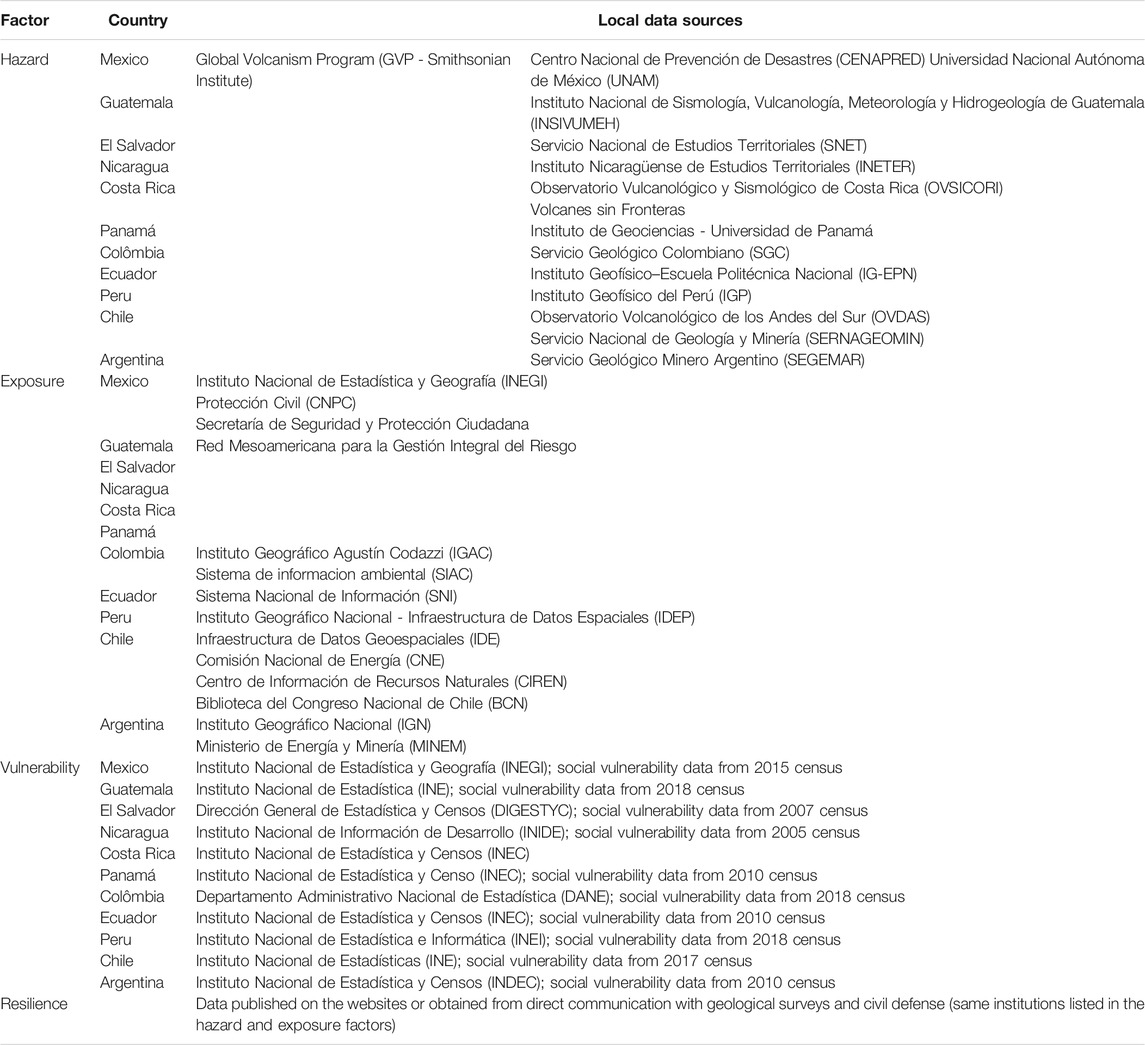
TABLE 2. List of local institutions, separated by country, used for data acquisition on hazard, exposure, vulnerability and resilience factors.
In terms of exposure, the 9 parameters (Table 1) investigated here comprise data on the population, residential buildings, transportation, power, water and telecommunication infrastructure, emergency and critical facilities as well as economic activities exposed to the hazard within four radii: 5, 10, 30 and 100 km. These radii cover the areas most susceptible to the impact of the different types of hazards considered in this study and are in agreement with the limits used by the GVP for population data. In case of volcanic fields, the exposure is analyzed for assets inside the volcanic field and up to 5, 10 and 30 km from the field’s boundary, which is defined by the connection of the outermost volcanic edifices that comprise it. Population data is here evaluated based on density (inhab/km2), i.e. the ratio between the number of inhabitants (according to the GVP database, which is based on the LandScan produced by the Oak Ridge National Laboratory) and the area, considering the whole surface area of each of the radius thresholds previously defined. As a result, volcanic systems without exposed population score 0, while volcanic systems with population density higher than 0 and lower than 1 inhab/km2 score 1, with population density between 1 and 10 inhab/km2 score 2, between 10 and 100 inhab/km2 score 3 and above 100 inhab/km2 score 4 (Table 1). This density-based score system was chosen considering that the population density concept is more easily and quickly understood, simplifying the communication with stakeholders. While comparable with the logarithmic scale of previous rankings (e.g., Ewert et al., 2005; Lara et al., 2006; Ewert., 2007; Pereña et al., 2015; Elissondo et al., 2016, 2017), it allows fitting maximum values that facilitate the normalization of the final score and the comparison between different databases. A similar scoring system rationale is used for residential buildings and critical infrastructures, with values ranging from 1 (when the first occurrence appears within 100 km radius from a central volcano or 30 km from the border of a volcanic field) to 4 (first occurrence within the 5 km radius threshold and, in the case of volcanic fields, inside the field). The critical infrastructure considered in this work encompass: 1) transportation, considering either point or linear infrastructure such as airports, air routes, harbors, and primary road and rail networks; 2) power infrastructure, including power generation (power plants), transmission and distribution lines; 3) water supply and wastewater infrastructure; 4) telecommunication; 5) emergency facilities (e.g., hospitals, fire brigades, police offices and military bases) 6) critical facilities (e.g., government offices, educational and scientific institutions, museums, and recreation sites), and 7) economic activities (e.g., agriculture, mining, factories, tourism) (Table 1). The data on the elements at risk were obtained from a combination of sources and databases (Table 3), including the GVP from the Smithsonian Institution, the LandScan produced by the Oak Ridge National Laboratory, local Institutions (Table 2), the Humanitarian OpenStreet Map, the United Nations divisions (e.g., HDX-OCHA and UNESCO), the Food and Agriculture Organization (FAO) and the World Bank database. It must be noted that the assessment of volcanic systems located on geographic borders calculate a unique score that considers the exposed elements of the countries (or administrative units) encompassed by each of the radius thresholds. In addition, a hierarchy of the emergency and critical facilities (e.g., hospitals, schools, fire stations, etc.) was not set, i.e., the existence of at least one asset from any of the considered categories is sufficient for scoring (for example, non-existence or lack of data of government offices but existence of schools results in a score).
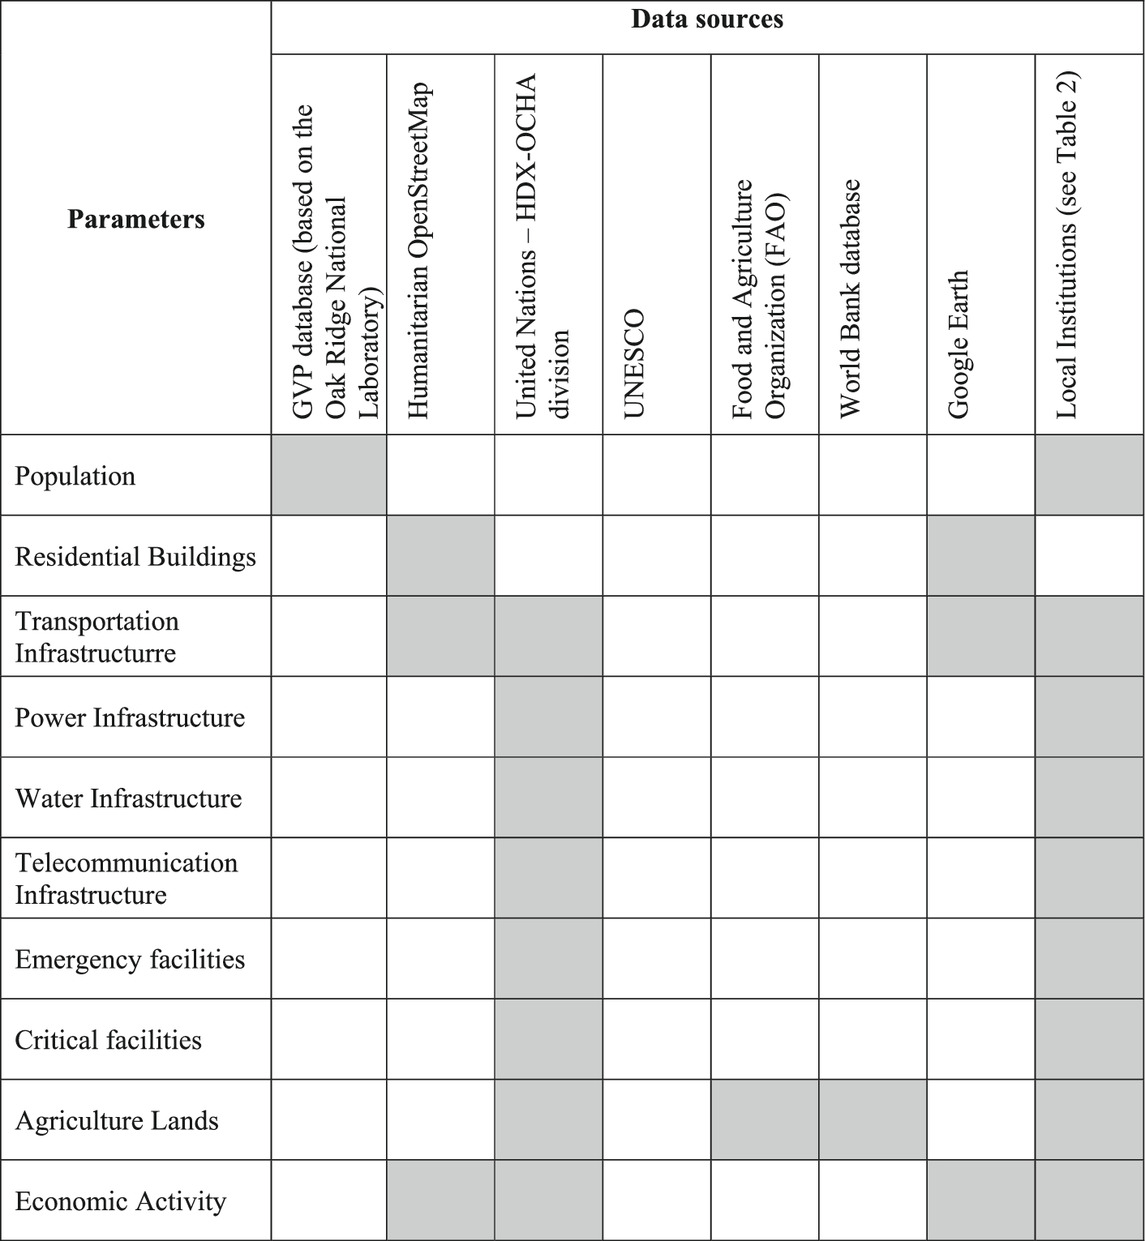
TABLE 3. List of the sources used for data acquisition on the parameters of the exposure and vulnerability factors.
A certain number of vulnerability parameters are considered in this work, encompassing four dimensions: 1) physical vulnerability, which describes the fragility of residential buildings and infrastructures, 2) systemic vulnerability, which accounts for the possibility of cascading propagation of impact through a system and for the interdependency of infrastructures and systems, 3) social vulnerability, assessed here through the indicators of population age, disability, ethnicity, unemployment rate and education level, and 4) economic vulnerability, based on the existence of multiple economic activity within the analyzed radius thresholds. In total, 10 parameters were taken into account for the vulnerability factor (Table 1). The physical vulnerability analysis is based on the predominant (more than 50%) typology, or the material used of residential buildings. For Mexican and Central American systems, the analysis considered the type of materials used (wood scores 3, masonry scores 2 and reinforced concrete scores 1) obtained from Google Street View observations combined with the Open Street Map database, while for the South American systems, the analysis was based on the latest versions of local census surveys, which provided the typology of residential buildings, according to local terminology. “Choza, covacha, rancho, cabaña, vivienda móvil, vivienda indígena o étnica, local no construído para habitación humana, vivienda impovisada, otros tipos de vivenda” were taken as most fragile buildings, resulting in higher scores [3], followed by progressively less fragile structures as “mediaguas and casillas” [2] and “cuarto, pieza, casa, vivienda en quinta, vivienda en casa de vecinidad, vila, departamento” [1]. The systemic vulnerability analysis encompasses the proximity of the volcanic system to a geographic border, the lack of redundancy and restricted accessibility to the critical infrastructure identified in the exposure analysis. In particular, by considering the proximity to geographic borders as a vulnerability factor parameter, our strategy addresses the challenges faced by the border systems, such as the direct effects of tephra fallout, as in the already mentioned case of Chile and Argentina, as well as the closure of customs posts, roads and airways, etc. Here, 2 points are scored if the volcanic system is located within 10 km from the border between two or more countries and 1 point if within 100 km. Regarding the lack of redundancy and restricted accessibility, since these conditions in larger areas increase the vulnerability of the systems, score 1 is given in case of non-redundancy and restricted accessibility within a 100 km radius from a central volcano or up to 30 km from a volcanic field’s boundary; if the critical infrastructure is redundant and most of them easily accessed, no scores are counted. The social vulnerability, a complex concept that relies on the idea that local social conditions and some characteristics of a person influence their ability to anticipate, manage, resist and recover from the damage caused by a hazard (Wisner et al., 2004), is assessed through various indicators: age (divided into two groups considered most vulnerable, i.e., children <5 years old and elderly ≥60 years old), disability, ethnicity, unemployment rate and education level (based on the proportion of illiterate population) (e.g., Wisner et al., 2004; Aceves-Quesada et al., 2007; Cutter., 2013). The social indicators were counted as the arithmetic average of data for each administrative unit (province, region or department) inside the 100 km radius threshold; with scores ranging from 0 to 10, where 10 corresponds to 100% of the population in the considered condition. The larger the fraction of population in the considered condition, the higher the vulnerability of the system. This analysis was based on the latest versions of population census data from local institutions (Table 2). Finally, the analysis of the economic vulnerability considers the existence of multiple economic activities, applying a regressive scoring ranging from 4 (if single economic activity within a 5 km radius from a central volcano or inside a volcanic field) to 1 (if single economic activity within a 100 km radius from a central volcano or 30 km radius from a volcanic field’s boundary) and was based on multiple sources of data such as local institutions, the Humanitarian OpenStreet Map and the United Nations divisions (e.g., OCHA). As was the case for the exposure parameters, the assessment of the volcanic systems on borders set a unique score considering the vulnerabilities of the countries (or administrative units) encompassed within each of the radius thresholds.
The analysis of the resilience factor considers the existence of a series of mitigation and response measures that anticipates the threat and enables disaster management, reducing the likelihood of injury, death, and property damage (total of 13 parameters analyzed; Table 1). These measures are divided into existing strategies and tools to reduce risk, including hazard maps, impact/risk assessment studies, engineering mitigation structures, hazard-based land use planning, capacity of monitoring system, early warning systems and insurance coverage, and elements for preparedness, such as educational activities for the population, exercises and simulations for operational institutions (involved in emergency management, e.g., civil protection) and exercises and simulations for the population. Each existing element adds 1 to the score of the system, with the exception of the hazard maps that score 1 in case of single hazard map or 2 in case of multiple hazard map (or hazard maps with multiple hazards), the risk assessment studies whose availability also scores 2 and the monitoring system, whose score can vary from 4 (in case of full real time monitoring) to 0 (absence of monitoring). Finally, the response measures consider the existence of actions to be implemented during a crisis; a score 1 is attributed in case of existence of evacuation plan, occurrence of successful evacuation during past eruptions and availability of shelters. Such data were obtained from public databases from or direct request to the responsible institutions (geological surveys, volcanic observatories, and civil defense).
Finally, all the data were integrated and processed using the software ArcGIS 10.1. For more details on all the analyzed elements and their scoring system, as well as the sensitivity analyses that supports the choice of the risk equation, the reader is referred to the companion paper by Nieto-Torres et al. (2021).
Results
Our analysis focused on the Latin American volcanoes that had eruptions in the last 1,000 years and the results are presented together within the regional context for a general analysis of the Latin America VRR. Results and diagrams for comparison with previous rankings (when available), can be found in the supplementary materials (Supplementary Material 2–8) divided by country, with the exception of Argentinean and Chilean volcanoes that are presented together. The exception for those volcanoes in the southern portion of the continent is due to the fact that Argentina and Chile share a large part of the region’s volcanic systems and their hazards. Indeed, the most active volcanoes in South America are located on geographic borders; of the 81 South American volcanoes analyzed in this work, 10 are located on or very close to (<10 km) the Argentina-Chile border. In addition, considering that Chile is a N-S elongated country with volcanic systems located closer to its eastern portion, the maximum radius threshold applied in our analysis (100 km) includes areas of neighboring countries, especially Argentina which, due to the prevailing wind conditions in the region (towards E), is significantly affected by tephra fallout and volcanic gas generated by Chilean eruptions.
The most hazardous volcanoes are mainly concentrated in the northern (Ecuador, Costa Rica, Guatemala, México and El Salvador) and southern (Chile-Argentina) regions and correspond to (in descending order of hazard): Tungurahua (Ecuador), Santiaguito (Guatemala), Cotopaxi (Ecuador), Irazú (Costa Rica), Reventador (Ecuador), Popocatépetl (México), Tacaná (México), Fuego (Guatemala), Santa Ana (El Salvador), Rincón de la Vieja (Costa Rica), Cayambe (Ecuador), Guagua Pichincha (Ecuador), Sangay (Ecuador), Cerro Azul-Quizapu (Chile-Argentina), Cerro Hudson (Chile-Argentina), Llaima (Chile-Argentina) and Villarrica (Chile-Argentina) (Supplementary Material 1, Figure 4). Most of the volcanoes with the highest score are also noted for their higher eruptive recurrence.
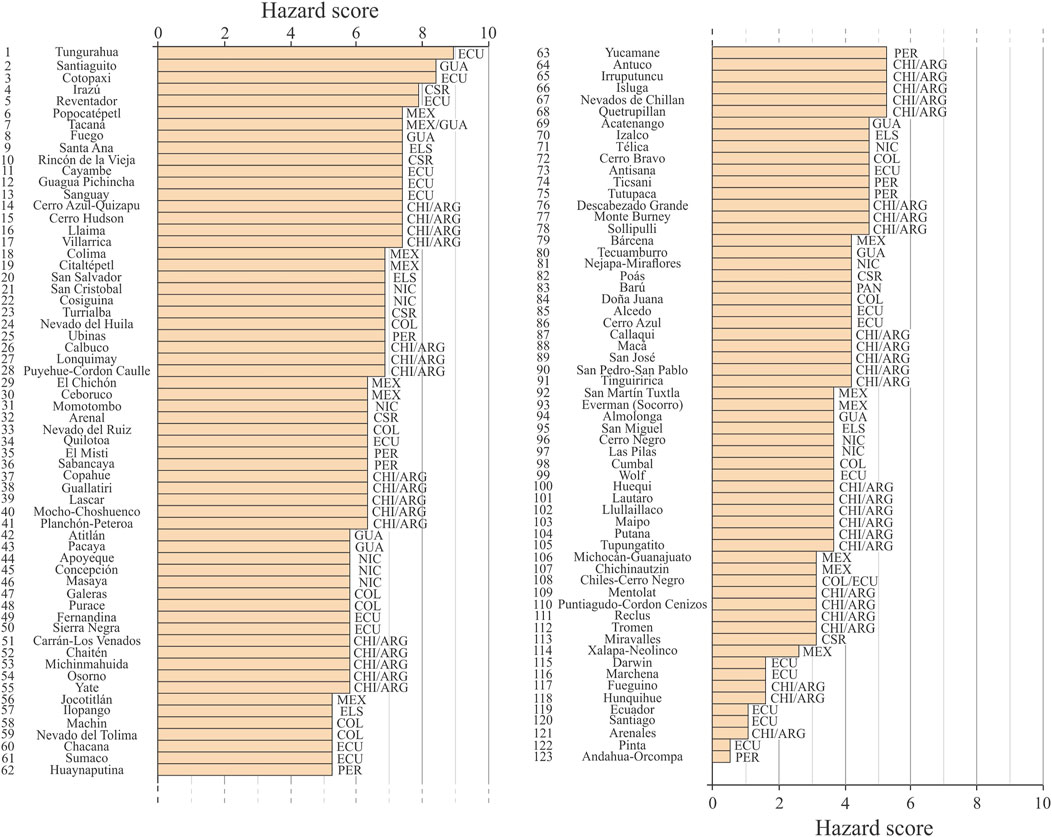
FIGURE 4. Latin America volcanic systems with recorded activity in the past 1,000 years assessed based on their hazard score. CHI/ARG: Chile/Argentina; COL: Colombia; CSR: Costa Rica; ECU: Ecuador; ELS: El Salvador; GUA: Guatemala; MEX: México; NIC: Nicaragua; PER: Peru.
In terms of exposure, the volcanic systems from the northern region stand out, especially in Central America (El Salvador, Nicaragua, Guatemala and Costa Rica), in addition to México, Ecuador and Peru, some of which are among the most hazardous already identified (e.g., Santiaguito, Fuego, Irazú and Guagua Pichincha). The highest rated volcanoes are, in decreasing order: San Salvador (El Salvador), Ilopango (El Salvador), Apoyeque (Nicaragua), Almolonga (Guatemala), Andahua-Orcompampa (Peru), Nejapa-Miraflores (Nicaragua), Jocotitlán (México), Santiaguito (Guatemala), Concepción (Nicaragua), Guagua Pichincha (Ecuador), San Miguel (El Salvador), Fuego (Guatemala), Masaya (Nicaragua), Chacana (Ecuador), Irazú (Costa Rica) and Galeras (Colombia) (Supplementary Material 1, Figure 5). It is worth mentioning the high population density of the volcanic systems in these regions (even in proximal areas); such high population densities in proximal areas are characteristic of Central American countries and Colombia, where most of the volcanic systems have high scores (i.e., 3 to 4 points) for the smallest radius thresholds (5 to 10 km).
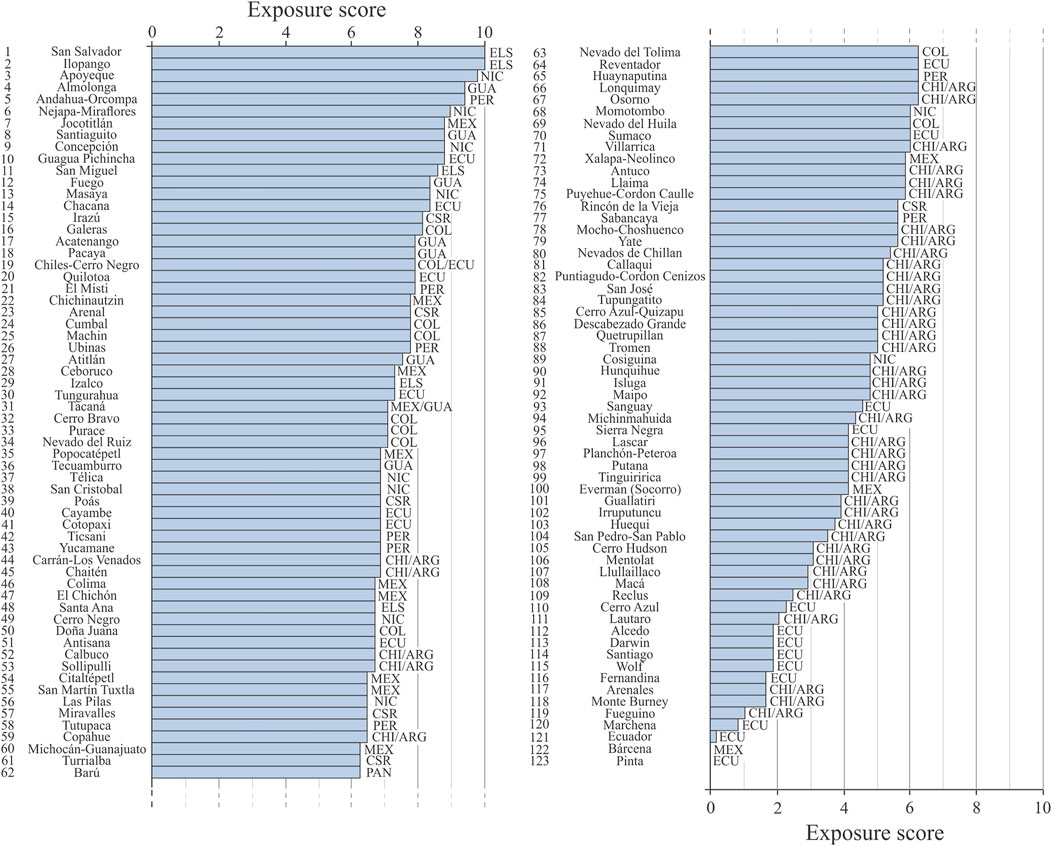
FIGURE 5. Latin America volcanic systems with recorded activity in the past 1,000 years assessed based on their exposure score. CHI/ARG: Chile/Argentina; COL: Colombia; CSR: Costa Rica; ECU: Ecuador; ELS: El Salvador; GUA: Guatemala; MEX: México; NIC: Nicaragua; PER: Peru.
The vulnerability analysis may be, in some extent, biased by the local lack of data, especially in relation to critical infrastructure (i.e., telecommunication infrastructure for Colombia, Peru and Chile). In any case, the most vulnerable areas are concentrated mainly in the southern region (Chile-Argentina), although some areas in Ecuador and México are also among the most vulnerable. The highest scores are mainly due to the typology of residential buildings (in the case of the Mexican systems), proximity to borders, the restrict accessibility to critical infrastructure, and to social vulnerability (especially related to the disabled, elderly and, subordinately, unemployed population). Thus, the most vulnerable areas are located around volcanic systems, in decreasing order: Tacaná (México-Guatemala), El Chichón (México), Llullaillaco (Chile-Argentina), Tutupaca (Peru), Isluga (Chile-Argentina), Guallatiri (Chile-Argentina), Reclus (Chile-Argentina), Yucamane (Peru), Mocho-Choshuenco (Chile-Argentina), El Misti (Peru), Sabancaya (Peru), Huaynaputina (Peru), Chaiten (Chile-Argentina), Putana (Chile-Argentina), Quetrupillan (Chile-Argentina), Ticsani (Peru) and Ubinas (Peru) (Supplementary Material 1, Figure 6).
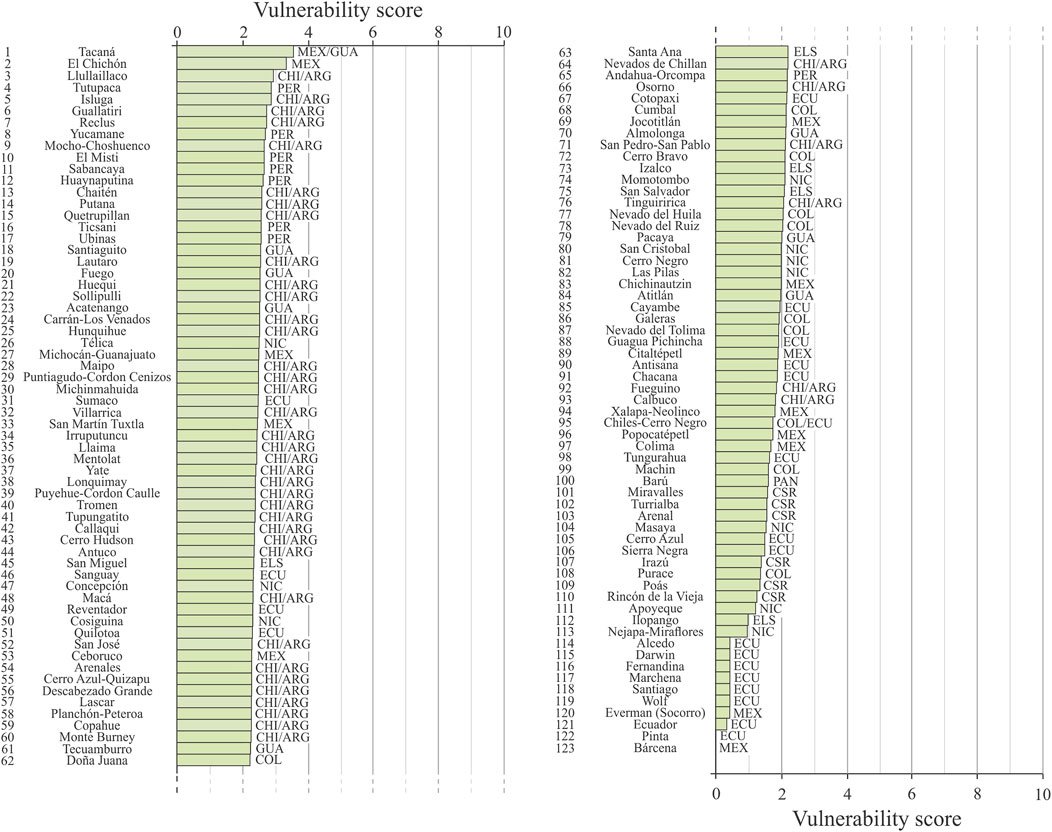
FIGURE 6. Latin America volcanic systems with recorded activity in the past 1,000 years assessed based on their vulnerability score. CHI/ARG: Chile/Argentina; COL: Colombia; CSR: Costa Rica; ECU: Ecuador; ELS: El Salvador; GUA: Guatemala; MEX: México; NIC: Nicaragua; PER: Peru.
In terms of resilience, some similarities between the different countries were identified. In addition to the existence of national plans for disaster risk management, in general the most hazardous volcanic systems in each country are those where mitigation and response measures have been implemented, increasing the resilience of surrounding areas, such as risk maps, real-time monitoring, educational activities, simulation exercises and emergency plans. The most resilient areas are those around Arenal (Costa Rica), Copahue (Chile-Argentina), Ubinas (Peru), Villarrica (Chile-Argentina), Poás (Costa Rica), Irazú (Costa Rica), Cotopaxi (Ecuador), Tungurahua (Ecuador), Llaima (Chile-Argentina), Turrialba (Costa Rica), Rincón de la Vieja (Costa Rica), Nevado del Ruiz (Colombia), Calbuco (Chile-Argentina), and Puyheue-Cordon Caulle (Chile-Argentina), Popocatépetl (México) and Planchon-Peteroa (Chile-Argentina) (Supplementary Material 1, Figure 7).

FIGURE 7. Latin America volcanic systems with recorded activity in the past 1,000 years assessed based on their resilience score. CHI/ARG: Chile/Argentina; COL: Colombia; CSR: Costa Rica; ECU: Ecuador; ELS: El Salvador; GUA: Guatemala; MEX: México; NIC: Nicaragua; PER: Peru.
When considering the VRR (1) (3-factor VRR: H×E×V), the highest scored systems are well distributed through the whole Latin America region, with emphasis on the Ecuadorian and Chilean-Argentinian volcanic systems that cover, together, 10 of the 20 volcanic systems of the highest VRR scores, followed by Guatemala, México, El Salvador, Peru and Nicaragua. In descending order of risk, considering the VRR (1), the 20 highest scored volcanic systems are: Santiaguito (Guatemala), Tacaná (México-Guatemala), Fuego (Guatemala), San Salvador (El Salvador), El Chichón (México), Ubinas (Peru), El Misti (Peru), Cotopaxi (Ecuador), Guagua Pichincha (Ecuador), Concepción (Nicaragua), Quilotoa (Ecuador), Reventador (Ecuador), Villarrica (Chile-Argentina), Santa Ana (El Salvador), Tungurahua (Ecuador), Ceboruco (México), Llaima (Chile-Argentina), Chaitén (Chile-Argentina), Lonquimay (Chile-Argentina), and Carrán-Los Venados (Chile-Argentina) (Table 4; Figure 8). The lowest scores, on the other hand, are related to the volcanic systems with no (Bárcena and Pinta) or low exposure (Ecuadorian island volcanoes). It is important to note that most Ecuadorian island volcanoes (Alcedo, Cerro Azul, Darwin, Ecuador, Fernandina, Marchena, Santiago and Wolf) present low exposure due to a few exposed elements within the highest radii thresholds. In addition, Fernandina, Marchena and Santiago are located on different islands and, as it is also the case of the other volcanic systems, their activity is mostly associated with small-extension lava flows, that, therefore, do not represent a significant threat. This is also the case of Sierra Negra, the Ecuadorian island volcano which is the closest to an inhabited area; the geological record associated with this volcano also shows some explosive activity but of low intensity that, due to the prevailing wind directions at the region (towards W-NW), also do not represent a major threat.
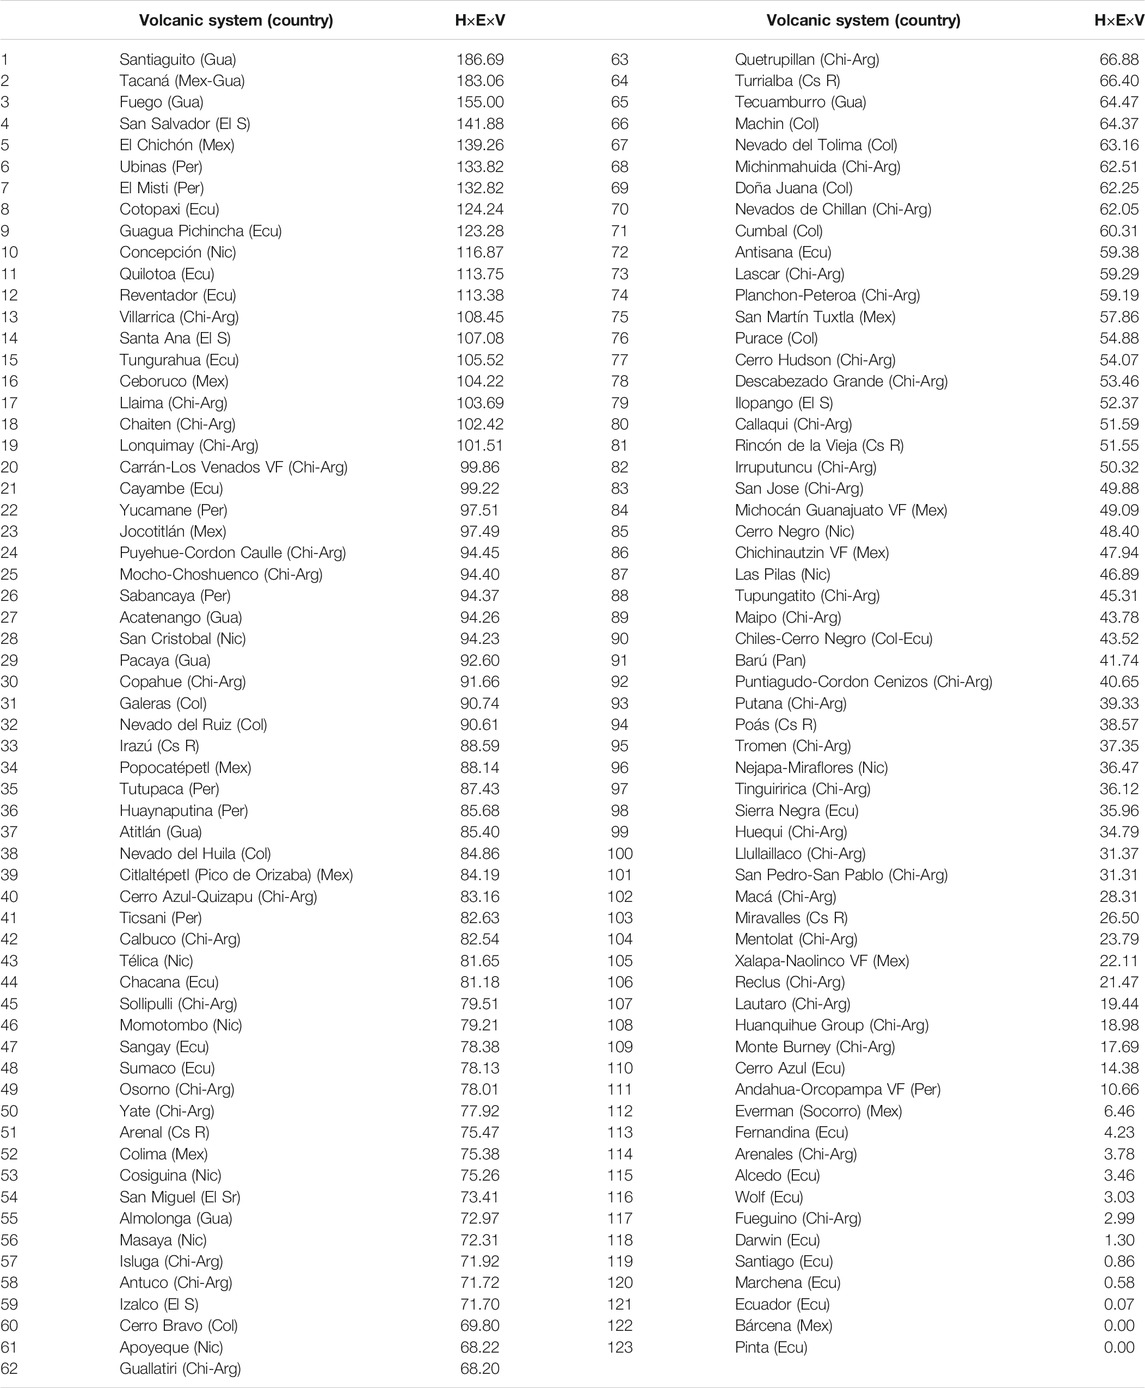
TABLE 4. VRR (1) for the Latin America volcanic systems with recorded activity in the past 1,000 years. The complete table of results with the score of all factors is available in the Supplementary Material 1.
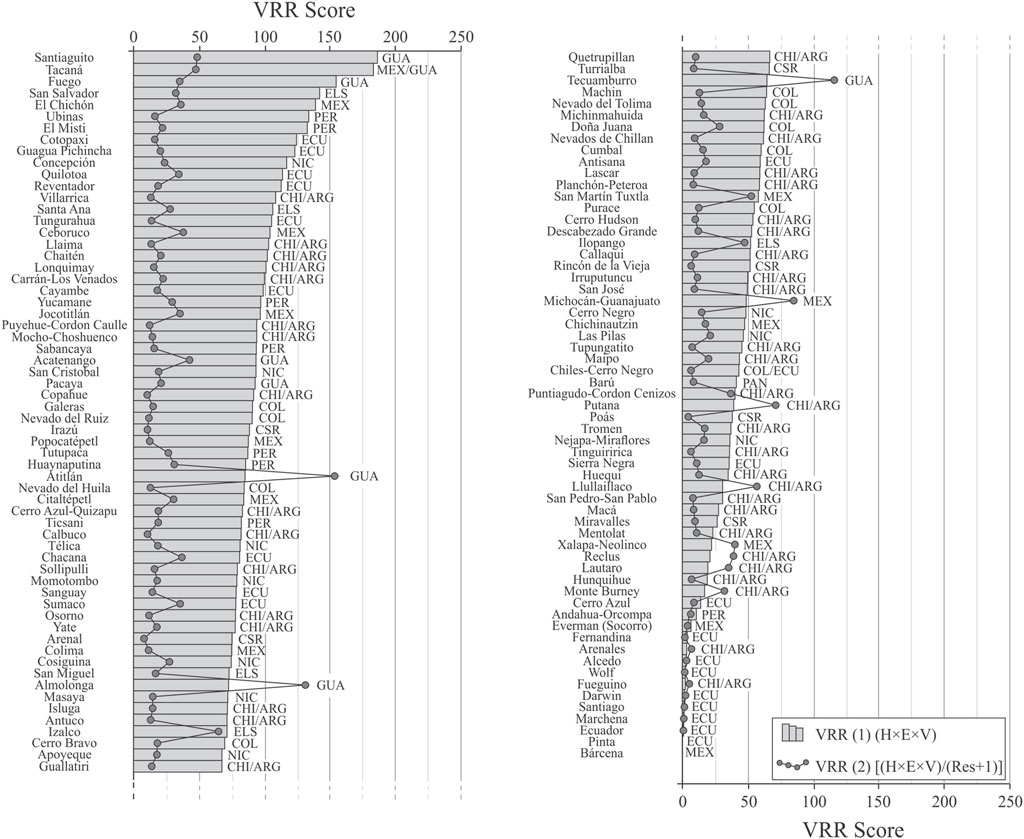
FIGURE 8. Latin America VRR (1) (light grey histograms) and VRR (2) (dark grey circles) considering the systems with recorded activity in the past 1,000 years. CHI/ARG: Chile/Argentina; COL: Colombia; CSR: Costa Rica; ECU: Ecuador; ELS: El Salvador; GUA: Guatemala; MEX: México; NIC: Nicaragua; PER: Peru.
VRR is significantly different when resilience measures are also considered. In fact, according to the 4-factor VRR (i.e., VRR (2): H×E×V/(Res+1)), the 20 volcanic systems with the highest score are (in descending order): Atitlán (Guatemala), Almolonga (Guatemala), Tecuamburro (Guatemala), Michocán Guanajuato VF (México), Putana (Chile-Argentina), Izalco (El Salvador), Lluillaillaco (Chile-Argentina), San Martín Tuxtla (México), Santiaguito (Guatemala), Ilopango (El Salvador), Tacaná (México-Guatemala), Acatenango (Guatemala), Xalapa-Naolinco VF (México), Reclus (Chile-Argentina), Ceboruco (México), Puntiagudo-Cordon Cenizos (Chile-Argentina), Chacana (Ecuador), El Chichón (México), Sumaco (Ecuador) and Jocotitlán (México) (Table 5; Figure 8). VRR (2) sheds light on the importance of the resilience factor for risk reduction, with emphasis on the Ubinas (Peru), Cotopaxi (Ecuador), Villarrica (Chile-Argentina), Tungurahua (Ecuador), Llaima (Chile-Argentina), Puyehue-Cordon Caulle (Chile-Argentina) and Copahue (Chile-Argentina). Some of these volcanic systems are among those in top positions of the VRR (1) but rank lower in VRR (2) because of implemented resilience measures. The volcanic systems with the most risk reduction strategies in place (e.g., hazard and risk assessments, monitoring and early warning systems, educational activities, evacuation plan, etc.), or in other words with highest resilience, are Arenal (Costa Rica), Copahue (Chile-Argentina), Ubinas (Peru), Villarrica (Chile-Argentina), Poás (Costa Rica), Irazú (Costa Rica), Cotopaxi (Ecuador), Tungurahua (Ecuador), Llaima (Chile-Argentina), Turrialba (Costa Rica), Rincón de la Vieja (Costa Rica), Nevado del Ruiz (Colombia), Calbuco (Chile-Argentina), and Puyheue-Cordon Caulle (Chile-Argentina) (Figure 7). The case of the Nevado del Ruiz volcano deserves attention; although this volcano displays a moderate risk level at the Latin America scale (VRR 1) = 90.61/32nd position), it is among those characterized by the highest level of resilience measures implemented (e.g., risk assessment, early warning systems, hazard-based land use planning, evacuation plan; VRR (2) = 11.65/83rd position), demonstrating the importance of the lessons learned from the tragic event occurred in 1985. In contrast, the volcanic systems Ceboruco (México), Quilotoa (Ecuador), Santiaguito (Guatemala), Tacaná (México-Guatemala), El Chichón (México) and Santa Ana (El Salvador) stand out as those of high to moderate risk with the fewest risk reduction strategies in place and, consequently, highest score in VRR (2).
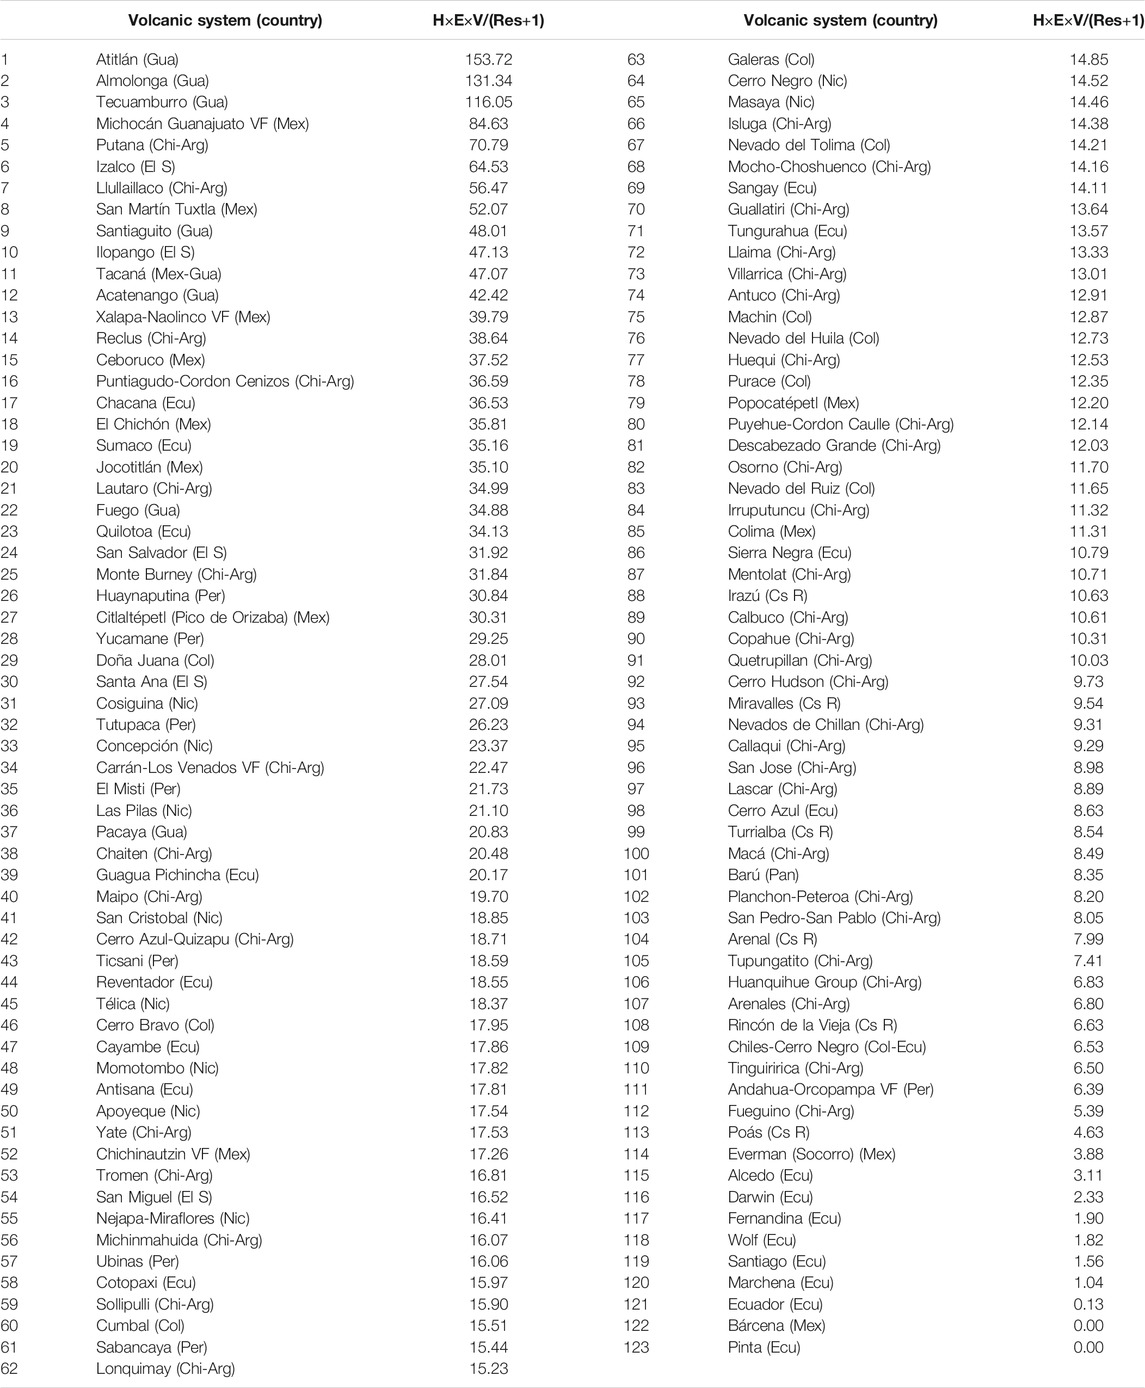
TABLE 5. VRR (2) for the Latin America volcanic systems with activity in the past 1,000 years. The complete table of results with the score of all factors is available in the Supplementary Material 1.
VRR analyses at national scale have also been performed. Figure 9 presents the example of Nicaragua together with the comparison with the previous ranking analysis (Palma et al., 2009) based on the method of Ewert et al. (2005, Ewert., 2007); all other national analyses are presented in Supplementary Material 2–8, with the exception of Panama that only has one volcanic system, and México that has been analyzed in detail by Nieto-Torres et al. (2021). First, the national map shows a heterogeneous distribution of the 4 risk factors, even though all volcanic systems are associated with some level of resilience measures implemented. Second, it is interesting to notice that our 3-factor VRR (1) (blue histograms) is very different with respect to the threat ranking of Palma et al. (2009) as well as the threat ranking based on the hazard and exposure analyses presented here (pale-pink circles), with Conception being associated with the highest score. Finally, the VRR (2) highlights the volcanic system with the fewest resilience measures (i.e., Cosiguina).
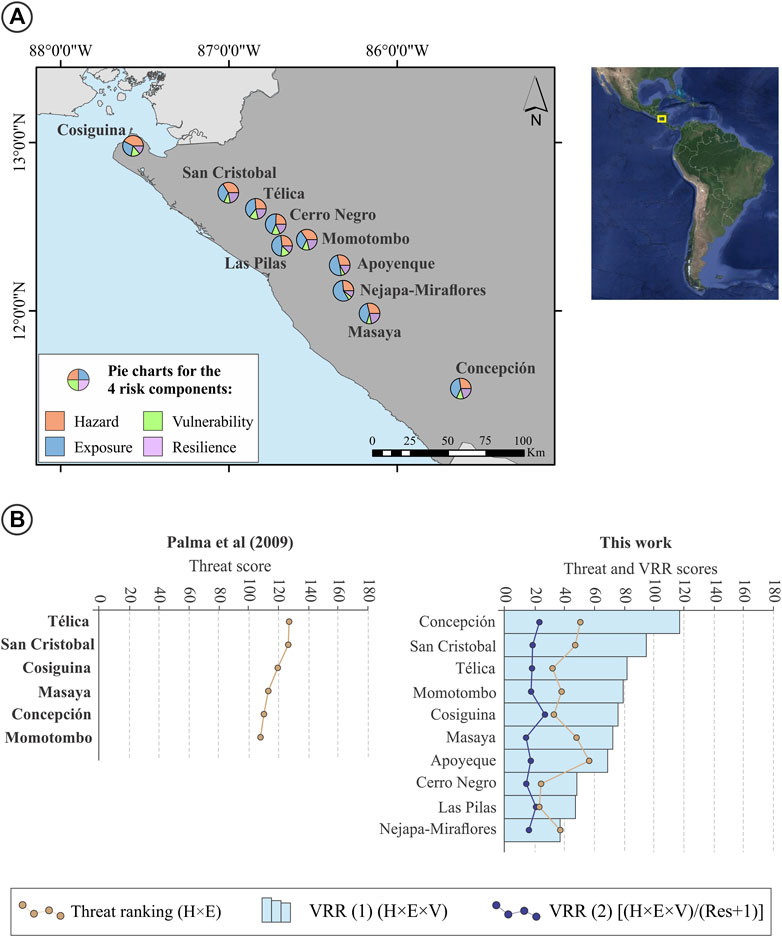
FIGURE 9. (A) Location of the Nicaraguan volcanic systems with volcanic activity recorded in the last 1,000 years with their respective pie charts for the fourrisk components (hazard, exposure, vulnerability and resilience). (B) Comparative diagrams between previously published ranking (Palma et al., 2009) and our results. It is important to note that the ranking of Palma et al. (2009) was developed for some of the Central America volcanic systems based on the threat (according to Ewert et al., 2005; Ewert., 2007), while our work provides 2 different rankings: VRR (1) and VRR (2).
Discussion
Limitations
It is important to emphasize that risk rankings are not a forecasting tool, i.e., they do not predict when, where or how a system will erupt, or a complete risk assessment, i.e., they do not assess the intensity and spatial extension of the potential impact. The main objective of risk rankings is to classify the volcanic systems in a region based on various risk factors. In particular, the proposed VRR strategies are based on the analysis of the 4 main risk factors (hazard, exposure, vulnerability and resilience) and help to identify which of these factors most contributes to the associated risk and potential reductions.
The application of the new VRR strategies to the Latin America region is of particular complexity due to the socio-economic differences between countries with different levels of investment in hazard investigation, risk management and coping capacity. The location of volcanoes on geographic borders and the lack of data may represent additional challenges. Indeed, if on the one hand the use of a VRR strategy that considers as many hazard, exposure, vulnerability and resilience parameters as possible allows for a comprehensive assessment of the risk, on the other hand its large-scale application in countries with different social and political contexts may present significant challenges related to the lack and/or heterogeneity of data. In this work, the lack of data was mainly related to telecommunication infrastructure and affected 7 of the 10 Colombian volcanic systems, all of the 8 Peruvian systems, and 11 of the 43 Argentinian/Chilean systems. This lack of data affects about 8% of the elements analyzed in the exposure and vulnerability factors in the case of the Colombian and Argentinian/Chilean volcanic systems and about 4% of the elements analyzed in the vulnerability factor in the case of the Peruvian systems. Considering the maximum values attributable to the lacking parameter/element (e.g., Four for telecommunication infrastructure, whose score can range from 0 to 4, as shown in Table 1), the absent data can represent up to ∼8% of the exposure factor’ score for the Colombian and Argentinian/Chilean systems and up to ∼2 and ∼1% of the vulnerability factor’ scores for the Colombian and Argentinian/Chilean and Peruvian systems, respectively. Missing or unpublished information related to the resilience factor affected 9 of the 10 Colombian systems analyzed; this lack of data can represent from ∼38 to ∼85% of the elements analyzed, which can correspond to a range of up to ∼28 to 67% of the resilience factor’ score depending on the volcanic system.
We also recognize the limitations of the GVP data especially in relation to the eruptive history. However, although this database may have some gaps in data coverage and completeness, it represents the most complete source at regional scale. It is also important to stress that the analyzed data was complemented and validated with data from local institutions (e.g., geological surveys, universities). Additionally, in order to avoid problems related to incomplete data we have excluded those events with VEI <3 when analyzing eruptive recurrence rate. We emphasize that the ranking can be easily updated when new and better information becomes available.
Finally, it is interesting to mention that more detailed and accurate results may be obtained if we zoom at local scale when analyzing parameters such as typology of buildings and social vulnerabilities. We emphasize that, due to the regional scope of the present study, such local detailed analyses were not carried out; however, they should be taken into account in case of local analysis focused on smaller regions.
Comparison With Previous Rankings and Advances of the Proposed Volcanic Risk Ranking
Volcanic threat rankings following the strategy proposed by Ewert et al. (2005) were published for the Latin America volcanic systems either in the national (Lara et al., 2006; Pereña et al., 2015; Macedo et al., 2016; Santamaría and Bernard, 2018; Elissondo et al., 2016, 2017) or regional context (Palma et al., 2009), with the exception of Colombia, for which published rankings are not available. The comparison between our results and the previously published threat rankings is graphically exemplified here by the Nicaraguan rankings (Figure 9), while the graphical comparisons for other countries are provided in the supplementary materials (Supplementary Materials 2–8), with the exception of México, whose results are presented and discussed in the companion paper by Nieto-Torres et al. (2021), Panama, due to our analysis of a single volcanic system, and Colombia, for which a previous ranking does not exist. A direct comparison with the previous threat rankings is not straightforward due to the fact that such rankings do not consider the normalization of the factors proposed by the methodology used here and to differences in the number and type of parameters and volcanic systems analyzed; as an example, the assessment of the exposed populations in our VRR is based on population density for each analyzed radius, while the previous rankings consider the log10 of the population in a single radius threshold. Nonetheless, some general considerations can be drawn.
In the comparison of the threat ranking, which considers only the hazard and exposure factors (i.e., H×E) (i.e., corresponding to the approach based on the work of Ewert et al., 2005; Ewert., 2007) some differences can already be noticed. The diversity of critical infrastructures considered in our exposure analysis ensures that more densely populated areas and, consequently, with more infrastructure, especially those located in proximal areas, have higher scores in the threat ranking. This is well shown by volcanic systems such as Concepción (Nicaragua; Figure 9) or Tacaná (México-Guatemala) and Acatenango (Guatemala), San Salvador and Izalco (El Salvador), Turrialba (Costa Rica), Quilotoa and Guagua Pichincha (Ecuador), Ubinas and El Misti (Peru), Chaitén and Lonquimay (Chile-Argentina) (Supplementary Materials 2–8), that rose in position in our threat ranking compared to the previous local threat rankings.
Furthermore, it is important to note that vulnerability and resilience are not assessed in the previous and most widely used ranking methods (e.g., Ewert et al., 2005; Ewert., 2007; Ewert et al., 2018), which are, in fact, called volcanic threat rankings. Our new VRR strategies represent, therefore, an important advancement. The effect of these two additional factors (V and Res) can be seen at both local and regional levels. First, both the VRR (1) and the VRR (2) can better differentiate the final score threat ranking of individual volcanic systems; e.g. Nicaragua, Concepción and Momotombo volcanoes rising in position when comparing our VRR (1) and the previous threat ranking by Palma et al. (2009) or Concepción, San Cristobal, Télica, Momotombo and Cosiguina rising of position when comparing our VRR (1) and threat rankings (compare pale-pink solid line with both the blue histograms and the dark blue solid line in Figure 9B; for other countries please check the diagrams at Supplementary Materials 2–8). This is especially important when prioritizing volcanic systems for risk reduction strategies. Second, physical, social and economic vulnerability parameters are fundamental for a better characterization of the risk posed by a volcanic system. Finally, the variety of elements related to systemic vulnerability ensures that systems that have a combined effect of high exposure and low redundancy and accessibility stand out, as is the case of systems such as Concepción (Figure 9), Santa Ana (El Salvador), Galeras (Colombia), Guagua Pichincha, Cayambe and Quilotoa (Ecuador), El Misti, Ubinas and Tutupaca (Peru), Copahue, Chaiten, Sollipulli and Puyehue-Cordon Caulle (Chile-Argetina) (Supplementary Materials 2–8).
The importance of including the vulnerability factor stands out also at regional scale causing significant changes in ranking position. This is, for example, the case of El Chichón, that jumped from the 29th position in our threat ranking to the 5th position in VRR (1). Other examples include Tacaná that jumped from the 11th to the 2nd position, Yucamane from the 41st to the 22nd position, Chaiten from the 36th to the 18th position, Llaima from the 27th to the 17th position, Villarrica from the 23rd to the 13th position, Lonquimay from the 28th to the 19th position and El Misti from the 13th to the 7th position.
The resilience factor accounted for in the VRR (2), has produced significant changes in the ranking highlighting those systems with moderate to high score in the VRR (1) but none or few resilience measures implemented. Since there is a general tendency for the most hazardous volcanic systems in each country to have mitigation and response measures implemented, those systems with moderate score in VRR (1) but low resilience are in the top positions in the VRR (2) (e.g., Atitlán (Guatemala), Almolonga (Guatemala), Izalco (El Salvador)). However, some systems still deserve attention, as is the case of Santiaguito (Guatemala), Tacaná (México-Guatemala), Ceboruco (México), El Chichón (México), Jocotitlán (México), Fuego (Guatemala), Quilotoa (Ecuador), San Salvador (El Salvador), Huaynaputina (Peru) and Yucamane (Peru) that show high VRR (1) scores, and, due to their low resilience scores, occupy moderate to high positions also in the VRR (2) (Figure 8; Tables 4, 5). Arenal, Copahue, Villarrica, Tungurahua, Puyehue-Cordon Caulle, Irazú and Llaima are some of the systems with the greatest resilience measures in place (87 to 89% of risk score reduction) and, therefore, are associated with the most significant drop in position from VRR (1) to VRR (2) (53 to 60 positions).
We also emphasize that, since the VRR may be an important tool to prioritize risk reduction measures, it is important to assess all four risk factors. In fact, contrasting vulnerabilities may help differentiate volcanic systems with equal or similar H×E, while different resilience may help differentiate systems with similar H×E×V (Table 6). Thus, the addition of vulnerability and resilience factors not only allows for a more comprehensive assessment of the risk, but also enables a more accurate hierarchization of the volcanic systems, a more effective assessment of their weaknesses and, consequently, an easier planning of the needed mitigation measures and their prioritization.
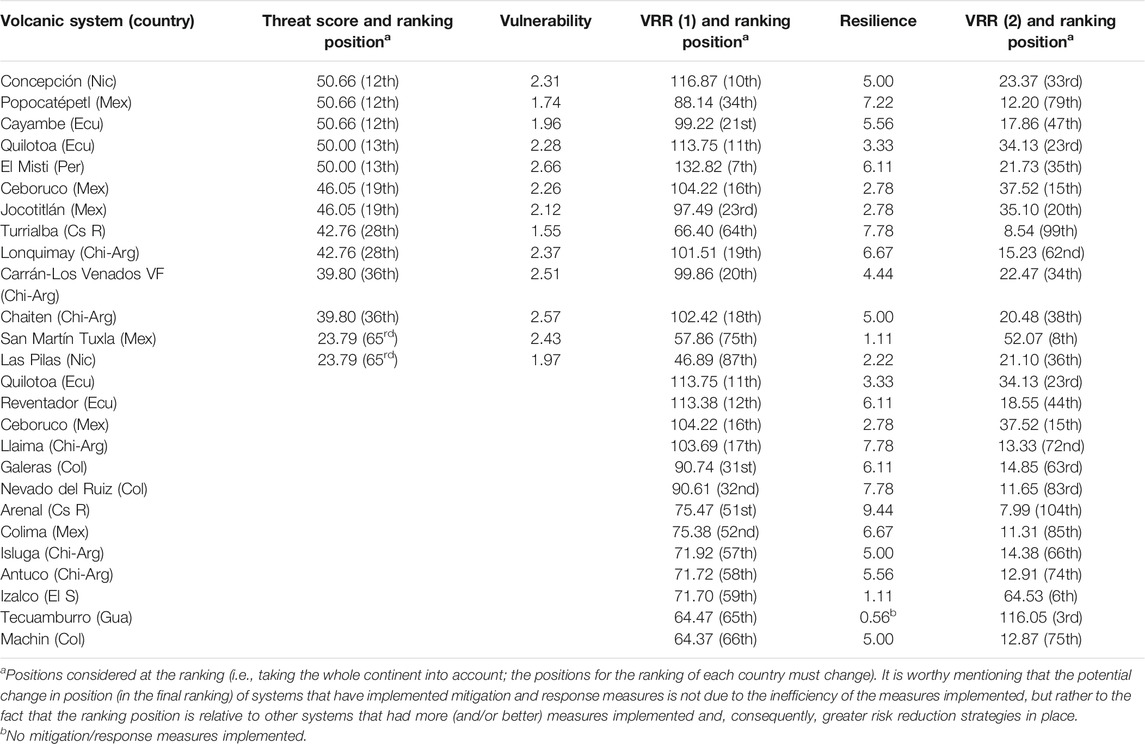
TABLE 6. Comparative table showing the effects of the vulnerability and resilience factors on systems with the same threat score and the effect of the resilience (assessed in VRR (2)) on systems with similar VRR (1) score. The complete table of results, with the score of all factors, is available in the Supplementary Material 1.
Risk Trends at Regional Level
The lack of data for some countries (e.g., telecommunication infrastructure in Chile and Colombia, lack of redundancy and accessibility to telecommunication infrastructure in Chile, Colombia and Peru, and few resilience parameters for Colombia) prevents an accurate comparative analysis at the regional level; nonetheless, some general patterns could be identified. The riskiest volcanoes are those with high hazard recurrence rate and high population densities, even in proximal areas, prominently in Central America and Colombia. High vulnerability scores can be related either to proximity to geographic borders, typology of residential buildings and lack of redundancy and accessibility to critical infrastructure; social vulnerabilities are quite variable from country to country and even between regions of the same country. Finally, our ranking shows that, in general, the volcanic systems that score high in VRR (1) already have some mitigation and response measures implemented (e.g., multi-hazard maps, real-time monitoring and early warning systems, educational activities and evacuation plans). However, it is also important to consider that this is a relative ranking, and even though these systems are associated with more resilience measures with respect to other systems, potential impact/risk assessment, engineering mitigation measures and hazard-based land-use planning are lacking in most countries and most systems, while educational activities, evacuation plans, and shelters are only locally available.
Potential Mitigation Measures
Given that natural hazards cannot be easily controlled, stopped or modified, it is axiomatic that risk reduction relies on reducing the number of exposed elements and their vulnerabilities as well as on increasing resilience. Even though reducing exposure represents one of the most effective ways of reducing risk, and should especially be considered in urban areas characterized by very high level of exposure (e.g., Neapolitan area exposed to potential hazards from both Vesuvius and Campi Flegrei, Italy; De Natale et al., 2020), the modification of this factor is sensitive since it demands relocation of both people and infrastructure, hardly feasible in already established communities. Indeed, the relocation of communities, especially if forced and even in cases of prolonged emergency, can cause further problems (e.g., evacuees return to high-risk areas to preserve livelihoods due to undesirable conditions of the shelters/new settlements; Armijos et al., 2017; Barclay et al., 2019); this is especially true if there is no new land-use planning that considers the needs and specifications of that community, its social, cultural and economic relations previously established and intrinsically related to their mode of occupation (Menoni and Pesaro, 2008; Usamah and Haynes, 2012). Such an option is, therefore, an extreme measure, only considered if other preventive and mitigation measures are not sufficient, e.g., in case of extremely high-population-density areas. In this scenario, the relocation should be based on an accurate risk assessment and a careful cost-benefit analysis and should ensure the participation of the relocated community in the decision-making processes. Less challenging and more effective implementable actions for disaster risk reduction are related to reducing vulnerability and increasing resilience.
Regarding vulnerability, the main measures for its effective reduction are related to creating redundancy and accessibility to vital infrastructure. The highest scores related to the lack of redundancy and restricted accessibility are found predominantly in the southern portion of the continent (with few exceptions from México, Ecuador and Colombia), where the systems are characterized by moderate demographic densities. Restricted accessibility is especially problematic in highly populated systems such as those in Colombia (e.g., Cumbal, Galeras and Nevado del Ruiz), Ecuador (e.g., Chacana, Chiles-Cerro Negro, Guagua Pichincha and Quilotoa) and Peru (e.g., Andahua-Orcopampa). Considering that building ways for better access to vital infrastructure may involve shorter-term public policies and moderate costs in comparison with other actions aiming at, for example, reducing social vulnerabilities, such strategies may represent a faster and more effective measure to reduce the risk associated with the studied volcanic systems.
Finally, the absence of potential impact and risk assessment for the vast majority of analyzed volcanic systems stands out. Such studies are essential for the implementation of other resilience measures, such as engineering mitigation measures and hazard-based land-use planning. Despite the existence of some guides for the implementation of hazard-based land-use planning (Vargas and Cortés, 2009; Secretaría de Planificación Territorial y Coordinación de Obra Pública, 2019), such plans considering volcanic hazards are not available for most volcanic systems. It is important to highlight that the implementation of hazard-based land-use planning for existing communities can be a tool of paramount importance to control or even (ideally) stop the advancing occupation in areas at risk, especially for volcanic systems associated with already highly populated areas (with emphasis on those located in Guatemala, El Salvador, Nicaragua, Colombia and Ecuador, for the majority of whom such preventive planning is not yet available). Such an effort should be, nonetheless, directed at the governmental level and needs to be included in local practices in order to be effective. Additionally, the implementation or improvement of existing monitoring tools and early warning systems, as well as the elaboration of evacuation plans (mainly in Guatemala, El Salvador, Nicaragua, Colombia, Ecuador and Peru), the systematization of shelters (in all analyzed regions) and the organization of activities for building community risk perception and awareness (especially in México and Central American countries, where such measures are not yet being implemented at most volcanoes) are crucial and must be pursued.
Conclusion
Volcanic risk analyses are complex as they need to consider multiple primary and secondary hazards that act at multiple spatial and temporal scales as well as multiple dimensions of vulnerability and various aspects of exposure and resilience. The VRR strategies proposed in the companion paper by Nieto-Torres et al. (2021) and applied here to the Latin America volcanic systems with eruptive record in the last 1,000 years, are based on two different equations (VRR (1) and VRR (2)) that combine 3 (hazard, exposure, vulnerability) and 4 key risk factors (hazard, exposure, vulnerability and resilience), respectively, aiming at classifying volcanic systems in order to prioritize risk reduction measures. In addition to highlighting the importance of considering vulnerability and resilience factors when ranking risk besides hazard and exposure, the proposed VRR strategies provide a valuable opportunity for identifying weak aspects of densely inhabited areas located close to active volcanic systems, thus helping ensure means for planning coordinated actions to reduce risk. It is also found that both VRR (1) and VRR (2) allow for a more pronounced diversification of ranking scores with respect to the volcanic threat ranking proposed by Ewert et al. (2005) and Ewert (2007) and applied in various countries in Latin America (see Figure 9 and Supplementary Materials 2–8). A more pronounced diversification of score helps better identify the volcanic systems that require intervention. In addition, as hazard and exposure are difficult to modify and reduce, the main actions for risk mitigation rely on the reduction of vulnerability (by creating redundancy and accessibility to vital infrastructure and reducing social inequalities that reflects on physical, social and economic vulnerability aspects) and increasing resilience. In particular, resilience can be increased through risk assessment studies, elaboration of hazard-based land-use planning (which also contributes to reduce or at least control exposure), implementation of early warning systems, emergency plans and protocols as well as educational activities and simulations to improve risk perception and response capacity. Hence the importance of including vulnerability and resilience in a comprehensive VRR.
Based on this method, among the 123 volcanoes analyzed for Latin America, the volcanoes Santiaguito (Guatemala), Tacaná (México-Guatemala), Fuego (Guatemala), San Salvador (El Salvador), El Chichón (México), Ubinas (Peru), El Misti (Peru), Cotopaxi (Ecuador), Guagua Pichincha (Ecuador) and Concepción (Nicaragua) are those with the highest score in VRR (1) (H×E×V); in contrast, the island Ecuadorian volcanoes (Ecuador, Marchena, Santiago, Darwin, Fueguino, Wolf and Alcedo) are among the systems with the lowest score in VRR (1) (in addition to Bárcena and Pinta volcanoes for which exposure is zero). Hazard and exposure are the main factors influencing these results. Exposure is here especially influenced by population densities, which is either high even in proximal areas (as is the case of Santiaguito, Tacaná, Fuego, San Salvador, Concepción and Quilotoa) or zero to low, which is the case of the Mexican and Ecuadorian island systems that correspond to the systems with lowest score in VRR (1). Although vulnerability is not the main factor controlling the results presented here, its contribution through the typology of buildings and restricted accessibility to vital infrastructure deserves attention.
The VRR (2), on the other hand, highlights the influence of resilience on the risk score, with those systems with few mitigation and response measures implemented being in the top positions. The volcanoes Atitlán (Guatemala), Almolonga (Guatemala), Tecuamburro (Guatemala), Putana (Chile-Argentina), Izalco (El Salvador), Lluillaillaco (Chile-Argentina), San Martín Tuxtla (México), Santiaguito (Guatemala) and Ilopango (El Salvador) are those with highest score in VRR (2). It is important to notice that VRR (1) and VRR (2) is zero at Bárcena and Pinta volcanoes as there is no exposure and that the systems that occupy the lowest positions in VRR (1) (Ecuador, Marchena, Santiago, Wolf, Fernandina, Darwin and Alcedo) maintained their bottom positions even with low or no resilience; this is mostly due to low exposure. It is worth also noting that some systems with moderate to high VRR (1) scores (e.g., Santiaguito, Tacaná, El Chichón and Ceboruco) maintained moderate to high positions in the VRR (2), highlighting the need to improve their resilience in order to reduce risk.
Data Availability Statement
The original contributions presented in the study are included in the article/Supplementary Material, further inquiries can be directed to the corresponding author.
Author Contributions
LG obtained and organized the data from South American volcanic systems. AN-T obtained and organized the data from Mexican and Central American volcanic systems. LG compiled and analyzed the data on a regional scale (Latin America VRR) and organized this manuscript. All authors contributed to the interpretation of the results and to the revision of the text, figures, tables and supplementary materials.
Funding
This study was supported by the Swiss National Science Foundation (project #200020_188,757).
Conflict of Interest
The authors declare that the research was conducted in the absence of any commercial or financial relationships that could be construed as a potential conflict of interest.
Publisher’s Note
All claims expressed in this article are solely those of the authors and do not necessarily represent those of their affiliated organizations, or those of the publisher, the editors and the reviewers. Any product that may be evaluated in this article, or claim that may be made by its manufacturer, is not guaranteed or endorsed by the publisher.
Acknowledgments
This project was carried out within the framework of a collaboration between the Specialization Certificate for the Assessment and Management of Geological and Climate-related Risk of the University of Geneva (CERG-C) (https://www.unige.ch/sciences/terre/CERG-C/) and the Latin American Volcanology Association (ALVO) in an effort to reduce volcanic risk in Latin America. The authors acknowledge Mariano Agusto, Mariana Jácome Paz, Emilce Bustos and Pablo Forte (ALVO), Johanna Kaufman and Manuela Elissondo (SEGEMAR), Francisco Vasconez (IG-ENP), Angelica Larrea and Freddy Gaona (SNGRE), Jorge Concha and Marco Rivera (IGP), Maria Angelica Contreras, Gabriela Pedreros, Maira Figueroa, Cintia Bengoa and Alvaro Amigo (SERNAGEOMIN) and ONEMI for helping with data acquisition that made this work possible. The authors are thankful to MB (Editor) and the two reviewers, whose comments significantly improved the paper.
Supplementary Material
The Supplementary Material for this article can be found online at: https://www.frontiersin.org/articles/10.3389/feart.2021.757742/full#supplementary-material
References
Aceves-Quesada, J. F., Díaz-Salgado, J., and López-Blanco, J. (2007). Vulnerability Assessment in a Volcanic Risk Evaluation in Central Mexico through a Multi-Criteria-GIS Approach. Nat. Hazards 40 (2), 339–356. doi:10.1007/s11069-006-0018-6
Alvarado, G. E., Soto, G. J., Pullinger, C. R., Escobar, R., Bonis, S., Escobar, S., et al. (2012). “Volcanic Activity , Hazards , and Monitoring,” in Central America: Geology, Resources and Hazards. Editors J. Bundschuh, and G. E. Alvarado (Taylor & Francis Group), 1436.
Armijos, M. T., Phillips, J., Wilkinson, E., Barclay, J., Hicks, A., Palacios, P., et al. (2017). Adapting to Changes in Volcanic Behaviour: Formal and Informal Interactions for Enhanced Risk Management at Tungurahua Volcano, Ecuador. Glob. Environ. Change 45, 217–226. doi:10.1016/j.gloenvcha.2017.06.002
Aspinall, W., and Blong, R. (2015). “Volcanic Risk Assessment,” in The Encyclopedia of Volcanoes. Editors H. Sigurdsson, B. Houghton, S. McNutt, H. Rymer, and J. Stix. 2nd Ed (Cambridge: Academic Press), 1215–1231. doi:10.1016/b978-0-12-385938-9.00070-5
Bailey, R. A., Beauchemin, P. R., Kapinos, F. P., and Klick, D. W. (1983). “The Volcano Hazards Program: Objectives and Long-Range Plans,” in Open-File Rep. No. 83-400 (Reston, Va: U.S. Geological Survey). doi:10.3133/ofr83400
Barazangi, M., and Isacks, B. L. (1976). Spatial Distribution of Earthquakes and Subduction of the Nazca Plate beneath South America. Geol 4, 686–692. doi:10.1130/0091-7613(1976)4<686:sdoeas>2.0.co;2
Barclay, J., Few, R., Armijos, M. T., Phillips, J. C., Pyle, D. M., Hicks, A., et al. (2019). Livelihoods, Wellbeing and the Risk to Life during Volcanic Eruptions. Front. Earth Sci. 7, 205. doi:10.3389/feart.2019.00205
Bowman, L. J., and Henquinet, K. B. (2015). Disaster Risk Reduction and Resettlement Efforts at San Vicente (Chichontepec) Volcano, El Salvador: toward Understanding Social and Geophysical Vulnerability. J. Appl. Volcanol. 4, 14. doi:10.1186/s13617-015-0031-0
Brown, S. K., Loughlin, S. C., Sparks, R. S. J., Vye-Brown, C., Barclay, J., Calder, E., et al. (2015). “Global Volcanic hazard and Risk,” in Global Volcanic Hazards and Risk. Editors S.C. Loughlin, R.S.J. Sparks, S.K. Brown, S.F. Jenkins, and C. Vye-Brown (Cambridge: Cambridge University Press).
Cadoux, A., Missenard, Y., Martinez-Serrano, R. G., and Guillou, H. (2011). Trenchward Plio-Quaternary Volcanism Migration in the Trans-Mexican Volcanic Belt: The Case of the Sierra Nevada Range. Geol. Mag. 148, 492–506. doi:10.1017/S0016756810000993
Connor, C., Bebbington, M., and Marzocchi, W. (2015). “Probabilistic Volcanic hazard Assessment,” in The Encyclopedia of Volcanoes. Editors H. Sigurdsson, B. Houghton, S. McNutt, H. Rymer, and J. Stix. 2nd Edn (Cambridge: Academic Press), 897–910. doi:10.1016/b978-0-12-385938-9.00051-1
Cutter, S. L. (2013). “Vulnerability,” in Encyclopedia of Natural Hazards, Encyclopedia of Earth Sciences Series (Berlin Heidelberg: Springer-Verlag). doi:10.1007/978-1-4020-4399-4_40
Damon, P., Shafiqullah, M., and Clark, K. (1981). Evolución de los arcos magmáticos en México y su relación con la metalogénesis. Rev. Mex. Ciencias Geológicas 5, 223–238.
De Natale, G., Troise, C., and Somma, R. (2020). Invited Perspectives: The Volcanoes of Naples: How Can the Highest Volcanic Risk in the World Be Effectively Mitigated. Nat. Hazards Earth Syst. Sci. 20, 2037–2053. doi:10.5194/nhess-20-2037-2020
Delgado-Granados, H., Viramonte, J. G., and Alvarado, G. E. (2015). La volcanología latinoamericana: Estado de la situación regional en el 2008 a partir del análisis de sus debilidades, amenazas, fortalezas y oportunidades. Rev. Geol. Amér. Cent., 57–66. doi:10.15517/rgac.v0i52.18981
Elissondo, M., Farías, C., and Collini, E. (2017). Evaluación del riesgo volcánico relativo en Argentina. XX Congreso Geológico Argentino 20, 36–37. San Miguel de Tucumán.
Elissondo, M., Farías, C., and Collini, E. (2016). Volcanic Risk Assessment in Argentina. Cities On Volcanoes 9, Puerto Varas, Chile.
Ewert, J. W., Diefenbach, A. K., and Ramsey, D. W. (2018). 2018 Update to the U.S. Geological Survey National Volcanic Threat Assessment. Geol. Surv. Scientific Invest. Rep. 2018 5140, 40. doi:10.3133/sir20185140
Ewert, J. W., Guffanti, M., and Murray, T. L. (2005). An Assessment of Volcanic Threat and Monitoring Capabilities in the United States: Framework for a National Volcano Early Warning System (NVEWS). Open-File Rep. No. 2005-1164. Reston, Va: U.S. Geological Survey. http://pubs.usgs.gov/of/2005/1164/.
Ewert, J. W. (2007). System for Ranking Relative Threats of U.S. Volcanoes. Nat. Hazards Rev. 8, 112–124. doi:10.1061/(asce)1527-6988(2007)8:4(112)
Freire, S., Florczyk, A., Pesaresi, M., and Sliuzas, R. (2019). An Improved Global Analysis of Population Distribution in Proximity to Active Volcanoes, 1975-2015. Ijgi 8, 341. doi:10.3390/ijgi8080341
Gaillard, J. C. (2007). Resilience of Traditional Societies in Facing Natural Hazards. Disaster Prev. Manage. 16 (4), 522–544. doi:10.1108/09653560710817011
Global Volcanism Program (2013). “Volcanoes of the World, V. 4.9.3,” in Smithsonian Institution. Holocene Volcano List. Editor E Venzke Washington, DC. 20th May, 2019. doi:10.5479/si.GVP.VOTW4-2013
Gómez-Tuena, A., Orozco-Esquivel, M. T., and Ferrari, L. (2007). Igneous Petrogenesis of the Trans-mexican Volcanic belt. Geol. Soc. Am. 422, 129–181. doi:10.1130/2007.2422(05
Gunderson, L., and Holling, C. (2002). Panarchy. Understanding Transformation in Human and Natural Systems. Washington, DC: Island press.
Iuchi, K., and Mutter, J. (2020). Governing Community Relocation after Major Disasters: An Analysis of Three Different Approaches and its Outcomes in Asia. Prog. Disaster Sci. 6, 100071. doi:10.1016/j.pdisas.2020.100071
Lara, L. E., Clavero, J., Hinojosa, M., Huerta, S., Wall, R., and Moreno, H. (2006). NVEWS-CHILE: Sistema de Clasificación semicuantitativa de la vulnerabilidad volcánica. Congreso Geológico Chileno 11 (Actas 2), 487–490. Antofagasta.
Lowenstein, P. L., and Talai, B. (1984). Volcanoes and Volcanic Hazards in Papua New Guinea. Rep. No. 263. Tokyo: Geological Survey of Japan, 315–331.
Macedo, O., Taipe, E., Del Carpio, J., Ticona, J., Ramos, D., Puma, N., et al. (2016). Evaluación del riesgo volcánico en el sur del Perú, situación de la vigilancia actual y requerimientos de monitoreo en el futuro. Technical report. Arequipa: Instituto Geofísico del Perú (IGP), Instituto Geológico, Minero y Metalúrgico (INGEMMET), Universidad Nacional San Agustín UNSA, 75.
Macías, J. L. (2005). Geología e historia eruptiva de algunos de los grandes volcanes activos de México. Bsgm 57, 379–424. doi:10.18268/bsgm2005v57n3a6
Magill, C., and Blong, R. (2005a). Volcanic Risk Ranking for Auckland, New Zealand. I: Methodology and hazard Investigation. Bull. Volcanol 67, 331–339. doi:10.1007/s00445-004-0374-6
Magill, C., and Blong, R. (2005b). Volcanic Risk Ranking for Auckland, New Zealand. II: Hazard Consequences and Risk Calculation. Bull. Volcanol 67, 340–349. doi:10.1007/s00445-004-0375-5
McDowell, F. W., and Clabaugh, S. E. (1979). Ignimbrites of the Sierra Madre Occidental and Their Relation to the Tectonic History of Western Mexico. Geol. Soc. America: Spec. Paper 180, 113–124. doi:10.1130/spe180-p113
Menoni, S., and Pesaro, G. (2008). Is Relocation a Good Answer to Prevent Risk. Disaster Prev. Manage. 17, 33–53. doi:10.1108/09653560810855865
Mora, J. C., Jaimes-Viera, M. C., Garduño-Monroy, V. H., Layer, P. W., Pompa-Mera, V., and Godinez, M. L. (2007). Geology and Geochemistry Characteristics of the Chiapanecan Volcanic Arc (Central Area), Chiapas Mexico. J. Volcanology Geothermal Res. 162, 43–72. doi:10.1016/j.jvolgeores.2006.12.009
Mora, J. C., Layer, P. W., and Jaimes-Viera, M. C. (2012). New 40 Ar/39 Ar Ages from the Central Part of the Chiapanecan Volcanic Arc, Chiapas, México. Geofísica Int. 51, 39–49. doi:10.22201/igeof.00167169p.2012.51.1.144
Nieto-Torres, A., Guimarães, L. F., Bonadonna, C., and Frischknecht, C. (2021). A New Inclusive Volcanic Risk Ranking, Part 1: Methodology. Front. Earth Sci. 9, 697451. doi:10.3389/feart.2021.697451
Ortega-Gutiérrez, F., Mitre-Salazar, L., Roldán-Quintana, J., Aranda- Gómez, J., Morán-Zenteno, D., Alaniz-Álvarez, S., et al. (1992). Carta Geológica de la Republica Mexicana, escala 1: 2 000 000, 5a edición. México, DF: Universidad Nacional Autónoma de México, Instituto de Geología; y Consejo de Recursos Minerales.
Palma, J. L., Rose, W. I., and Escobar-Wolf, R. (2009). Volcanic Threat in Central America: Assessment and Comparison of Volcanic Hazards and Associate Vulnerability in Guatemala, El Salvador, Nicaragua, and Costa Rica. Geol. Soc. America Abstr. Progr. 41, 55.
Pereña, R. E., Torres, A. N., Oscoy, A. H., and Bastida, E. C. (2015). Diagnóstico de los volcanes activos a monitorear por el servicio vulcanológico nacional. México: Centro Nacional de Prevención de Desastres, 181.
Pilger, R. H. (1984). Cenozoic Plate Kinematics, Subduction and Magmatism: South American Andes. J. Geol. Soc. 141, 793–802. doi:10.1144/gsjgs.141.5.0793
Santamaría, S., and Bernard, B. (2018). “Hierarchization of the Volcanoes of continental and Insular Ecuador Based on Their Threat Potential,” in Cities on Volcanoes (Italy: Napoles), 10.
Scandone, R., Bartolini, S., and Martí, J. (2016). A Scale for Ranking Volcanoes by Risk. Bull. Volcanol 78, 2. doi:10.1007/s00445-015-0995-y
Secretaría de Planificación Territorial y Coordinación de Obra Pública (2019). Guía para la elaboración de normativa de ordenamiento territorial. Buenos Aires: Ministerio del Interior, Obras públicas y Vivienda, 274.
Smith, K. (2013). Environmental Hazards: Assessing Risk and Reducing Disaster. New York, USA: Routledge.
Stoiber, R. E., and Carr, M. J. (1973). Quaternary Volcanic and Tectonic Segmentation of Central America. Bull. Volcanol. 37, 304–325. doi:10.1007/BF02597631
Tilling, R. I. (2009). Volcanism and Associated Hazards: The Andean Perspective. Adv. Geosci. 22, 125–137. doi:10.5194/adgeo-22-125-2009
Uhira, K. (2003). Revised Definitions and Classification of Active Volcanoes in Japan, Based on Their Past Activities. Tokyo: Japan Meteorological Agency Rep.
UNDRO (1991). Mitigating Natural Disasters: Phenomena, Effects and Options. A Manual for Policy Makers and Planners. New York: United Nations.
UNISDR (2004). Living with Risk. A Global Review of Disaster Reduction Initiatives. Geneva: UN Publications.
Usamah, M., and Haynes, K. (2012). An Examination of the Resettlement Program at Mayon Volcano: what Can We Learn for Sustainable Volcanic Risk Reduction. Bull. Volcanol. 74, 839–859. doi:10.1007/s00445-011-0567-8
Vargas, D. M. R., and Cortés, F. R. (2009). Incorporando la gestión del riesgo de desastres en la planificación y gestión territorial : guía técnica para la interpretación y aplicación del análisis de amenazas y riesgos. Lima: Secretaría General de la Comunidad Andina, 104.
Keywords: volcanic risk ranking, volcanic hazards, Latin America volcanism, exposure, vulnerability, resilience
Citation: Guimarães LF, Nieto-Torres A, Bonadonna C and Frischknecht C (2021) A New Inclusive Volcanic Risk Ranking, Part 2: Application to Latin America. Front. Earth Sci. 9:757742. doi: 10.3389/feart.2021.757742
Received: 12 August 2021; Accepted: 27 September 2021;
Published: 18 October 2021.
Edited by:
Mark Bebbington, Massey University, New ZealandReviewed by:
Shinji Takarada, Geological Survey of Japan (AIST), JapanGiuseppe De Natale, Istituto Nazionale di Geofisica e Vulcanologia (INGV), Italy
Copyright © 2021 Guimarães, Nieto-Torres, Bonadonna and Frischknecht. This is an open-access article distributed under the terms of the Creative Commons Attribution License (CC BY). The use, distribution or reproduction in other forums is permitted, provided the original author(s) and the copyright owner(s) are credited and that the original publication in this journal is cited, in accordance with accepted academic practice. No use, distribution or reproduction is permitted which does not comply with these terms.
*Correspondence: Letícia Freitas Guimarães, bGV0aWNpYS5ndWltYXJhZXNAYWx1bW5pLnVzcC5icg==