 Hailong Zhang
 Yang Tang
 Seisuke Okubo1
- 1School of Civil Engineering, Chongqing University of Arts and Sciences, Chongqing, China
- 2China Construction Seventh Engineering Division Corp. Ltd, Zhengzhou, China
- 3School of Civil Engineering, Chongqing University, Chongqing, China
- 4State Key Laboratory of Coal Mine Disaster Dynamics and Control, Chongqing University, Chongqing, China
Time-dependent behavior has been demonstrated to be an essential factor in determining the long-term stability of underground structures. Creep and relaxation experiments are commonly used to investigate time-dependent behavior by subjecting rock to constant stress and strain. However, both stress and strain of in-situ rock masses are likely to change with time, a phenomenon known as generalized relaxation that has not been thoroughly investigated. In this study, a newly proposed control method with a constant linear combination of stress and strain as a feedback signal is used in compression and tension tests to investigate generalized relaxation behaviors of rocks. The results showed that the stress and strain of generalized relaxation are dependent on values of α, which represented generalized relaxation direction. The isochronous curves are enclosed within stress–strain curves of different loading conditions. The variation of stress (∆σ) and strain (∆ε) increases with increasing stress level and decreases with increasing confining pressure. Also, ∆σ and ∆ε in region II are smaller than in regions I and III. Furthermore, by performing brittle rock tests, complete generalized relaxation curves are obtained; three stages are observed, which are similar to conventional creep and relaxation behavior. Finally, the time and generalized relaxation failure behavior of Class I and Class II rock are discussed. The study is a valuable resource for gaining a comprehensive understanding of the time-dependent behavior of rocks and improving the stability and safety of underground structures.
Introduction
Time-dependent deformation of rock significantly impacts the mechanical properties and stability of many of engineering and geological structures (Wang et al., 2021; Fan et al., 2020), such as landslides, earthquake, tunnels and mining. For example, Wang et al. (2021) investigated the long-term stability of engineering supporting structures for landslides, the deformation control and prediction of rock slopes by conducting triaxial creep tests. Willis et al. (2021) indicated that earthquakes imposed changes of mantle rock stress and commonly induce a period of creep. Time-dependent behaviors for undergrounding rock, caused by excavation and changes in the applied stress, affect the distribution and magnitude of disasters, e.g., rockburst (Feng et al., 2017; Zhao et al., 2019). Delay outburst of coal and gas in mining commonly occurs a few hours lag after mining blasting, which related with time-dependent properties of coal (Lu and Zhao, 2016). The self-bearing capacity of tunnels possesses a dynamic process, and the rock mass is regarded as a viscous material with a distinguishable strain-strengthening property (Yu et-al., 2021). Therefore, understanding time-dependent behavior of rock is important, not only to assess stability of underground excavation, but also to predict geohazards.
Creep experiments are commonly used to study the time-dependent behaviors of rocks. However, creep occasionally occurs in conjunction with in-situ relaxation due to the various supports and rock heterogeneity (Paraskevopoulou et al., 2017). To explain such behavior, it is considered that the experiment of rock mass strain and stress changes simultaneously with increasing time, which is known as generalized relaxation (Fukui et al., 1992). Conventional creep (constant stress) and relaxation (constant strain) are typical behaviors of generalized relaxation. Until now, the generalized relaxation behavior of rocks under various stress conditions has received insufficient attention, with few investigations.
Rock creep behavior has been extensively studied under various loading conditions using laboratory tests, theories, and constitutive equations for the typical behavior of generalized relaxation (Hashiba et al., 2019; Wang et al., 2020; Zhang et al., 2016), with fewer studies on relaxation due to complex test techniques (Hashiba and Fukui, 2016). It is known that time-dependent rheological deformation of rocks is influenced by cyclic disturbance loads, but relaxation behavior after cyclic disturbance is still poorly understood (Zhu et-al.,2020), In order to study the phenomenon, Yu et al. (2021) carried out a step loading stress cyclic wear disturbance relaxation test for marble, and the results showed obviously time-dependency.
There have been minimal published results for generalized relaxation of rock (Fukui et al., 1992; Hashiba and Fukui, 2016; Okubo et al., 2014). Fukui et al. (1992) proposed the concept of generalized relaxation and explained it using two simple models specimens. Five directions of generalized relaxation, including creep and relaxation, were divided and introduced by the index α. Okubo et al. (2014) used a non-linear Maxwell model computer simulation to explain and calculate the experimental results of Fukui et al. (1992). Hashiba et al. (2017) presented generalized relaxation behavior of granite and compared it to calculated results using a viscoelastic constitutive model. Xu et al. (2021) investigated the deformation evolution on rock specimen surfaces using a digital image correlation method during generalized relaxation of sandstone. Although basic investigations of generalized relaxation of various rocks have been published, previous results primarily focused on uniaxial compression.
In this study, a new test machine realized the new control method, a constant linear combination of stress and strain. A series of generalized relaxation tests are performed under various loading conditions. The effect of stress level, confining pressure, and loading condition on generalized rock behavior is discussed. Complete generalized relaxation curves of brittle rock are also observed, as are evolution stages. It is hoped that the time-dependent behavior and long-term stability of underground rock structures will be extended and studied further.
Controlling Method
Controlling Principle
During testing, a constant linear combination of strain and stress is chosen as the servo-control system’s feedback signal (Okubo and Nishimatsu, 1985), with the following controlling formula:
where f(t) is a function of time (t), C is the loading rate, E is Young’s modulus of rocks, ε and σ are the strain and stress, respectively, and α is the generalized relaxation direction index. Eq. 1 can be modified as follows:
where dε/dt and dσ/dt are the strain and stress rates, respectively. If α = 0, it indicates a constant strain rate test, whereas α = ±∞ indicates a constant stress rate test. Both stress and strain were controlled during generalized relaxation testing. Eq. 2 can then be modified as follows:
According to Eq. 3, the location of stress and strain is controlled to follow the arrow with the slope is 1/α, as shown in Figure 1. The value of α should be preset as required before the experiment. By controlling Eq. 3a and the location of stress and strain will be started at the original point O and ended at point A under constant loading (stress/strain) rate. When the stress reaches point A, the loading rate C is set to zero, and the generalized relaxation test is performed by controlling Eq. 3. A is regarded as the generalized relaxation’s starting point (SPT). The slope of creep curves is zero (1/α) for creep test (α = ±∞). The slope of relaxation curves is infinite (1/α) for the relaxation test (α = 0). It has been discovered that creep and relaxation are special forms of generalized relaxation. When 1< α < ∞, the stress and strain increase with time, and the slope of the stress–strain curves is 1/α, as shown in region-I of Figure 1. When ∞ < α < 0, the strain increases while the stress decreases with increasing time, as shown in region-II. When 0 < α < 1, stress and strain decrease with increasing time, shown as region-III. When α = 1, the stress and strain locations coincided with complete stress–strain curves. For the values of α in three region (I, II and III), it was found that the location of stress and strain would be strike line at direction clockwise.
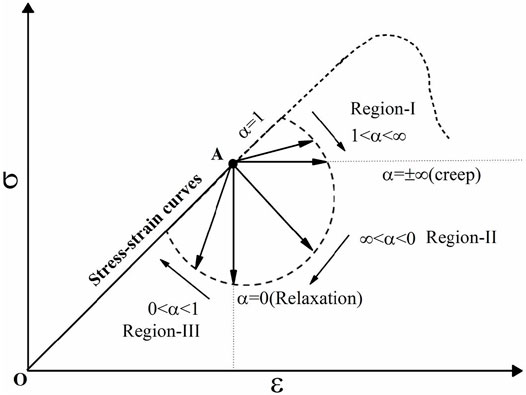
FIGURE 1. Schematic diagram of generalized relaxation.
Variable-Resistance Technology and Servo-Controlling
To achieve the control method, the authors proposed the variable-resistance technology. As shown in Figure 2, a loading-cell and a linear variable differential transformer (LVDT) were used to collect stress and strain signals in the servo-controller.
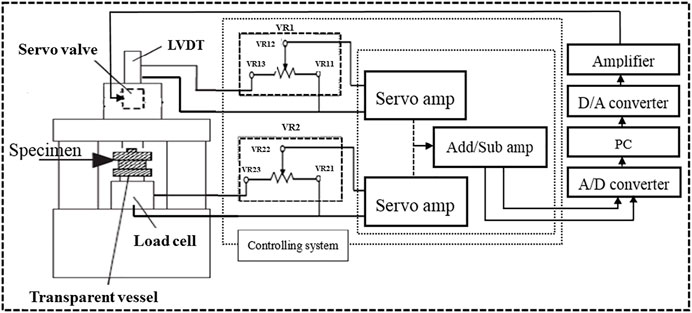
FIGURE 2. Schematic diagram of control system and variable-resistance technology.
During testing, VR1 and VR2 display feedback signals proportional to the stress. The LVDT output was fed to the servo amplifier, and VR1 controlled the strain value. Loading-cell output was fed into the servo amplifier, and VR2 controlled the stress value. When VR12 was rotated to VR13 and VR22 was rotated to VR21, VR1’s resistance value was zero, and VR2’s resistance value was maximum. As a result, the constant strain rate test was applied. When VR12 was rotated to VR12, and VR22 was rotated to VR23, VR1’s resistance value was maximum, and VR2’s resistance value was zero, and a constant stress rate was applied. When VR12 was rotated to the middle of VR11 and VR13, and VR22 was rotated to the middle of VR21 and VR23, the ratio of the resistance value of VR1 and VR2 was calculated as β. α is the stress feedback ratio (α = k∙β, k is constant), the stress signal value is α∙β/E, and the strain signal value is ε. A constant linear combination of stress and strain (ε-α∙β/E) in Add/Sub amplifier was used as the feedback signal in a closed-loop.
Wawersik and Fairhurst (1970) classified rocks into Class I and Class II based on the complete stress–strain curve in the post-failure region, the control lines for Class I and Class II rocks was shown in Figure 3, the parallel solid lines are the control lines by Eq. 1, in which it was realized by variable-resistance technology, it was found that there were only a intersection point between stress-strain curves for Class I or Class II rocks and control lines. Thus, the stress-feedback controlling method has very good stability for Class I and Class II rocks.
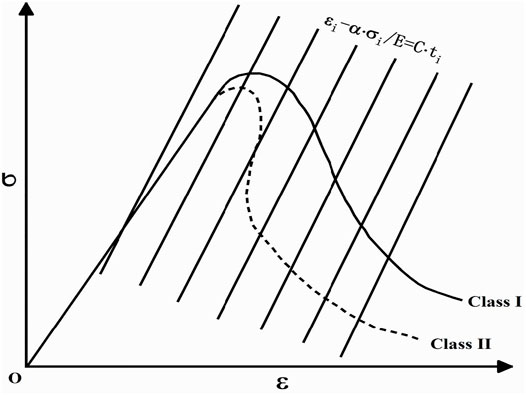
FIGURE 3. The control lines by stress-feedback method for Class I and Class II rocks.
Materials and Method
Specimen Description and Testing Apparatus
Tage tuff and Yibin granite were employed for testing. Tage tuff was obtained from Tochigi Prefecture, Japan. It mainly contains albite, feldspar, and small amounts of calcite. Yibin granite was obtained from Yibin, Sichuan, China. The main components are quartz, feldspar, and mica. All specimens were shaped into cylinders with a diameter of 25 mm and a height of 50 mm. The flatness, verticality, and parallelism of specimens satisfied the requirements of the International Society for Rock Mechanics (ISRM). The test machine was the same as that reported by Tang et al. (2019). The basic physical and mechanical properties of Tage tuff and Yinbin granite were presented in Table 1.
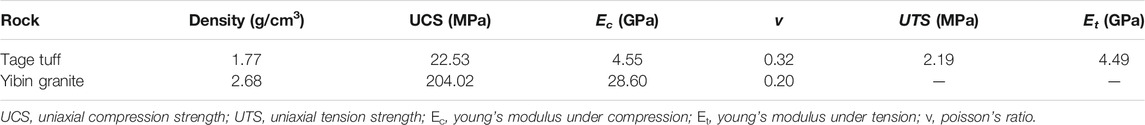
TABLE 1. Physicomechanical properties of the specimens.
Testing Method
In this study, uniaxial compression, triaxial compression, and uniaxial tension tests were performed. The test methods for uniaxial and triaxial compression were the same as those reported by Tang et al. (2019). For uniaxial tension, the specimens were bonded to platens using the method and test system described by Chen et al. (2020). The test system has been used successfully to investigate the direct uniaxial tension behaviors of rock materials based on different stress paths (Okubo et al., 2006; Hashiba et al., 2017).
As shown in Figure 1, stress increased from point O to the SPT (point A) with a constant strain rate of 10–5/s during compression tests and 10–6/s during tension tests. During uniaxial compression, the stress levels (stress of SPT/peak strength) for Tage tuff were set to 50, 80, 100, and 50% in the post-failure region. For generalized relaxation tests, seven values of α (3, ∞, −3, −1, −0.3, 0, 0.3) were chosen and distributed into the five regions shown in Figure 1. To perform generalized relaxation tests under confining pressure of 3 MPa, three stress levels (50, 80, 95%) and five values of α (α = 3, ∞, −3, 0, 0.3) were chosen for triaxial compression. Both compressive tests lasted 105 s. For uniaxial tension, it is difficult to carry out generalized relaxation tests. Thus, stress levels (30, 50, 70%) are lower than in compression, and the test continued for 104 s. To obtain complete curves of generalized relaxation, Yinbin granite was tested with a high-stress level (92%) of SPT and three values of α (∞, −3, −1) and continued until rock failure.
Results
Typical Generalized Relaxation Results
A typical result of generalized relaxation of Tage tuff is shown in Figure 4, which was conducted under a stress level of 50% in uniaxial (0 MPa) and triaxial (3 MPa) compression. The two solid lines were stress–strain curves, with SPT stress and strain set to zero. At various times, the open squares and circles are locations of generalized relaxation. The location of stress and strain in creep moved from SPT to the right, while it moved from SPT to bottom in relaxation. For other directions, the locations moved in a pattern similar to that shown in Figure 1. The evolution of stress and strain in different directions (values of α) reflected the rheological properties of the generalized relaxation of rocks. Therefore, it indicated that generalized relaxation, like conventional creep and relaxation, belongs to rheology categories.
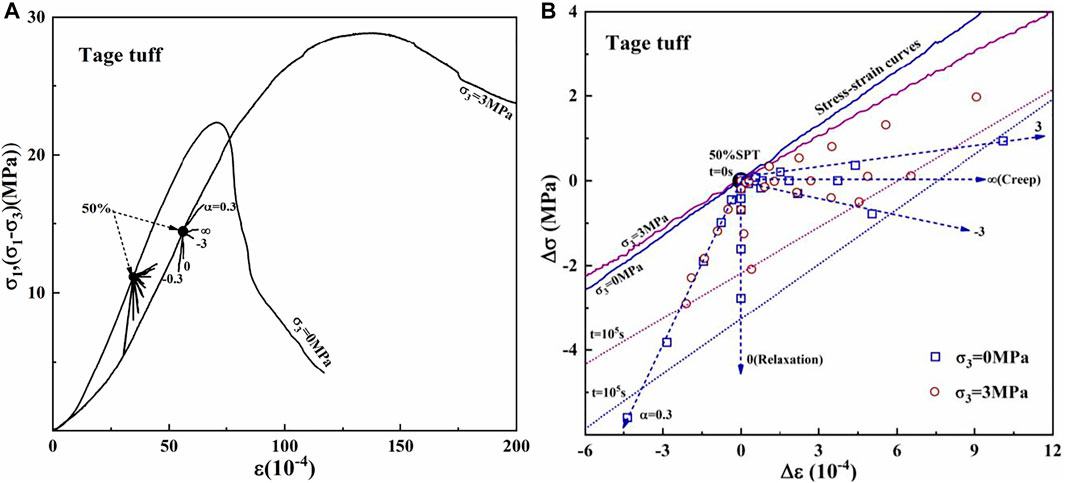
FIGURE 4. Generalized relaxation test results for Tage tuff (A) The location of stress and strain at 50% stress level under uniaxial and triaxial compression. (B) The larger result of left diagram, SPT of stress and strain at t = 0 s set to zero.
Furthermore, the movement distance represented a variety of generalized relaxation. The distances of movement at the same time were greater in the upper-right, and lower left directions for a given confining pressure than in the lower-right direction. For a given direction, the distances of α = 3, ∞, −3 under triaxial compression were greater than those under uniaxial compression, which is consistent with the evolution of creep under various confining pressures (Maranini and Brignoli, 1999; Fabre and Pellet, 2006). The distance of α = 0.3 was smaller under triaxial compression than under uniaxial compression, corresponding to the evolution of relaxation under different confining pressures. In conjunction with Figure 1, it can be seen that increasing confining pressure promoted the evolution of generalized relaxation in regions I and II while suppressing it in region II, which is similar to the effect of confining pressure on creep and relaxation, respectively. The statistics for the test results will be presented in the following section. In practice, supporting or stability analysis should consider the time-dependency of the surrounding rock. It is critical to confirm the tendency of rock stress and strain to vary with time. Then to save support time and cost, design the support system in the direction of generalized relaxation.
Figures 5A–C shows generalized relaxation test results of Tage tuff in uniaxial compression, uniaxial tension, and triaxial compression. The solid lines were complete stress–strain curves under different conditions. The dotted points are locations of stress and strain at different values of α and stress levels after test time. The dashed lines are isochronous curves obtained by fitting the dotted points at the same time. From a global perspective, isochronous curves were coincided with and enclosed within stress–strain curves. By performing several tests, the isochronous curve described rheological behaviors and roughly estimated the rheological location of rocks under different stress levels and directions of generalized relaxation.
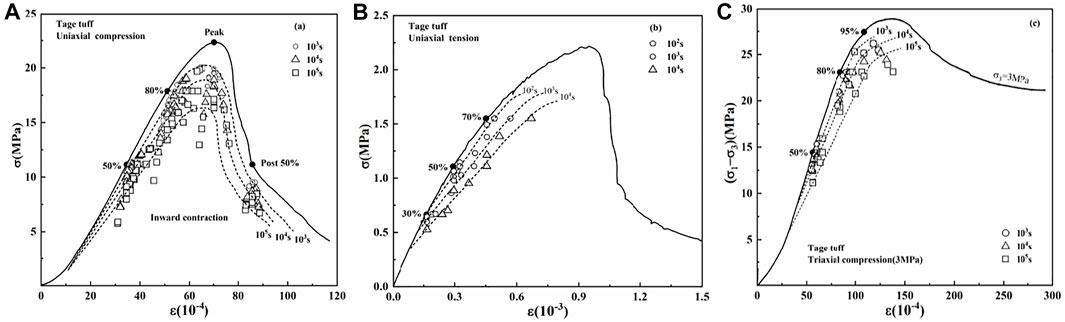
FIGURE 5. Isochronous curves of Tage tuff at (A) 50%, 80%, peak and post 50% stress levels under uniaxial compression. (B) 30, 50, 70% stress levels under uniaxial tension. (C) 50, 80, 95% stress levels under triaxial compression.
Variation of Stress and Strain in Generalized Relaxation
In creep, stress was constant while strain increased, whereas in relaxation, the strain was constant, and stress decreased. Extending to generalized relaxation, both stress and strain varied with time in different directions. Figure 6 showed the variation of strain (∆ε) and stress (∆σ) in uniaxial compression at 104 s under various stress levels. Both ∆ε and ∆σ increased as stress levels increased in the pre-peak region. The effect of stress level on ∆ε is more obvious than on ∆σ. According to Paraskevopoulou et al. (2017), the time-dependent behavior of rock is exhibited depending on the initial stress condition, which reflects crack propagation status. In other words, crack initiation and propagation are crucial in understanding time-dependent behavior processes. The investigation of progressive rock failure revealed that crack initiation stress (CI) and damage stress (CD) was about 45 and 80% of peak stress (Pepe et al., 2018). When applied stress exceeded CI, microcracks propagated stably. Stress above CD causes microcracks to grow in an unstable manner and inelastic strain to accelerate quickly. As a result, the variation of generalized relaxation in Figure 7 increased as stress levels increased.
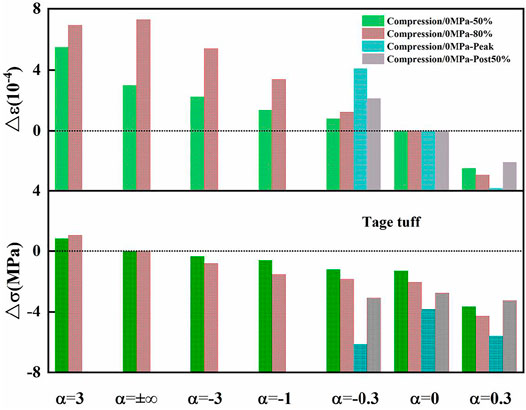
FIGURE 6. The relationship between ∆σ, ∆ε, and α of Tage tuff at 104 s under uniaxial compression of different stress levels. The solid points are variations of strain, and the dotted points are variations of stress.
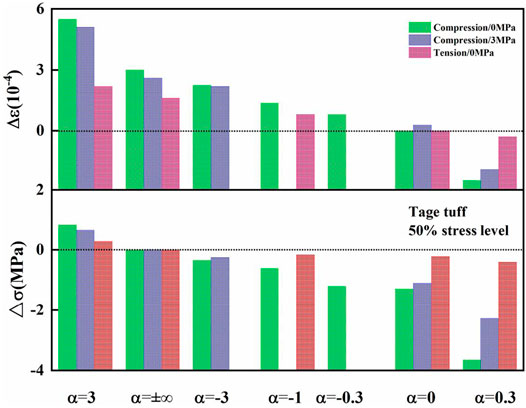
FIGURE 7. The relationship between ∆σ, ∆ε and α of Tage tuff at 104 s under uniaxial compression, tension, and triaxial compression for 50% stress level.
Figure 7 shows variations of ∆ε and ∆σ of generalized relaxation at the same stress level in uniaxial compression, triaxial compression, and uniaxial tension. For a certain α, both ∆ε and ∆σ in uniaxial tension are smaller than in compression. This was because the tension strength of rock is typically lower than the compression strength. For a given loading condition, ∆ε and ∆σ of regions I (α = 3) and III (α = 0.3, native variations of stress and strain) are greater than those of region II (α = −3−1, −0.3), as discussed in the preceding section.
Complete Generalized Relaxation Curve of Brittle Rock
The complete creep curve (strain vs. time) is well known to be divided into three stages: primary (strain rate decrease), secondary (strain rate steady), and tertiary (strain rate accelerate until rock failure) (Okubo et al., 1991). The relaxation curve is also divided into three stages: primary (stress rate decrease), secondary (strain rate steady), and tertiary (stress reaches an asymptote and stress relaxation process is effectively completed) (Paraskevopoulou et al., 2017). Based on the findings of the preceding study, the authors assumed that the complete generalized relaxation curve should be divided into three stages as well. However, it is difficult to obtain a complete curve of generalized relaxation of Tage tuff because it is a soft rock. Hashiba et al. (2020) conducted a 20-year creep test with Tage tuff, and the specimen did not fail. To verify this assumption, Yibin granite was subjected to a generalized relaxation test (α = ∞, −3, −1) at a stress level of 92% in uniaxial compression. Figure 8A shows the test results along with the stress–strain curve. As time elapsed, the generalized relaxation locations moved from the start point to the right and eventually intersected with the stress–strain curve in the post-failure region, resulting in rock burst, as shown in red circle. Failure life (tf) was regarded as the time of location movement. The failure times of α = ∞, α = −3, α = −1 were 400 s, 730 and 820 s, respectively. Figure 8B shows the complete stress and strain curves at time α = −3. From the point of origin to the point of rock failure, three stages were obtained. The first stage of generalized relaxation occurs when strain increases and stress decreases at a decreasing rate during generalized relaxation of α = −3. At the end of this stage, the strain and stress increase and decrease approach a constant rate, signaling the start of the second stage. The strain and stress then rapidly increase and decrease until rock failure, which was defined as the third stage of generalized relaxation. The boundary between the first and second stages was not obvious due to the high stress level of the test. The locations in the red circle could be regarded as the boundary of the second and third stages or the starting point of the rock burst.
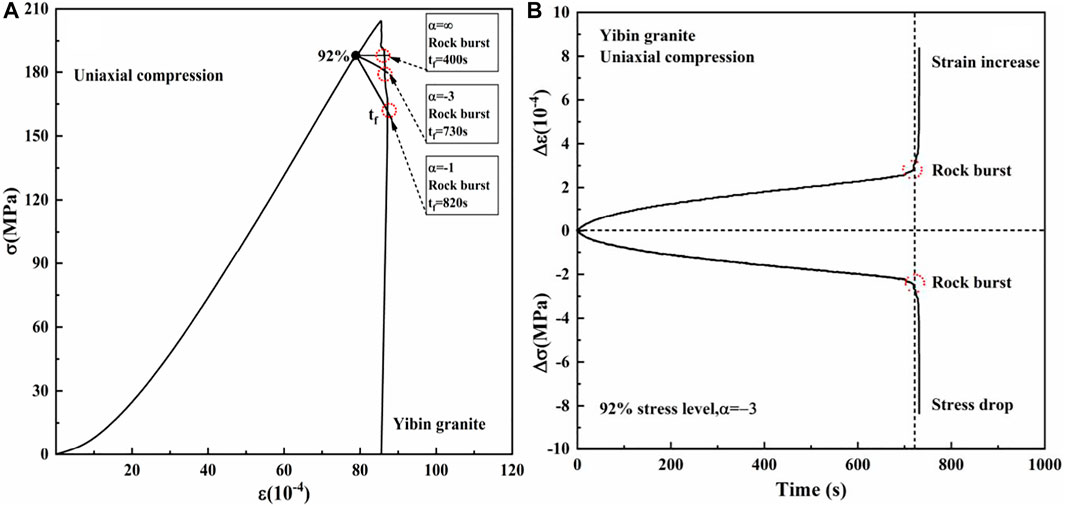
FIGURE 8. Complete generalized relaxation curves of granite: (A) Generalized relaxation behaviors of granite, (B) ∆σ and ∆ε varied with time of α = −3.
Discussion
The rheological failure models according to generalized relaxation behavior were shown in Figure 9. For Class I rocks, generalized relaxation curves intersect with the two stress–strain curves in the region I (1 < α < ∞), region II (−∞ < α < 0), and creep direction (α = ±∞), indicating rock failure near intersection points. However, the two curves do not intersect in region III (0 < α < 1) or relaxation direction (α = 0), indicating that rock failure will not occur. For Class II rocks, intersection points are observed in regions I, II, and the creep direction (α = ±∞). At higher stress levels, intersection points appear in region III (0 < α < 1) and the relaxation direction (α = 0). As a result, rock burst may occur in Class II rocks in these regions. This theory has already been validated by generalized relaxation testing of granite, implying yet another novel finding from this study. Generalized relaxation time from the starting point to the intersection points is the failure life. Class II rocks had a shorter failure life than Class I rocks. However, the rock will break to failure at the intersection, many experimental datas for different rocks are necessary to verify the phenomenon. In practical engineering, the location of stress and strain in the supporting in mine roadway simulataneously change with the lapse of time, the variation law of tunnel surrounding rock, the rockburst in deep well engineering, and landslide of rock slope are coincide with generalized relaxation behaviors. Future research should focus on the relationship between failure life and long-term strength and the prediction of failure life using constitutive equations.
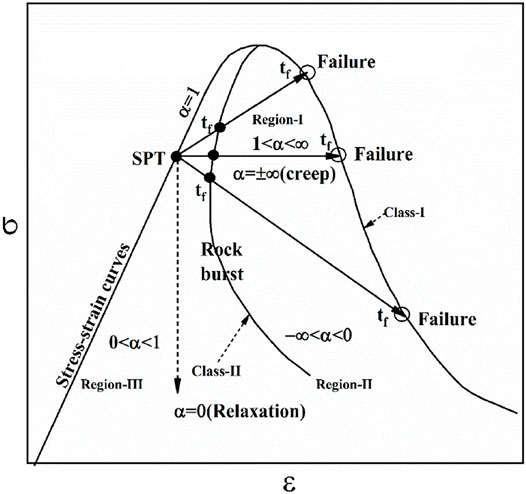
FIGURE 9. Rheological failure of Class I and II rocks.
Conclusion
The generalized relaxation of rock is the simultaneous change in stress and strain during rheology. A generalized relaxation test represents an extension of the behavior observed in conventional creep and relaxation tests. This study described the generalized relaxation behavior of two types of rocks and introduced the test method. The following are the main conclusions.
1) Variable-resistance technology was used to propose a control method involving a constant linear combination of stress and strain. The proposed controlling method can be used to simulate the generalized relaxation behavior of rocks.
2) Isochronous curves were enclosed within stress–strain curves for generalized relaxation. The isochronous curves were found to potentially decline with time along all stress–strain curves, which is a novel finding of this study.
3) Generalized relaxation curves were nearly identical under uniaxial compressive, tensile, and triaxial compressive conditions. Under different loading conditions, the rocks exhibited the same time dependency. Furthermore, the effects of stress level, confining pressure, and α values were discussed.
4) Three stages of time-dependent behavior were observed in generalized relaxation tests of different directions, which are similar to creep and relaxation results.
Data Availability Statement
The original contributions presented in the study are included in the article/Supplementary Material, further inquiries can be directed to the corresponding author.
Author Contributions
Each author has contributed to the present paper. HZ, YT, and SO conceived and designed the experiments; CC and SP performed the experiments and analyzed the experimental data. All authors have read and agreed to the published version of the manuscript.
Funding
This research was funded by the Natural Science Foundation of Chongqing, China (cstc2019jcyj-msxmX0488, cstc2021jcyj-msxmX0354), the Science and Technology Research Program of Chongqing Municipal Education Commission (KJQN201901338), and China Postdoctoral Science Foundation (2021M693751) for financial support.
Conflict of Interest
Author HZ was employed by China Construction Seventh Engineering Division Corp., Ltd.
The remaining authors declare that the research was conducted in the absence of any commercial or financial relationships that could be construed as a potential conflict of interest.
Publisher’s Note
All claims expressed in this article are solely those of the authors and do not necessarily represent those of their affiliated organizations, or those of the publisher, the editors and the reviewers. Any product that may be evaluated in this article, or claim that may be made by its manufacturer, is not guaranteed or endorsed by the publisher.
References
Chen, C., Xu, J., Okubo, S., and Peng, S. (2020). Damage Evolution of Tuff under Cyclic Tension-Compression Loading Based on 3D Digital Image Correlation. Eng. Geology. 275, 105736. doi:10.1016/j.enggeo.2020.105736
Fabre, G., and Pellet, F. (2006). Creep and Time-dependent Damage in Argillaceous Rocks. Int. J. Rock Mech. Mining Sci. 43 (6), 950–960. doi:10.1016/j.ijrmms.2006.02.004
Fan, J., Liu, W., Jiang, D., Chen, J., Tiedeu, W. N., and Daemen, J. J. K. (2020). Time Interval Effect in Triaxial Discontinuous Cyclic Compression Tests and Simulations for the Residual Stress in Rock Salt. Rock Mech. Rock Eng. 53 (9), 4061–4076. doi:10.1007/s00603-020-02150-y
Feng, X.-T., Pei, S.-F., Jiang, Q., Zhou, Y.-Y., Li, S.-J., and Yao, Z.-B. (2017). Deep Fracturing of the Hard Rock Surrounding a Large Underground Cavern Subjected to High Geostress: In Situ Observation and Mechanism Analysis. Rock Mech. Rock Eng. 50 (8), 2155–2175. doi:10.1007/s00603-017-1220-4
Fukui, K., Okubo, S., and Nishimatsu, Y. (1992). Generalized Relaxation Behaviour of Rock under Uniaxial Compression. Shigen-to-Sozai(journal Mining Mater. Process. Inst. Japan) 108 (7), 543–548. doi:10.2473/shigentosozai.108.543
Hashiba, K., Fukui, K., and Kataoka, M. (2019). Effects of Water Saturation on the Strength and Loading-Rate Dependence of Andesite. Int. J. Rock Mech. Mining Sci. 117, 142–149. doi:10.1016/j.ijrmms.2019.03.023
Hashiba, K., and Fukui, K. (2016). Time-Dependent Behaviors of Granite: Loading-Rate Dependence, Creep, and Relaxation. Rock Mech. Rock Eng. 49 (7), 2569–2580. doi:10.1007/s00603-016-0952-x
Hashiba, K., and Fukui, K. (2020). Twenty-Year Creep Test with Tuff under Uniaxial Compression. Geotech. Test. J. 43 (3), 20180358. doi:10.1520/gtj20180358
Hashiba, K., Okada, T., Tani, K., Shirasagi, S., Hayano, K., Nakamura, T., et al. (2017). Literature Survey and Experimental Study on the Direct Tension Test on Rocks. Geotech. Test. J. 40 (2), 20160201. doi:10.1520/gtj20160201
Lu, H., and Zhao, Z. (2016). Creep Properties and a Creep Equation of Delay Outburst Coal and its Adjacent Mudstone. Int. J. Mining Sci. Tech. 26 (6), 1161–1167. doi:10.1016/j.ijmst.2016.09.027
Maranini, E., and Brignoli, M. (1999). Creep Behaviour of a Weak Rock: Experimental Characterization. Internation J. Rock Mech. Mining Sci. 36 (1), 27–138. doi:10.1016/s0148-9062(98)00171-5
Okubo, S., Hailong, Z., Jiang, X., Hashiba, K., and Fukui, K. (2014). Numerical Simulation on Generalized Relaxation of Sanjome Andesite. J. Mining Mater. Process. Inst. Jpn. 130 (8), 428–433. doi:10.2473/journalofmmij.130.428
Okubo, S., Fukui, K., and Qi, Q. (2006). Uniaxial Compression and Tension Tests of Anthracite and Loading Rate Dependence of Peak Strength. Int. J. Coal Geology. 68 (3), 196–204. doi:10.1016/j.coal.2006.02.004
Okubo, S., Nishimatsu, Y., and Fukui, K. (1991). Complete Creep Curves under Uniaxial Compression. Int. J. Rock Mech. Mining Sci. Geomechanics Abstr. 28 (1), 77–82. doi:10.1016/0148-9062(91)93235-x
Okubo, S., and Nishimatsu, Y. (1985). Uniaxial Compression Testing Using a Linear Combination of Stress and Strain as the Control Variable. Int. J. Rock Mech. Mining Sci. Geomechanics Abstr. 22 (5), 323–330. doi:10.1016/0148-9062(85)92064-9
Paraskevopoulou, C., Perras, M., Diederichs, M., Amann, F., Löw, S., Lam, T., et al. (2017). The Three Stages of Stress Relaxation - Observations for the Time-dependent Behaviour of Brittle Rocks Based on Laboratory Testing. Eng. Geology. 216, 56–75. doi:10.1016/j.enggeo.2016.11.010
Pepe, G., Mineo, S., Pappalardo, G., and Cevasco, A. (2018). Relation between Crack Initiation-Damage Stress Thresholds and Failure Strength of Intact Rock. Bull. Eng. Geology. Environ. 77 (4), 709–724. doi:10.1007/s10064-017-1172-7
Tang, Y., Okubo, S., Xu, J., and Peng, S. (2019). Progressive Failure Behaviors and Crack Evolution of Rocks under Triaxial Compression by 3D Digital Image Correlation. Eng. Geology. 249, 172–185. doi:10.1016/j.enggeo.2018.12.026
Wallis, D., Hansen, L. N., Wilkinson, A. J., and Lebensohn, R. A. (2021). Dislocation Interactions in Olivine Control Postseismic Creep of the Upper Mantle. Nat. Commun. 12 (1), 3496. doi:10.1038/s41467-021-23633-8
Wang, J., Zhang, Q., Song, Z., and Zhang, Y. (2020). Creep Properties and Damage Constitutive Model of Salt Rock under Uniaxial Compression. Int. J. Damage Mech. 29 (6), 902–922. doi:10.1177/1056789519891768
Wang, J., Zhang, Q., Song, Z., Zhang, Y., and Liu, X. (2021a). Mechanical Properties and Damage Constitutive Model for Uniaxial Compression of Salt Rock at Different Loading Rates. Int. J. Damage Mech. 30 (5), 739–763. doi:10.1177/1056789520983868
Wang, Y., Cong, L., Yin, X., Yang, X., Zhang, B., and Xiong, W. (2021b). Creep Behaviour of Saturated Purple Mudstone under Triaxial Compression. Eng. Geology. 288, 106159. doi:10.1016/j.enggeo.2021.106159
Wawersik, W. R., and Fairhurst, C. (1970). A Study of Brittle Rock Fracture in Laboratory Compression Experiments. Int. J. Rock Mech. Mining Sci. Geomechanics Abstr. 7 (5), 561–575. doi:10.1016/0148-9062(70)90007-0
Xu, J., Song, X. Z., Peng, S. J., Chen, C. C., Ran, X. M., Yan, F. Z., et al. (2021). Experimental Study of Generalized Stress Relaxation of Rock Based on 3D-DIC Technology. Rock Soil Mech. 42 (1), 27–37.
Yu, J., Ren, C., Cai, Y., Yao, W., and Liu, X. (2021a). Analytical Approach for Evaluating the Dynamic Self-Bearing Capacity of Tunnels. Int. J. Geomechanics 21 (8), 04021133. (online). doi:10.1061/(asce)gm.1943-5622.0002097
Yu, J., Zhu, Y., Yao, W., Liu, X., Ren, C., Cai, Y., et al. (2021b). Stress Relaxation Behaviour of marble under Cyclic Weak Disturbance and Confining Pressures. Measurement 182 (182), 109777. doi:10.1016/j.measurement.2021.109777
Zhang, Y., Shao, J., Xu, W., and Jia, Y. (2016). Time-Dependent Behavior of Cataclastic Rocks in a Multi-Loading Triaxial Creep Test. Rock Mech. Rock Eng. 49 (9), 3793–3803. doi:10.1007/s00603-016-0948-6
Zhao, J., Feng, X.-T., Zhang, X., and Yang, C. (2019). Brittle and Ductile Creep Behavior of Jinping marble under True Triaxial Stress. Eng. Geology. 258, 105157. doi:10.1016/j.enggeo.2019.105157
Keywords: generalized relaxation, time-dependency, isochronous curve, creep, relaxation
Citation: Zhang H, Tang Y, Okubo S, Peng S and Chen C (2021) Generalized Relaxation Behavior of Rock Under Various Loading Conditions Using a Constant Linear Combination of Stress and Strain. Front. Earth Sci. 9:769621. doi: 10.3389/feart.2021.769621
Received: 02 September 2021; Accepted: 08 October 2021;
Published: 21 October 2021.
Edited by:
Junbao Wang, Xi’an University of Architecture and Technology, ChinaReviewed by:
Jin Yu, Huaqiao University, ChinaChaolin Zhang, China University of Mining and Technology, China
Copyright © 2021 Zhang, Tang, Okubo, Peng and Chen. This is an open-access article distributed under the terms of the Creative Commons Attribution License (CC BY). The use, distribution or reproduction in other forums is permitted, provided the original author(s) and the copyright owner(s) are credited and that the original publication in this journal is cited, in accordance with accepted academic practice. No use, distribution or reproduction is permitted which does not comply with these terms.
*Correspondence: Yang Tang, dGFuZ3lhbmdjaGluYUBjcXd1LmVkdS5jbg==