Automatic Detection of Slow Slip Events Using the PICCA: Application to Chilean GNSS Data
- 1Department of Geophysics, FCFM, University of Concepción, Concepción, Chile
- 2Department of Geophysics, FCFM, University of Chile, Santiago, Chile
- 3GFZ Helmholtz Centre Potsdam, German Research Centre for Geosciences, Potsdam, Germany
- 4Department of Civil Engineering, Universidad Católica de la Santísima Concepción, Concepción, Chile
The detection of transient events related to slow earthquakes in GNSS positional time series is key to understanding seismogenic processes in subduction zones. Here, we present a novel Principal and Independent Components Correlation Analysis (PICCA) method that allows for the temporal and spatial detection of transient signals. The PICCA is based on an optimal combination of the principal (PCA) and independent component analysis (ICA) of positional time series of a GNSS network. We assume that the transient signal is mostly contained in one of the principal or independent components. To detect the transient, we applied a method where correlations between sliding windows of each PCA/ICA component and each time series are calculated, obtaining the stations affected by the slow slip event and the onset time from the resulting correlation peaks. We first tested and calibrated the method using synthetic signals from slow earthquakes of different magnitudes and durations and modelled their effect in the network of GNSS stations in Chile. Then, we analyzed three transient events related to slow earthquakes recorded in Chile, in the areas of Iquique, Copiapó, and Valparaíso. For synthetic data, a 150 days event was detected using the PCA-based method, while a 3 days event was detected using the ICA-based method. For the real data, a long-term transient was detected by PCA, while a 16 days transient was detected by ICA. It is concluded that simultaneous use of both signal separation methods (PICCA) is more effective when searching for transient events. The PCA method is more useful for long-term events, while the ICA method is better suited to recognize events of short duration. PICCA is a promising tool to detect transients of different characteristics in GNSS time series, which will be used in a next stage to generate a catalog of SSEs in Chile.
Introduction
Transient deformation is broadly defined as deformation that is not associated with traditional earthquakes (e.g., Dragert et al., 2001), manifested by a departure from the steady interseismic landward motion in GNSS time series (see Bürgmann, 2018 and many references therein). Such unusual motions may be evidence of a slow, transient aseismic release of stresses along a fault, commonly known as slow slip events (SSEs) which can involve centimeters to tens of centimeters of fault movement over days to years. Aseismic deformation transients have been observed in many subduction zones worldwide, including Japan (Hirose et al., 1999), Alaska-Aleutian (Freymueller et al., 2002), Guerrero, Mexico (Lowry et al., 2001), Hikurangi, New Zealand (Wallace and Beavan, 2006), and Chile (Klein et al., 2018). Given the now numerous examples of slow slip worldwide in subduction zones, it is currently thought that slow slip can be accompanied by a series of small earthquakes or tremors, or even loading adjacent locked sections, potentially considered as precursory activity, when a larger seismic event follows (e.g., Ruiz et al., 2014; Schurr et al., 2014; Socquet et al., 2017). Thus, there is a growing interest in the geodetic community for detecting transient deformations and automating the process, given their role in seismic hazard assessment. However, identification of transients in GNSS time series is difficult, as are intermixed with other (typically larger) tectonic signals, as well as those related to hydrological loading effects, instability or modification of GNSS monumentation and common noises such as reference frame realization errors, thus requiring sophisticated signal processing techniques (e.g., McGuire and Segall, 2003).
Although various techniques have been developed for automated detection of transients in GNSS time series (e.g., Riel et al., 2014), it is still non-trivial to robustly detect such events and thus characterize their nature. Trajectory models composed of sub-models that represent secular trends, annual oscillations, jumps in coordinate, and postseismic decays are traditionally used to characterize GNSS-derived displacement time series (e.g., Bevis and Brown, 2014). These models characterize reasonably well the main sources of displacements affecting GNSS stations. However, the trajectory model is based on known permanent functions, with predefined information, such as the time of jumps (i.e., discontinuities in the time series) due to antenna changes or earthquake occurrence, and the decay time of post-seismic deformation following great earthquakes. Thus, making it difficult to identify transient motions of unknown magnitude and duration, since their patterns may be not obvious and possibly hidden in the noise within the residuals of the trajectory models. Bedford and Bevis (2018) updated the trajectory model to be able to identify multi-transients as the sum of two or more decaying functions with different characteristic time scales and identical onset times. In this approach, all non-stationary, secular and noise shift signals are fitted by the sum of two or more simple exponential decay functions, which characterize transient signals. Crowell et al. (2016) proposed using the relative strength index (RSI), a financial momentum oscillator, for single-station automated transient detection, which provides information on the spatial extent and duration of those events. Other techniques to extract the signal corresponding to transient motions in GNSS series include the use of different filters based on physical models that take into consideration fault-slip evolution (e.g., the network inversion filter NIF; McGuire and Segall, 2003, and the Network Strain Filter NSF; Ohtani, et al., 2010). The NIF and the NSF are based on a time domain (Kalman) filter that analyzes all data from a network simultaneously exploring stochastically a combination of a secular velocity, slip on faults, benchmark motions, reference frame errors, and estimation errors. GNSS networks time series can be decomposed into a set of temporally varying modes and their spatial responses using the principal component analysis (PCA) or independent component analysis (ICA) (e.g., Dong et al., 2006; Kositsky and Avouac, 2010; Gualandi et al., 2016). These are multivariate statistical data techniques that do not require physical models of processes to detect any transient motion on GNSS position time series. Time-series analysis shows that spatially correlated noise, described as common mode error (CME), affects regional networks (Dong et al., 2006), which can be easily confused with transient events when single-GNSS stations are analyzed. Along with the noise affecting the determination of station positions, the robust detection of millimeter magnitude transients is affected by data gaps in many stations, local non-tectonic deformation as well as the distance between GNSS stations and slip source. All these factors imply that there is still room for improvement in the transient detection techniques, testing the pros and cons of different methods, and re-analyzing some documented transient events with the aim to improve their characterization and interpretation.
SSEs are considered important because of their impact on energy release in the seismic cycle of large earthquakes. Slow earthquakes have a wide range of temporal and spatial behaviors; they can last from days to several decades and affect the upper (updip, e.g., Wallace et al., 2016; Davis et al., 2015) and lower (downdip; e.g., Dragert et al., 2004; Radiguet et al., 2016; Klein et al., 2018) limits of the seismogenic zone, delineating the extent of the locked fault portion. Slow earthquakes can be symptoms of decoupling in the seismogenic zone and being induced or triggered by seismicity (e.g., Ruiz et al., 2014; Schurr et al., 2014). Over periods of several years these events can be recorded as temporal and spatial variations in the degree of locking (e.g., Frank, 2016). On finer time scales (days to months), observations of SSEs are more complex, being associated with mixed anomalous seismicity (Bedford et al., 2015; Jolivet and Frank, 2020). A reliable identification of such events at different spatial and temporal scales in seismic and geodetic data will provide new insights into the physics of strain accumulation and release at subduction zones, as well as for developing new seismic hazard monitoring techniques.
The GNSS network in Chile offers a good spatial coverage (>120 continuous stations, Baez et al., 2018) spanning more than a decade of observations (Figure 1). However, the long Chilean megathrust is one of the only subduction zones where only few SSEs have been documented. So far, only one SSE (potentially lasting several years) in a mature seismic gap (Klein et al., 2018) and two other cases associated with foreshock activity before major events have been described (e.g., Ruiz et al., 2014; Schurr et al., 2014; Ruiz et al., 2017; Socquet et al., 2017; Ruiz et al., 2019). Hence, the upcoming challenge is being able to quantify SSEs of low magnitude in a more automated and robust way so that we can better mosaic how the main subduction fault in Chile is evolving over time.
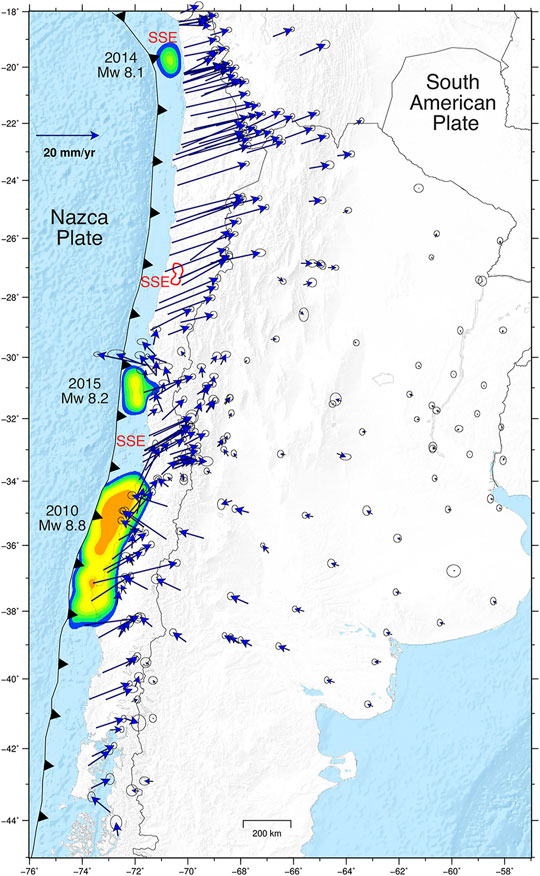
FIGURE 1. Tectonic setting and GNSS-derived velocities between 2018 and 2021 along the subduction zone of Chile. The coseismic slip from earthquakes that occurred in 2010, 2014 and 2015 are shown.The blue arrows are the velocities with respect to South America (labeled in mm/yr; 1σ error ellipses are shown), obtained using the trajectory model of Bevis and Brown (2014). The positions of the 3 main SSEs registered in Chile (Schurr et al., 2014; Ruiz et al., 2017; Klein et al., 2018) are shown (in red).
In this manuscript, we present the Principal and Independent Components Correlation Analysis (PICCA) algorithm, a combination of PCA and ICA techniques that allows automatic detection of transient events in a network of GNSS stations. We first provide a detailed description of our detection method. Then, to calibrate our method, we build synthetic surface-displacement time series for slow slips of various durations, including realistic realizations of uncertainties, velocities, and seasonal motions (Carr Agnew, 2013) for the GNSS network in Chile. Subsequently, we demonstrate the detection capability of our method to automatically identify previously documented slow slip events in Chile. Finally, we discuss the efficacy of our method for accurately identifying the location, onset time and duration of SSEs in Chile.
Chile’s subduction zone was struck by three major events within only 5 years: The 2010 Maule (MW = 8.8), 2014 Iquique (MW = 8.1) and 2015 Illapel (MW = 8.2) earthquakes (Figure 1). These earthquakes induced a complex deformation field with continental-scale spatiotemporal variations in magnitude and direction of surface displacements. GNSS station velocities in 2018–2021 (based on time series from Nevada Laboratory Geodetic Lab, Blewitt et al., 2018, see Figure 1; Supplementary Figure S1 in the Supplementary Material) show that the current deformation along the margin is driven by the different phases of the seismic cycle. Thus, it is possible to recognize the interseismic deformation patterns in many areas of the margin, such as in northern (29°S–18°S), central (33.5°S–32°S), and southern (39°S–45°S) Chile. Near the rupture zones of the 2015 and 2010 earthquakes, the postseismic effect induces forearc rotations and a deformation that propagates as far as Argentina. These complex displacement patterns make it difficult to recognize possible movements by analyzing cumulative displacement vectors.
In Chile, recurrent SSEs (over periods of several years) have not been clearly detected as in other subduction zones. The most robust signals attributable to SSEs have been detected in the form of precursory processes. The best record of SSEs in Chile is the transient uncoupling of the plate interface and its related foreshock sequence leading up to the 2014 (MW 8.1) Iquique earthquake (Schurr et al., 2014; Ruiz et al., 2014). GNSS stations may have accelerated 8 months before the main shock (Socquet et al., 2017), but the largest and most prominent transient signal lasted 15 days until the onset of the mainshock, reaching a cumulative displacement of ∼15 mm. The spatial and temporal proximity to the mainshock, as well as the migration pattern of the foreshock events, suggest that the foreshocks and main event were mechanically coupled. The 2015 Illapel earthquake showed similar unusual activity but with a more subtle signature, with an increase in eastward motion after the 2010 Maule earthquake (Melnick et al., 2017; Bedford and Bevis, 2018). A slow GNSS-derived motion towards the trench was detected 2 days before the 2017 MW 6.9 in Valparaiso (Ruiz et al., 2017). Nearby stations recorded a cumulative displacement of less than 10 mm in this precursory phase. However, the high noise in the time series and the complexity of the signals make such low magnitude signals easily hidden and difficult to detect automatically. The first SSE registered in Chile that is likely a recurring phenomenon, corresponds to a transient deformation signal detected between 2014 and 2016 using survey and continuous GNSS observations in the Atacama region (26°S–29°S, Figure 1) (Klein et al., 2018). Here, a deep slow slip event produces a signal at the GNSS sites characterized by uplift and horizontal trenchward motions. Moreover, similar transient signals were registered in 2005 and 2009 by a few continuous GNSS stations operating since 2002 suggesting recurrent occurrences of SSEs in such region (Klein et al., 2018). A recent analysis reported a vast continental 1,000 km-scale region alternating its sense of motion over a period of several months before the 2010 Chile earthquake (Bedford et al., 2020). This strange reversal of ground motion was also preceding the 2011 Tohoku-oki earthquake. GNSS monitoring prior to 2010 in Chile offers only sparse data. Therefore, precludes detailed and robust analysis preceding this event. Nevertheless, new data and longer times series will allow us to test the results of Bedford et al. (2020).
Method: The Principal and Independent Components Correlation Analysis Algorithm
For an automatic spatiotemporal detection of transient events in a network of GNSS stations, we implemented a novel method—The Principal and Independent Components Correlation Analysis (PICCA) algorithm - that optimally combines PCA and ICA techniques. The PICCA maximizes the correlations between the GNSS time series and the components estimated by Principal and Independent component analysis (PCA and ICA, respectively) in order to find the ones that best represent anomalous motions. This method allows for the spatial and temporal detection of the transient event by selecting the most representative PCA/ICA component and therefore identifying the onset time, duration and GNSS site where the transient occurs. In the following, we describe the two methods that were used for signal separation and their integration in our detection algorithm.
Principal Components Analysis
PCA is a linear dimensionality reduction technique that seeks projection of the data into uncorrelated (and orthogonal) directions of highest variability (Chatfield and Collins, 1980; Stone, 2004). It computes the principal components (PCs), which are the basis vectors of directions in decreasing order of variability. Thus, the first PC provides a basis vector for the direction of the highest detected variability. Then, the second PC provides the basis vector for the next direction orthogonal to the first PC, and so on follows the sub-component decomposition. Computation of PCs involves estimating the covariance matrix of the data, its eigenvalue decomposition, sorting of eigenvectors in the decreasing order of eigenvalues, and finally, a projection of the data into the new basis. Considering that our measured data consist of daily time series of a GNSS network, we can define X as the data matrix of mxn, where m is the number of stations of the network, and n the number of days of the time series. This matrix X contains only one of the three spatial components of the GNSS data (East, North or Up).
Thus, Xij corresponds to the value of X for the i-th station (i = 1…m) and the j-th day (j = 1…n). Accordingly, we can define the mx1 vector xj as the observations on the j-th day for all the m stations. To obtain the covariance matrix of X we must first compute the mean vector of the data as:
and the mxm covariance matrix C is defined by:
Let λ1, λ…λm, be the eigenvalues of C ordered so that λ1≥ λ2≥…≥ λm, and let v1, v2…vm be the correspondingly ordered eigenvectors. We can define the mxm eigenvector matrix W as:
then the spatial PCs for the j-th day are given by:
where yj is a mx1 vector representing the value of the PC for the j-th day at each GNSS station. The resulting PCs can be expressed for each day j = 1…n as a mxn matrix Y, where the first row corresponds to the first PC, the second row to the second PC, and so on, for each day with data in the GNSS time series. PCA is usually used to reduce the dimensionality of the data as well as for filtering noise, by discarding the PCs associated with the lowest eigenvalues. This can be done choosing a dimension d<m and projecting the data onto v1, v2…vd, giving the approximation:
for k = 1…n, and
where
Independent Components Analysis
The PCA technique has been used in many fields, including GNSS time-series analysis (Dong et al., 2006; Kositsky and Avouac, 2010). However, PCA finds signals which are Gaussian and uncorrelated, which means that if the transients we are looking for are not Gaussians in nature, it is most likely that PCA will not be able to represent the transient with only one PC. This problem can be handled using a complementary technique, the ICA, capable of decomposing the original data into non Gaussian signals (Gualandi et al., 2016). In simpler words, while PCA decomposes the GNSS time series into a set of orthogonal spatial and temporal components, ICA does so into components that are statistically independent, without requiring mutual orthogonality. Generally, it is assumed that each measured signal depends on several distinct source signals. Moreover, each measured signal is essentially a linear mixture of these source signals. In many cases, these source signals are of primary interest, but they are interlaced within the set of measured signals, or signal mixtures. The problem of unmixing signals is known as blind source separation (BSS), and ICA (Comon, 1994; Hyvärinen and Oja, 2000; Stone, 2004) is a specific method for performing BSS. The solution of a BSS problem is a set of source signals that explain, using a linear mixture, the available measures. This problem refers to when neither the source signals nor the mixing structure are known, and can be written in matrix form as:
where X is the matrix of measured signals x1…xm; S is the matrix of source signals s1…sm; and A the mixing matrix of the sources. Assuming that matrix A is invertible, we can write W = A −1, then Eq. 7 can be rewritten as:
The goal is then to estimate the coefficients Wij from matrix W. A solution to this problem can be found by considering the statistical independence of the source signals. In this work, we apply the algorithm called FastICA (Hyvärinen and Oja, 2000), in which the key to the solution is the use of the central limit theorem. This theorem establishes that the distribution of a sum of independent random variables tends toward a Gaussian distribution. To estimate one of the independent components (ICs), let us consider a linear combination:
where w is a vector to be determined. If we make a change of variables z = AT·w then:
Thus, y is a linear combination of the sources si. Using the central limit theorem, we can observe that y (or zT·S) is more Gaussian than any si and it becomes least Gaussian if it equals one of the si. Therefore, the task of ICA is to find a vector w that maximize the nongaussianity of y = wT·X. This vector w will necessarily correspond to a vector z with only one nonzero component, that is, y = wT·X= zTS corresponds to one of the independent components.
The main difference between ICA and PCA is that PCA decomposes a set of signal mixtures into a set of uncorrelated (orthogonal) signals, whereas ICA decomposes a set of signal mixtures into a set of statistically independent signals. Assuming that we are looking for transients that can be gaussians or non gaussians, we used in this work both techniques, in order to find the best performance for different kinds of transients, first with synthetic GNSS data and then with real data from different regions of Chile.
The Principal and Independent Components Correlation Analysis Algorithm
This detection algorithm searches for the principal or independent component - from PCA or ICA, respectively -that best represents the transient event that potentially exists within the GNSS time series. This search is performed by means of the temporal correlation between each time series and each estimated PC or IC based on the following hypothesis: the information of a transient, if it exists, is contained in at least one of the estimated PCA or ICA components. Therefore, the highest correlations between the time series and the PCA or ICA components are obtained when these components contain information of a transient event. A block diagram of the Correlation PCA/ICA-based algorithm is shown in Figure 2, which is explained in detail hereafter. The input data is composed by the daily GNSS network stations time series. This data is structured in a matrix X, with rows corresponding to the different stations in the network and the columns to the daily samples that span the full extents of the time series. The pre-processing stage (Stage 1 in Figure 2) is to apply PCA, calculate the first d PCs and recover the time series from these d PCs except the first one, that contains the secular trend or station velocity, obtaining the detrended time series for subsequent correlation with the PCs or ICs. Then, we apply ICA to obtain the corresponding ICs to correlate with the time series. As well as with PCA, we define d sources for the estimation in the ICA. We note that the correlations with the time series must be calculated using either PCA or ICA, so to obtain the results from both techniques, we apply the method twice, for PCA and for ICA, respectively.
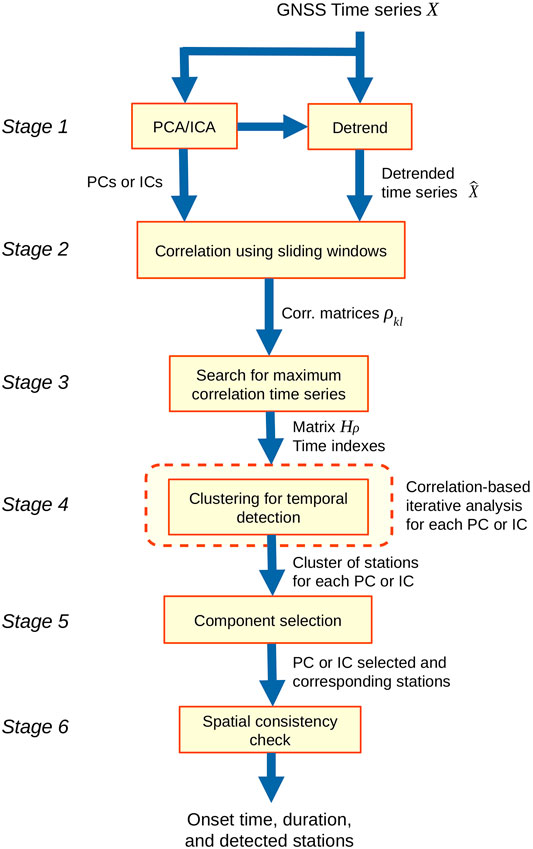
FIGURE 2. Block diagram of the Principal and Independent Components Correlation Analysis (PICCA) method for transient detection.
With all the signals preprocessed and estimated, we calculate the correlation coefficient between them (Stage 2 in Figure 2). Let
where ρkl(p,q) is the correlation coefficient between time windows Skp and
The search procedure consists of:
1. Search for the maximum value of the matrix row and set a threshold (relative to this maximum value) to consider all the correlation values above this threshold in the row. All stations with correlations below it are discarded.
2. Verify that for every result of the previous step the time index p must be equal or “almost” equal to the q value. This is referred to consider the effect of noise in the PCs or ICs and time series, so the better match can be biased by a few days. Therefore, another threshold must be defined for the difference between p and q. If the criterion is not achieved, that result is discarded.
3. For the stations selected in the previous step, those with similar time index values should be grouped together. This is done using the k-means clustering algorithm, by iterating over the number of clusters from an initial k = 2 clusters until we find a cluster whose time indexes have a standard deviation below a given threshold, which was set to 10 (days). The clusters that have standard deviations above this threshold, are discarded.
4. Select the cluster with the highest number of stations. Return to step 1 and repeat for the next PC or IC from Hρ. This ends when it is completed for all the PCs or ICs.
5. For each PC or IC and their corresponding clusters, select the component which cluster has the highest number of stations and the lowest standard deviation between their time indexes (Stage 5 in Figure 2).
6. In the selected cluster, a spatial consistency check is performed (Stage 6 in Figure 2). We used a simple criterion to discard stations in the selected cluster that might be far from the rest of the stations of the cluster. This is done discarding stations that are at a distance from the spatial centroid of the cluster greater than twice the average distance of all stations in the cluster to its centroid.
The resulting cluster is composed of stations that are spatially consistent, with a time index that corresponds approximately to the onset time of the transient, and with a duration related to the sliding window length R. This method was tested on synthetic GNSS data and then applied on real and documented slow slip events in Chile.
Performance Evaluation
To evaluate performance of the method, different values of R must be applied, in order to obtain a set of different detection results that can be evaluated through performance indexes. We use known a priori information that includes the onset time of the transient and the group of stations containing significant transient information in the region of the simulated slip. Thus, we can evaluated the error between the real onset time and the detected onset time, as well as the inclusion of the detected stations in the predefined group of stations. A normalized time error index is defined by:
and two known indexes are also used as spatial performance evaluation:
where ti is the onset time, tid is the onset time detected and n the number of days of the time series. The Terr index evaluates the error in the transient onset time detection, normalized by the total number of days in the time series. Precision and Recall are used in binary classification algorithms to evaluate the performance of the results. Since we are developing a method to detect (or not detect) transients in time and space, we can see the problem as a binary classification, so it is possible to evaluate the performance of our method using these two indexes. Here, Tp is the number of true positive cases, that is, the number of stations that contain transient information and, consistently, are correctly detected; Tn is the number of true negative cases, namely, the number of stations that do not contain transient information and are not detected. Similarly, Fp is the number of false positive cases, in other words, the number of stations that do not contain transient information but are detected; and Fn the number of false negative cases, that is, the number of stations that contain transient information but are not detected. Thus, Precision evaluates the ability to detect true positive cases over all the positive cases detected, and Recall evaluates the ability to detect true positive cases over all the real positive cases.
Synthetic GNSS Time-Series Analysis
Synthetic Data
We use synthetic and observed GNSS data in order to develop and test the PICCA algorithm. Synthetic GNSS time-series were generated based on the model proposed by Carr Agnew (2013). This model defines the position for the i-th station (i = 1…m) and the j-th day (j = 1…n) as:
where v is the velocity, r is the individual noise per station, y the seasonal component and c is the common mode noise. The first sum corresponds to the jumps or offsets in the data, however, for this work they were not considered in the analysis to simplify the complexity in the use of the proposed method. The second sum corresponds to tectonic displacements due to slips at Ε different fault patches. We generated Green’s functions for the upper boundary of the slab using the Slab 2.0 geometry (Hayes et al., 2018). We use a geometry in Cartesian coordinates for the fault extending from 18°S to 45°S. This may distort the geometry due to the sphericity of the earth. However, the modeled slow earthquakes extend over a fault zone ∼300 km long, so at this scale the use of Cartesian coordinates is appropriate. The mesh was discretized into 1,667 triangles and the surface displacements (at each station in the continuous GNSS network) were estimated using the TDdispHS, which is a triangular dislocation analytical code (Nikkhoo and Walter, 2015). These static displacements were temporally distributed to simulate slow earthquake events of varying duration and magnitude. The function used for this temporal distribution is given by:
where we choose a = 2, b = −0.5 and the time τj varies from j = 1…h, where h is the transient duration in days. In these synthetic tests, only one transient event occurring in a given time window was used and its daily offsets were added to the other components (Eq. 14) to generate the time series. Finally, D corresponds to a binary function that indicates whether i-th data is available or not (1 or 0 respectively). In order to simplify the application of the PCA and ICA separation methods, this function was considered to always have a value of 1. Thus, the model proposed in this work for the synthetic series is reduced to the following form:
An example of this model is shown in Figure 3, where a synthetic signal is generated from the five components presented in Eq. 16. The sets of synthetic data generated in this work are based on 150 GNSS stations (Figure 4) from the Nevada Geodetic Laboratory, and the three components of displacements (East, North and Up) were used. We created three synthetic datasets of daily observations, in which we used different configurations for the duration and magnitude of a slow earthquake event. The first data set (Transient No. 1) consists of a 3 years span (1,095 days) time series, with a tectonic slip of 0.05 m and a magnitude of MW 7.2, distributed in 150 days and starting on day 501 (Figures 3, 4). The second data set (Transient No. 2), with time series of 3 years span (1,095 days), a fault slip of 0.03 m and a magnitude of MW 7.0, distributed in 14 days and starting on day 1,082, simulating a precursor activity of an earthquake; and in the third data set (Transient No. 3), time series of 1-year span (365 days), with a slip of 0.03 m and a magnitude of MW 7.0, distributed in 3 days and starting on day 363, simulating a “fast” precursor activity. The complexity of the velocity field together with the noise and seasonal motions causes the 150 days-long transient signal to be hidden in the 3 years time window (Figure 4C), even for stations close to the transient event. So, even an obvious transient might not be apparent with a cumulative displacement map.
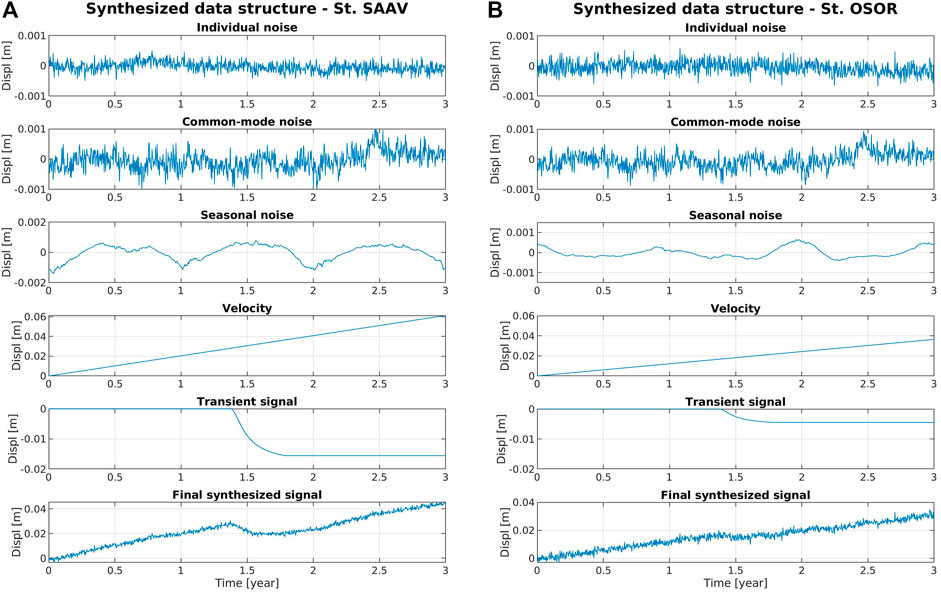
FIGURE 3. Examples of synthetic GNSS time series generation. The different components that are added together to construct the time series are shown. This example shows the EW component of a time series. Three years time series for stations SAAV (A) and OSOR (B) are shown, with an accumulated fault slip of 0.05 m during a transient of 150 days. The transient signal corresponds to the GNSS displacement, estimated from the slip model. The resulting signal (bottom) consists of the weighted sum of the first five components shown in each figure.
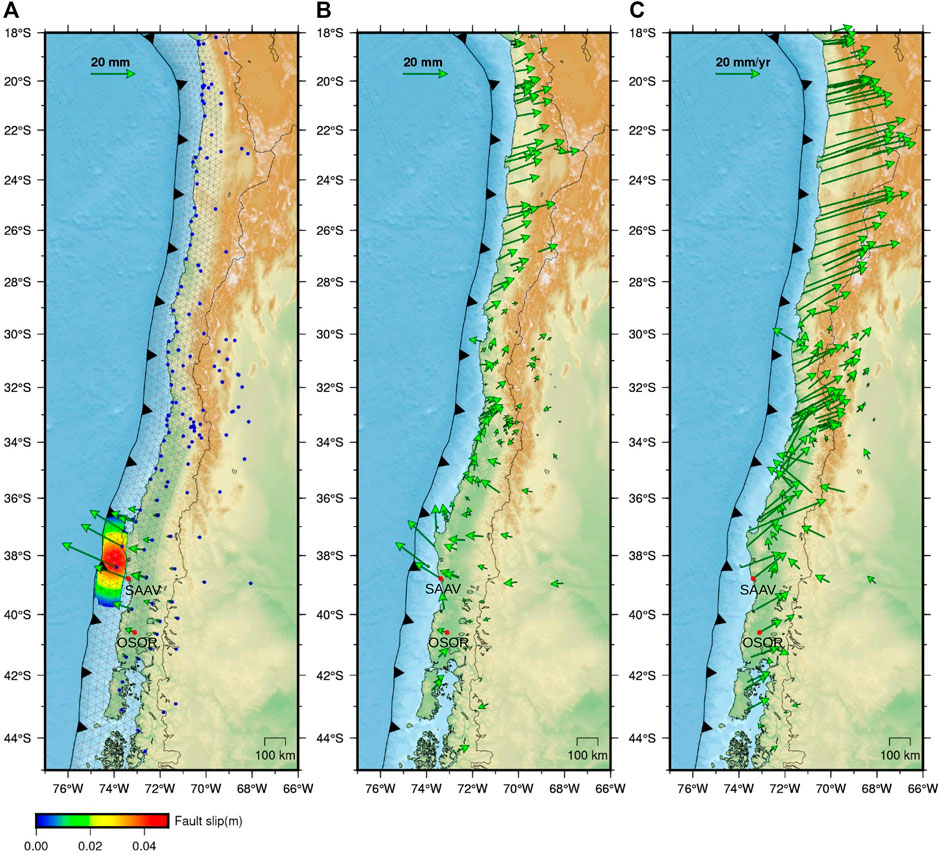
FIGURE 4. Horizontal synthetic displacements. (A) Triangular grid used for the generation of Green’s functions and cumulative slip distribution of a synthetic SSE, to estimate displacements at GNSS stations (green vectors), signal that is added to the other components to generate the synthetic series. Blue points are station locations of the network. (B) Accumulated displacements for the entire network in the 150 days of the transient duration. (C) Accumulated displacements for the entire network in the 3 years of the time series.
Results for Synthetic GNSS Time-Series
We applied the Maximum Correlation PCA/ICA-based algorithm to analyze the three synthetic datasets. For both PCA and ICA, 10 components were estimated (Supplementary Figure S2 in the Supplementary Material). We estimated the correlation matrix ρkl (Eq. 11) between each PC or IC time window and the original time series for each station. Figure 5 shows an example of the matrix ρkl of correlations for 2 cases of kl combination, stations IMCH and MAUL, using synthetic data. In Figure 5A, the highest correlation is obtained from PC 2 and the station IMCH time series window that starts on day 487. However, in Figure 5B, there are no matches between time indexes for the highest correlations, which also are lower than the values found in Figure 5A. The application of the method is shown in Supplementary Figures S3A, S3B in the Supplementary Material. In this figure, results for Transient No. 1, stage by stage, are shown based on the block diagram of Figure 2.
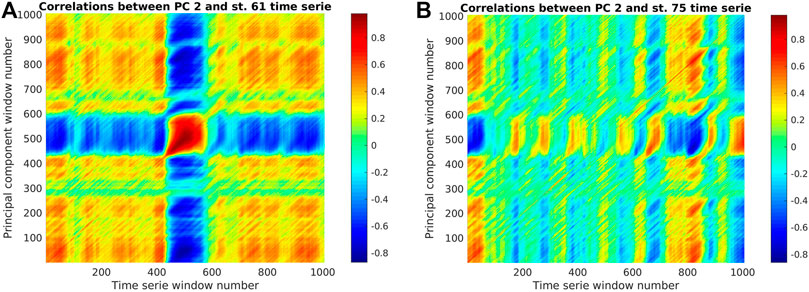
FIGURE 5. Example of correlation (ρkl, colored from -1 to 1) between PC 2 and the original time series for two stations using every time window from synthetic Transient No. 1. In (A) the plot shows a high correlation between PC 2 and the time series of station IMCH (k = 2 and l = 61). In (B) plot shows a low correlation between PC 2 and the time series of station MAUL (k = 2 and l = 75).
To analyze the results of the PICCA method on synthetic data, different values of R were considered, from 10 to 200 days, with a step of 10 days, The minimum number of days of R was selected considering the frequency of noise in the data. In Figure 6, two plots are shown for each case: the left plot is a two y-axis graph, where the left y-axis correspond to the values of the three indexes, Precision, Recall and Time error, from 0 to 1, while the right y-axis correspond to the component number, from 1 to 10. The values of the indices were calculated from the spatial and temporal results, and the plotted component is the resulting component for each value of R. The right plot corresponds to an histogram of these components for all the values of R. Table 1 shows the components from PCA and ICA that contain observable transient information for every case, showing the ability of the method to choose the component that better represents the transient analyzed.
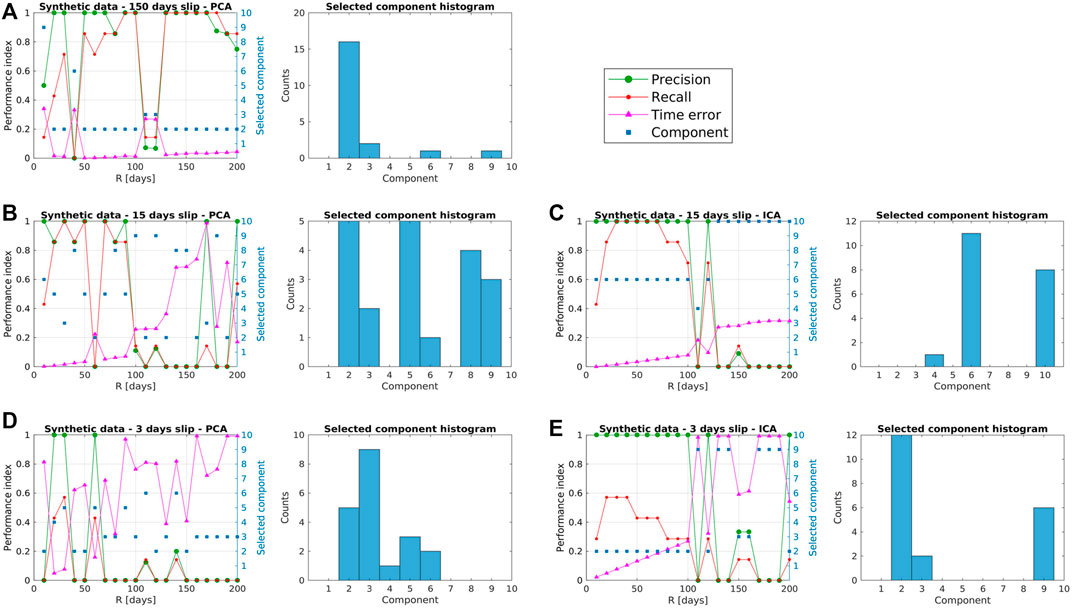
FIGURE 6. Performance evaluation for synthetic datasets. Indexes values for different window length R (left) and histogram of component selection (right). (A) Results for 150 days slip, PCA-based method. (B) Results for 15 days slip, PCA-based method. (C) Results for 15 days slip, ICA-based method. (D) Results for 3 days slip, PCA-based method. (E) Results for 3 days slip, ICA-based method.
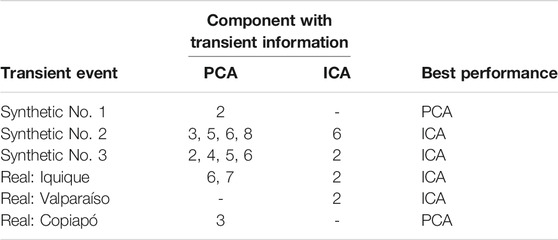
TABLE 1. Components of PCA and ICA that contain transient information, for synthetic and real events.
Transient No. 1 (Figure 6A) presents a maximum Precision and Recall for values of R of 90 and 100 days, and between 130 and 170 days. The histogram shows that PC 2 is the most selected component over the values of R, and is consistent to the Precision values, demonstrating that the component selection is correct. Also, we can observe that the time error is very low for that component selection. In Transient No. 2 the results for PCA are more ambiguous (Figure 6B), since PC 2 (incorrect component) had as many matches as PC 5 (correct component). However, the method is still capable of obtaining correct results for low values of R, where performance indexes present good results. For ICA (Figure 6C), the results are more clear, the most selected component is IC 6 and the best performances are for an R between 20 and 70 days. For Transient No. 3, similar results as those from transient No. 2 are obtained: PCA-based method (Figure 6D) results in more matches with the incorrect component (PC 3), while in ICA-based method (Figure 6E) the most selected component is IC 2, in a correct match, specially for lower values of R, consistently with the performance indexes. This suggests that PCA and ICA have different performance depending on the duration of the transient event.
From the performance evaluation, we chose the results with best performance and summarized them in Table 2. In this table we present details of transient event characteristics (duration, time analyzed) and detection results such as event onset time, duration and stations detected, for the PCA and ICA methods. For Transient No. 1, the correlations in matrix Hρ for every PC and every station (Figure 7A) show that the time series of stations IMCH and PECL have the highest correlations with the PC 2, while time series from station MAUL has low correlation (as shown in the time plot of Figure 7B). It is noted that from matrix Hρ it is quite difficult to visually establish the PC that effectively contains the transient. However, matrix Hρ is calculated only in Stage 3 of the method (see Figure 2), with 3 processing stages remaining to obtain the final result, namely, the clustering stage to detect the groups of similar time indexes, the component selection stage and the final spatial consistency stage (Supplementary Figure S3B in the Supplementary Material shows an example where these remaining stages can be more clearly understood). Time series with high correlation (Figure 7C) correspond to stations closer to the area where the simulated slip has its maximum magnitude (Figure 4B). The same analysis using ICA fails to detect correlations that would indicate the stations close to the transient event as well as its onset time. For Transient No. 2, results for the ICA-based method are shown in Figure 8. Clearly, the highest correlations are obtained from IC 6 and time series from stations IMCH, PECL, and others. Time series from station QTAY has low correlation, which is evident in the time plot in Figure 8B. The highest correlation was for the window that starts on day 1,073. In Figure 8C, time series with highest correlation clearly corresponds to the stations in the area where the simulated slip occurs. In this dataset, the PCA analysis provides similar results to ICA. The onset time of the transient event is found as the beginning of the window with the highest correlation. However, to estimate the duration of the event it is necessary to find the optimal width of the time window R, which cannot be estimated a priori. Results for Transient No. 3 are shown in Supplementary Figure S4 in Supplementary Material.
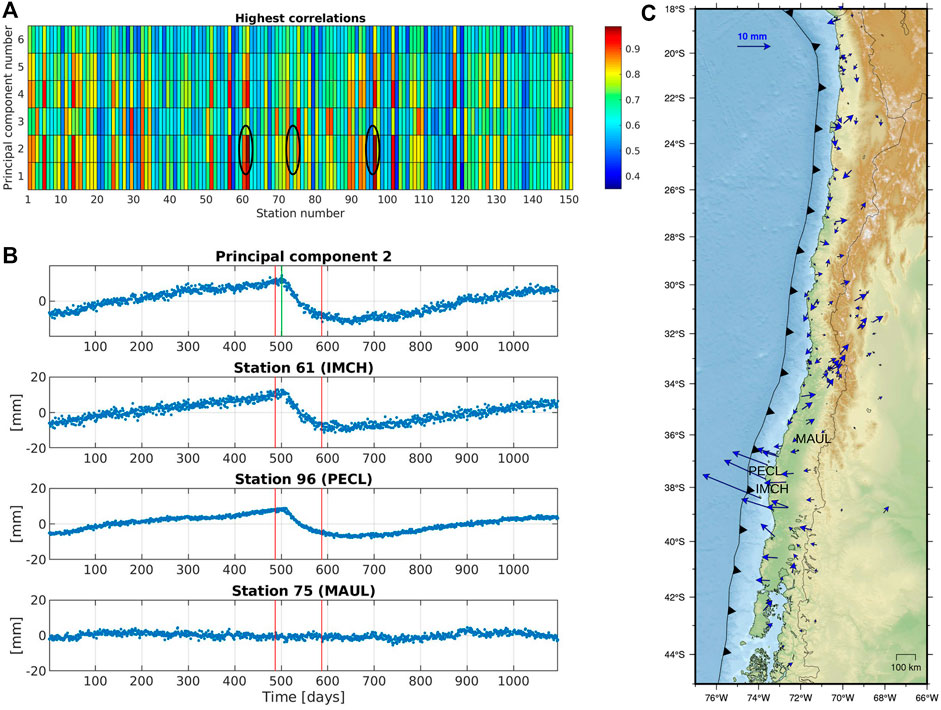
FIGURE 7. Results for PCA-based method for data set No. 1. In (A), we plot the highest correlations (Hρ) for every PC and every station. In (B), PC 2 and detrended time series IMCH, PECL and MAUL are plotted marked in (A). The red lines correspond to the detected time window, while the green line is the onset time in the simulation. In (C), vectors of displacements in the detected time window are plotted.
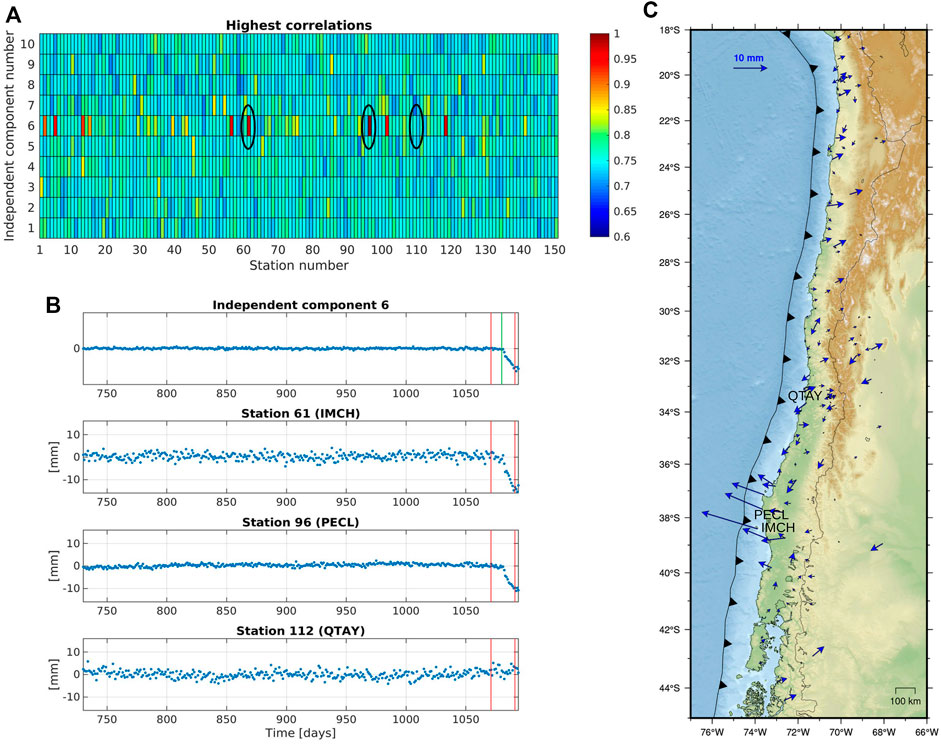
FIGURE 8. Results for ICA-based method for data set No. 2. In (A), we plot the highest correlations (Hρ) for every IC and every station. In (B), IC 6 and detrended time series IMCH, PECL and QTAY are plotted (marked in (A)). The red lines correspond to the time window, while the green line is the onset time in the simulation. In (C), vectors of displacements in the detected time window are plotted.
Real GNSS Time-Series Analysis
Documented Slow Slip Events
Once our method was calibrated and tested with synthetic data, we used GNSS time series that recorded the three main transient events in Chile to assess the ability of the PICCA algorithm to detect these events automatically. In doing so, we select three time-windows and locations: Iquique area, spanning between February 4, 2013 to April 1, 2014. We focused on detecting precursory transient movements in the days before the April 1, 2014 earthquakes, which is the most prominent transient signal prior to this event (Schurr et al., 2014); The second location is Valparaíso, spanning between March 25, 2016 to April 24, 2017. We attempt to detect the intense precursory activity documented 2 days before (e.g., Ruiz et al., 2017; Ruiz et al., 2018; Caballero et al., 2021) the MW 6.9 earthquake in Valparaíso. The third location is Copiapó, spanning between January 1, 2014 to September 12, 2015, where a long-term transient was detected between 2014 and 2016 (Klein et al., 2018). In the analyses, we use only the time series measured in the EW direction. Only in the case of the Copiapo event, we use the vertical signal. However, within the results shown in the following section, the inferred values for the directions not analyzed (i.e., N-S for Iquique and Valparaiso, and additionally E-W for Copiapo) are extrapolated from our analysis, taking the time windows detected by PICCA and extracting the detrended displacement in that period.
Results for Real GNSS Time-Series
As well as with synthetic data, we apply the method for different values of R, as we can see in Figure 9. Performance indexes and the number of the resulting component selected were plotted for all the values of R, and histograms of the selected components are shown for each data set. Also, Table 1 is used to validate the results.
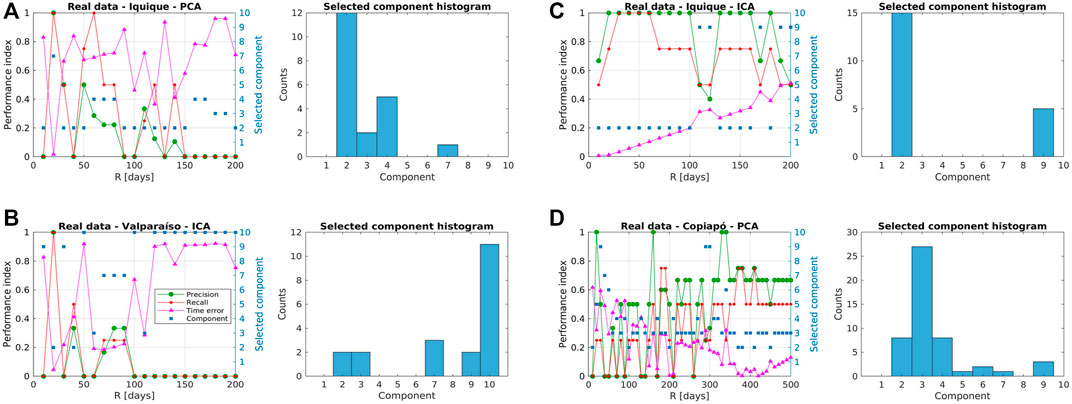
FIGURE 9. Performance evaluation for real datasets. Indexes values for different window length R (left) and histogram of component selection (right). (A) Results for Iquique dataset, PCA-based method. (B) Results for Iquique dataset, ICA-based method. (C) Results for Valparaíso dataset, ICA-based method. (D) Results for Copiapó dataset, PCA-based method.
For the Iquique data set, the PCA-based method is not capable of generating consistent results (see Figure 9A). The component selection failed for most of the values of R, with only one correct result obtained for R = 20 days, which is consistent with the transient duration. Although this result is correct and consistent with the transient duration, the method is not reliable using PCA. On the other hand, the ICA-based method presents a high consistency between the correctly selected component (IC 2) and the performance indexes (Figure 9B). The results have a high performance for values of R from 10 to 100 days, similarly to the results from the ICA-based method for synthetic data of 15 days slip (Transient No. 2). In the second data set, corresponding to Valparaíso, the ICA-based method does not perform stable in function of R (Figure 9C). Only two values of R were able to select the correct component (IC 2), with only one of these values, R = 20 days, with high performance. We also can observe that the most selected component was IC 10, for larger values of R, however, the onset time estimated differs substantially from the real onset time of the transient. Finally, for the Copiapó event, most of the component selection were correct (PC 3), obtaining a high performance, specifically for higher values of R, consistently with the several-months duration of the transient (Figure 9D).
From these performance results, we summarize the best results in Table 3. For the Iquique region (see all the principal and independent components from Iquique dataset in Supplementary Figure S5 in the Supplementary Material), we can observe that the highest correlations are given by IC 2 and time series from stations ATJN, CGTC and IQQE (Figure 10A). The corresponding time series (red lines in Figure 10B) show the detection window, from day 392 (March 2, 2014), including the precursor activity that starts on day 406 (March 16, 2014). As we can note in Figure 10C, these time series with high correlation correspond to the stations closer to the 2014 earthquake rupture zone and possibly where the pre-earthquake slow slip occurred. GNSS-derived cumulative displacements show a consistent trenchward pattern (with magnitudes>10 mm) for the transient event window. The direction of motion associated with this SEE is consistent with the distribution of seismicity (extracted from NEIC, Masse and Needham, 1989) in the time window analyzed, indicating that this SEE is related to this seismic activity (Bedford et al., 2015).
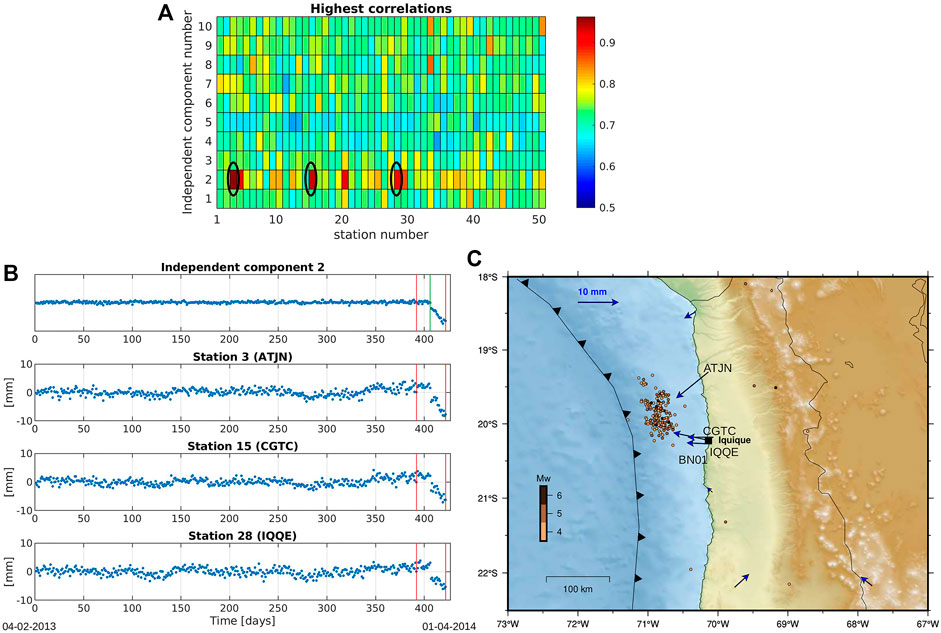
FIGURE 10. Results for ICA-based method for Iquique data set. In (A) we plot the highest correlations (Hρ) for every IC and every station. In (B), IC 8 and detrended time series from stations ATJN, CGTC, and IQQE are plotted (marked in (A)). The red lines in (B) correspond to the detected time window, while the green line is the onset time of the precursor activity. In (C), vectors of displacements in the detected time window are plotted. Seismicity extracted from the National Earthquake Information Center (NEIC) catalog (Masse, and Needham, 1989) in the analyzed period is shown by dots colored by magnitude.
For the Valparaíso region, Figure 11A shows high correlations between IC 2 and time series from stations BN05, VALN and QTAY. Because of the size R of the window in relation to the duration of the transient, the onset time detected is far before the real onset time, however, the transient is included in the window, thus, correctly detected. The cumulative movement in the time window reaches 5 mm, with a consistent pattern of motions towards a zone with high seismicity activity in the analyzed time period. On the third real dataset, in the Copiapó region, the Up component was analyzed, following the finding of Klein et al. (2018). This transient is a long-term deformation (possibly several months) that has not an accurate onset time, so we established that the day 200 of the time series was the onset time, only as a reference for the calculation of the time error and compare results. In Figure 12A we can observe that the highest correlations are given by PC 3 and time series from stations BN03 and COPO. Despite the large amount of noise and gap in the data, as we can see in Figure 12B, the method was capable of detecting 2 stations from this region with displacements consistent with the previous studies (Figure 12C). During the analyzed period, no seismic activity was recorded that could be related to the occurrence of an SSE. The horizontal displacements are of very low magnitude, and it remains to be seen whether this is a phenomenon related to a slow earthquake or an unusual deformation affecting the vertical component. Whatever its origin, our method is able to detect this signal, which affected the Copiapó area.
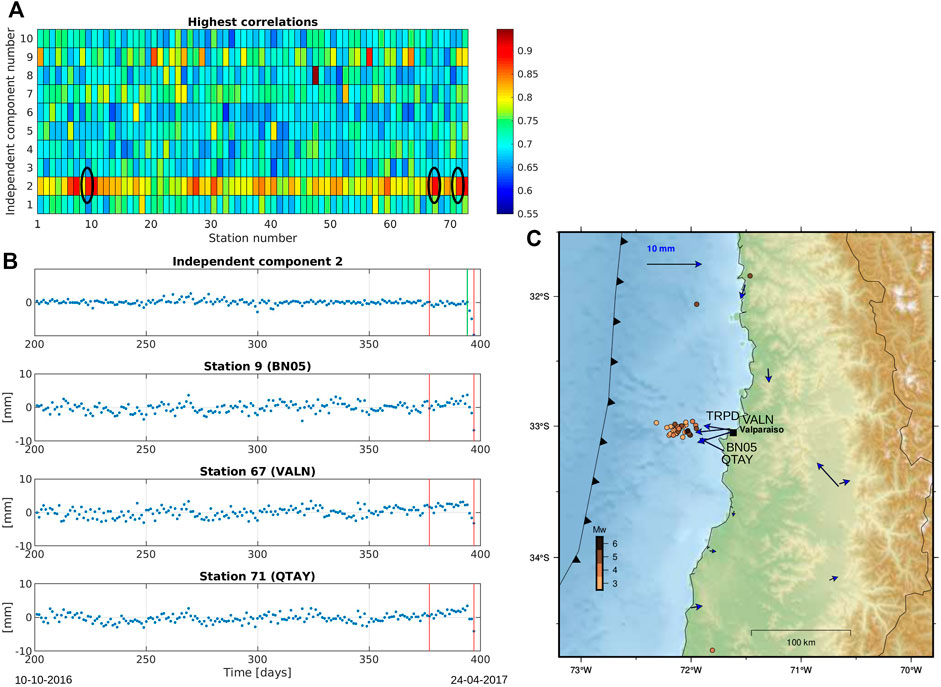
FIGURE 11. Results for ICA-based method for Valparaíso data set. In (A) we plot the highest correlations (Hρ) for every IC and every station. In (B), IC 2 and detrended time series BN05, VALN and QTAY are plotted (marked in (A)). The red lines correspond to the detected time window, while the green line is the onset time of the precursor activity. In (C), vectors of displacements in the detected time window are plotted. Seismicity extracted from the National Earthquake Information Center (NEIC) catalog (Masse, and Needham, 1989) in the analyzed period is shown by dots colored by magnitude.
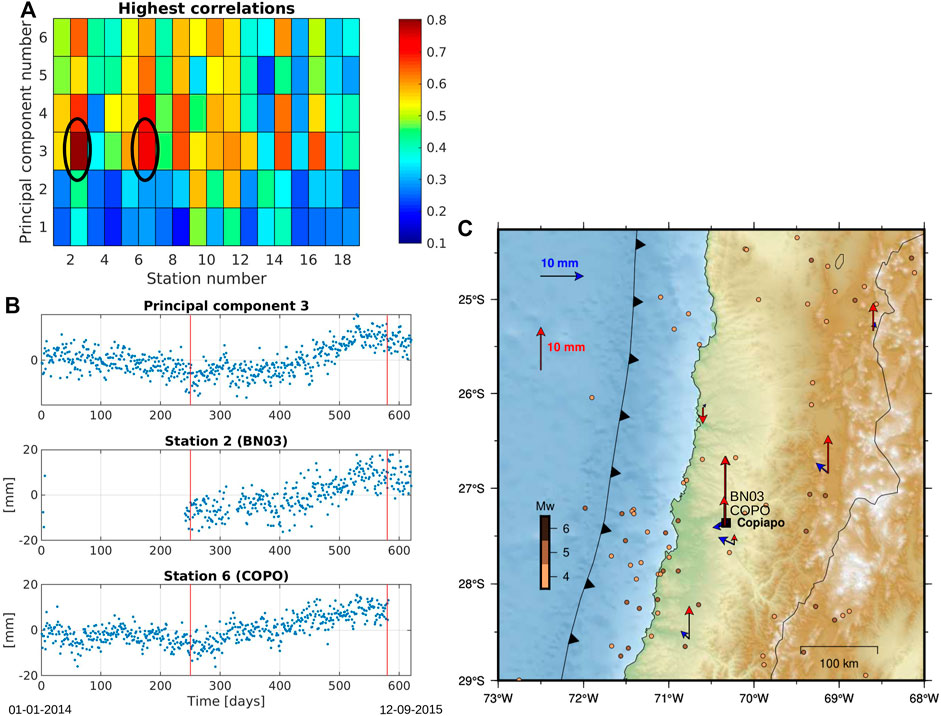
FIGURE 12. Results for PCA-based method for Copiapó data set, applied to the vertical (Up) component of the time series. In (A) we plot the highest correlations (Hρ) for every principal component and every station. In (B), PC 3 and time series from stations BN03 and COPO are plotted (marked in (A)). The red lines correspond to the detected time window, while the green line is the onset time of the precursor activity. In (C), vectors of displacements in the detected time window are plotted, for both vertical and horizontal components. Seismicity extracted from the National Earthquake Information Center (NEIC) catalog (Masse, and Needham, 1989) in the analyzed period is shown by dots colored by magnitude.
Summarizing, similar results can be observed in both synthetic and real data. For long-term transients (150 days or more), the PCA-based method was able to find the components with displacement information, while the ICA-based method performs better for shorter duration events (15 days for example).
Discussion
PCA and ICA techniques have already been used in GNSS data processing. The most commonly used PCA methods are spatial filtering to detect and remove common mode error (CME) (Dong et al., 2006); and the PCA inversion method (PCAIM) (Kositsky and Avouac, 2010), which is an inversion strategy that uses the principal components of the surface displacements to model slip on the analyzed network. Dong’s method assumes that the CME is present in the top few principal components of a detrended set of stations, however, it can be easily confused with a transient event. Bottiglieri et al. (2007) used ICA to extract periodic signals that could contain local deformations, however, as ICA does not provide absolute amplitudes, it fails to find a component that directly contains a local deformation. Subsequently, Gualandi et al., 2016 proposed a new method called variational bayesian ICA (vbICA) that separates the sources and manages to characterize them in a better way than the PCA and ICA methods. Gualandi et al. (2016) method is an improvement to traditional methods such as PCA and ICA, with multiple possible applications, among which is the spatial and temporal detection of transients. This raises, as a future work, the use of this technique as an additional method to the one proposed in this work, in search of the best solution according to the methodology proposed here. In our proposed methodology, we do not pose any prior assumption regarding within which component (principal or independent) the transient event may be contained, but rather the transient event is searched for within all the estimated components.
The combined analysis of both synthetic time series and those observed by GNSS instruments that recorded three slow earthquake events, shows that the PICCA algorithm can successfully detect transient signals affecting a network of GNSS stations. For efficiency purposes, we used as little data as possible, thus we analyzed only the East component of the times series for the synthetic and GNSS-derived displacements, except for the case of the SSEs in Copiapó, where we analyzed the Up component to compare our results with those previously obtained by Klein et al. (2018). As our method was able to detect the transients using a single component, it is computationally efficient, especially in data processing speed. Experimentally, we find that there is a trade-off between the quality of the results and the computational efficiency of the algorithm. Therefore, the dimensionality of the data should be gradually increased, evaluating the results in terms of minimizing uncertainty, over caring too much about increasing the processing speed.
It should be noted that when using synthetic data, the parameters we are looking for (transient events) are already known; therefore, it is possible to evaluate the quality of our results, and thus the performance detections of our algorithm. That is why in this study, we analyze GNSS-derived time series related to transient events already characterized (Ruiz et al., 2014; Ruiz et al., 2017; Klein et al., 2018), which have different properties (magnitude, onset time, duration, location), allowing us to analyze the pros and cons of our detector in such cases. It is worth mentioning that this known information was used exclusively for the development and evaluation of the method, and was not included as prior information in the detection procedure.
In order to carry out the evaluation of the quality of the results, we defined some basic parameters based on concepts from machine learning techniques. For instance, we used the Precision and Recall indexes to spatially evaluate the positivity of the selected stations, which allowed us to assess whether the stations affected by transient events were well or poorly detected. However, an accuracy index was not used, since for all cases, the set of stations affected by the earthquakes was much smaller than the unaffected stations, i.e., we had an unbalanced test set, which directly affects the accuracy, that is defined according to the total of the test set. The obtained results indicate that the PICCA algorithm can automatically detect the spatial distribution of the stations affected by a transient event and the onset time of a transient event. However, the automatic detection of the duration of a transient event is a function of the width of the time window R, which is a difficult parameter to obtain automatically. Hence, R is the least accurately estimated parameter. However, as seen in our analyses, the transient signal is always within or part of the window R. The performance analysis indicates that the method allows a straightforward finding of the region (selected by a set of stations) affected by the transient and its approximate temporal location.
It could be observed in Figures 6, 9 that if Precision and Recall are high, and obviously, Time error is low, the closer R is to the duration of the transient. In these cases the histogram will indicate a higher frequency for the component containing the transient. In the histograms shown in Figures 6, 9, it can be seen that in some cases, there is a direct relationship between high performance and the component with the highest frequency. This suggests that by selecting the component with the highest frequency, it will be the component that contains the most information of the transient signal. However, there are cases in which this criterion cannot be applied, such as the results of the ICA-based method for long duration transients or the results of the PCA-based method for short duration transients. Thus, PCA and ICA have different performance depending on the duration of the transient events. Therefore, our results demonstrate that PCA is better for detecting long duration transients, while ICA behaves better for the detection of shorter transients. Therefore, a next step for further improving the PICCA algorithm, corresponds to develop a criteria to discriminate unambiguously (or as best as possible) between the transients detected by PCA or ICA, i.e., to try to determine whether the transient is of long or short duration. So far, we have shown that the method is able to detect transients based on PCA and/or ICA and allows us to characterize their application.
The PICCA algorithm located temporally and spatially the three transient events previously documented in Chile. Precursor transient events typically show a clear trenchward signal consistent with the decoupling of a portion of the plate interface. It appears that these decoupling events may be a common signal before major earthquakes in Chile, which has not been widely observed yet due to the lack of dense GNSS networks. Transient events of a few days and low magnitude, such as the one offshore Valparaiso, are more difficult to characterize with our method, due to the noise contained in the time series. Even though the transient has a greater magnitude than the noise, it has a frequency and duration very similar to the noise, or rather, contained in the noise spectrum. This implies that the transient can generate high values when correlated with time windows containing mostly noise, without transient information. Moreover, being real signals, they may contain signals with greater complexity for which we have no information, and that may be the cause of such inaccurate results. Of course, such complexities are not present for synthetic signals. The Copiapo transient event is well detected by analyzing the vertical series. However, horizontal data in the selected time window for the transient event show very low horizontal displacements (<5 mm), making doubtful the existence of a slow earthquake and rather indicating some seasonal effect affecting mainly the vertical component. However, Klein et al. (2018) using more data from GNSS campaign measurements show that there is an effect on the horizontal displacements during this transient event. Therefore, longer time series and denser networks of stations registering the statistical aspects of the transient event, that differentiate it from noise, will help to better describe this phenomenon.
Finally, the PICCA detection algorithm can be applied to any network of GNSS stations using data from an entire network. The versatility of PICCA also allows the analysis of other geodetic data, such as InSAR or tiltmeter time series. One of the strengths of the PICCA detector is the ability to use only a single spatial component of the GNSS time series. Thus, despite working with less information, it is possible to obtain satisfactory results and greater computational efficiency. However, the idea of performing an analysis including the three components of the GNSS positional time series (PICCA-3D) should be further explored. Another strength of PICCA is that by combining PCA with ICA, we can cover a wide range of SSEs, from short transient events of a few days to long transients of months or even years. However, the main limitation of our approach lies in the automatic choice of R. To our knowledge, there is no optimal and fully automated way to find R, although the results guide how to do it in an iterative manner. Thus, we do a separate search of R for SSE of a duration of days and SSE of several months. As the SSE duration is unknown, a wide range of R values must be evaluated. For slow SSEs, we apply the PCA and search for a value of R for which the PC has been selected the most times (from the histograms). The same approach would be made for SSE of shorter duration, applying ICA. Due to the low signal-to-noise ratio, transient events of a few days and low magnitude, such as the Valparaíso 2017 SSE, are challenging to characterize. This leads us to define a maximum resolution, i.e., the minimum number of days to ensure a satisfactory result, depending on the magnitude of the signal with respect to the noise. In the case of the synthetic SSE we analyzed, the minimum number of days to detect the transient signal was 3 days. In the case of the SSE from real data, the smallest window was 5 days.
Conclusion
The PICCA algorithm combines known techniques, such as PCA and ICA, to simply detect slow transient events within a network of GNSS stations. The hypothesis was that the information of a transient, if it exists, is contained in at least one of the estimated components, either principal or independent components. This hypothesis was proved, since for all the cases analyzed, it was possible to extract the spatial and temporal information of the transient events, for at least one window of width R.
Using the information already known from the transients analyzed, it was possible to evaluate the performance of the method, as a function of the window width R and the selected stations. Positive recognition indexes as Precision and Recall were defined, plus a temporal error index. The two recognition indexes are widely used in machine learning models to evaluate classification results. In that sense, this method can also be seen functionally as a classification method, since for each station of the analyzed network a category is obtained, in this case “transient” or “no transient”. These concepts are fundamental for a later study to generate a model that allows detecting and recognizing different types of transients under supervised training from a database of synthetic and real time series.
As a next step in this research, a way to estimate the optimal R should be determined. It is also necessary, for a robust validation, to perform more tests with synthetic time series, including a wider variety of transients with different intensity, duration, onset time and geographic location. The PICCA algorithm defines a methodology intended to be a complementary tool for the detection of transients in time series of geodetic observations. We are particularly interested to use it with Chilean data, in order to contribute in the knowledge about the subduction megathrust physical processes governing earthquake generation. Thus, further supporting the investigation of these natural events, which in this country are of great importance for life and culture.
Data Availability Statement
The datasets presented in this study can be found in online repositories. The names of the repository/repositories and accession number(s) can be found below:http://geodesy.unr.edu, https://github.com/FeDonoso/PICCA-data.
Author Contributions
FD and MM conceived the original idea of this study. FD developed the PICCA algorithm and performed the analysis. FD, MM, and RB implemented the generation of synthetic GNSS data and modeling of slow slip events. JB and FO-C contribute with code debugging and performance evaluation. FD wrote the article with the contributions of all authors.
Funding
This work was funded by The Chilean National Fund for Development of Science and Technology (FONDECYT) grant 1181479 and the PRECURSOR ANILLO Project PIA ACT-192169 from the Chilean National Agency for Research and Development (ANID).
Conflict of Interest
The authors declare that the research was conducted in the absence of any commercial or financial relationships that could be construed as a potential conflict of interest.
Publisher’s Note
All claims expressed in this article are solely those of the authors and do not necessarily represent those of their affiliated organizations, or those of the publisher, the editors, and the reviewers. Any product that may be evaluated in this article, or claim that may be made by its manufacturer, is not guaranteed or endorsed by the publisher.
Acknowledgments
FD acknowledges PRECURSOR ANILLO Project PIA ACT-192169 for funding and technical support during the development of this work. MM acknowledges support from the Millennium Nucleus CYCLO (The Seismic Cycle Along Subduction Zones) funded by the Millennium Scientific Initiative (ICM) of the Chilean Government Grant NC160025, and CONICYT/FONDAP 15110017, and the Millennium Institute of Oceanography (IMO, Grant ICN12_019). FO-C acknowledges support from Proyecto Fondecyt 1200679 CONICYT/ANID. We thank P. Poli and an reviewer for comments and suggestions.
Supplementary Material
The Supplementary Material for this article can be found online at: https://www.frontiersin.org/articles/10.3389/feart.2021.788054/full#supplementary-material
References
Báez, J. C., Leyton, F., Troncoso, C., del Campo, F., Bevis, M., Vigny, C., et al. (2018). The Chilean GNSS Network: Current Status and Progress toward Early Warning Applications. Seismological Res. Lett. 89 (4), 1546–1554. doi:10.1785/0220180011
Bedford, J., and Bevis, M. (2018). Greedy Automatic Signal Decomposition and its Application to Daily GPS Time Series. J. Geophys. Res. Solid Earth 123 (8), 6992–7003. doi:10.1029/2017JB014765
Bedford, J., Moreno, M., Schurr, B., Bartsch, M., and Oncken, O. (2015). Investigating the Final Seismic Swarm before the Iquique-Pisagua 2014 M W 8.1 by Comparison of Continuous GPS and Seismic Foreshock Data. Geophys. Res. Lett. 42 (10), 3820–3828. doi:10.1002/2015GL063953
Bedford, J. R., Moreno, M., Deng, Z., Oncken, O., Schurr, B., John, T., et al. (2020). Months-long Thousand-Kilometre-Scale Wobbling before Great Subduction Earthquakes. Nature 580 (7805), 628–635. doi:10.1038/s41586-020-2212-1
Bevis, M., and Brown, A. (2014). Trajectory Models and Reference Frames for Crustal Motion Geodesy. J. Geod 88 (3), 283–311. doi:10.1007/s00190-013-0685-5
Blewitt, G., Hammond, W., and Kreemer, C. (2018). Harnessing the GPS Data Explosion for Interdisciplinary Science. Eos 99 (1029), 485. doi:10.1029/2018EO104623
Bottiglieri, M., Falanga, M., Tammaro, U., Obrizzo, F., De Martino, P., Godano, C., et al. (2007). Independent Component Analysis as a Tool for Ground Deformation Analysis. Geophys. J. Int. 168 (3), 1305–1310. doi:10.1111/j.1365-246X.2006.03264.x
Bürgmann, R. (2018). The Geophysics, Geology and Mechanics of Slow Fault Slip. Earth Planet. Sci. Lett. 495, 112–134. doi:10.1016/j.epsl.2018.04.062
Caballero, E., Chounet, A., Duputel, Z., Jara, J., Twardzik, C., and Jolivet, R. (2021). Seismic and Aseismic Fault Slip during the Initiation Phase of the 2017 M W = 6.9 Valparaíso Earthquake. Geophys. Res. Lett. 48 (6), e2020GL091916. doi:10.1029/2020GL091916
Carr Agnew, D. (2013). Realistic Simulations of Geodetic Network Data: The Fakenet Package. Seismological Res. Lett. 84 (3), 426–432. doi:10.1785/0220120185
Chatfield, C., and Collins, A. J. (1980). “Principal Component Analysis,” in Introduction to Multivariate Analysis (Boston, MA: Springer), 57–81. doi:10.1007/978-1-4899-3184-9_4
Comon, P. (1994). Independent Component Analysis, a New Concept? Signal. Processing 36 (3), 287–314. doi:10.1016/0165-1684(94)90029-9
Crowell, B. W., Bock, Y., and Liu, Z. (2016). Single-station Automated Detection of Transient Deformation in GPS Time Series with the Relative Strength index: A Case Study of Cascadian Slow Slip. J. Geophys. Res. Solid Earth 121 (12), 9077–9094. doi:10.1002/2016JB013542
Davis, E. E., Villinger, H., and Sun, T. (2015). Slow and Delayed Deformation and Uplift of the Outermost Subduction Prism Following ETS and Seismogenic Slip Events beneath Nicoya Peninsula, Costa Rica. Earth Planet. Sci. Lett. 410, 117–127. doi:10.1016/j.epsl.2014.11.015
Dong, D., Fang, P., Bock, Y., Webb, F., Prawirodirdjo, L., Kedar, S., et al. (2006). Spatiotemporal Filtering Using Principal Component Analysis and Karhunen-Loeve Expansion Approaches for Regional GPS Network Analysis. J. Geophys. Res. 111, B03405. doi:10.1029/2005JB003806
Dragert, H., Wang, K., and James, T. S. (2001). A Silent Slip Event on the Deeper Cascadia Subduction Interface. Science 292 (5521), 1525–1528. doi:10.1126/science.1060152
Dragert, H., Wang, K., and Rogers, G. (2004). Geodetic and Seismic Signatures of Episodic Tremor and Slip in the Northern Cascadia Subduction Zone. Earth Planet. Sp 56 (12), 1143–1150. doi:10.1186/BF03353333
Frank, W. B. (2016). Slow Slip Hidden in the Noise: The Intermittence of Tectonic Release. Geophys. Res. Lett. 43 (19), 10–125. doi:10.1002/2016GL069537
Freymueller, J. T., Hreinsdöttir, S., Zweck, S., and Haeussler, P. J. (2002). The 1998–2002 Deep Megathrust Slip Event, Alaska. Eos Trans. Amer Geophys. Union 83 (47).
Gualandi, A., Serpelloni, E., and Belardinelli, M. E. (2016). Blind Source Separation Problem in GPS Time Series. J. Geod 90 (4), 323–341. doi:10.1007/s00190-015-0875-4
Hayes, G. P., Moore, G. L., Portner, D. E., Hearne, M., Flamme, H., Furtney, M., et al. (2018). Slab2, a Comprehensive Subduction Zone Geometry Model. Science 362 (6410), 58–61. doi:10.1126/science.aat4723
Hirose, H., Hirahara, K., Kimata, F., Fujii, N., and Miyazaki, S. i. (1999). A Slow Thrust Slip Event Following the Two 1996 Hyuganada Earthquakes beneath the Bungo Channel, Southwest Japan. Geophys. Res. Lett. 26 (21), 3237–3240. doi:10.1029/1999GL010999
Hyvärinen, A., and Oja, E. (2000). Independent Component Analysis: Algorithms and Applications. Neural networks 13 (4-5), 411–430. doi:10.1016/S0893-6080(00)00026-5
Jolivet, R., and Frank, W. B. (2020). The Transient and Intermittent Nature of Slow Slip. AGU Adv. 1 (1), e2019AV000126. doi:10.1029/2019AV000126
Klein, E., Duputel, Z., Zigone, D., Vigny, C., Boy, J. P., Doubre, C., et al. (2018). Deep Transient Slow Slip Detected by Survey GPS in the Region of Atacama, Chile. Geophys. Res. Lett. 45 (22), 12,263–12,273. doi:10.1029/2018GL080613
Kositsky, A. P., and Avouac, J.-P. (2010). Inverting Geodetic Time Series with a Principal Component Analysis-Based Inversion Method. J. Geophys. Res. 115 (B3). doi:10.1029/2009JB006535
Lowry, A. R., Larson, K. M., Kostoglodov, V., and Bilham, R. (2001). Transient Fault Slip in Guerrero, Southern Mexico. Geophys. Res. Lett. 28 (19), 3753–3756. doi:10.1029/2001GL013238
Masse, R. P., and Needham, R. E. (1989). NEIC-the National Earthquake Information center. Earthquakes & Volcanoes (USGS) 21 (1), 4–44.
McGuire, J. J., and Segall, P. (2003). Imaging of Aseismic Fault Slip Transients Recorded by Dense Geodetic Networks. Geophys. J. Int. 155, 778–788. doi:10.1111/j.1365-246x.2003.02022.x
Melnick, D., Moreno, M., Quinteros, J., Baez, J. C., Deng, Z., Li, S., et al. (2017). The Super-interseismic Phase of the Megathrust Earthquake Cycle in Chile. Geophys. Res. Lett. 44 (2), 784–791. doi:10.1002/2016GL071845
Nikkhoo, M., and Walter, T. R. (2015). Triangular Dislocation: an Analytical, Artefact-free Solution. Geophys. J. Int. 201 (2), 1119–1141. doi:10.1093/gji/ggv035
Ohtani, R., McGuire, J. J., and Segall, P. (2010). Network Strain Filter: A New Tool for Monitoring and Detecting Transient Deformation Signals in GPS Arrays. J. Geophys. Res. 115 (B12). doi:10.1029/2010JB007442
Radiguet, M., Perfettini, H., Cotte, N., Gualandi, A., Valette, B., Kostoglodov, V., et al. (2016). Triggering of the 2014 Mw7.3 Papanoa Earthquake by a Slow Slip Event in Guerrero, Mexico. Nat. Geosci 9 (11), 829–833. doi:10.1038/ngeo2817
Riel, B., Simons, M., Agram, P., and Zhan, Z. (2014). Detecting Transient Signals in Geodetic Time Series Using Sparse Estimation Techniques. J. Geophys. Res. Solid Earth 119, 5140–5160. doi:10.1002/2014JB011077
Ruiz, J. A., Contreras-Reyes, E., Ortega-Culaciati, F., and Manríquez, P. (2018). Rupture Process of the April 24, 2017, Mw 6.9 Valparaíso Earthquake from the Joint Inversion of Teleseismic Body Waves and Near-Field Data. Phys. Earth Planet. Interiors 279, 10,290–10,297. doi:10.1016/j.pepi.2018.03.007
Ruiz, J. A., Maksymowicz, A., Ortega-Culaciati, F., Rivera, L., and Comte, D. (2019). Source Characteristics of the March 16, 2014 Mw 6.7 Earthquake and its Implications for the Mw 8.2 Pisagua Mainshock. Tectonophysics 767, 228170. doi:10.1016/j.tecto.2019.228170
Ruiz, S., Aden-Antoniow, F., Baez, J. C., Otarola, C., Potin, B., Del Campo, F., et al. (2017). Nucleation Phase and Dynamic Inversion of the Mw 6.9 Valparaíso 2017 Earthquake in Central Chile. Geophys. Res. Lett. 44 (20), 10,290–10,297. doi:10.1002/2017GL075675
Ruiz, S., Metois, M., Fuenzalida, A., Ruiz, J., Leyton, F., Grandin, R., et al. (2014). Intense Foreshocks and a Slow Slip Event Preceded the 2014 Iquique M W 8.1 Earthquake. Science 345 (6201), 1165–1169. doi:10.1126/science.1256074
Schurr, B., Asch, G., Hainzl, S., Bedford, J., Hoechner, A., Palo, M., et al. (2014). Gradual Unlocking of Plate Boundary Controlled Initiation of the 2014 Iquique Earthquake. Nature 512 (7514), 299–302. doi:10.1038/nature13681
Socquet, A., Valdes, J. P., Jara, J., Cotton, F., Walpersdorf, A., Cotte, N., et al. (2017). An 8 Month Slow Slip Event Triggers Progressive Nucleation of the 2014 Chile Megathrust. Geophys. Res. Lett. 44 (9), 4046–4053. doi:10.1002/2017GL073023
Stone, J. V. (2004). Independent Component Analysis: A Tutorial Introduction. Cambridge: The MIT Press.
Wallace, L. M., and Beavan, J. (2006). A Large Slow Slip Event on the central Hikurangi Subduction Interface beneath the Manawatu Region, North Island, New Zealand. Geophys. Res. Lett. 33 (11). doi:10.1029/2006GL026009
Keywords: transient deformation, slow slip event, time series analysis, PCA, ICA, Chile, earthquakes, correlation
Citation: Donoso F, Moreno M, Ortega-Culaciati F, Bedford JR and Benavente R (2021) Automatic Detection of Slow Slip Events Using the PICCA: Application to Chilean GNSS Data. Front. Earth Sci. 9:788054. doi: 10.3389/feart.2021.788054
Received: 01 October 2021; Accepted: 30 November 2021;
Published: 24 December 2021.
Edited by:
Nibir Mandal, Jadavpur University, IndiaReviewed by:
Piero Poli, Université Grenoble Alpes, FranceRaffaele Castaldo, Institute for the Electromagnetic Detection of the Environment (CNR), Italy
Copyright © 2021 Donoso, Moreno, Ortega-Culaciati, Bedford and Benavente. This is an open-access article distributed under the terms of the Creative Commons Attribution License (CC BY). The use, distribution or reproduction in other forums is permitted, provided the original author(s) and the copyright owner(s) are credited and that the original publication in this journal is cited, in accordance with accepted academic practice. No use, distribution or reproduction is permitted which does not comply with these terms.
*Correspondence: F. Donoso, fdonosou@gmail.com
 F. Donoso
 M. Moreno
 F. Ortega-Culaciati
 J. R. Bedford3
