 Ji Young Shin
 Kiseong Hyeong3
 Wonnyon Kim
- 1Laboratory of Orogenic Belts and Crustal Evolution, School of Earth and Space Sciences, Peking University, Beijing, China
- 2Deep-Sea and Seabed Mineral Resource Research Center, Korea Institute of Ocean Science and Technology, Busan, South Korea
- 3Global Ocean Research Center, Korea Institute of Ocean Science and Technology, Busan, South Korea
Eolian dust deposited in the North Pacific is an important archive of the evolutionary history of Asian interior source regions and climate system. Here, we present a ∼1 Myr sediment magnetic record from the central North Pacific to characterize eolian dust properties since the middle Pleistocene. For the studied sediments, magnetic components are mainly identified as biogenic magnetite and detrital magnetic minerals (dust and volcanic origins) based on coercivity analysis, microscopic observations, and sedimentological information. The detrital magnetic component is characterized by high coercivity (>100 mT) and shows a long-term increase in concentration since ∼1 Ma. In particular, the concentration shows a considerable increase at ∼0.8–0.7 Ma compared to the inorganic silicate fraction, indicative of magnetic mineral enrichment in detrital sediment fraction. At the same time, the coercivity distribution of the detrital component also decreases, which can be attributed to an increase in the ferrimagnetic mineral contribution. As the detrital sediments are primarily wind-blown particles, such ferrimagnetic enrichment implies a change in dust source materials after ∼0.8 Ma, which could be explained by the reorganization of atmospheric circulation and/or regional aridification in source regions across the mid-Pleistocene transition. The dust property change in source areas is likely to be synchronized across the North Pacific based on the similarity of the long-term trend of magnetic signals.
Introduction
In the North Pacific, eolian dust transported from inland Asia via westerly winds is the major terrigenous constituent in deep-sea sediments. During the late Cenozoic, the eolian dust deposition in the North Pacific has gradually increased, which has been suggested to be associated with increased dust production and transportation during the growth of the northern Hemisphere ice sheet and global cooling (Rea et al., 1998; Zhang et al., 2016). Such dust evolution can be induced by extreme environmental changes in source regions, such as through the reorganization of atmospheric circulation and aridity/weathering changes (Nie et al., 2018; Zhang et al., 2019; Abell et al., 2021), and thus, these processes fundamentally involve changes in mineralogical and chemical composition of eolian dust.
Marine sedimentary magnetic signal is a simple and useful tool for reconstructing past changes in eolian dust properties. In particular, high coercivity magnetic fractions have been widely used for semi-quantitative estimation of eolian dust content because hematite is a common weathering product in arid source regions (Doh et al., 1988; Larrasoaña et al., 2015; Zhang et al., 2018). However, the magnetic signals of eolian dust fraction in the North Pacific are still not fully understood. Although ferrimagnetic minerals (e.g., magnetite/maghemite) predominantly account for magnetic signals of North Pacific sediments, it is difficult to isolate them as Asian dust records due to post-depositional alteration and the addition of these minerals from other sources (i.e., biogenic magnetite and volcanic materials).
In this study, variations of detrital and biogenic magnetic signals were reconstructed for the last 1 million years from the central North Pacific, where the eolian dust fraction dominates the detrital sediments. The mid-Pleistocene transition (MPT) represents a period of major climate transition characterized by glacial-interglacial periodicity change from 41 to 100 kyr cycles due to ice sheet development and global cooling (1.2–0.7 Ma; Clark et al., 2006), and in situ loess/dust records have been vigorously studied to identify the climate evolution in the dust source regions during the MPT (Heslop et al., 2002; Zan et al., 2013; Tan et al., 2020). However, the North Pacific dust record during this period has been poorly investigated, although it can improve our understanding of the regional source evolution in Asia and dust transportation. Here, we identify variations in the mineral magnetic properties of detrital components from North Pacific sediments and evaluate the possible evolution of dust source materials across the MPT.
Materials and Methods
Samples were taken from the sediment core NPGP1401-2A (32.03°N, 178.59°E; water depth of 5,205 m; Figure 1) around the Hess Rise in the central North Pacific. The core is ∼7 m long and dominantly composed of homogenous brown clay. In this study, 312 discrete wet samples were taken using 7 cm3 paleomagnetic cubes along the core depth, and freeze-dried sediments were also prepared at selected depths. Sediment ages were obtained from a modified age model using magnetic reversal stratigraphy and relative paleointensity correlations after Shin et al. (2019), which provided paleomagnetic data with stratigraphic correlations using rock magnetic data (Supplementary Figure S1). The bottom age and average sedimentation rate are approximately 1.1 Ma and 0.67 cm/kyr, respectively.
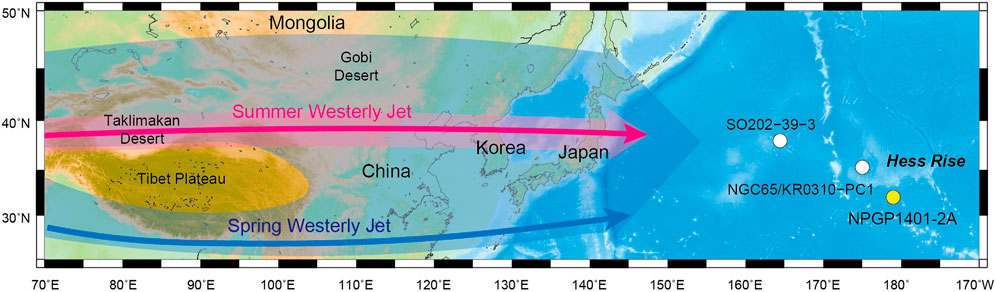
FIGURE 1. Sampling location of sediment core NPGP1401-2A (yellow circle) and reference cores (white circles) NG65/KR0310-PC1 (Yamazaki and Kanamatsu, 2007) and SO202-39-3 (Korff et al., 2016). Atmospheric circulation patterns transporting dust from Asia interior to the North Pacific at present are illustrated (Schiemann et al., 2009; Nagashima et al., 2011). Blue and pink arrows represent Westerly Jet in spring and summer, respectively, (bold arrows are the main axis of the jet).
Concentration-related magnetic parameters, including low frequency (470 Hz) magnetic susceptibility (χ or χlf), susceptibility of anhysteretic remanent magnetization (χARM), and saturation isothermal remanent magnetization (SIRM) were provided by Shin et al. (2019). For all cube samples, backfield IRMs were subjected at 100 and 300 mT (IRM−100 and IRM−300, respectively) in the opposite direction to the SIRM. Then, magnetically hard IRMs (HIRM100 and HIRM300) were calculated as HIRMx = 0.5 × (SIRM + IRM−x). A soft IRM fraction <100 mT (IRMsoft) was calculated as IRMsoft = SIRM − HIRM100. IRMsoft and HIRM100 represent the concentration of the magnetic fraction with lower and higher coercivity than 100 mT, respectively. To estimate relative contribution of the lower coercivity fraction (<100 mT), S-ratio was calculated following Bloemendal et al. (1992) as S-ratio (S100) = 0.5 × (1—IRM−100mT/SIRM), which is logically equivalent to IRMsoft/SIRM. L-ratio was also calculated using the equation L-ratio = HIRM300/HIRM100 (Liu et al., 2007). In definition, L-ratio reflects coercivity distribution in magnetically hard (>100 mT) fraction, such as antiferromagnetic minerals, with higher/lower ratios indicating greater/smaller contribution of higher coercivity (>300 mT) fraction (Liu et al., 2007). All remanent magnetization values were measured using an Agico JR-6A spinner magnetometer. In this study, high frequency (4,700 Hz) magnetic susceptibility (χhf) was imparted on cube samples using a Bartington MS2 magnetometer, and then frequency-dependent magnetic susceptibility χfd (%) was calculated as χfd% = [(χlf−χhf)/χlf] × 100, which reflects the superparamagnetic (SP) contribution (Dearing et al., 1996). To compare the magnetic mineral concentration, the inorganic silicate fraction (ISF) was extracted for sediment samples at a 4-cm depth interval. The extraction method and calculation were followed Hovan (1995): ISF content (wt%) = weight of extracted ISF/weight of bulk sediment × 2.5 × 100%.
First-order reversal curves (FORCs) and stepwise IRM measurements were also conducted for selected dry samples using a Princeton Measurement Corporation vibrating sample magnetometer (MicroMag 3900 VSM) at Korea Institute of Geoscience and Mineral resources. 156 FORCs were measured with a field increment of 1.5 mT and a maximum applied field of 1 T. The FORCs were smoothed using the FORCinel 3.0 processing software (Harrison and Feinberg, 2008) with the VARIFORC built-in function (Egli, 2013). The processed data were presented on FORC diagrams with Bu (interaction field) and Bc (coercivity) axes. IRM acquisition curves were obtained with 120 nonlinear steps up to a maximum applied field of 1 T. From the curves, IRM components were decomposed through their additive coercivity spectra (Kruiver et al., 2001).
Scanning electron microscopy (SEM) and transmission electron microscopy (TEM) observations were carried out on the magnetic mineral extracts for selected samples. The magnetic extracts mounted on a carbon tape were coated with carbon, and SEM observations were performed using a JEOL analytical Feld Emission (FE)-SEM (JSM-7610F) coupled with energy dispersive X-ray spectroscopy (EDS) at Gyeongsang National University, South Korea. For TEM experiments, the magnetic grains were deposited onto carbon-coated copper grids, and observations were made using a JEOL FE-TEM (JEM-2010F) equipped with EDS at Pukyong National University, South Korea.
Results
Sediment Magnetism
The temporal variations of all the concentration-related magnetic parameters for the last ∼1 Myr are presented in Figure 2. Of these, χ and SIRM, representing total magnetic mineral concentration, commonly show cyclic fluctuations at glacial-interglacial timescales with higher values during interglacials (Figures 2A,B). The cyclicity is not distinct in older parts (approximately >0.8 Ma) probably due to the smoothing effect at a lower sedimentation rate (Supplementary Figure S1). Over a long-term timescale, however, SIRM reveals distinct increases since ∼0.8 Ma across the MPT, while χ fluctuates within a relatively uniform range. Unlike χ, which is affected by all magnetic components, including paramagnetic minerals, SIRM reflects the concentration of remanence carrying magnetic minerals. Hence, the different long-term trends between χ, and SIRM could indicate changes in magnetic composition after ∼0.8 Ma. As a record, χfd% remains relatively constant and low values ranging 3–7% (Figure 2F), indicating a weak grain-size effect on χ (Dearing et al., 1996).
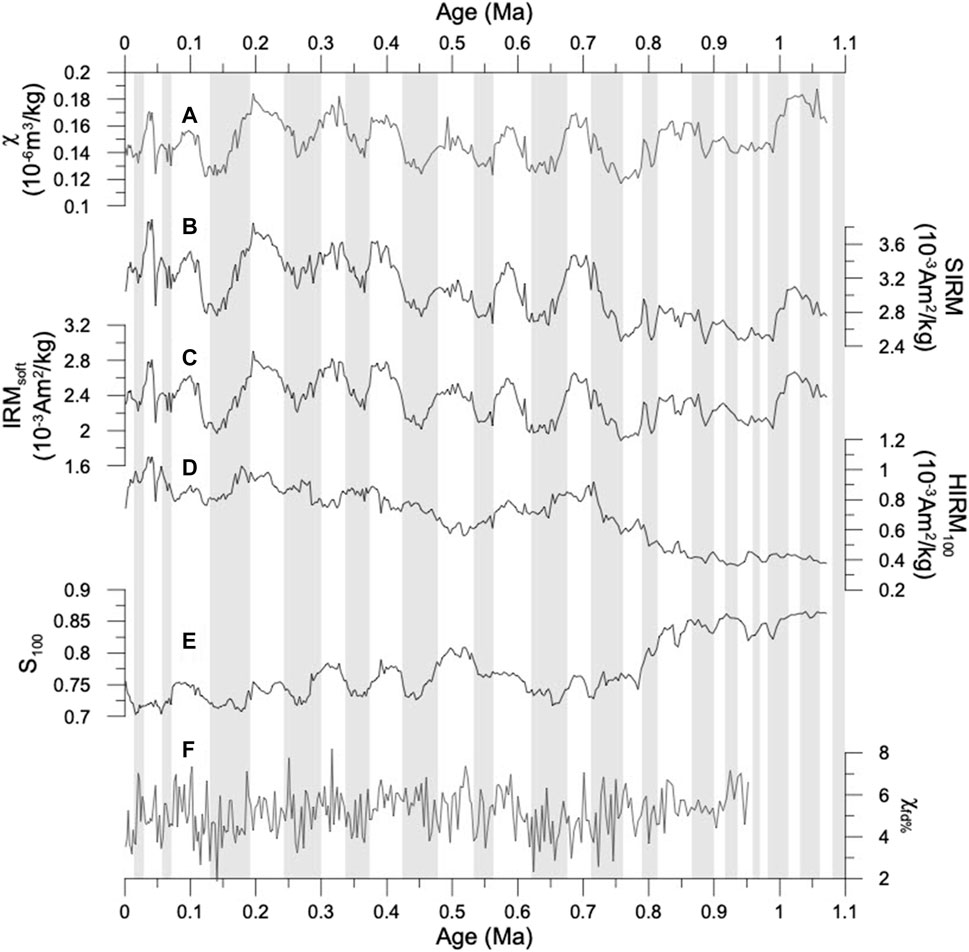
FIGURE 2. Temporal variation of concentration-related magnetic parameters of NPGP1401-2A. (A) χ, magnetic susceptibility (Shin et al., 2019); (B) SIRM, saturation isothermal remanent magnetization (Shin et al., 2019); (C) IRMsoft, soft IRM fraction (coercivity of <100 mT); (D) HIRM100, hard IRM (coercivity of >100 mT); (E) S-ratio (S100) and (F) χfd%, frequency-dependent magnetic susceptibility. The grey bars indicate glacial periods.
To diagnose the variation of magnetic mineral concentration, SIRM was separated into lower and higher coercivity fractions on the criterion of 100 mT (IRMsoft and HIRM100, respectively). IRMsoft accounts for ∼70–85% of SIRM and displays distinctive glacial-interglacial changes without a long-term increasing trend (Figure 2C). On the other hand, HIRM100, comprising ∼15–30% of SIRM, shows a clear long-term increasing trend with diminished cyclic short-term variation (Figure 2D). Notably, HIRM100 increases gradually over the last 1 Myr with a dramatic increase across the MPT between 0.9 and 0.7 Ma and then a gradual decrease until ∼0.5 Ma and increase afterward. The variation of IRMsoft percentage in SIRM is displayed as S100, which ranges at 0.7–0.85 (Figure 2E). The S100 shows glacial decreases and a long-term decrease, which reflects the relative decrease/increase of the low/high coercivity fractions, as shown by IRMsoft and HIRM100, respectively. All these results indicate that low and high coercivity fractions account for the short and long-term changes in magnetic signals, respectively.
Unmixing of Magnetic Components
IRM component analysis enables the isolation of different magnetic coercivity components. In all samples, four coercivity components are commonly identified (Figure 3A). Component 1 exhibits a low coercivity fraction with skewed coercivity distribution, probably due to the thermal relaxation effect of SP grains (Heslop et al., 2004; Zhang et al., 2018). Component 2 is characterized by a narrow dispersion (∼0.2) at a mean coercivity (Bh) of ∼35 mT, corresponding to biogenic magnetite (Egli, 2004). Component 3 is recognized as detrital ferrimagnetic grains (e.g., magnetite and maghemite) showing a peak dispersion at Bh of ∼100 mT. Component 4 at Bh of ∼260 mT indicates detrital antiferromagnetic minerals, such as hematite and goethite. Components 2 and 3 are the major contributors of SIRM, accounting for approximately 44 and 34%, respectively. FORC diagrams display distinct central ridge along the Bu = 0 axis and surrounding triangular spread (Figure 3B), which confirms the main contribution from non-interacting single-domain (SD) biogenic magnetite and vortex state detrital grains, respectively, (Roberts et al., 2000, 2019).
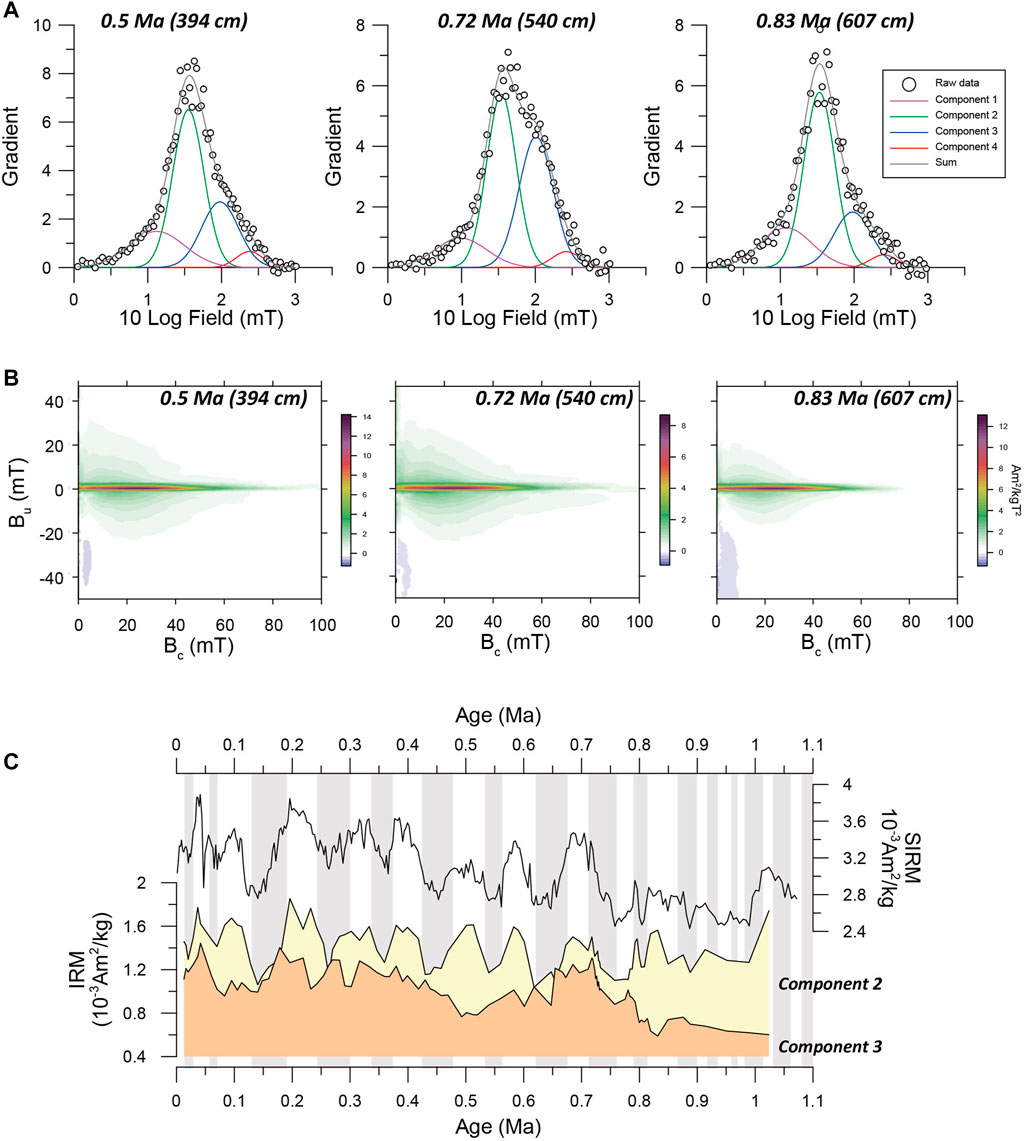
FIGURE 3. IRM unmixing results and FORC diagrams for selected samples and temporal variation of IRM components. (A) IRM coercivity spectra and unmixing results; (B) FORC diagrams, and (C) comparison between SIRM and absolute concentration of IRM components. IRM components (Component 1–4) are presented as purple, green, blue, and red lines, respectively. The sum of components delineates the best-fitted coercivity spectra. Absolute IRM values (IRM = percentage contribution (%) of component × SIRM) for the major components (Component 2 and 3) colored by yellow and orange, respectively.
The relative contribution of biogenic and detrital magnetic components shows temporal changes in both IRM and FORC distributions (Figures 3A,B). To estimate the concentration changes, the absolute IRMs of Components 2–4 were calculated as IRM = percentage contribution (%) of component × SIRM, and the IRM variations are presented in Figure 3C; Supplementary Figure S2. For the major components, Component 2 generally shows glacial-interglacial fluctuations, resembling IRMsoft, while Component 3 has a variation analogous to that of HIRM100 (Figures 2C,D). Component 4 accounts for only a small percentages (3–7%) of overall SIRM variation owing to the weak magnetization of antiferromagnetic minerals. This component shows a gradual long-term increase in concentration over the last 1 Myr, which is roughly similar with HIRM300 (high coercivity fraction of >300 mT) variation (Supplementary Figure S2). However, compared to Component 3, Component 4 exhibits a less pronounced increase around ∼0.8 Ma (Figure 3C; Supplementary Figure S2). Such magnetic unmixing results confirm that low coercivity biogenic magnetite and high coercivity detrital ferrimagnetic minerals mainly control the bulk magnetic variations at glacial-interglacial and longer-term timescales, respectively.
Electron Microscope Observation
From SEM observations of the magnetic extracts for selected samples, magnetic grains of various sizes and morphologies were observed (Figure 4A). On a scale of tens of microns (generally >10 μm), the grains often have an angular, irregular, and vesicular texture and show magnetite inclusions (Figure 4B), which corresponds to the characteristics of volcanic ashes reported in the North Pacific (Shin et al., 2020). Smaller grains are dominated by rounded and subrounded (titano) magnetite grains, representing reworked and abraded eolian particles (Figure 4C).
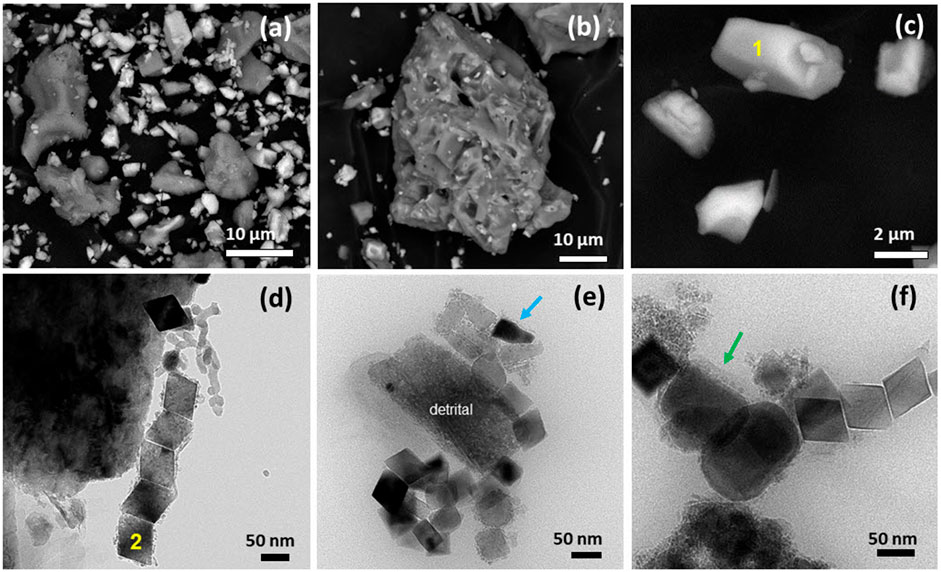
FIGURE 4. Scanning electron microscopy (SEM) and transmission electron microscopy (TEM) images of magnetic extracts. Representative SEM images of (A) detrital grains in various sizes and morphologies; (B) volcanic grains; (C) eolian dust grains (titanomagnetite) and (D–F) TEM images of biogenic magnetite in tens of micron size. Numbers indicate EDS spots (Supplementary Figure S3). In SEM backscattered images (A–C), iron oxides show higher contrast (bright particles). Blue and green arrows show the presence of bullet-shaped and elongated prismatic biogenic magnetites.
To confirm the presence of biogenic magnetite, TEM observations were made on magnetic extracts of four samples at glacial and interglacial intervals. From all selected samples, biogenic magnetite was mostly identified as equant type in morphology and bullet and elongated prismatic types occasionally with a size of ∼50 nm (Figures 4E,F). The dominance of equant-type biogenic magnetite is consistent with our IRM unmixing results that showed the low coercivity peak (∼35 mT) of the biogenic component (i.e., soft biogenic magnetite; Egli, 2004) in all samples (Figure 3A).
Discussion
Synchronous Magnetic Signals in the North Pacific
Our results indicate that sedimentary magnetic signals come from biogenic and detrital components, showing different temporal variation patterns (Figure 3). In pelagic sediments, the relative variation of the two magnetic components can be indicated by χARM/SIRM, because χARM sensitively responds to SD grains with weak magnetostatic interactions, such as biogenic magnetite (Egli, 2004; Yamazaki, 2008). That is, higher/lower ratios are equivalent to more biogenic/detrital contributions, respectively. For the studied sediments, χARM/SIRM exhibits distinct glacial-interglacial fluctuations and a long-term decreasing trend (Figure 5B), as shown in biogenic and detrital IRM components (i.e., Components 2 and 3), respectively, (Figure 3C). In the older part (<0.6 Ma), the glacial-interglacial variability of χARM/SIRM is more evident when compared directly to the LR04 record than to the alternating marine isotope stages shaded in gray (Figures 5A,B). The IRM ratio of the two components (Component 2/Component 3) shows similar variation to χARM/SIRM, confirming that the χARM/SIRM variation reflects their relative contribution (Figure 5B). As Component 3 has a coercivity of ∼100 mT, S100 also exhibits similar variations, reflecting the relative abundance of biogenic and detrital components (Figure 2E) (e.g., Yamazaki, 2009).
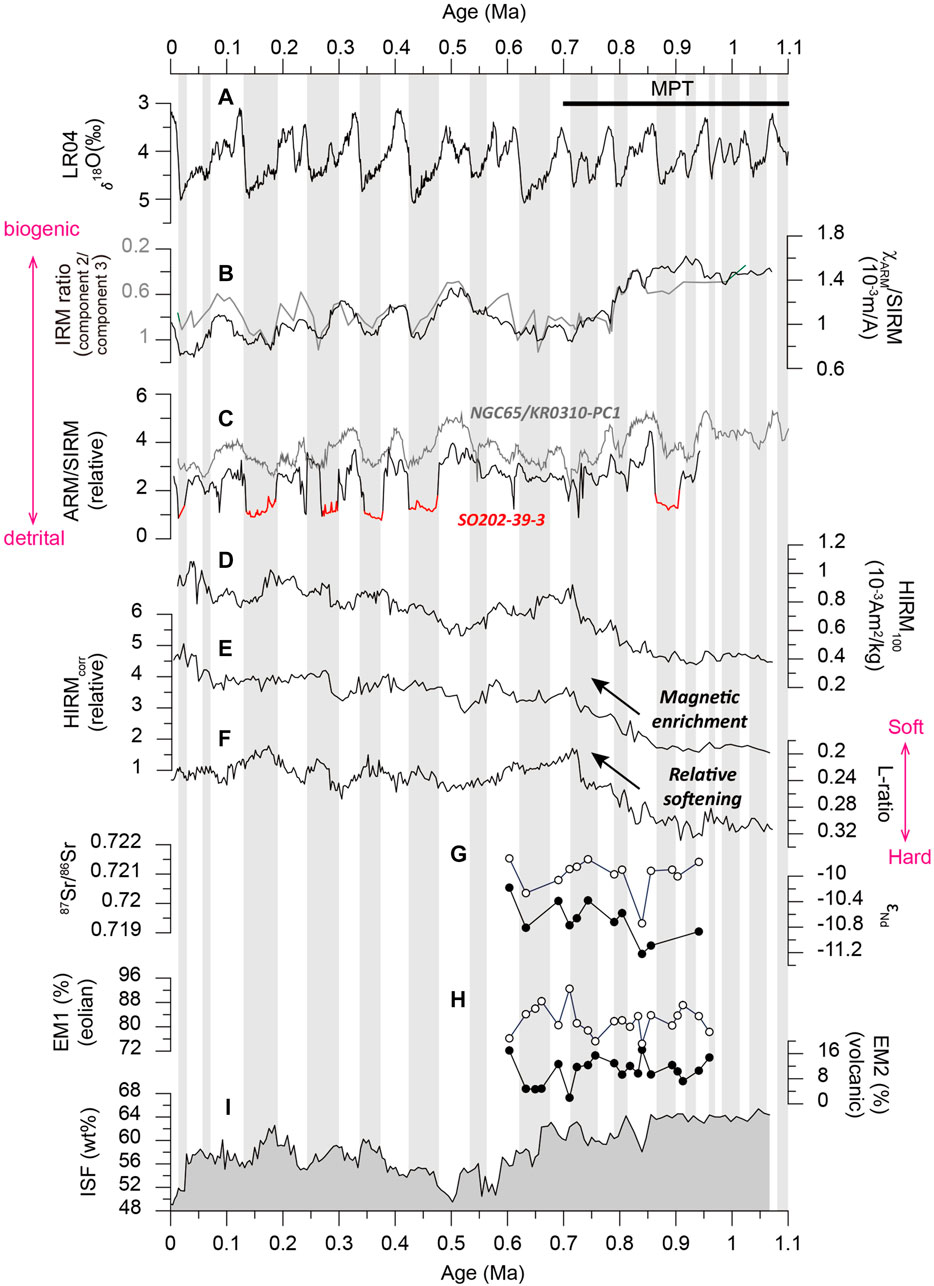
FIGURE 5. Temporal variations of global oxygen isotope stack, magnetic and geochemical compositions of NPGP1401-2A and reference cores. (A) LR04 (Lisiecki and Raymo, 2005); (B) Ratios of anhysteretic remanent susceptibility to SIRM (χARM/SIRM) (Shin et al., 2019) and IRM components (Component 2 and 3); (C) ARM/SIRM of reference cores (NGC65/KR0310-PC1 and SO202-39-3; Figure 1); (D) HIRM100; (E) HIRMcorr (corrected HIRM100 for the non-terrigenous fraction calculated by HIRMcorr = HIRM100/(100—water content%)/inorganic silicate fraction (ISF%); (F) L-ratio; (G) 87Sr/88Sr (white dots) and εNd (black dots) values (Lee et al., 2019); (H) the major end-members, EM1 (white dots) EM2 (black dots), from grain size analysis (Lee et al., 2019); (I) ISF content (wt%). The MPT is marked at the top (1.2–0.7 Ma; Clark et al., 2006). Red in (C) presents intervals of post-depositional alteration.
The glacial-interglacial fluctuation of biogenic magnetite can be associated with several environmental factors. In the northwest Pacific, it has been proposed that magnetic minerals dissolve under reducing conditions during some glacial periods due to climate-related cyclic redox changes at glacial-interglacial timescales (Korff et al., 2016). The intervals for magnetic mineral dissolution are identified as abrupt decreases in ARM/SIRM (marked as red lines in Figure 5C) because fine-grained magnetite (e.g., biogenic magnetite) dissolves preferentially due to its large surface-to-volume ratio (Karlin and Levi, 1983). Our χARM/SIRM displays similar glacial decreases but does not show prominent drops throughout the studied period as in the SO202-39-3 core (Figure 5C), indicative of weak or little dissolution effect at our study site. From the TEM observations, we could not find any direct evidence on diagenetic alteration of biogenic magnetite (e.g., partially etched grains; Yamazaki, 2020) in all the samples (Figure 4). Thus, we interpret that most of magnetic grains in our sediments, including biogenic magnetite, have not been subjected to reductive dissolution. Prior to the post-depositional alteration, the production of biogenic magnetite may have controlled its concentration on glacial-interglacial timescales, as it has been suggested to respond to climate factors, such as iron and organic carbon supply (Roberts et al., 2011). However, the biogenic magnetite concentration could also be sensitive to changes in the sedimentation rate changes. For example, enhanced eolian dust input during glacials may lower the apparent concentration of biogenic magnetite (Yamazaki, 2009). Although the cause of the biogenic magnetite signal is not conclusive with the presented data, further detailed studies on biogenic magnetite flux would be helpful to resolve this.
Despite some ambiguity about the cause of glacial-interglacial variation, χARM/SIRM (or ARM/SIRM) variations compiled in the North Pacific mimic each other since ∼1 Ma, indicating simultaneous long-term variation of detrital and biogenic magnetic signals (Figures 5B,C). In detail, the χARM/SIRM has a large valley within the time span of ∼0.8–0.5 Ma centered around 0.7 Ma, reflecting the increased detrital contribution during this time period (Figure 5B). Such temporal features match well with the variation of HIRM100, showing only detrital contribution (Figures 3C, 5B). Such similarity strongly suggests that the increased detrital magnetic contribution during 0.8–0.5 Ma is synchronized regionally in the North Pacific.
Long-Term Variation of Detrital Magnetic Signals Since 1 Ma
As detrital magnetic components in the studied sediments are characterized by high coercivity, mainly of ∼100 mT (Figure 3), HIRM100 can be used as a proxy for the concentration of detrital magnetic minerals. Such detrital magnetic signal in bulk sediments is generally recognized as terrigenous contributions unless there is significant source change or alteration of magnetic minerals (Yamazaki, 2009). However, for the studied sediments, HIRM100 and ISF show different long-term trends (Figures 5D,I); HIRM100 shows a striking increase during 0.8–0.7 Ma, while the ISF content shows a stable high value (∼60%) in older (>0.7 Ma) sediments. After then, they show comparable variations with a decrease at ∼0.5 Ma. To highlight the differences between the detrital magnetic fraction and ISF, dilution effects on HIRM100 by the non-terrigenous fraction were corrected: HIRMcorr = HIRM100/(100—water content%)/ISF% (Figure 5E). The HIRMcorr shows a distinct increase after ∼0.8 Ma, indicating that magnetic minerals have been gradually enriched in detrital sediments.
We also assessed the coercivity distribution of the detrital magnetic fraction (i.e., high coercivity fraction) using the L-ratio (Liu et al., 2007). The L-ratio shows a dramatic decrease during ∼0.8–0.7 Ma, along with increasing HIRM100, and a gentle increase at ∼0.5 Ma (Figure 5F). Liu et al. (2007) suggested that the L-ratio is indicative of the coercivity distribution of hematite when a hard magnetic fraction (>100 mT) is carried by hematite, but the studied sediments cannot be interpreted as such because the hard fraction is dominantly contributed by ferrimagnetic minerals of ∼100 mT (e.g., magnetite/maghemite; Figure 3). In this study, the L-ratio decrease reflects the greater input of the ∼100 mT materials rather than antiferromagnets of ∼300 mT, which can be confirmed by IRM Component 3 showing a more pronounced increase in concentration since ∼0.8 Ma compared to Component 4 (Figure 3C; Supplementary Figure S2). Thus, the concurrent (opposite) variation between the L-ratio and HIRM100 indicates relative softening and enrichment of detrital magnetic minerals due to ferrimagnetic input over the last ∼1 Myr, especially after ∼0.8 Ma.
In summary, the concentration of magnetic minerals in the detrital sediment fraction significantly increases after ∼0.8 Ma, which is also accompanied by a shift in the coercivity distribution (i.e., relative magnetic softening). Based on the coercivity component analysis, we attribute such magnetic changes to ferrimagnetic mineral enrichment. Interestingly, such ferrimagnetic enrichment accounts for the long-term increase of SIRM since ∼0.8 Ma (Figure 2B), whereas χ fluctuates within a relatively uniform range (Figure 2A). Considering the relatively high ISF content in the lower part of the core (Figure 5I), the difference may be due to mineralogical change affecting χ signals, such as contribution of non-ferromagnetic materials (e.g., paramagnetic minerals). Therefore, the increase in ferrimagnetic signals could be reflected better by SIRM than by χ in the study area. Nevertheless, as shown by similar trends in χARM/SIRM (or ARM/SIRM) records (Figures 5B,C), the timing of this notable magnetic change (i.e., ∼0.8 Ma) is likely synchronized across the North Pacific.
Eolian Dust Evolution Across the MPT
For North Pacific sediments, an increase in the high coercivity fraction in the bulk sediment can be attributed to enhanced dust input from inland Asia during cold periods because eolian dust is the main terrigenous constituent (Doh et al., 1988; Yamazaki and Ioka, 1997). In this study, however, HIRM100 reflects magnetic mineralogical change in the detrital fraction as well as its quantitative change, taking into account the increase of HIRMcorr and decrease in L-ratio, especially at ∼0.8–0.7 Ma. Such magnetic mineralogical changes in the studied sediments implies changes in the source materials.
We can first consider the supply of ferrimagnetic minerals from volcanic materials. In the North Pacific, terrigenous sediments are generally a binary mixture of Asian dust and volcanic materials supplied from nearby arc regions (e.g., Japan and Kamchatka) (Pettke et al., 2000). Recent magnetic studies have shown that volcanic materials are characterized by abundant high coercivity ferrimagnetic minerals as well as strong magnetic signals (Zhang et al., 2018; Shin et al., 2020). However, the volcanic contribution is indicated as low at ∼10% for the studied sediments in the Sr-Nd isotope compositions and grain size analysis (Lee et al., 2019). End-member (EM) analysis of grain-size distribution reveals two main contributors (EM1, mode size at 3.5 μm; EM2, mode size at 11 μm), probably corresponding to fine dust and coarse volcanic particles, respectively, (Supplementary Figure S4; Lee et al., 2019). Our SEM observation of magnetic extracts agrees that volcanic particles mainly exist in a few tens of micron in size (Figure 4B). The volcanic component (EM2) shows only minor temporal changes until 0.6 Ma (Figure 5H). These sedimentological data confirm that our detrital magnetic signals are primarily of eolian origin, and the volcanic contribution is negligible with respect to temporal variation. Therefore, it is reasonable to conclude that the magnetic mineralogical change after ∼0.8 Ma is due to changes in dust source materials, including their provenance.
The isotope compositions of detrital sediments are a useful indicator of provenances variability in Asian dust records over the past millions of years (Chen and Li, 2013). In the studied sediments, the Sr-Nd isotopic compositions are relatively invariant and designate central Asian deserts (e.g., the Taklimakan desert) as the main provenance (Figure 5G; Pettke et al., 2002; Lee et al., 2019). However, a small increase in εNd values after ∼0.8 Ma (Figure 5G), together with the magnetic enrichment (Figure 5E), could support changes in dust contribution from different sources. For example, global cooling during the MPT could have changed the dust transport pathway due to climate-related latitudinal shifts of westerlies (see Figure 1; Schiemann et al., 2009; Nagashima et al., 2011). As observed in the present spring conditions, meridional dispersion of Westerly jet path could occur during cold periods together with a southward shift of the main jet axis (Schiemann et al., 2009; Abell et al., 2021). In such Westerly jet condition, dust supply may have been enhanced from the high-latitude deserts on the Central Asia orogenic belt (e.g., the Mongolian Gobi), which have relatively high εNd values (Zhao et al., 2014; Lee et al., 2019). Another potential mechanism for changes in dust source materials is regional aridification and desertification in the Asian interior during the MPT (Rea et al., 1998). The extensively exposed drylands of Central Asia, where isotopic compositions are similar (Chen et al., 2007; Zhao et al., 2014), may have supplied dust with a slightly increased εNd composition and more abundant magnetic minerals. In addition, the relative enrichment of ferrimagnetic component could also be associated with a decrease in chemical weathering intensity in various source regions during intensified aridification (e.g., Deng et al., 2006; Zan et al., 2010).
Taken together, our magnetic data suggest changes in dust sources in the central North Pacific at ∼0.8 Ma, but it is not possible to present conclusive sedimentological or geochemical evidence in this study to support our conclusions derived from magnetic data. The source change had been likely caused by the reorganization of atmospheric circulation and/or regional aridification changes associated with climate changes during the MPT, which need to be elucidated with further investigation on magnetic mineral distributions in various source regions of Asia.
Conclusion
To identify the climate dependence of eolian dust properties, sediment magnetic signals for the last ∼1 Myr were investigated in the central North Pacific. As a result of the IRM component and FORC analyses, the bulk magnetic signals are decoupled to biogenic and detrital origins showing lower and higher coercivity than 100 mT, respectively. SEM and TEM observations confirm the presence of biogenic magnetite and detrital magnetic grains (eolian dust and volcanic particles). The biogenic and detrital components mainly present glacial-interglacial cyclicity and long-term variation in their concentrations, respectively. Based on similar long-term trends in χARM/SIRM (or ARM/SIRM) records, variations in biogenic and detrital magnetic components are likely synchronized in the North Pacific. As a proxy of the concentration of the detrital magnetic component, HIRM100 shows a long-term increase since 1 Ma, with a significant increase at ∼0.8–0.7 Ma. As ISF shows relatively low content after ∼0.7 Ma, the HIRM100 increase at ∼0.8–0.7 Ma reflects magnetic mineral enrichment in detrital sediments. In this period, the L-ratio also concurrently decreases with the HIRM100 increase, indicating relative softening of detrital magnetic minerals (i.e., relative abundance of ferrimagnetic minerals). Combined with sedimentological information, such ferrimagnetic enrichment after ∼0.8 Ma suggests a change in dust source materials because the contribution of volcanic materials is generally low and negligible. The source change could be induced by the reorganization of atmospheric circulation and/or enhanced aridification in the Asia interior across the MPT.
Data Availability Statement
The original contributions presented in the study are included in the article/Supplementary Material, further inquiries can be directed to the corresponding author.
Author Contributions
JS designed the study, carried out the analyses, and wrote the article. KH and WK discussed the results and reviewed the article. All authors contributed to the article and approved the submitted version.
Funding
This study was financially supported by the Korea Institute of Ocean Science and Technology (PE99924) and by Basic Science Research Program through the National Research Foundation of Korea (NRF) funded by the Ministry of Education (2021R1A6A3A03038600).
Conflict of Interest
The authors declare that the research was conducted in the absence of any commercial or financial relationships that could be construed as a potential conflict of interest.
Publisher’s Note
All claims expressed in this article are solely those of the authors and do not necessarily represent those of their affiliated organizations, or those of the publisher, the editors and the reviewers. Any product that may be evaluated in this article, or claim that may be made by its manufacturer, is not guaranteed or endorsed by the publisher.
Acknowledgments
We appreciate the editor JN for handling the paper and the two reviewers JZ and JB for their valuable comments. English editing of the manuscript was performed by Editage (http://www.editage.co.kr).
Supplementary Material
The Supplementary Material for this article can be found online at: https://www.frontiersin.org/articles/10.3389/feart.2021.789584/full#supplementary-material
References
Abell, J. T., Winckler, G., Anderson, R. F., and Herbert, T. D. (2021). Poleward and Weakened Westerlies during Pliocene Warmth. Nature 589, 70–75. doi:10.1038/s41586-020-03062-1
Bloemendal, J., King, J. W., Hall, F. R., and Doh, S.-J. (1992). Rock Magnetism of Late Neogene and Pleistocene Deep-Sea Sediments: Relationship to Sediment Source, Diagenetic Processes, and Sediment Lithology. J. Geophys. Res. 97, 4361–4375. doi:10.1029/91jb03068
Chen, J., Li, G., Yang, J., Rao, W., Lu, H., Balsam, W., et al. (2007). Nd and Sr Isotopic Characteristics of Chinese Deserts: Implications for the Provenances of Asian Dust. Geochimica et Cosmochimica Acta 71, 3904–3914. doi:10.1016/j.gca.2007.04.033
Chen, Z., and Li, G. (2013). Evolving Sources of Eolian Detritus on the Chinese Loess Plateau since Early Miocene: Tectonic and Climatic Controls. Earth Planet. Sci. Lett. 371-372, 220–225. doi:10.1016/j.epsl.2013.03.044
Clark, P. U., Archer, D., Pollard, D., Blum, J. D., Rial, J. A., Brovkin, V., et al. (2006). The Middle Pleistocene Transition: Characteristics, Mechanisms, and Implications for Long-Term Changes in Atmospheric pCO2. Quat. Sci. Rev. 25, 3150–3184. doi:10.1016/j.quascirev.2006.07.008
Dearing, J. A., Dann, R. J. L., Hay, K., Lees, J. A., Loveland, P. J., Maher, B. A., et al. (1996). Frequency-dependent Susceptibility Measurements of Environmental Materials. Geophys. J. Int. 124, 228–240. doi:10.1111/j.1365-246x.1996.tb06366.x
Deng, C., Shaw, J., Liu, Q., Pan, Y., and Zhu, R. (2006). Mineral Magnetic Variation of the Jingbian Loess/paleosol Sequence in the Northern Loess Plateau of China: Implications for Quaternary Development of Asian Aridification and Cooling. Earth Planet. Sci. Lett. 241, 248–259. doi:10.1016/j.epsl.2005.10.020
Doh, S.-J., King, J. W., and Leinen, M. (1988). A Rock-Magnetic Study of Giant Piston Core LL44-GPC3 from the central North Pacific and its Paleoceanographic Implications. Paleoceanography 3, 89–111. doi:10.1029/pa003i001p00089
Egli, R. (2004). Characterization of Individual Rock Magnetic Components by Analysis of Remanence curves.2. Fundamental Properties of Coercivity Distributions. Phys. Chem. Earth, Parts A/B/C 29, 851–867. doi:10.1016/j.pce.2004.04.00110.1016/s1474-7065(04)00129-9
Egli, R. (2013). VARIFORC: An Optimized Protocol for Calculating Non-regular First-Order Reversal Curve (FORC) Diagrams. Glob. Planet. Change 110, 302–320. doi:10.1016/j.gloplacha.2013.08.003
F. M. Gradstein, J. G. Ogg, M. D. Schmitz, and G. M. Ogg (Editors) (2012). The Geologic Time Scale 2012 (Elsevier).
Harrison, R. J., and Feinberg, J. M. (2008). FORCinel: An Improved Algorithm for Calculating First-Order Reversal Curve Distributions Using Locally Weighted Regression Smoothing. Geochem. Geophys. Geosyst. 9, a–n. doi:10.1029/2008gc001987
Heslop, D., Dekkers, M. J., and Langereis, C. G. (2002). Timing and Structure of the Mid-pleistocene Transition: Records from the Loess Deposits of Northern China. Palaeogeogr. Palaeoclimatol. Palaeoecol. 185, 133–143. doi:10.1016/s0031-0182(02)00282-1
Heslop, D., McIntosh, G., and Dekkers, M. J. (2004). Using Time- and Temperature-dependent Preisach Models to Investigate the Limitations of Modelling Isothermal Remanent Magnetization Acquisition Curves with Cumulative Log Gaussian Functions. Geophys. J. Int. 157, 55–63. doi:10.1111/j.1365-246x.2004.02155.x
Hovan, S. A. (1995). Late Cenozoic Atmospheric Circulation Intensity and Climatic History Recorded by Eolian Deposition in the Eastern Equatorial Pacific Ocean, Leg 138. Proc. Ocean Drill Program 138, 615–625. doi:10.2973/odp.proc.sr.138.132.1995
Karlin, R., and Levi, S. (1983). Diagenesis of Magnetic Minerals in Recent Haemipelagic Sediments. Nature 303, 327–330. doi:10.1038/303327a0
Korff, L., von Dobeneck, T., Frederichs, T., Kasten, S., Kuhn, G., Gersonde, R., et al. (2016). Cyclic Magnetite Dissolution in Pleistocene Sediments of the Abyssal Northwest Pacific Ocean: Evidence for Glacial Oxygen Depletion and Carbon Trapping. Paleoceanography 31, 600–624. doi:10.1002/2015pa002882
Kruiver, P. P., Dekkers, M. J., and Heslop, D. (2001). Quantification of Magnetic Coercivity Components by Theanalysis of Acquisition Curves of Isothermal Remanentmagnetisation. Earth Planet. Sci. Lett. 189, 269–276. doi:10.1016/s0012-821x(01)00367-3
Larrasoaña, J. C., Roberts, A. P., Liu, Q., Lyons, R., Oldfield, F., Rohling, E. J., et al. (2015). Source-to-sink Magnetic Properties of NE Saharan Dust in Eastern Mediterranean marine Sediments: Review and Paleoenvironmental Implications. Front. Earth Sci. 3, 19. doi:10.3389/feart.2015.00019
Lee, S., Seo, I., and Hyeong, K. (2019). Reconstruction of Changes in Eolian Particle Deposition across the Mid-pleistocene Transition in the Central Part of the North Pacific. Ocean Polar Res. 41, 275–288. doi:10.4217/opr.2019.41.4.275
Lisiecki, L. E., and Raymo, M. E. (2005). A Pliocene-Pleistocene Stack of 57 Globally Distributed Benthic δ18O Records. Paleoceanography 20, a–n. doi:10.1029/2004pa001071
Liu, Q., Roberts, A. P., Torrent, J., Horng, C.-S., and Larrasoaña, J. C. (2007). What Do the HIRM andS-Ratio Really Measure in Environmental Magnetism? Geochem. Geophys. Geosyst. 8, a–n. doi:10.1029/2007gc001717
Nagashima, K., Tada, R., Tani, A., Sun, Y., Isozaki, Y., Toyoda, S., et al. (2011). Millennial-scale Oscillations of the westerly Jet Path during the Last Glacial Period. J. Asian Earth Sci. 40, 1214–1220. doi:10.1016/j.jseaes.2010.08.010
Nie, J., Pullen, A., Garzione, C. N., Peng, W., and Wang, Z. (2018). Pre-Quaternary Decoupling between Asian Aridification and High Dust Accumulation Rates. Sci. Adv. 4, eaao6977. doi:10.1126/sciadv.aao6977
Pettke, T., Halliday, A. N., Hall, C. M., and Rea, D. K. (2000). Dust Production and Deposition in Asia and the north Pacific Ocean over the Past 12 Myr. Earth Planet. Sci. Lett. 178, 397–413. doi:10.1016/s0012-821x(00)00083-2
Pettke, T., Halliday, A. N., and Rea, D. K. (2002). Cenozoic Evolution of Asian Climate and Sources of Pacific Seawater Pb and Nd Derived from Eolian Dust of Sediment Core LL44-GPC3. Paleoceanography 17, 3–1. doi:10.1029/2001pa000673
Rea, D. K., Snoeckx, H., and Joseph, L. H. (1998). Late Cenozoic Eolian Deposition in the North Pacific: Asian Drying, Tibetan Uplift, and Cooling of the Northern Hemisphere. Paleoceanography 13, 215–224. doi:10.1029/98pa00123
Roberts, A. P., Florindo, F., Villa, G., Chang, L., Jovane, L., Bohaty, S. M., et al. (2011). Magnetotactic Bacterial Abundance in Pelagic marine Environments Is Limited by Organic Carbon Flux and Availability of Dissolved Iron. Earth Planet. Sci. Lett. 310, 441–452. doi:10.1016/j.epsl.2011.08.011
Roberts, A. P., Hu, P., Harrison, R. J., Heslop, D., Muxworthy, A. R., Oda, H., et al. (2019). Domain State Diagnosis in Rock Magnetism: Evaluation of Potential Alternatives to the Day Diagram. J. Geophys. Res. Solid Earth 124, 5286–5314. doi:10.1029/2018jb017049
Roberts, A. P., Pike, C. R., and Verosub, K. L. (2000). First-order Reversal Curve Diagrams: A New Tool for Characterizing the Magnetic Properties of Natural Samples. J. Geophys. Res. 105, 28461–28475. doi:10.1029/2000jb900326
Schiemann, R., Lüthi, D., and Schär, C. (2009). Seasonality and Interannual Variability of the Westerly Jet in the Tibetan Plateau Region*. J. Clim. 22, 2940–2957. doi:10.1175/2008jcli2625.1
Shin, J. Y., Kim, W., and Hyeong, K. (2020). High Potency of Volcanic Contribution to the ∼400 Kyr Sedimentary Magnetic Record in the Northwest Pacific. Front. Earth Sci. 8, 300. doi:10.3389/feart.2020.00300
Shin, J. Y., Yu, Y., and Kim, W. (2019). Wavelet-based Verification of a Relative Paleointensity Record from the North Pacific. Earth Planets Space 71, 88. doi:10.1186/s40623-019-1067-x
Tan, M., Zhang, W., Fang, X., Yan, M., Zan, J., and Zhang, T. (2020). Rock Magnetic Record of Core SG-3 since 1 Ma in the Western Qaidam Basin and its Paleoclimate Implications for the NE Tibetan Plateau. Palaeogeogr. Palaeoclimatol. Palaeoecol. 560, 109949. doi:10.1016/j.palaeo.2020.109949
Yamazaki, T. (2009). Environmental Magnetism of Pleistocene Sediments in the North Pacific and Ontong-Java Plateau: Temporal Variations of Detrital and Biogenic Components. Geochem. Geophys. Geosyst. 10, a–n. doi:10.1029/2009gc002413
Yamazaki, T., and Ioka, N. (1997). Environmental Rock-Magnetism of Pelagic clay: Implications for Asian Eolian Input to the North Pacific since the Pliocene. Paleoceanography 12, 111–124. doi:10.1029/96pa02757
Yamazaki, T., and Kanamatsu, T. (2007). A Relative Paleointensity Record of the Geomagnetic Field since 1.6 Ma from the North Pacific. Earth Planet. Sp 59, 785–794. doi:10.1186/bf03352741
Yamazaki, T. (2008). Magnetostatic Interactions in Deep-Sea Sediments Inferred from First-Order Reversal Curve Diagrams: Implications for Relative Paleointensity Normalization. Geochem. Geophys. Geosyst. 9, a–n. doi:10.1029/2007gc001797
Yamazaki, T. (2020). Reductive Dissolution of Biogenic Magnetite. Earth Planets Space 72, 150. doi:10.1186/s40623-020-01290-3
Zan, J., Fang, X., Yang, S., Nie, J., and Li, X. (2010). A Rock Magnetic Study of Loess from the West Kunlun Mountains. J. Geophys. Res. 115, 115. doi:10.1029/2009jb007184
Zan, J., Fang, X., Yang, S., and Yan, M. (2013). Evolution of the Arid Climate in High Asia since ∼1 Ma: Evidence from Loess Deposits on the Surface and Rims of the Tibetan Plateau. Quat. Int. 313-314, 210–217. doi:10.1016/j.quaint.2013.03.012
Zhang, Q., Liu, Q., Li, J., and Sun, Y. (2018). An Integrated Study of the Eolian Dust in Pelagic Sediments from the North Pacific Ocean Based on Environmental Magnetism, Transmission Electron Microscopy, and Diffuse Reflectance Spectroscopy. J. Geophys. Res. Solid Earth 123, 3358–3376. doi:10.1002/2017jb014951
Zhang, Q., Liu, Q., Roberts, A. P., Larrasoaña, J. C., Shi, X., and Jin, C. (2019). Mechanism for Enhanced Eolian Dust Flux Recorded in North Pacific Ocean Sediments since 4.0 Ma: Aridity or Humidity at Dust Source Areas in the Asian interior? Geology 48, 77–81. doi:10.1130/g46862.1
Zhang, W., Chen, J., Ji, J., and Li, G. (2016). Evolving Flux of Asian Dust in the North Pacific Ocean since the Late Oligocene. Aeolian Res. 23, 11–20. doi:10.1016/j.aeolia.2016.09.004
Keywords: eolian dust, north pacific, magnetic minerals, mid-pleistocene transition, dust source
Citation: Shin JY, Hyeong K and Kim W (2021) A Sediment Magnetic Record in the North Pacific Across the Mid-Pleistocene Transition and its Implication on Asian Dust Evolution. Front. Earth Sci. 9:789584. doi: 10.3389/feart.2021.789584
Received: 05 October 2021; Accepted: 29 October 2021;
Published: 16 November 2021.
Edited by:
Junsheng Nie, Lanzhou University, ChinaReviewed by:
Jinbo Zan, Institute of Tibetan Plateau Research (CAS), ChinaJosh Bridges, University of Rochester, United States
Copyright © 2021 Shin, Hyeong and Kim. This is an open-access article distributed under the terms of the Creative Commons Attribution License (CC BY). The use, distribution or reproduction in other forums is permitted, provided the original author(s) and the copyright owner(s) are credited and that the original publication in this journal is cited, in accordance with accepted academic practice. No use, distribution or reproduction is permitted which does not comply with these terms.
*Correspondence: Wonnyon Kim, d2tpbUBraW9zdC5hYy5rcg==