 Yu Guimin1*
 Kong Qingwen
- 1Drilling and Completion Office, China National Offshore Oil Corporation (CNOOC), Beijing, China
- 2CNOOC Shenzheng Company, China National Offshore Oil Corporation (CNOOC), Shenzheng, China
- 3School of Petroleum Engineering, China University of Petroleum (East China), Qingdao, China
Hydrate plug in the drainage line is a serious flow assurance problem for the pilot production of offshore natural gas hydrates. Current research focuses on hydrate deposition in the annular flow and the oil-dominated system. The multiphase flow system in the drainage line is a water-dominated system which is normally a bubbly flow. In this work, a new model is developed to study the temperature and pressure field in the drainage line considering that the flow pattern is bubbly flow. Combining with the methane hydrate phase equilibrium curve, the hydrate formation region in the drainage line can be established. The hydrate formation region is enlarged with the ESP pressure increasing and the water production rate decreasing, since the ESP can supply extra pressures in the drainage line and the heat transfer phenomenon is enhanced between the drainage line and environment under the low water production rate condition. The model pointed out that the risk of hydrate formation rises up as the hydrate concentration increases beyond 6%. This study can lay a theoretical foundation for the efficient prevention of gas hydrates in the drainage line during offshore natural gas hydrate pilot or long-term production.
Introduction
Natural gas hydrate is a kind of new energy resource which compensates the lacks of onshore crude oil and natural gas. Natural gas hydrate are crystalline inclusion compounds where methane molecules are enclosed by water clathrates under low temperature and high pressure condition (Fu et al., 2019a). Normally, natural gas hydrate reservoirs are found in deep water, plateau, or high latitude areas. For example, in South China Sea, natural gas hydrates are located in the region where water depth is about 1000 m and local temperature is close to 4°C (Fu et al., 2020a; Sun et al., 2020).
China has conducted two successful pilot productions of natural gas hydrate in the Shenhu area of South China Sea. The production rates of natural gas hydrates for two pilot production have reached 5000 m3/d and 2.87 × 10⁴ m3/d respectively (Xu et al., 2017). Since decomposition of natural gas hydrates results in large water production rate in the well, the down hole separation technology is utilized in the natural gas hydrate well. The submersible electrical pump is used to upload the water through the drainage pipeline. The natural gas is produced though the gas line. According to the published data, the actual separation efficiency of the gas-liquid separator in Japan’s first hydrate trial production was around 80–90% (Liu et al., 2021). Since the down hole separation cannot complete separate gas and liquid, some parts of gas may be entrained into the drainage line, as shown Figure 1 (Ye et al., 2020). Considering the low temperature and high pressure near the mud line, gas hydrates may be formed in the drainage line which induce the risk of hydrate blockage. The hydrate formation area in the drainage pipeline is larger than that in the gas production pipeline. This is because the liquid is a continuous phase in the drainage pipeline, and the mechanical energy of the liquid is higher than that of the gas, leading to higher pressure in the drainage pipeline. Therefore, the hydrate flow assurance in the water drainage pipeline becomes an important research area for the development of natural gas hydrates (Ye et al., 2020).
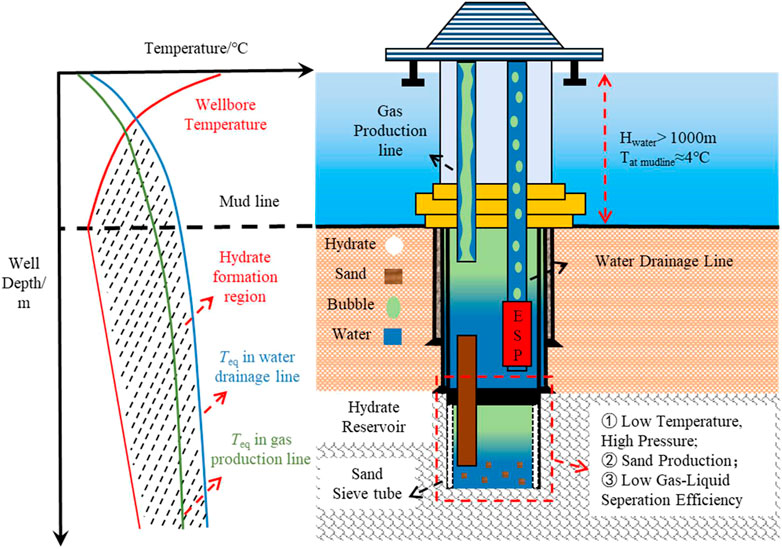
FIGURE 1. Hydrate formation region in the water drainage line and the gas production line for the pilot production of natural gas hydrates.
Current research on the hydrate flow assurance focuses on the hydrate problems in the water-oil-gas mixed transportation pipeline and the testing stage of gas wells (Zerpa et al., 2013; Chen et al., 2019). In the water-oil-gas mixed transportation pipeline, predecessors tended to study the rheology of water-in-oil emulsion and the mechanism of hydrate particle agglomeration (Lv et al., 2013; Shi et al., 2018; Peng et al., 2012), conducted the experiments to reveal the rheology of the hydrate slurries formed from diesel oil/condensate oil and water dispersed systems. The hydrate concentrations reach 30 vol% and the rheology of hydrate slurry obeys the power law model which exhibits shear-thinning behaviors. Based on Peng et al.’s study, Yan et al. (2014) further experimentally studied the rheology of hydrate slurries in water-in-oil emulsion with anti-agglomerant. In Yan et al.’s work, the water cut is up to 30 vol% and anti-agglomerant dosage is 3.0 wt%. The rheology of water-in-oil emulsion also plays a shear-thinning behavior. Considering the high energy density of hydrate slurry, Clain et al. (2012) experimentally investigated rheology of hydrate slurries in TBPB-water mixtures which is proven as a pseudoplastic fluid. Fu et al. (2018), Fu et al. (2019a), Fu et al. (2019b), and Fu et al. (2019c) presented a novel work on the methane hydrate formation in bubbly flow and revealed the influences of bubble behaviors on the hydrate formation, including bubble breakup, coalescence, and deformation. The presented model has been incorporated in the commercial software which used to predict the hydrate risk in the deep-water wellbore. Wang et al. (2010), Fu et al. (2020a), Fu et al. (2020b), Fu et al. (2020c), and Fu et al. (2020d) primarily studied the rheology of hydrate slurry in bubbly flow which is an important work in the hydrate flow assurance in the pilot production of natural gas hydrates and the drilling and production of deep-water oil and gas. Based on their experimental analysis, the dual behaviors of hydrate slurries are exhibited firstly where it behaves as the shear-thinning at the low shear rate condition and the shear-thickening behavior at the high shear rate condition. The hydrate blockage in the hydrate slurry in the water-continuous system is considered to be induced by the aggregation of hydrate particles. The rheology of hydrate slurry normally is considered as shear-thinning and a few cases exhibit as shear-thickening, where it depends on the interactions between hydrate particles.
As the natural gas production from deep water environment becomes popular, the hydrate flow assurance in the gas-dominated system rises up (Hegde et al., 2015; Li et al., 2015). In the testing stage of gas well, predecessors studied the hydrate formation and depositions in the annular flow. Di Lorenzo et al. (2014a)and Di Lorenzo et al. (2014b) firstly conducted experiments to study the characteristics of methane hydrate formation and deposition in the annular flow. In their works, the hydrate formation is evaluated from the liquid film of annular flow and the hydrate deposits inside the liquid film along the pipe wall. Wang et al. (2016) and Wang et al. (2017) enriched the hydrate formation and deposition model in the annular flow. Based on the characteristic of annular flow, they further consider the influence of water entrainment and liquid droplet deposition on the hydrate formation and deposition. Their model pointed out that 24–31% of hydrate particle formed from liquid droplets will deposit on the pipe wall, and an effective deposition ratio is proposed to describe the actual hydrate particle deposited on the pipe wall. The developed model is much closer to the industrial condition and has been widely accepted by field engineers. Based on Wang et al.’s model, Zhang et al. (2013) developed a real-time estimation model for hydrate deposition in the deep-water gas well testing. The model is enabled to calculate the distributions of pressure drop influenced by the hydrate deposition which considers the dynamic effect of hydrate behavior on fluid flow and surface roughness. Overall, in annular flow, the hydrate risk is normally induced by the hydrate deposition along the pipe wall and the pressure drop is the dominant factor to display the hydrate risk in the tubing. The variations of pressure drops are induced by the shrinkage of pipe inner diameter.
In this work, the flow pattern in the drainage line is bubbly hydrate slurry which is a water-continuous system. The hydrate formation in the liquid mainly alters the rheology of the fluid which finally changes the pressure drop. This work aims to develop a pressure drop prediction model for the drainage line in natural gas hydrate well by considering the influence of hydrate formation on the rheology of bubbly flow. The developed model provides a method to predict the risk of hydrate blockage in the drainage line.
Model Development
The accurate calculation of the temperature and pressure along the drainage line is an important foundation for predicting the hydrate formation region and developing hydrate management strategy for the drainage line. Prior to building the temperature and pressure prediction model, the gas-liquid flow behavior and the mass transfer mechanism between the drainage line and the sea water should be well understood.
In offshore natural gas production, the formation fluid decomposed from natural gas reservoirs are the mixed fluid of gas and liquid. The downhole production system is designed to artificially lift the gas and liquid through the gas line and the drainage line separately. Thinking that lower pressure drops are caused by the gas flow, the natural gas hydrate reservoir can provide efficient energy to lift gas to the platform. But the submersible electrical pump (ESP) installed at the drainage line is necessary to compensate the pressure drop, since higher pressure drops are caused by the liquid flowing. The ESP has a higher demand on the void fraction in the drainage line. If the void fraction is larger than 10%, the ESP would experience serious surge and the efficiency of liquid lifting is lowered seriously. However, the bubbly flow is unavoidable in the drainage line since the downhole separator cannot separate gas and liquid completely.
Moreover, the biggest difference between the conventional deep wellbore for oil and gas and the wellbore for natural gas hydrate is that the most parts of wellbore in the natural gas hydrate reservoir are located in the environment of the low temperature and the high pressure. The gas and liquid flowing in the wellbore can form gas hydrates easily which increases the risks of hydrate blockage. Generally, the heating or the chemical inhibitor injection in the bottom hole becomes an unavoidable measure to prevent hydrate blockage in the wellbore. If the hydrate formation happened in the drainage line, the pressure drops in the drainage line may increase theoretically and the load of the ESP be increased at the same time. Thus, the production efficiency of natural gas hydrates is also degraded.
Continuity Equation
Considering that the downhole separation technology cannot completely separate water and gas, some gas will be entrained in the drainage line. Thus, the drainage line has a gas-liquid two-phase flow, where the inflow of gas and liquid is from the natural gas hydrate reservoirs and the suction of the ESP. Because most of the gas will flow in the gas line, the flow pattern may be bubbly flow. The mass of gas and liquid are conserved and the mass conservation equations are given as Eq. 1 and Eq. 2 (Doron and Barnea, 1996; Doron et al., 1997; Zhang et al., 2021).
where A is the cross-section area of drainage pipe, m2, Eg is the volumetric fraction of gas phase, dimensionless, El is the volumetric fraction of liquid phase, dimensionless, ρl is liquid density, kg/m3, ρg is gas density, kg/m3, vg is gas velocity, m/s, vl is liquid velocity, m/s, t is production time of natural gas hydrate, s, z is the location of drainage line, m, Qg is gas flow rate, m3/s, and Ql is liquid flow rate, m3/s.
Momentum Conservation Equation
The gas and liquid in the drainage line is mainly subject to gravity, pressure difference force, and friction. Considering that the void fraction in the drainage line is less than 5%, the gas expansion induced by the temperature increasing is ignored. Based on the momentum conservation theory, the momentum conservation equation in the drainage line considers the variations of gas volumetric fractions and liquid volumetric fractions induced by gas expansion, which is given as Eq. 3 (Kokpmar and Gogus, 2001; Eskin and Scarlett, 2005; Sun et al., 2011; Zhang et al., 2021).
where ρm is the mixed density of gas and liquid, kg/m3, vm is the mixed velocity of gas and liquid, m/s, θ is the inclined angle of the drainage line, °, P is pressure, Pa, d is the diameter of drainage line, m, and subscript g and l are gas and liquid phase. The mixed density is calculated based on the density and the volumetric fraction of gas and liquid, as Eq. 4.
Temperature Calculation Equation
The temperature field in the drainage line plays an important role in determinations of the hydrate formation region and calculations of the pressure field. The heat exchange occurs during the flow of the mixed gas-liquid fluid in the drainage line which is induced by the temperature difference between the drainage line and the sea water. Ignoring the effect of hydrate formation on the temperature, the temperature field in the drainage line can be evaluated by Eq. 5 (Hasan and Kabir, 2012).
where Cpm is the specific heat at the constant pressure of the mixed fluid, J/(kg∙°C), T is the mixed fluid temperature, °C, H is the enthalpy of mixed fluid, J/kg, Q is the heat exchange rate between the and environment, J/(m∙s), ρm is the density of mixed fluid, kg/m3, and vm is the velocity of mixed fluid, m/s.
Considering that the drainage line is above the mud line, the heat exchange rates between drainage line and sea water are calculated by Eq. 6 (Zhang et al., 2021).
where Tsea is the temperature of sea water, °C, and Tf is the temperature of drainage line, °C.
The total heat transfer coefficient (Uto) is a critical parameter participating in the calculation of temperature field and affecting the heat transfer rate. Considering the thickness of the drainage line, Uto can be calculated by Eq. 7 (Zhang et al., 2021).
where rto is the outer radius of the drainage line, m, rti is the inner radius of the drainage line, m, hc is the thermal conductivity of the fluid, W·m−1·K−1, and kp is the conductivity of the drainage line,
Hydrate Slurry Rheology Model
The rheology of the mixed fluid participates in the calculation of pressure drop in the drainage line. Considering that the flow pattern in the drainage line is bubbly flow, the hydrate formation induces the bubbly flow transiting to the hydrate slurry bubbly flow which is a gas-liquid-hydrate mixed flow. Since the void fraction is less than 5%, the influence of bubbles on the rheology of hydrate slurry is ignored. Sun et al. (2020) has experimentally revealed the rheology of hydrate slurry bubbly flow where it performs as a non-Newtonian fluid. The non-Newtonian fluid index and the consistency faction can be calculated by Eq. 8 and Eq. 9 (Sun et al., 2020).
where n is the non-Newtonian fluid index, K is the consistency factor, and αhydr is the hydrate concentration in the hydrate slurry, %.
The shear rate of the hydrate slurry presents the influence of flow velocity on the apparent viscosity of the hydrate slurry. The hydrate slurry in the drainage line is considered as a shear-thickening fluid, since the flow rate is higher than the critical flow rate. Thus, the apparent viscosity increases with the hydrate concentration and the shear rate increasing. The shear rate and the apparent viscosity are be calculated by Eq. 10 and Eq. 11 (Sun et al., 2020).
Where γ is the shear rate, s−1, and μapp is the apparent viscosity of the hydrate slurry, mPas.
Hydrate Phase Equilibrium Model
The hydrate formation region is the cross-section area between the hydrate equilibrium curve and the temperature-pressure curve along the drainage line. In the field condition, the gas decomposed from the natural gas reservoir is pure methane. The produced water has a few salinities owing to the sea water and the formation water. However, the salinities can increase the hydrate equilibrium condition which enhances the difficulty for crystallization of gas hydrates and is beneficial for the hydrate prevention. Considering a safety factor for the hydrate prevention, the liquid phase is treated as a pure water in the drainage line (Zhang et al., 2021).
where Pe is the hydrate phase equilibrium pressure, MPa, a0 = −1.94138504464560 × 10⁵, a1 = 3.31018213397926×10³, a2 = −2.25540264493806 × 10, a3 = 7.67559117787059 × 10⁻², a4 = −1.30465829788791 × 10⁻⁴, a5 = 8.86065316687571 × 10⁻⁸.
Solution Method
The pressure, temperature, pressure drop, and ESP power are calculated by the algorithm which reveals the influences of hydrate formation on the multiphase flow behaviors in the drainage line. The hydrate formation region and the hydrate risk in the drainage line are evaluated by the developed model. The algorithm of the developed model is achieved by the visual basic language. The detailed solution steps are presented in Figure 2 and described as follows:
1) Obtaining basic information from the pilot production well, including gas-liquid flow rate, well head pressure and temperature, gas-liquid volumetric fraction, etc., the drainage line is divided into a few of control volumes. The dividing standard of control volume is 0.1 m. Gas-liquid flow rates are assumed to be constant.
2) In each control volume, void faction, temperature, and pressure are calculated by Eqs 1–11. The flow velocities of gas, liquid, and hydrate are obtained sequentially by the Runge-Kutta method prior to the calculation error within the allowable range.
3) Based on temperature and pressure in the drainage line, the methane hydrate equilibrium temperature and pressure are calculated by using Eq. 12. Comparing the temperature of the drainage line (Tf) and the gas hydrate equilibrium temperature (Tef), if Tf > Teq, no hydrate formation happens in the drainage line and stops the calculation. If Tf < Teq, gas hydrate would form in the drainage line and the consequent steps should be taken.
4) After the hydrate formation region is confirmed, the pressure drops in the hydrate formation region should consider the influence of hydrate formation which uses Eqs 8–11. The new bottom hole pressure and pressure drop (ΔPd) in the drainage line can be calculated based on the rheology of hydrate slurry. The comparisons between the pressure drop in the drainage line (ΔPd) and the ESP power (ΔPp) are conducted. If ΔPd < ΔPp, the ESP can work effectively. If ΔPd > ΔPp, the ESP is over-loaded and cannot lift the liquid to the platform effectively. A hydrate management should be taken in the drainage line and stop the calculation.
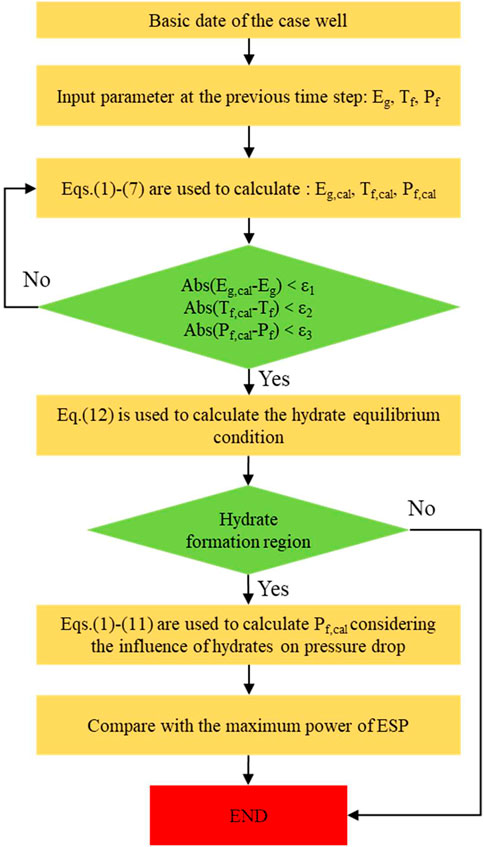
FIGURE 2. Algorithm for predicting the risk of hydrate in the drainage line during the pilot production of offshore natural gas hydrate.
Case Study
The risk of hydrate formation in the drainage line is analyzed based on the pilot production well during the second pilot production of natural gas hydrates in the Nankai Trough of Japan. In the pilot environment profile, the depth of sea water is 995 m, the mud line temperature is closed to 3.5°C, the geothermal gradient is 3°C/100 m, reservoir pressure is about 13 MPa (1,309.4 m), reservoir temperature is about 13.7°C, thickness of hydrate reservoir is about 60 m. In the wellbore profile, the first casing size is 13–3/8″, the second casing size is 8–1/2″, and the riser size is 9–5/8″. In the production profile, the average gas production is 8,330 Sm3/d and the average water production is 343.6 m3/d.
After comparing the temperature field and the methane hydrate equilibrium temperatures along the drainage line, the drainage line faces the risk of hydrate formation. Figures 3 and 4 exhibit the hydrate formation regions under the different water production rates and the ESP pressure. Figure 3 indicates that the fluid temperatures decrease gradually in the drainage line from the platform at the first and then increase gradually, where the dash curves are temperatures of fluid under varied water production rates and the solid green curve is the methane hydrate equilibrium temperature. As the water decomposed from the hydrate reservoir flows from the bottom hole to the platform, the temperatures of fluid decease gradually due to the geothermal temperature decreasing at the beginning. After the water passes though the wellhead, the fluid temperatures in the drainage line increase gradually since the temperatures of sea water increase with the water depth decrease. Moreover, an interesting observation is found that the environment temperatures have larger influences on the water temperature in the drainage line at low water production rate condition. For instance, at the water production rates of 50 m3/d, the water temperatures in the drainage line increase from 4.38 to 16.78°C as the water flows from the wellhead to the platform. The reason is speculated that, when the water flows under the lower rates, the environment and the drainage line will have an adequate heat transfer process between each other. The environment temperatures including the sea water temperature and the geothermal temperature have strong impacts on the water in the drainage line. Thus, at the low water flow rate condition, the temperatures of water at the platform will be close to the environment condition which is 16.78°C.
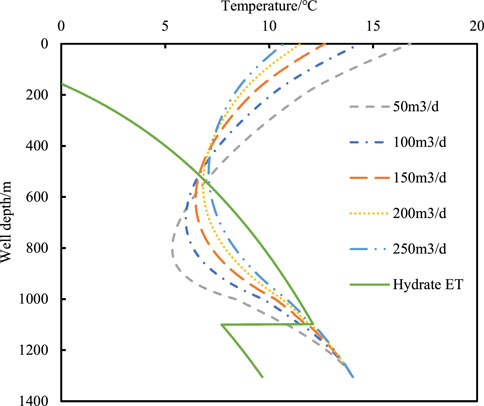
FIGURE 3. Hydrate formation region in the drainage line under varied water production rates.
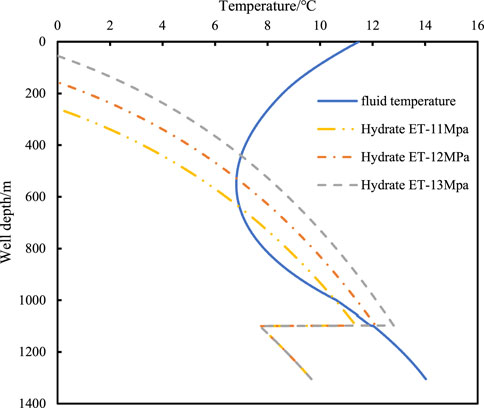
FIGURE 4. Hydrate formation region in the drainage line under varied pump pressures.
Moreover, starting from the bottom hole, the methane hydrate equilibrium curve decreases gradually. After sudden increasing at the well depth of 1108 m, the hydrate equilibrium curve starts to decrease gradually. The main reason inducing the hydrate equilibrium curve decreasing is that the wellbore pressure decreases gradually from the bottom hole to the platform. Since the ESP is installed at the well depth of 1108 m which can supply an extra pressure in the wellbore, the sudden increase of wellbore pressure leads to the sudden increase of the hydrate equilibrium curve. Although the installation of the ESP can effectively lift the water to the platform and improve the production efficiency of natural gas hydrates, the ESP also increases the pressure of the drainage line which increases the risk of hydrate formation.
Figure 4 exhibits the influences of the ESP pressures on the hydrate formation region. The dashed line is the methane hydrate equilibrium curves under the ESP pressures of 11, 12, and 13 MPa. The solid blue line is the fluid temperature in the drainage line. As shown in Figure 4, the increases of the ESP pressures will enlarge the hydrate formation region in the drainage line. Under the ESP pressure of 11 MPa, the hydrate formation region is located in the well depth from 1104 to 646 m which the total length is 458 m. Under the ESP pressure of 13 MPa, the total length of hydrate formation region is 652 m which is from 1098 to 446 m. The hydrate formation region is increased about 194 m. Since the increases of the ESP pressure can increase the flow pressure of water in the drainage line, the high flow pressures favor hydrate formation in the drainage line.
Figure 5 shows that the influence of ESP pressure on the water flow pressure in the drainage line. The water flowing pressure are same in the section of wellbore from the bottom hole to the location that ESP is installed. After the water flows passing though the ESP pump, the pressure in the drainage line is suddenly increased. Since the ESP pump provides the extra energy to the water inside the drainage line and enables the water flow faster which increases the efficiency of liquid uploading, the water flowing pressures increase due to the extra energy correspondingly. Based on Figure 4, although the increase of ESP pressure can increase water flowing pressure inside the drainage line and enhance the efficiency of liquid uploading, the hydrate formation region and the risk of hydrate in the drainage line also enlarges at the same time.
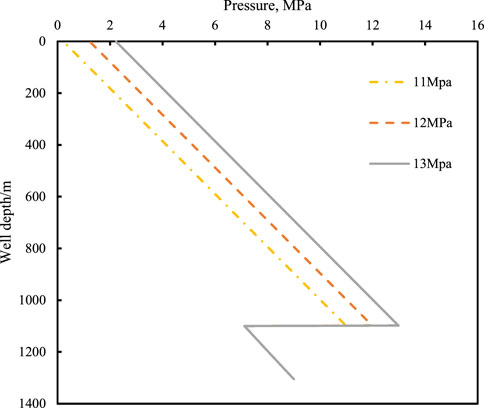
FIGURE 5. The drainage line pressure distributions along the drainage line.
Figure 6 shows the pressures at the platform along the hydrate concentration increasing under the varied ESP pressure conditions. As shown in Figure 6, the increasing pump pressures increases the outflow pressure of water in the drainage line at the platform. It demonstrates that the increase pump pressures can increase the efficiency of liquid uploading and the natural gas hydrate production. Focusing on the case of pump pressure at 11 MPa, when the hydrate concentrations increase beyond 8% inside the drainage line, the outflow pressures become negative. The increases of hydrate concentrations increase the apparent viscosity of the mixed fluid and the wall resistances between fluid and pipe wall also increase correspondingly. Thus, the pressure drops of the fluid flowing in the drainage line increase and the flow velocities of the mixed fluid decrease at the same time. The native outflow pressures mean that the ESP cannot upload the water to the platform. The production problem induced by the hydrate formation is risen up and the hydrate management measures should be taken to deal with the problem. In the analysis of Figure 4, it is mentioned that the increase of ESP pressure will increase the hydrate formation area and thus increase the risk of hydrate formation in the drainage pipeline. However, the increase of hydrate formation area does not necessarily mean that the risk of flow barrier formation will increase. Outflow pressure more directly reflects the risk of flow barrier. Increasing the ESP pressure within a certain range can effectively lift fluid in the line that has increased viscosity due to hydrate formation. Therefore, in the pressure range of 11–13 Mpa discussed in this paper, the higher the ESP pressure, the lower the risk of flow barrier formation in the drainage line.
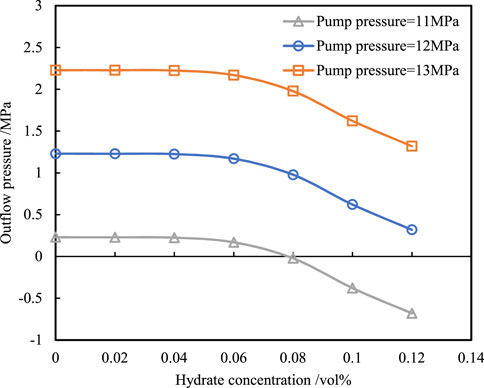
FIGURE 6. The outflow pressures at the platform along hydrate concentrations under varied pump pressure conditions.
Figure 7 presents that the influences of water production rates and hydrate concentrations on the outflow pressure of the drainage line at the platform. As seen in Figure 7, the increases of water production rates result in outflow pressure decreasing at the platform. The reason is that the higher water production rates have higher flow velocities of water in the drainage line and higher friction losses between water flow and pipeline. Considering the pressure losses induced by the wall resistance contain the 99% of the total pressure losses in bubbly flow, the higher friction losses stand for the higher pressure drops and lower outflow pressure at the platform. Moreover, when the hydrate concentration is beyond 6%, the outflow pressures are decreasing dramatically for all water production rate conditions. When the hydrate concentration in pipeline is low, the non-Newtonian fluid properties of hydrate grout are not obvious, and the fluid properties of hydrate grout mainly depend on the properties of continuous phase fluid, which can be considered as Newtonian fluid. The shear stress has a linear relationship with flow velocity, the rheological index is 1, and the viscosity can approximate to that of the continuous phase fluid in the tube (Sun et al., 2020). When the hydrate concentration exceeds 6%, the hydrate grout begins to show the characteristics of non-Newtonian fluid, the viscosity increases suddenly, the pressure drop increases, and the outlet pressure of drainage pipeline decreases. It speculates that the risks of hydrates becomes serious where the hydrate formation, deposition, and agglomerate happened in the drainage line. The hydrate management measures are suggested to be used in the drainage line when the hydrate concentration is found beyond 6%. The measures include hydrate inhibitor injection, heating, lower water production rate, etc.
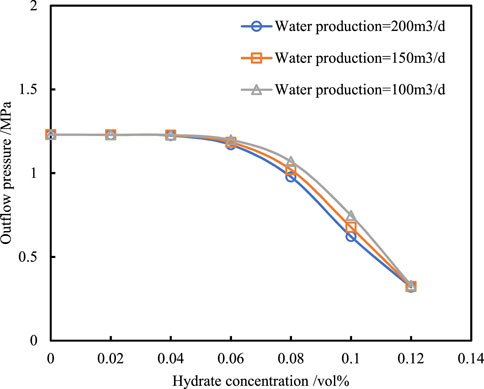
FIGURE 7. The outflow pressures along hydrate concentrations under varied water production rates.
Conclusion
In this work, a model is developed to forecast the hydrate formation region and the risk of hydrate in the drainage line for the offshore natural gas hydrate pilot production. The model calculates the temperature-pressure field in the drainage line and the methane hydrate phase equilibrium curve by incorporating the influence of hydrate on the rheology of mixed fluid. An algorithm is developed correspondingly by the visual basic language. The model shows that the hydrate formation region is enlarged as the ESP pressure increases and the water production rate decreases. The ESP pressures increasing can increase the water flowing pressure in the drainage line which favors hydrate formation. The water production rates decreasing can enable better heat transfer between the drainage line and environment. The fluid temperature in the drainage line will decrease faster as the environmental temperature decreasing at the lower water production rate condition. Moreover, when the hydrate concentration is beyond 6%, the outflow pressure at the platform will drop sharply, the risk of hydrate formation appears, and the hydrate management measure is necessary. In the future, the model should be studied further by considering the hydrate deposition and agglomerate in the drainage line and the influence of hydrate inhibitors on the hydrate formation in the drainage line should be revealed as well.
Data Availability Statement
The original contributions presented in the study are included in the article/Supplementary Material, further inquiries can be directed to the corresponding author.
Author Contributions
YG: Conceptualization, Methodology, Supervision, Writing-Original Draft, Writing—Review and Editing JH: Data Curation, Resources, Investigation, Formal analysis, Writing-Review and Editing KQ: Investigation, Methodology, Formal analysis, Writing—Review and Editing.
Conflict of Interest
Authors YG and JH are employed by the company China National Offshore Oil Corporation CNOOC.
The remaining author declares that the research was conducted in the absence of any commercial or financial relationships that could be construed as a potential conflict of interest.
Publisher’s Note
All claims expressed in this article are solely those of the authors and do not necessarily represent those of their affiliated organizations, or those of the publisher, the editors, and the reviewers. Any product that may be evaluated in this article, or claim that may be made by its manufacturer, is not guaranteed or endorsed by the publisher.
Supplementary Material
The Supplementary Material for this article can be found online at: https://www.frontiersin.org/articles/10.3389/feart.2021.816873/full#supplementary-material
References
Chen, Y., Gong, J., Shi, B., Yao, H., Liu, Y., Fu, S., et al. (2019). Investigation in Methane Hydrate Reformation in Water-Dominated Bubbly Flow. Fuel 263, 116691. doi:10.1016/j.fuel.2019.116691
Clain, P., Delahaye, A., Fournaison, L., Mayoufi, N., Dalmazzone, D., and Fürst, W. (2012). Rheological Properties of Tetra-N-Butylphosphonium Bromide Hydrate Slurry Flow. Chem. Eng. J. 193-194, 112–122. doi:10.1016/j.cej.2012.04.027
Di Lorenzo, M., Aman, Z. M., Kozielski, K., Norris, B. W. E., Johns, M. L., and May, E. F. (2014a). Underinhibited Hydrate Formation and Transport Investigated Using a Single-Pass Gas-Dominant Flowloop. Energy Fuels 28, 7274–7284. doi:10.1021/ef501609m
Di Lorenzo, M., Aman, Z. M., Sanchez Soto, G., Johns, M., Kozielski, K. A., and May, E. F. (2014b). Hydrate Formation in Gas-Dominant Systems Using a Single-Pass Flowloop. Energy Fuels 28, 3043–3052. doi:10.1021/ef500361r
Doron, P., and Barnea, D. (1996). Flow Pattern Maps for Solid-Liquid Flow in Pipes. Int. J. Multiphase Flow 22 (2), 273–283. doi:10.1016/0301-9322(95)00071-2
Doron, P., Simkhis, M., and Barnea, D. (1997). Flow of Solid-Liquid Mixtures in Inclined Pipes. Int. J. Multiphase Flow 23 (2), 313–323. doi:10.1016/s0301-9322(97)80946-9
Eskin, D., and Scarlett, B. (2005). Model of the Solids Deposition in Hydrotransport: An Energy Approach. Ind. Eng. Chem. Res. 44 (5), 1284–1290. doi:10.1021/ie049453t
Fu, W., Wang, Z., Sun, B., and Chen, L. (2018). A Mass Transfer Model for Hydrate Formation in Bubbly Flow Considering Bubble-Bubble Interactions and Bubble-Hydrate Particle Interactions. Int. J. Heat Mass Transfer 127, 611–621. doi:10.1016/j.ijheatmasstransfer.2018.06.015
Fu, W., Wang, Z., Duan, W., Zhang, Z., Zhang, J., and Sun, B. (2019a). Characterizing Methane Hydrate Formation in the Non-Newtonian Fluid Flowing System. Fuel 253, 474–487. doi:10.1016/j.fuel.2019.05.052
Fu, W., Wang, Z., Sun, B., Ji, C., and Zhang, J. (2019b). Multiple Controlling Factors for Methane Hydrate Formation in Water-Continuous System. Int. J. Heat Mass Transfer 131, 757–771. doi:10.1016/j.ijheatmasstransfer.2018.10.025
Fu, W., Wang, Z., Yue, X., Zhang, J., and Sun, B. (2019c). Experimental Study of Methane Hydrate Formation in Water-Continuous Flow Loop. Energy Fuels 33, 2176–2185. doi:10.1021/acs.energyfuels.9b00132
Fu, W., Wang, Z., Zhang, J., Cao, Y., and Sun, B. (2020a). Investigation of Rheological Properties of Methane Hydrate Slurry with Carboxmethylcellulose. J. Pet. Sci. Eng. 184, 106504. doi:10.1016/j.petrol.2019.106504
Fu, W., Wang, Z., Zhang, J., and Sun, B. (2020b). Methane Hydrate Formation in a Water-Continuous Vertical Flow Loop with Xanthan Gum. Fuel 265, 116963. doi:10.1016/j.fuel.2019.116963
Fu, W., Wang, Z., Chen, L., and Sun, B. (2020c). Experimental Investigation of Methane Hydrate Formation in the Carboxmethylcellulose (CMC) Aqueous Solution. SPE J. 25, 1042–1056. doi:10.2118/199367-PA
Fu, W., Wang, Z., Sun, B., Xu, J., Chen, L., and Wang, X. (2020d). Rheological Properties of Methane Hydrate Slurry in the Presence of Xanthan Gum. SPE J. 25, 2341–2352. doi:10.2118/199903-PA
Hasan, A. R., and Kabir, C. S. (2012). Wellbore Heat-Transfer Modeling and Applications. J. Pet. Sci. Eng. 86-87, 127–136. doi:10.1016/j.petrol.2012.03.021
Hegde, G. A., Sum, A. K., and Danielson, T. J. (2015). Multiphase Flow Modeling for Gas Hydrates in Flow Assurance. Paper presented at the Offshore Technology Conference, Houston, TX, May 2015.
Kokpmar, M. A., and Gogus, M. (2001). Critical Flow Velocity in Slurry Transporting Horizontal Pipelines. J. Hydraul. Eng. 127 (9), 763–771. doi:10.1061/(ASCE)0733-9429(2001)127:9(763)
Li, L., Xu, H.-l., and Yang, F.-q. (2015). Three-phase Flow of Submarine Gas Hydrate Pipe Transport. J. Cent. South. Univ. 22, 3650–3656. doi:10.1007/s11771-015-2906-y
Liu, Z., Sun, B., Wang, Z., Lou, W., and Zhang, J. (2021). Modeling of Multiphase Flow in marine Gas Hydrate Production System and its Application to Control the Production Pressure Difference. J. Nat. Gas Sci. Eng. 85, 103687. doi:10.1016/j.jngse.2020.103687
Lv, X., Shi, B., Wang, Y., and Gong, J. (2013). Study on Gas Hydrate Formation and Hydrate Slurry Flow in A Multiphase Transportation System. Energy Fuels 27, 7294–7302. doi:10.1021/ef401648r
Peng, B.-Z., Chen, J., Sun, C.-Y., Dandekar, A., Guo, S.-H., Liu, B., et al. (2012). Flow Characteristics and Morphology of Hydrate Slurry Formed from (Natural Gas+diesel Oil/condensate Oil+water) System Containing Anti-agglomerant. Chem. Eng. Sci. 84, 333–344. doi:10.1016/j.ces.2012.08.030
Shi, B., Ding, L., Liu, Y., Yang, J., Song, S., Wu, H., et al. (2018). Hydrate Slurry Flow Property in W/O Emulsion Systems. RSC Adv. 8, 11436–11445. doi:10.1039/c7ra13495a
Sun, B., Wang, Z., Gong, P., and Song, R. (2011). Application of a Seven-Component Multiphase Flow Model to Deepwater Well Control. Acta Petrol. Sin. 32 (06), 1042–1049. doi:10.7623/syxb201106018
Sun, B., Fu, W., Wang, Z., Xu, J., Chen, L., Wang, J., et al. (2020). Characterizing the Rheology of Methane Hydrate Slurry in a Horizontal Water-Continuous System. SPE J. 25, 1026–1041. doi:10.2118/195586-PA
Wang, W., Fan, S., Liang, D., and Li, Y. (2010). A Model for Estimating Flow Assurance of Hydrate Slurry in Pipelines. J. Nat. Gas Chem. 19, 380–384. doi:10.1016/s1003-9953(09)60094-3
Wang, Z. Y., Zhao, Y., Sun, B. J., Chen, L. T., Zhang, J. B., and Wang, X. Y. (2016). Modeling of Hydrate Blockage in Gas-Dominated Systems. Energy Fuels 30 (6), 4653–4666. doi:10.1021/acs.energyfuels.6b00521
Wang, Z., Zhang, J., Sun, B., Chen, L., Zhao, Y., and Fu, W. (2017). A New Hydrate Deposition Prediction Model for Gas-Dominated Systems with Free Water. Chem. Eng. Sci. 163, 145–154. doi:10.1016/j.ces.2017.01.030
Xu, H., Luo, X., Peng, D., and Chen, A. (2017). First Successful Trail Collection of Natural Gas Hydrate in China. Geol. China 44 (3), 620–621. doi:10.12029/gc20170323
Yan, K.-L., Sun, C.-Y., Chen, J., Chen, L.-T., Shen, D.-J., Liu, B., et al. (2014). Flow Characteristics and Rheological Properties of Natural Gas Hydrate Slurry in the Presence of Anti-agglomerant in a Flow Loop Apparatus. Chem. Eng. Sci. 106, 99–108. doi:10.1016/j.ces.2013.11.015
Ye, J., Qin, X., Xie, W., Lu, H., Ma, B., Qiu, H., et al. (2020). Main Progress of the Second Gas Hydrate Trial Production in the South China Sea. Geol. China 47 (3), 557–568. doi:10.12029/gc20200301
Zerpa, L. E., Rao, I., Aman, Z. M., Danielson, T. J., Koh, C. A., Sloan, E. D., et al. (2013). Multiphase Flow Modeling of Gas Hydrates with a Simple Hydrodynamic Slug Flow Model. Chem. Eng. Sci. 99, 298–304. doi:10.1016/j.ces.2013.06.016
Zhang, B., Wu, Q., Gao, X., Liu, C., and Ye, Y. (2013). Memory Effect on Hydrate Formation and Influential Factors of its Sustainability in New Hydrate-Based Coal Mine Methane Separation Method. Int. J. Environ. Pollut. 53 (3/4), 201–212. doi:10.1504/ijep.2013.059913
Keywords: methane hydrate, drainage line, hydrate formation, bubbly flow, risk
Citation: Guimin Y, Hao J and Qingwen K (2022) Study on Hydrate Risk in the Water Drainage Pipeline for Offshore Natural Gas Hydrate Pilot Production. Front. Earth Sci. 9:816873. doi: 10.3389/feart.2021.816873
Received: 17 November 2021; Accepted: 06 December 2021;
Published: 01 February 2022.
Edited by:
Weiqi Fu, China University of Mining and Technology, ChinaReviewed by:
Yang Zhao, Missouri University of Science and Technology, United StatesJianjun Zhu, China University of Petroleum, Beijing, China
Copyright © 2022 Guimin, Hao and Qingwen. This is an open-access article distributed under the terms of the Creative Commons Attribution License (CC BY). The use, distribution or reproduction in other forums is permitted, provided the original author(s) and the copyright owner(s) are credited and that the original publication in this journal is cited, in accordance with accepted academic practice. No use, distribution or reproduction is permitted which does not comply with these terms.
*Correspondence: Yu Guimin, eXVnbUBjbm9vYy5jb20uY24=