 Wei Zheng1,2
 Yabin Feng
- 1State Key Laboratory of Offshore Oil Exploitation, Beijing, China
- 2CNOOC Research Institute Co., Ltd., Beijing, China
- 3State Key Laboratory of Petroleum Resources and Prospecting, China University of Petroleum, Beijing, China
N2 injection process is a potential technique to control the water coning behavior in heavy oil reservoirs. In this paper, by using the methods of experiment and numerical simulation, the N2 injection process for controlling the edge water coning behavior is investigated. First, through a visual fluid flow experimental device, the flow behavior of N2-water in porous media is discussed. Also, the effects of temperature, pressure, and injection rate were studied. Then, based on the experimental results, aiming at an actual edge water heavy oil reservoir, a reservoir simulation model is developed. Thus, the water coning behavior of edge aquifer is systematically studied. Also, two novel indicators are proposed to evaluate the water coning behavior. Then, a series of numerical models are developed to investigate the performance of N2 injection process in edge water heavy oil reservoirs after water coning, and the adaptability and the optimal operation parameters are analyzed. Results indicate that under the effect of porous media, N2 can cut into a series of small gas bubbles. It is a typical dispersed phase and can effectively plug the water coning path. Compared with pressure and injection rate, temperature is a more sensitive factor to affect the plugging performance of N2. From the simulation results, it is observed that the permeability, water/oil ratio, and distance between well and aquifer can significantly affect the performance of water coning behavior. N2 injection process can effectively control the edge water coning and improve the CSS performance. Furthermore, from the simulation results, it is found that the optimal operation parameters for a N2 injection process is that the total N2 injection volume should be higher than 6,000 m3 within one operation cycle and the optimal N2 injection rate should be lower than 700 m3/day. This investigation further clarifies the mechanisms of N2 injection process to control the water coning behavior in heavy oil reservoirs. It can provide a useful reference for the EOR process of the heavy oil reservoirs with edge water.
1 Introduction
Heavy oil reservoir is an important type of petroleum resources (Meyer et al., 2007; Liu et al., 2019). It refers to the petroleum reservoir whose oil viscosity is higher than about 50 mPa·s at reservoir condition. The world proven heavy oil resources is about 9,911.8 × 108 t, and the recoverable heavy oil resources is about 1,267.4 × 108 t. The heavy oil resources in the regions of America and Middle East can account for about 72% in the world (Liu et al., 2019). Because of the high viscosity of heavy oil, how to effectively reduce the oil viscosity is usually the top concern for all the heavy oil corporations. Different with the recovery method of light oil reservoirs (e.g., natural depletion, water flooding, polymer flooding, etc.), thermal recovery process is always the first option of heavy oil reservoirs. Currently, steam-based recovery process is the main development method of heavy oil reservoirs, including CSS (cyclic steam stimulation), steam flooding, and SAGD (steam-assisted gravity drainage) (Farouq Ali, 2007; Speight James, 2013; Dong et al., 2019). However, considering the diversity of the type of heavy oil reservoirs, the three classic thermal recovery processes usually have the optimal screening criterion. It indicates that for some special or complicated heavy oil reservoirs, the conventional steam injection process is usually not effective (Dong et al., 2019).
Among the so many heavy oil reservoirs, the heavy oil reservoir with an edge water zone is a typical heavy oil reservoir (Liu, 2013; Liu et al., 2013; Delamaide and Moreno, 2015). Because of the effect of aquifer energy, once the conventional steam injection process, CSS, is performed, a serious problem of water coning can be observed, especially in the initial stage of recovery process. Then, as the recovery process continues, the water coning behavior is aggravated, and thus the normal development process is affected (Liu et al., 2013; Pang et al., 2020). Specifically, the following three characteristics can be observed. First, CSS process is a pressure-declining recovery process. For an actual heavy oil reservoir, with the CSS cycle increasing, the reservoir pressure is gradually reduced. Thus, the coning behavior of edge water can be observed (Pang et al., 2020; Dong et al., 2021). On the other hand, because of the injection of high-temperature steam, the oil viscosity is reduced and oil mobility is improved. It can benefit the declining process of formation pressure, and thus the coning process of edge water is induced. Third, as the CSS process continues, the coning behavior of edge water will change the distribution of reservoir temperature. Under the effect of edge water, the reservoir section around the edge water can have a lower temperature and a higher water saturation. It indicates that a water coning path will be developed (Liu, 2013; Dong et al., 2019). After the formation of a water coning path, an obvious water coning behavior can be observed in the thermal wells.
To effectively control the water coning behavior and improve the heavy oil recovery process, many different methods of preventing water coning are proposed. Specifically, they include the methods of adjusting operation parameters, N2 injection process and NCG (non-condensable gas) foam injection process (Lai and Wardlaw, 1999; Wang et al., 2018; Dong et al., 2021). First, for the process of adjusting operation parameters, e.g., reducing steam injection rate, increasing flow wellbore pressure, and reducing liquid production rate, it is usually valid in the early stage of water coning. Compared with the other two methods, this process is the most economic one. However, once a serious water coning behavior is observed, it will be no longer effective. Second, for NCG foam injection process, it is more effective than the process of adjusting operation parameters (Lu et al., 2013; Pang et al., 2018; Liu et al., 2020; Wang et al., 2020; Dong et al., 2021). By using the high resistance capability of NCG foam, the water coning path can be effectively plugged, and correspondingly the recovery performance can be improved. However, because of the high cost of chemical agent, the operation cost of this process can usually hinder the expansion of this process. Comparatively, N2 injection process is the most attractive one among the three commonly used processes. Compared with the process of adjusting operation parameters, this process is more effective. Compared with the process of NCG foam system, it is more economic. The detailed mechanisms to control the water coning behavior are as follows (Pang et al., 2008; Pang et al., 2015; Wang et al., 2018; Chen et al., 2021; Kirmani et al., 2021): 1) N2 has a low solubility in heavy oil and water. Once N2 is injected into heavy oil reservoir, the dispersed nitrogen gas bubbles can plug the water thief zone and improve the recovery process. 2) On account of the effect of small gas bubbles, N2 can effectively reduce the relative permeability of water phase. 3) Under the effect of gravitational differentiation, N2 will rise up and develop a secondary gas cap. It will benefit the recovery process in upper pay zone. 4) N2 has a higher expansibility. Therefore, after the injection of N2, the reservoir pressure can be recovered. This high-pressure reservoir zone can prevent the early breakthrough of aquifer. Although some investigations about the performance of N2 injection in heavy oil reservoirs have been performed, most of them are based on the simulation process. There is still lack of a systematical study for the dynamic characteristics of N2 injection process to control the water coning behavior in heavy oil reservoirs.
In this paper, combining the methods of visualized micro-model and numerical simulation, the anti-water coning process by N2 injection process will be discussed. First, in section 2, by using a visualized micro-model, the N2–water two-phase flow behavior at different conditions is investigated. Specifically, the effects of pressure, temperature, and injection rate on the two-phase flow behavior are all discussed. Thus, the reasonability and mechanism of N2 injection for controlling water coning can be addressed. Then, in section 3, through the method of numerical simulation, the water coning behavior in an actual edge water heavy oil reservoir will be discussed. Thereafter, the adaptability of N2 injection process is studied, and the operation parameters are also optimized. The concluding remarks will be given in section 4.
2 Experiment
2.1 Experimental Setup and Procedure
(1) Experimental Setup
Figure 1 shows a schematic of the visualized experiments. As shown, it is consisted by the injection system, sand pack model, constant temperature oven, camera recording system, back pressure regulator, and liquid acquisition system. In this visualized experiment, a sand pack model is used to simulate the porous medium environment. By injecting the multicomponent fluids (i.e., N2, formation water, and heavy oil) into the sand pack model, the actual multiple phase fluid flow process in a heavy oil reservoir can be simulated. Then, through a connected micromodel, the multiple phases fluid flow behavior in porous medium can be visually observed.
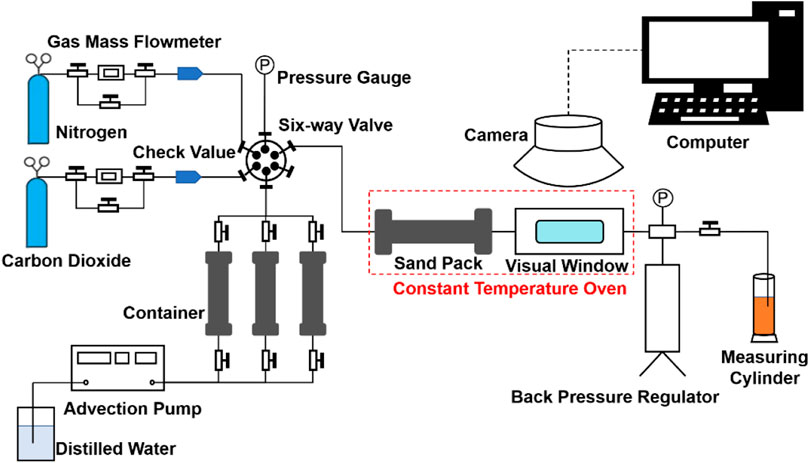
FIGURE 1. A schematic of the visualized micromodel for the multiphase fluid flow behavior.
Using the aforementioned experimental device, eight groups of visualized experiments for the flow behavior of N2 and water were carried out, as shown in Table 1. By observing the phenomenon of nitrogen separation into bubbles and gas–liquid flow in water, the effect of temperature and pressure conditions on the anti-water behavior by N2 can be discussed. Cases no. 1–7 can be applied to study the characteristics of N2 separation into bubbles and the law of gas–liquid flow under different temperature and pressure conditions. Cases no. 7 and 8 can be used to compare and analyze the effects of different injection rates on the separation of nitrogen into bubbles and gas–liquid flow.
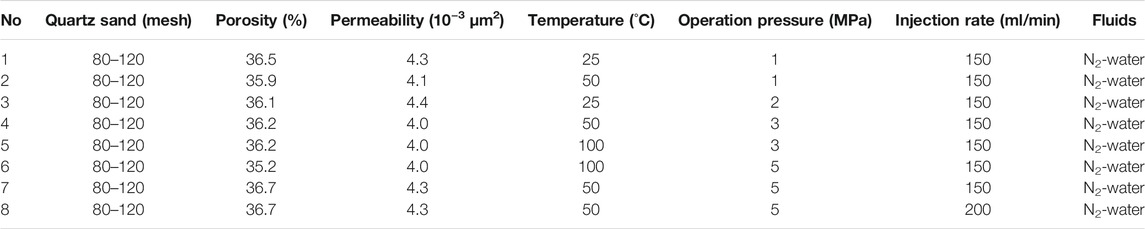
TABLE 1. Experimental design for the flow behavior of N2 and water in porous media
(2) Experimental Procedures
1) Fill the model pipe. Wash the required quart sand, and dry it in the constant temperature oven. Then, fill it into the sand pack. The sand is fully compacted to avoid the migration of quartz sand during the experiment, blocking the pipeline and causing the experiment to fail;
2) Gas tightness test. Connect an intermediate container with nitrogen gas and a pressure gauge at one end of the sand pack. Inject nitrogen gas into the sand pack until the pressure reaches 12 MPa, then close the valve and stabilize the pressure for 30 min and control the pressure drop within 0.2 MPa;
3) Measure the porosity and permeability. Use saturated water to measure porosity and permeability;
4) Connect the equipment and instruments. Put the sand pack in the constant temperature oven, so that the sand pack is at a constant experimental temperature during the whole experiment, and the high-temperature and high-pressure visual window is placed on top of the constant temperature oven;
5) Experiment. According to the experimental scheme, set the model temperature, pressure, and injected gas composition, and inject N2 into the sand pack to simulate the N2 seepage in porous medium under different conditions;
6) Data collection. Observe the high-temperature and high-pressure visual window and the computer terminal acquisition software. After the fluid flows in the visual window, start to record the fluid flow state under different experimental conditions, and collect high-definition images every 3 min until gas channeling appears in the visual window;
7) Cleaning device. After the experiment, close each gas cylinder, and pour kerosene into the high-temperature and high-pressure visual window to clean the glass, and then inject active water. When there is no obvious stain on the glass, dry the visual window for subsequent experiments.
2.2 Experimental Results
From the experimental results of cases no. 1–3, it can be observed that under a low-pressure condition, N2 is injected into the continuous phase water as a dispersed phase, which is an approximate gas drive water process, as shown in Figure 2. In the process of simulating actual N2 water suppression, the injected N2 is separated into bubbles of different shapes and sizes, occupying the water space and inhibiting the flow of water. N2 bubbles have a certain blocking effect when they do not form a gas channel. On the one hand, from Figure 2A, when the injection rate is constant, the nitrogen gas will coalesce during the migration process in the water, and small bubbles will merge into large bubbles. On the other hand, from Figure 2B, at the same nitrogen injection rate, with the continuous injection of nitrogen, the number of nitrogen bubbles in water is increasing. During migration, small bubbles coalesce and gradually merge into large bubbles. Therefore, the quantity of N2 bubbles is increasing and the volume of nitrogen bubbles becomes larger.
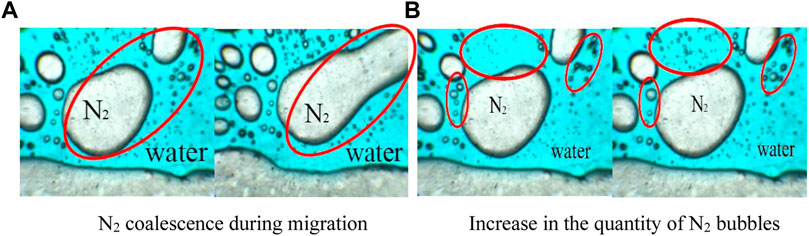
FIGURE 2. N2 bubble volume and quantity variation diagram. (A) N2 coalescence during migration (B) Increase in the quantity of N2 bubbles.
Temperature and pressure are the main factors affecting the performance of nitrogen bubbles in water. As the temperature increases, the thermal expansion of gas leads to the increase of the proportion of large bubbles. And with the pressure increasing, the gas is compressed and the size of N2 bubbles in water becomes smaller. The experimental results are shown in Figure 3. Through the comparison between the first group of experiments and the second group of experiments, it is found that the bubbles in the left picture is smaller than that in the right picture from Figure 3A. The temperature of the right picture is higher than that in the left picture. When the large bubbles increase to a certain extent, the large bubbles are easy to burst. Therefore, the front stability of large bubbles becomes poor due to the increase of its shape. On the contrary, when large bubbles coalesce in water and form gas channeling, the resistance effect of separation into bubbles will become worse. Through the comparison between the second group of experiments and the third group of experiments, it is found that when the temperature is the same, the solubility of N2 in water becomes larger with the increase of pressure, and the quantity of small N2 bubbles in water also increases. As shown in Figure 3B, the picture on the left has lower pressure than the picture on the right.
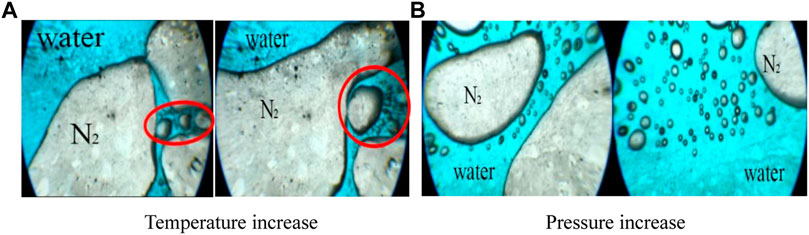
FIGURE 3. N2 bubble diagram at different temperatures and pressures. (A) Temperature increase. (B) Pressure increase.
By comparing the fourth group of experiments and the fifth group of experiments, the number of N2 bubbles in water increases as a result of the nitrogen injection volume increase at the same time. With the continuous migration of nitrogen bubbles in water, N2 bubbles continue to coalesce and form large bubbles, resulting in an increase in the proportion of large bubbles. Due to the increase of injection rate, the migration speed of N2 in water is accelerated and the proportion of large bubbles increases, resulting in poor stability of large bubbles and poor resistance effect of separation into small bubbles. Also, large bubbles are easy to gather and form a steam channel. Therefore, the blocking effect of large bubbles is lower than that of small bubbles. In the process of nitrogen water suppression, the injection rate of nitrogen should be reduced. As shown in Figure 4, the large bubbles grow larger and larger from left to right, causing a negative effect.
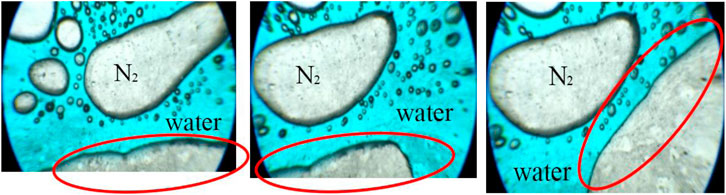
FIGURE 4. N2 bubble diagram at injection rate increasing.
3 Numerical Simulation
3.1 Simulation Model Development
From the aforementioned experimental results, it can be observed that the method of N2 injection process can significantly prevent the water coning and improve the recovery performance. Nitrogen mainly plays the purpose of water suppression for edge water heavy oil reservoirs. Therefore, by using the average reservoir and fluid properties of a typical edge water heavy oil reservoir, the numerical simulation method is applied to discuss the water coning behavior of edge water and the adaptability of N2 injection operation. On the other hand, the operation parameters are also optimized. The basic properties are shown in Table 2. The numerical simulation model has 50 grids in direction I. Each grid step length is 5 m, and the length in direction I is 250 m. In direction J, there are 21 grids. Each grid step length is 5 m, and the length in direction J is 105 m. Figure 5 shows the oil–water and gas–liquid relative permeability curves. Figure 6 provides a schematic of the simulation model.
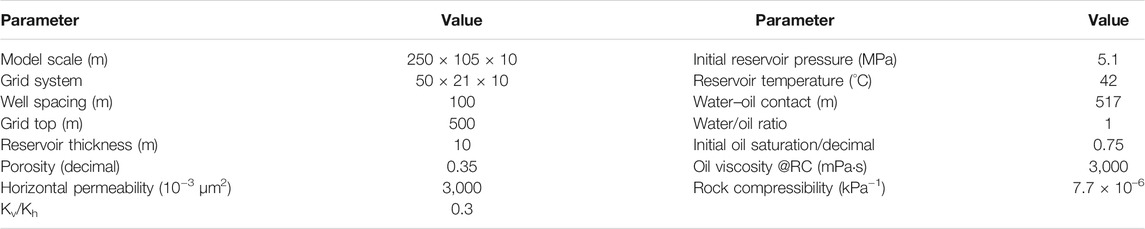
TABLE 2. The basic reservoir and fluid properties
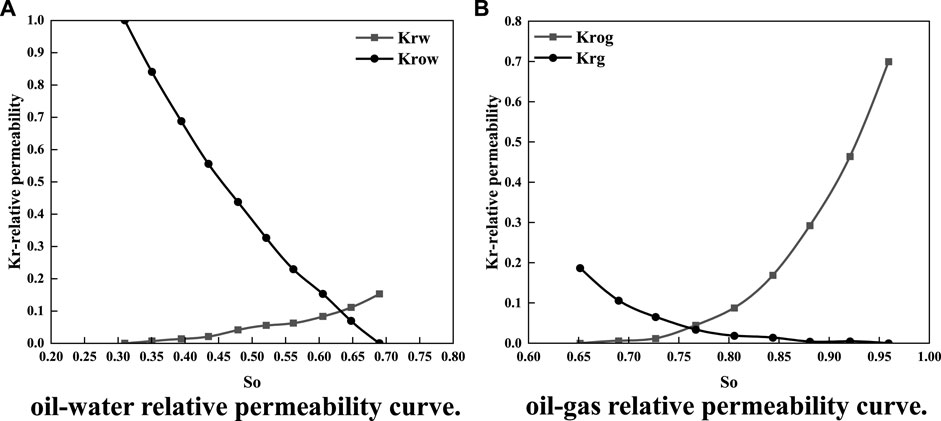
FIGURE 5. Relative permeability curves. (A) Oil–water relative permeability curve. (B) Oil–gas relative permeability curve.

FIGURE 6. A schematic for the simulation model of edge water heavy oil reservoir.
3.2 Simulation Results and Discussion
3.2.1 Water Coning Behavior
For the heavy oil reservoirs with an aquifer, how to accurately evaluate the water coning behavior is always the top concern. In this paper, two evaluation indicators will be proposed, the ratio of cumulative-water to cumulative-oil (RWO) and the ratio of cumulative-edge-water to cumulative-water (REWW). The slope for the curve of RWO versus time will be used to effectively evaluate the speed of water coning. Also, the slope for the curve of REWW versus time will used to evaluate the strength of water coning and thus to design the suitable injection volume of plugging agent. Therefore, from the two new indicators, the water coning behavior of edge water heavy oil reservoirs after CSS process will be discussed in this section.
(1) Effect of Permeability
Permeability is one of the most important factors to affect the water coning performance. As the permeability increases, the water coning strength will be enhanced, and the water invasion volume will be also increased. Therefore, to study the effect of permeability on the water coning behavior of edge water, based on the basic properties in Table 2, a series of simulation models with different horizontal permeabilities are developed. The other properties were kept unchanged. Also, the RWO and REWW will be used as the evaluation indicators. The simulation results are shown in Figure 7. From Figure 7A, it can be observed that as the permeability increases, the time of water coning is advanced. As shown, the water coning time for the case of 2,500 md is advanced by about 7 days than that of 1,500 md. Simultaneously, with the permeability increasing, the slope of RWO versus time is also increased. It indicates that a higher water coning speed can be observed for the heavy oil reservoir with a higher permeability. On the other hand, from Figure 7B, it can be found that with the permeability increasing, the edge water invasion volume will increase. Especially, for the simulation model of 1,000 md, a low REWW can be observed. It indicates that a serious water coning behavior is not observed.
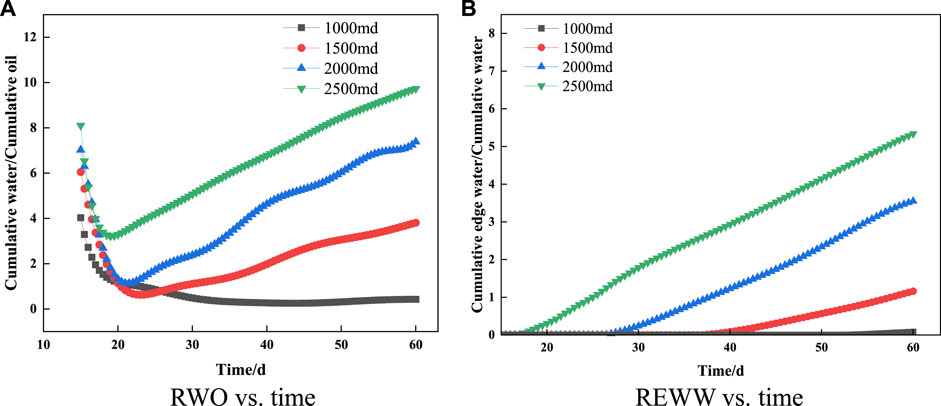
FIGURE 7. Simulation results for the effect of permeability. (A) RWO vs. time. (B) REWW vs. time.
(2) Effect of Water/Oil Ratio
Similarly, on the basis of the basic properties in Table 2, the ratio of edge water zone and pure reservoir zone is changed, and thus the effect of water/oil ratio on the edge water coning behavior can be discussed. The simulation results are shown in Figure 8. As shown, with the water/oil ratio increasing, the time of water coning is advanced. Also, the slopes of RWO versus time and REWW versus time are also increased. However, compared with reservoir permeability, the effect of water/oil ratio on water coning behavior is more significant. On the other hand, from Figure 8, it can be also observed that once the water/oil ratio reaches to a certain value, the changing tendency between water coning speed and water/oil ratio is reduced. When the water/oil ratio is increased from 1 to 5, the changes of curve slope are significant. However, as it is increased from 5 to 20, the changing tendency is less significant. Therefore, for the CSS process in edge water heavy oil reservoirs, it can be recommended that the optimal water/oil ratio should be lower than 5.
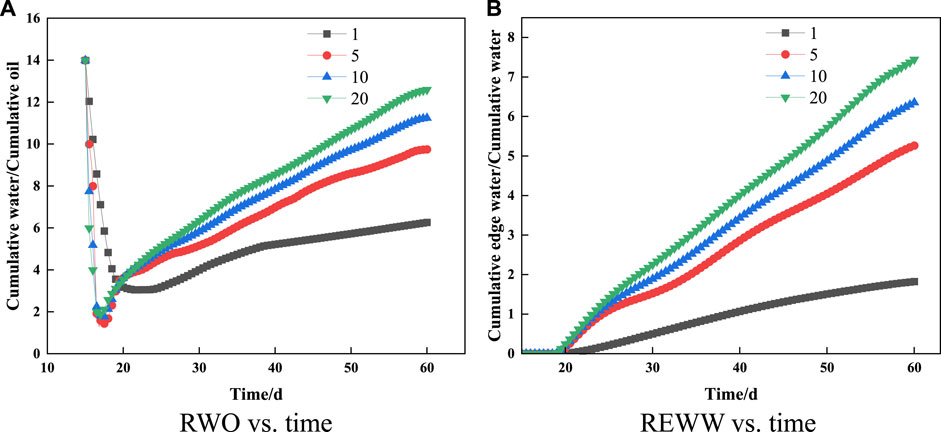
FIGURE 8. Simulation results for the effect of water/oil ratio. (A) RWO vs. time. (B) REWW vs. time.
(3) Effect of the Distance Between Well and Edge Water
In this section, the effect of the distance between well and edge water will be discussed. For the thermal recovery processes in edge water heavy oil reservoirs, it is a very important parameter. With the distance reducing, the edge water can invade the thermal wells early. The simulation results are shown in Figure 9. As shown, as the distance reduces, an obvious water coning phenomenon can be observed. Simultaneously, the slopes of RWO versus time and REWW versus time are also increased. It indicates that the water coning strength and water intrusion volume are increased. From the results in Figure 9, we can find that as the distance is increased to about 50 m, the water coning phenomenon does not occur. It indicates that the safe distance is 50 m.
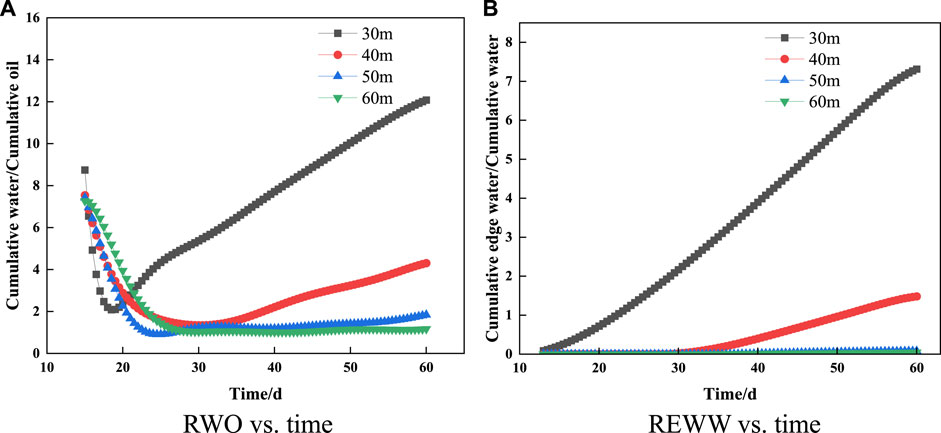
FIGURE 9. Simulation results for the effect of the distance between well and edge water. (A) RWO vs. time. (B) REWW vs. time.
3.2.2 Adaptability Evaluation of N2 Injection Process
Based on the aforementioned discussion, it can be found that the occurrence of water coning will significantly affect the normal development of heavy oil reservoirs, and N2 injection process will be the potential technology to effectively prevent the water coning phenomenon. Therefore, in this section, using the same reservoir simulation model, the adaptability of N2 injection process in edge water heavy oil reservoirs will be numerically discussed, including reservoir thickness, water/oil ratio, and the distance between well and edge water. Using the same numerical simulation model in the previous section, two CSS cycles is first simulated. Then, after the second CSS cycle, considering the serious water coning behavior, the N2 injection process is first performed, and then the steam injection process is activated to simulate the third CSS cycle. The incremental oil production and the three pure CSS cycles process will be used as the evaluation indicators.
(1) Effect of Reservoir Thickness
Using the aforementioned simulation model, we respectively adjust the reservoir thickness as 2, 4, 6, 8, 10, and 12 m, and the other properties remain unchanged. Thus, by comparing the simulation results of different cases, the effect of reservoir thickness on the N2 injection performance can be evaluated. The simulation results are shown in Figure 10. As shown, with the reservoir thickness increasing, the incremental oil production is increased. The thicker the reservoir thickness, the more obvious the preventing performance of water coning. It can be observed that as the reservoir thickness is higher than about 6 m, the increasing tendency is more significant. It indicates that for the N2 injection operation in field, the reservoir thickness should be higher than 6 m.
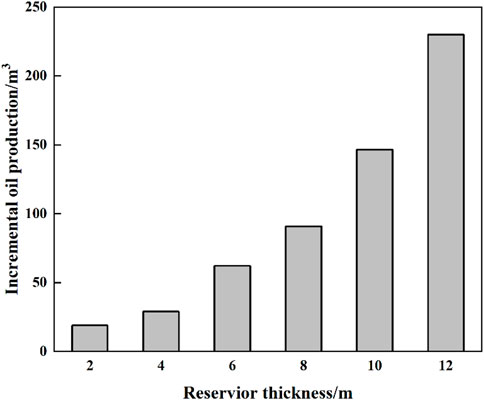
FIGURE 10. Incremental oil production vs. reservoir thickness.
(2) Effect of Water/Oil Ratio
Similarly, the effect of water/oil ratio on the performance of N2 injection process can be also evaluated. As discussed in the previous section, water/oil ratio represents the aquifer energy. As the water/oil ratio increases, the aquifer energy is increased, and the water coning strength will be enhanced. The simulation results of different water/oil ratios are shown in Figure 11. With the water/oil ratio increasing, the incremental oil production is significantly reduced. It indicates that a serious water coning phenomenon can be observed for the heavy oil reservoirs with a higher water/oil ratio. From Figure 11, we can see that as the water/oil ratio is higher than 5, the changing tendency is smoothed. Thus, for the N2 injection operation in field, the water/oil ratio should be less than 5.

FIGURE 11. Incremental oil production vs. water/oil ratio.
(3) Effect of the Distance Between Well and Edge Water
In this section, the effect of the distance between well and edge water is discussed. The simulation results are shown in Figure 12. As shown, with the distance increasing, the incremental oil production is increased, and an “S”-shaped relationship can be observed. Therefore, the appropriate distance between thermal well and edge water should be higher than 80 m, and N2 injection process can have a better anti-water performance.
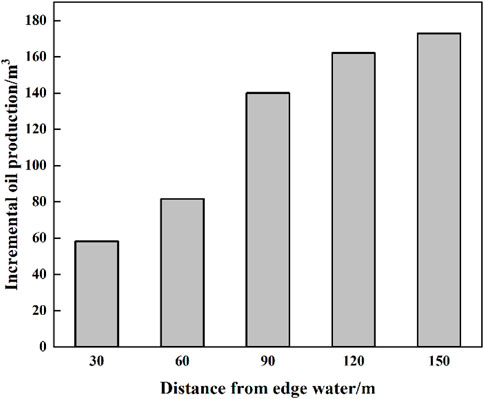
FIGURE 12. Incremental oil production vs. the distance between well and edge water.
3.2.3 Optimization on the Operation Parameters
In this section, the operation parameters of a N2 injection process to prevent edge water coning will be optimized, including total N2 injection volume and daily N2 injection rate. The incremental oil production and then the three pure CSS cycles process and the cumulative edge water production will be used as the evaluation indicators.
(1) Optimization of the Total N2 Injection Volume
Under the conditions of the other operation parameters that were unchanged, we respectively developed a series of simulation models to discuss the effect of N2 injection volume on the performance of anti-water process. The simulation results are shown in Figure 13. As shown, with the N2 injection volume increasing, the incremental oil production increases and the cumulative edge water production decreases. Under the condition of the other operation parameters that were unchanged, the higher the nitrogen injection volume is, the better the inhibition effect on edge water is. From Figure 13, we can see that once the N2 injection volume reaches above 6,000 m3, the changing tendency is smoothed. It indicates that an optimal N2 injection volume has been reached. If the N2 injection volume is higher than the optimal N2 injection volume, the incremental oil production basically remains unchanged. Thus, the optimal N2 injection volume is 6,000 m3.
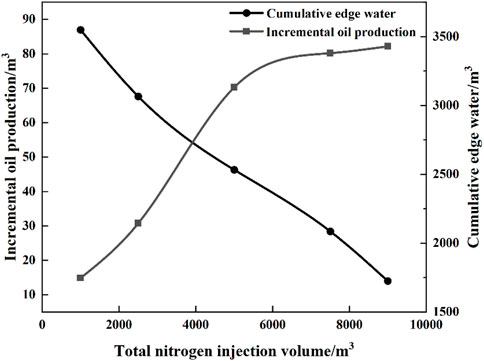
FIGURE 13. Simulation results of different N2 injection volumes.
(2) Optimization of the N2 Injection Rate
Similarly, using the same numerical simulation model, the N2 injection rate can be also optimized. The simulation results are shown in Figure 14. As shown, with the N2 injection rate increasing, the cumulative oil production gradually decreases and the cumulative edge water production gradually increases. It is because that for a higher N2 injection rate, the distribution of nitrogen in formation becomes uneven, so that the nitrogen cannot achieve a good performance to prevent the edge water coning. Therefore, the water intrusion volume is increased. From Figure 14, it can be found that the optimal N2 injection rate should be lower than 700 m3/day.
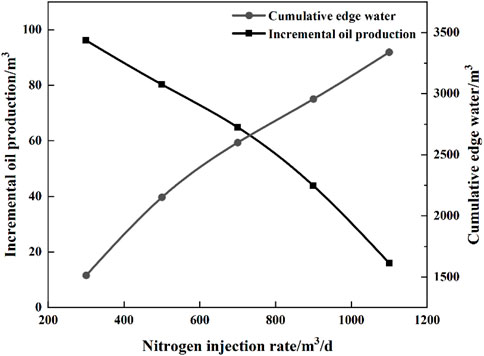
FIGURE 14. Simulation results of different N2 injection rates.
4 Conclusion
In this paper, combining the methods of visualized experiment and numerical simulation, the performance of N2 injection process to control the water coning in edge water heavy oil reservoirs is discussed. The anti-water coning mechanisms of N2 are investigated. Two indicators are proposed to evaluate the water coning behavior of edge water. Simultaneously, the adaptability and optimal operation parameters of N2 injection process are also studied. The main conclusions are drawn as follows:
1) From the visualized fluid flow experiment, it is observed that in the porous media environment, N2 can cut into a series of small gas bubbles. It is a typical dispersed phase and can effectively plug the water coning path. Temperature can have an important influence on the plugging performance of N2 in porous media. With the temperature and N2 injection rate increasing, the N2 gas bubble can merge and form a large size gas bubble. It is not beneficial for the water coning controlling process.
2) The ratio of cumulative-water to cumulative-oil (RWO) and the ratio of cumulative-edge-water to cumulative-water (REWW) are proposed to evaluate the water coning behavior of edge aquifer. From the simulation results, it is found that the permeability and distance between the thermal well and aquifer have an important influence on the water coning process. With the permeability increasing and the distance reducing, a serious water coning can be observed.
3) For the adaptability of N2 injection process, from the numerical simulation results, it is found that a better anti-water coning performance can be observed in the edge water heavy oil reservoirs whose thickness is higher than 6 m, water/oil ratio is less than 5, and distance between the thermal well and edge aquifer is higher than 80 m. For the optimal operation parameters, numerical simulation results show that the optimal N2 injection volume should be higher than 6,000 m3, and the optimal N2 injection rate should be lower than 700 m3/day.
Data Availability Statement
The original contributions presented in the study are included in the article/Supplementary Material; further inquiries can be directed to the corresponding author.
Author Contributions
WZ, YF, XT, and RY contributed to conception and design of the study. WZ and YF wrote the first draft of the article. HL supervised this investigation. HX and TW wrote sections of the article. All authors contributed to article revision, read, and approved the submitted version.
Funding
This work was financially supported by the Science Foundation of China University of Petroleum, Beijing (2462020YXZZ032) and the National Natural Science Foundation of China (U20B6003). The financial support of a project from CNOOC Research Institute Co. (CCL2021RCP0361RSN) is also acknowledged.
Conflict of Interest
Authors WZ, XT, RY, HX, and TW were employed by the company CNOOC Research Institute Co., Ltd.
The remaining authors declare that the research was conducted in the absence of any commercial or financial relationships that could be construed as a potential conflict of interest.
Publisher’s Note
All claims expressed in this article are solely those of the authors and do not necessarily represent those of their affiliated organizations, or those of the publisher, the editors, and the reviewers. Any product that may be evaluated in this article, or claim that may be made by its manufacturer, is not guaranteed or endorsed by the publisher.
References
Chen, D., Zhao, H., Liu, K., Huang, Y., and Li, B. (2021). The Effect of Emulsion and Foam on Anti-water Coning during Nitrogen Foam Injection in Bottom-Water Reservoirs. J. Pet. Sci. Eng. 196, 107766. doi:10.1016/j.petrol.2020.107766
Delamaide, E., and Moreno, W. P. (2015). “Enhanced Oil Recovery of Heavy Oil in Reservoirs with Bottom Aquifer,” in SPE 174050 presented at the SPE Western Regional Meeting, Garden Grove, California, USA, 27-30 April.
Dong, X., Liu, H., and Chen, Z. (2021). Hybrid Enhanced Oil Recovery Processes for Heavy Oil Reservoirs. Developments in Petroleum Science. 1st Edn. Amsterdam: Elsevier.
Dong, X., Liu, H., Chen, Z., Wu, K., Lu, N., and Zhang, Q. (2019). Enhanced Oil Recovery Techniques for Heavy Oil and Oilsands Reservoirs after Steam Injection. Appl. Energ. 239, 1190–1211. doi:10.1016/j.apenergy.2019.01.244
Farouq Ali, S. M. (2007). Practical Heavy Oil Recovery. Calgary: Lecture Notes, University of Calgary.
Kirmani, F. U. D., Raza, A., Gholami, R., Haidar, M. Z., and Fareed, C. S. (2021). Analyzing the Effect of Steam Quality and Injection Temperature on the Performance of Steam Flooding. Energ. Geosci. 2 (1), 83–86. doi:10.1016/j.engeos.2020.11.002
Lai, S. Z., and Wardlaw, N. C. (1999). Factors Affecting the Application of Anti-water Coning Technology (AWACT) at the South Jenner Oil Field, Southeast Alberta. J. Can. Pet. Technol. 38 (03), 25–37. doi:10.2118/99-03-02
Liu, H. Q. (2013). Principle and Design of thermal Oil Recovery Processes. Beijing: Petroleum Industry Press. (in Chinese).
Liu, H., Wang, Y., Zheng, A., Sun, X., Dong, X., Li, D., et al. (2020). Experimental Investigation on Improving Steam Sweep Efficiency by Novel Particles in Heavy Oil Reservoirs. J. Pet. Sci. Eng. 193, 107429. doi:10.1016/j.petrol.2020.107429
Liu, Y., Li, Y., Jiang, S., Li, S., Zhang, L., Zhang, C., et al. (2013). An Application of Hall Curve to thermal Recovery wells in Bohai Oilfields. China Offshore Oil and Gas 25 (5), 43–45.
Liu, Z., Wang, H., Blackbourn, G., Ma, F., He, Z., Wen, Z., et al. (2019). Heavy Oils and Oil Sands: Global Distribution and Resource Assessment. Acta Geologica Sinica ‐ English Edition 93 (1), 199–212. doi:10.1111/1755-6724.13778
Lu, C., Liu, H., Lu, K., Liu, Y., and Dong, X. (2013). “The Adaptability Research of Steam Flooding Assisted by Nitrogen Foam in Henan Oilfield,” in IPTC 16678 presented at the International Petroleum Technology Conference, Beijing, China, 26-28 March. doi:10.2523/16678-ms
Meyer, R. F., Attanasi, E. D., and Freeman, P. A. (2007). Heavy Oil and Natural Bitumen Resources in Geological Basins of the World. Open File-Report 2007-1084. U.S. Geological Survey.
Pang, Z.-x., Cheng, L.-s., Xu, J.-f., and Feng, R.-y. (2008). Application of Material Balance Method to Nitrogen Anti-water-coning Technology. Pet. Exploration Develop. 35 (2), 234–238. doi:10.1016/s1876-3804(08)60033-6
Pang, Z., Jiang, Y., Wang, B., Cheng, G., and Yu, X. (2020). Experiments and Analysis on Development Methods for Horizontal Well Cyclic Steam Stimulation in Heavy Oil Reservoir with Edge Water. J. Pet. Sci. Eng. 188, 106948. doi:10.1016/j.petrol.2020.106948
Pang, Z., Liu, H., and Zhu, L. (2015). A Laboratory Study of Enhancing Heavy Oil Recovery with Steam Flooding by Adding Nitrogen Foams. J. Pet. Sci. Eng. 128, 184–193. doi:10.1016/j.petrol.2015.02.020
Pang, Z., Lyu, X., Zhang, F., Wu, T., Gao, Z., Geng, Z., et al. (2018). The Macroscopic and Microscopic Analysis on the Performance of Steam Foams during thermal Recovery in Heavy Oil Reservoirs. Fuel 233, 166–176. doi:10.1016/j.fuel.2018.06.048
Wang, Y., Liu, H., Chen, Z., Wu, Z., Pang, Z., Dong, X., et al. (2018). A Visualized Investigation on the Mechanisms of Anti-water Coning Process Using Nitrogen Injection in Horizontal wells. J. Pet. Sci. Eng. 166, 636–649. doi:10.1016/j.petrol.2018.03.083
Keywords: heavy oil, water coning, N2 injection process, edge water, numerical simulation
Citation: Zheng W, Feng Y, Tan X, Yang R, Liu H, Xie H and Wang T (2022) Feasibility Investigation on the N2 Injection Process to Control Water Coning in Edge Water Heavy Oil Reservoirs. Front. Earth Sci. 9:825253. doi: 10.3389/feart.2021.825253
Received: 30 November 2021; Accepted: 20 December 2021;
Published: 03 March 2022.
Edited by:
Yulong Zhao, Southwest Petroleum University, ChinaReviewed by:
Hong-Bin Liang, Southwest Petroleum University, ChinaLingfu Liu, University of Wyoming, United States
Copyright © 2022 Zheng, Feng, Tan, Yang, Liu, Xie and Wang. This is an open-access article distributed under the terms of the Creative Commons Attribution License (CC BY). The use, distribution or reproduction in other forums is permitted, provided the original author(s) and the copyright owner(s) are credited and that the original publication in this journal is cited, in accordance with accepted academic practice. No use, distribution or reproduction is permitted which does not comply with these terms.
*Correspondence: Huiqing Liu, bGl1aHExMTBAMTI2LmNvbQ==