- 1State Key Laboratory of Shale Oil and Gas Enrichment Mechanisms and Effective Development, Beijing, China
- 2State Energy Center for Shale Oil Research and Development, Jiangsu, China
- 3Southwest Petroleum University, Chengdu, China
The accurate calculation of the two-phase relative permeability has a significant impact for effectively characterizing the fluid flow patterns of unsaturated shale reservoir. A new fractal relative permeability model is developed based on two-phase transport feature in confined nanopores, which is upscaled with the aid of fractal theory for two-phase flow through unsaturated shale porous medium. Unlike the earlier models, the presented models considered nanopore wettability, confined viscosity varies with the nanopore diameter (variable water phase viscosity), stress dependence effect, real gas effect, irreducible water saturation and tortuosity effect. The proposed model compares the permeability of single nanopore and multiple nanopores with earlier research, which shows that the fractal relative permeability model agrees well with earlier models and experimental data. The results show that the Monte Carlo model and Abaci experimental model studied by previous researchers are special cases of the proposed fractal model, thus showing that the proposed fractal model has obvious advantages. Further calculations show that 1) The gas phase’s relative permeability gradually decreases with the increase of water saturation; 2) Confined viscosity varies with the nanopore diameter has a greater influence on the inorganic pores and a smaller influence on the organic pores on the relative permeability; 3) The relative permeability of the intersection point in the organic pore is higher than that of the inorganic porous, but the water saturation at the intersection is less than that of inorganic pores. Therefore, it lays a solid foundation for revealing the two-phase flow law of shale porous media.
1 Introduction
Simulating the gas and water fluid flow in the shale multi-scale pore structure of an unsaturated reservoir plays an extremely important role in dealing with key issues such as fracturing fluid flowback and unsaturated reservoir development (Bear and Jacob, 1975; Adler and Brenner, 1988; Berkowitz, 2002). One of the most important basic parameters that can characterize the multiphase flow of oil and gas reservoirs is the two-phase relative permeability. It can not only evaluate the behavior of multiphase fluids, but also provide constructive guidance for unsaturated oil and gas reservoirs (Lei Dong et al., 2015). Laboratory test simulation (Jackson et al., 2018) and theoretical derivation of mathematical formulas (Li, 2010; Yao et al., 2018) are the most important methods for evaluating the relative permeability of gas and water phases. Nevertheless, due to the extremely low permeability and the extremely complex nanopore structure, the relative permeability of the two phases of unsaturated tight reservoirs cannot be accurately obtained (Zhang et al., 2017). For this reason, in order to study the gas-water two-phase flow behavior in tight reservoir shale porous media, mathematical models are widely used to accurately predict the gas-water two-phase relative permeability.
Fractal theory is adopted by a large number of researchers to accurately study the relative permeability of the microscopic pore structure of saturated shale porous media with wet and non-wet phases. Katz et al. (Katz and Thompson, 1985) and Krohn et al. (Krohn and Christine, 1988) have rigorously demonstrated that porous media rocks with complex pore structures have fractal characteristics. Based on the fractal self-similarity theory, numerous researchers extensively apply mathematical modeling and numerical simulation to study the gas-water two-phase fluid flow behavior in rock pore structure, and obtained the two-phase relative permeability model (Tan et al., 2015; Wang et al., 2017). According to the assumption that each capillary bundle is saturated by the wetting and non-wetting phase fluids, Yu et al. (Yu and Li, 2003) uses the fractal capillary bundle model and the Hagen-Poiseuille equation to accurately calculate the fractal permeability of the tight reservoir rock porous media. Liu et al. (Liu and Yu, 2007) proposed a new fractal permeability model that considers the capillary pressure effect. However, although these models use fractal theory, they do not consider the combined effects of tortuous capillaries, viscosity changes with pore diameter, and irreducible water saturation.
Prediction of gas-water two-phase relative permeability in shale multi-scale pore structure is still challenging due to complex pore structures and ultra-low permeability. The flow channel is not straight but tortuous, which is a typical feature of multiphase fluid flowing in real porous medium rock. Clennell (Clennell, 1997) and Khalili (Matyka et al., 2008) demonstrates the great and profound influence of tortuosity on the electrical, hydraulics and diffusion properties in unsaturated rocks with multi-scale pores, and based on this, introduces the concept and characteristics of tortuosity (Carman, 1937). Yu (Yu and Li, 2003) and Liu (Liu et al., 2021) established a porous media permeability model based on fractal theory through mathematical modelling method and considering fractal distribution of tortuosity. The results show that the fractal permeability calculated under the conditions of considering fractal distribution of tortuosity and not considering fractal distribution of tortuosity has a significant difference. Wang (Wang et al., 2018) developed the relationship between volume flow and confined pressure considering the fractal distribution of tortuosity in a single confined nanotube. The results show that the fractal distribution of tortuosity increases the complexity of the pore structure of porous media, thereby reducing the permeability of porous media.
Furthermore, the inherent rock properties of porous media play an important role in the main controlling factors affecting the viscosity of confined water compared with bulk water and bulk gas (Li et al., 2007; Feng et al., 2018). It is known that in hydrophilic nanotubes, due to the large amount of water attached to the boundary wall (Thompson and Robbins, 1990), the viscosity of the bulk water and the bulk gas viscosity are much lower than the effective viscosity of the confined water near the boundary wall (Feibelman, 2013). However, the wettability fluid can effectively slide along the hydrophobic capillary wall (Vinogradova et al., 2009), and the no-slip boundary condition assumption no longer holds (Wu et al., 2017). In addition, the effect of water/micropore wall interaction on the flow behavior of confined water is significantly different from that of water/porous wall interacting (R R, et al., 2012; Lorenz and Zewail, 2014). Real slip conditions can characterize the water/micropore wall interaction effect at the molecular level. However, because the interaction between bulk fluid and solid wall occurs near the boundary region of confined nanopore wall, the apparent viscosity can be used to express the fluid viscosity in the boundary region of pore wall (Wu et al., 2017). Yang (Yang et al., 2019) put forward the order of factors that affect the permeability of shale multiscale pore structure. Analysis results show that shale fluid relative permeability is strongly influenced by the slip length with distinctive flow patterns characterizing on fluid/solid interaction.
To accurately gain the relative permeability of shale gas and water phase (The effective permeability of the two-phase fluid through the rock accounts for the content of the absolute permeability of the single-phase fluid through the rock), it is also very important to the calculation of absolute permeability in the nano-scale range. Hu, et al. (Hu and Huang, 2017) concludes that absolute permeability is an intrinsic property of rock, which absolute permeability remains unchanged with the properties of fluids through rock unless there are physical and chemical reactions between fluids and rock. Therefore, Yu (Yu and Li, 2003) obtained the absolute permeability on the basis of Darcy’s law equation under the condition of water saturation of 0 or 1, and then established a two-phase relative permeability model based on fractal theory. Xu (Xu et al., 2013) believes that the absolute permeability calculated under the condition that the shale pore structure is completely saturated with fluid is a special case of the effective permeability of single-phase fluid.
In general, when these models are upgraded from nanoporous microscopic simulation to porous media macroscopic simulation, the comprehensive effect of fluid confined viscosity with nanopore size and wettability change have not been effectively solved in shale porous media gas-water two-phase flow channel. For the purpose of accurately simulating the confined fluid flow in shale porous media, the gas-water two-phase relative permeability model of shale porous media must be established under the conditions of nano-scale interface fluid viscosity with nano-aperture variation, tortuous capillary effect and effective slip boundary. These problems have been well analyzed and addressed in this paper. Additionally, the paper also considered stress dependence effect, real gas effect, irreducible water saturation and tortuosity effect, which these effects the earlier models were not considered at the same time. The basic route and structure of the rest of the article are as follows: Fractal model for gas and water transport is organized in Section 2. The two-phase transport model in the porous shale matrix is organized in Section 3. The Model comparison and validation is organized in Section 4. The effects of the real gas, variable water viscosity, gas viscosity, structural parameters, irreducible water saturation and wetting angle on the two-phase relative permeability model are investigated in Section 5. Finally, several conclusions are provided in Section 6.
2 Fractal model for gas and water transport
2.1 Basic theory
Due to the intricate distribution of porous media pores in tight reservoirs, in the light of the complexity of pore distribution in tight reservoirs, the pore distribution of porous media in tight reservoirs has to be simplified using fractal theory. Fractal Theory is a new theory and subject that is very popular and active today. Fractal theory plays a huge role in the simplification of real complex systems. The tight reservoir porous medium satisfies the fractal characteristics. Therefore, the fractal theory can be used to study the water and gas relative permeability of the tight reservoir. On the vertical section of shale multi-scale pore structure, the cumulative size N whose pore size is greater than or equal to λ obeys the fractal scaling law (Boming Yu and Cheng, 2002):
Where λmax is the maximum nanopore size, nm; Df is the pore fractal dimension, 0 < Df < 2.
Differentiating Eq. 1 with respect to λ can be obtained (Yu and Liu 2010):
Eq. 2 establishes the differential relationship between the number of capillaries and the diameter of nanopores in a unit of shale porous media; the negative sign in Eq. 2 indicates that the larger the diameter of nanopores, the fewer the number of capillary pores.
From Eq. 1, the total number of capillaries from λmin to λmax can be obtained:
Simultaneous Eq. 2 and Eq. 3 can be obtained:
Where
Assuming that the λmin/λmax = m, can obtain the pore fractal dimension Df expression is:
Where
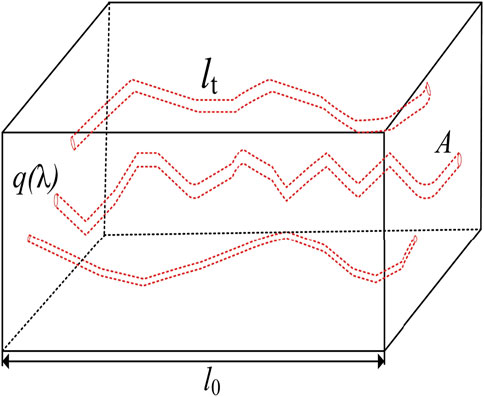
FIGURE 1. Schematic illustration of the physical model of the tortuous capillary in shale porous media (Zeng et al., 2020).
Wheatcraft (Wheatcraft et al., 1991) established the fractal relationship between the length of the tortuous capillary flowing through the porous medium and the fractal shape of the round capillary by using fractal theory and considering the tortuous capillary effect in shale porous media:
Where lt is the length of the tortuous capillary, nm; DT is the tortuous fractal dimension of the capillaries, with 1 < DT < 2, represents the complexity of fluid flow through shale porous media capillary pore space.
The tortuous fractal dimension can be written:
Where
Considering that the tortuous and bending properties of real capillary are important factors that cannot be ignored in shale porous media, the introduction of tortuous capillary to characterize the complex transport behavior of fluid in porous media. Considering the complex flow path in shale porous media, the average tortuosity can be obtained as:
According to Eq. 4, the average nanopore diameter of the tortuous capillary can be obtained as:
Equation 9 can be further simplified to obtain:
The average nanopore diameter of capillary in shale porous media can be calculated by Eq. 10. And consider that the porous medium in the cross section of Figure 1 is composed of nanopores with different round diameters. Therefore, the vertical cross-sectional area of the microscopic pore structure of tight reservoirs can be calculated by Eq. 11:
Substituting Eq. 4 into Eq. 11 can further improve Eq. 11:
The vertical cross-sectional area of micro-pore structure of shale reservoir is as follows:
By substituting Eq. 12 into Eq. 13, the straight-line distance
Combining Eq. 10 and Eq. 14, the relationship between the straight-line distance of the capillary and the average diameter of the nanopores in the porous medium is:
Thus, by substituting Eq. 15 and Eq. 8 into Eq. 7, the tortuous fractal dimension DT can be calculated.
2.2 Gas and water transport in nanopores
Curtis (Curtis et al., 2012) have verified and obtained the conclusion that a large number of inorganic and organic pores are widely present in shale matrix nanopores. However, due to the strong constrained between fluid molecules and the solid surface, the slip-free Hagen-Poiseuille relationship based on the continuum cannot accurately characterize the fluid transport behavior in the nanochannel. Due to the greater difference in density of liquids than gases, the use of gas dynamics theory is ruled out (Gad-El-Hak, 2006). Experimental results and MDS studies have shown that the most suitable for explaining the transfer characteristics of nanofluids must be combined with slip boundary conditions and effective viscosity correction to accurately reveal the flow mechanism of gas and water fluid in confined channel (Thomas and Mcgaughey, 2008; Wu et al., 2017). The physical model of gas and water fluid flow in nanopores is shown in Figure 2.
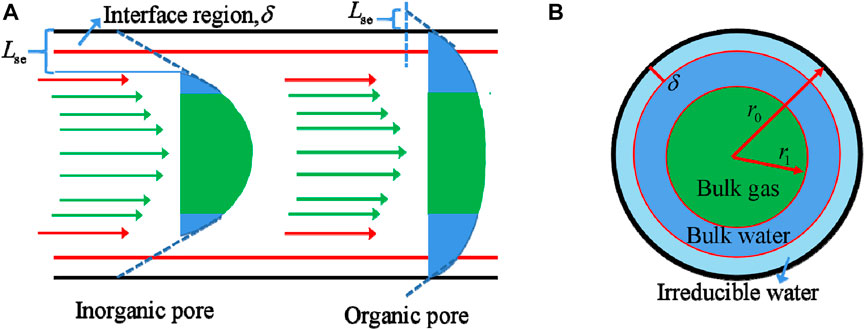
Figure 2A is the physical model of gas and water fluid flow in organic/inorganic nanopores, where Lse represents the effective slip length, and δ is the immovable liquid film thickness occupied by irreducible water; Figure 2B is the gas and water flow model in nanopores.
2.2.1 Transport in nano pores
The inherent characteristics of fluid incompressibility in rock porous media are used as hypothetical conditions. And in the capillary, the flow of the water and gas fluid do not interfere with each other, that is, they flow in a stable laminar flow. The strong wetting effect and water absorption occur near the wall of tortuous capillary nanopores tube, which results in the existence of the partial wetting phase fluid in the form of liquid film. The immovable liquid film thickness δ can be used to characterize the degree of residual water phase fluid in shale porous media, so the liquid film thickness (δ) in this model will not change with the flow behavior generated by the fluid. The distribution and structural parameters of bulk gas, bulk water and irreducible water fluid in the capillary are shown in Figure 3. The length is l, the radius of the nanopore is r0 and the radius of the bulk gas flow channel is r1.
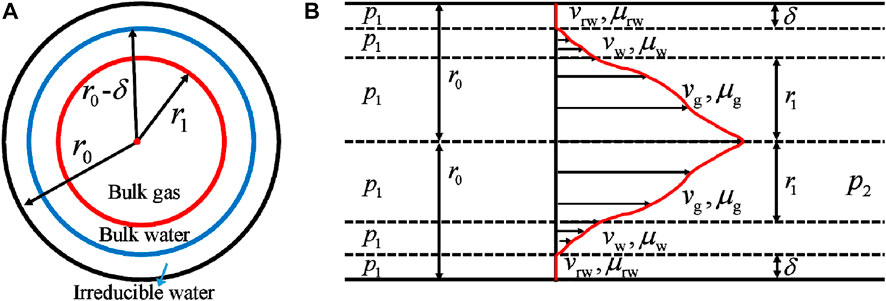
FIGURE 3. Physical model diagram for proposed models: (A) distribution of bulk gas, bulk water and bound water in nanopores; (B) fluid structure in nanopores.
Since any nanopore in shale porous media has the same fluid viscosity at the same distance, the fluid flow forms a cylindrical layer velocity field. Under the assumption that the fluid flows forward at a constant speed, the fluid driving force is πr2Δp and the fluid flow resistance is viscous force, that is, 2πrlt χ. According to the interaction principle of force in Newton’s third law, the relationship between fluid driving force and fluid viscous force is the relationship between force and reaction force when the fluid flows to the axis of a circle with a radius of r meters, then:
where χ is shear resistance due to friction between adjacent fluids, MPa; Δp is the drive pressure difference, equal to the difference between the inlet pressure p1 and the outlet pressure p2, MPa.Equation (16) can be simplified to
Eq. 17 applies to both water and gas phase. And substituting Newton’s law of viscosity into Eq. 17, can get:
Where μw is the water viscosity in the nanopore, Pa.s; μg is the gas viscosity in the nanopore, Pa.s; vw is the water velocity in the nanopore, nm/s; vg is the gas velocity in the nanopore, nm/s.
With the help of differential Eqs. 20, 21, the velocity distribution of the water and gas phase fluid with r0 distance from the central axis on the capillary section can be obtained:
Where vrw is the water fluid velocity at the nanopore boundary, nm/s; δ is the thickness of the liquid film at the nanopore boundary, nm; Cw and Cg are the velocity integral constants, dimensionless; r1 is the distance between the cylinder surface of the gas and water phases and the center axis of the nanopore, nm.
where r = r0-δ is the interface radius between the non-flow-able fluid and the flow-able fluid, and its water phase velocity expression is:
Where Ls is fluid real slip length at walls, nm.
According to Eqs. 22–26, the two-phase velocity equations can be expressed as:
Yu et al. (Yu and Li, 2003) proposed that the radius of the water and gas interface radius r1 can be expressed as:
Where λ is nanopore diameter, nm; Sg is non-wetting phase saturation, Sw is wetting phase saturation, Sg =1-Sw. Integrating Eq. 27 from r = r1 to r =λ/2 - δ, and Eq. 28 from r =0 to r =r1, the volume flux of gas phase fluid (qg) and water phase fluid (qw), respectively, can be attained for a single tube.
2.2.2 Fluid flow feature in confined nanopores
2.2.2.1 Stress dependence effect
Civan (Civan, 2010) proposed the relationship between the diameter of the tortuous capillary nanopore (
Where
The inherent permeability and porosity of the rock are (Dong, Hsu et al., 2010):
Where k the intrinsic permeability of shale porous media nanopores under effective stress, μm2; k0 is the inherent permeability of shale porous media under normal atmospheric pressure, μm2; pe is the difference between confining pressure (pc) and pore pressure (p), that is the effective stress, MPa; p0 is normal atmospheric pressure, MPa; S is permeability coefficient determined by the inherent properties of the rock, dimensionless;
Substituting Eqs. 33, 34 into Eq. 32, the relationship between shale nanopore diameter after considering stress sensitivity and effective stress is:
According to Eq. 32, the diameter of shale nanopores under atmospheric pressure can be obtained as follows:
Combined Eq. 35 and Eq. 36 can obtain the expression of shale nanopore diameter after considering stress sensitivity:
According to Eq. 37, it establishes the relationship between the diameter of shale nanopore and the diameter of nanopore under atmospheric pressure.
2.2.2.2 Effective slip length determination
The water-wall interaction in the confined nanoporous fluid flow space is greatly affected by the surface configuration of rock particles and the characteristics of physical and chemical reactions (Cottin-Bizonne et al., 2003). Particularly, the wetting property of the nanoporous boundary wall is particularly affected at low shear rates (Tretheway and Meinhart, 2002; Maali et al., 2008). The boundary slip length is closely related to the contact angle of wall surface (Granick et al., 2003). The specific expression for its calculation is:
Where Ls is the real slip length of the nanopore interface fluid, nm; C is the slip constant, which is 0.41 obtained by MD experimental simulation; θ is the contact angle of the confined nanopore channel, rad.
There is a significant difference between the boundary confined water viscosity and the bulk water viscosity near the wall of the confined nanopore channel, which leads to obvious slippage at the liquid/liquid interface (Mashl and Aluru, 2015). In practical, the effective slip length of confined fluid is affected by the real slip and apparent slip effects (Wu et al., 2017; Zeng et al., 2020), so the effective slip length parameter
Where
It is obvious from Eq. 39 that the effective slip length depends not only on the liquid/solid interface fluid wetting properties but also on the fluid viscosity and nanopore size (Thomas and Mcgaughey, 2008).
2.2.2.3 Confined nanofluid flow viscosity
Since the irreducible water viscosity and bulk water viscosity of the fluid exhibit unique properties when flowing in a restricted nanopore (Fradin et al., 2000; Bocquet and Tabeling, 2014), it is necessary to re-determine the effective viscosity of the nanopore fluid. Notably, the area of irreducible water and bulk water flow area is an important factor in determining effective viscosity. Therefore, considering the effective viscosity as the weighted summation of the bulk water viscosity and the irreducible water viscosity according to the area of the flow area (Thomas and Mcgaughey, 2008; Shaat and Mohamed, 2017), the specific expression of the effective viscosity can be obtained as:
Where
The irreducible water viscosity and bulk water viscosity are greatly influenced by the water/wall interaction and the rock wetting properties, and are close with the wetting angle of the water/wall interface. The wetting angle can then be used to express the fluid viscosity in the interface area (Raviv et al., 2001).
Where
In addition, the linear relationship between the wetting angle and the viscosity of the interface region is not limited to CNTs or films, and will have universal applicability in practice (Wang and Cheng, 2019). Notably, rocks are affected by long-term deposition of different fluids, resulting in different wetting properties in shale nanopores, and making the walls of nanopores show different hydrophilicity or hydrophobicity (closely related to contact angle). Therefore, the relationship between the contact angle and the fluid viscosity in the confined area (Eq. 41) is used to characterize the transport characteristics of organic and inorganic pores in shale porous media. According to Eq. 41, it can be seen that the surface of the hydrophilic nanopore exhibits an area of bound water with extremely poor fluidity, and the surface of the hydrophobic nanopore exhibits an area of low viscosity and flow-able bulk water.
The viscosity of the bulk water has the following relationship with the formation temperature of the fluid (Laliberté, 2007).
Where T is the formation temperature, K.
2.2.2.4 Real gas effect and confined gas viscosity
Under the actual extreme heat and high pressure conditions of the formation, due to the influence of the real gas effect, the gas compression characteristics will be different from the ground conditions and cannot be ignored. Therefore, the pseudo pressure and pseudo temperature are used to characterize the gas compressibility factor (Wu et al., 2016).
where pr is the pseudo-pressure, dimensionless; Tr is the pseudo-temperature, dimensionless; pc is the methane critical pressure, MPa; Tc is the methane critical temperature, K.
And the gas viscosity in the nanopore can be characterized by Eq. 46 (Tran and Sakhaee-Pour, 2017):
Where
When a gas flows in the pores of a tight reservoir, the confined gas viscosity is different from the effective gas viscosity, which is presented as a function of the Knudsen number (Kn) in a proportional form as follows:
In Eq. 51,
In Eq. 52, the mean free path l of gas molecules is expressed by (Roy et al., 2003):
Where Rg is the universal gas constant, 8.314 J/mol/K.
Tran (Tan et al., 2014) gives the specific expression of C(Kn) as follows (Sone et al., 1990):
Where:
3 Two-phase transport model in shale porous medium
3.1 The two-phase effective permeability in shale porous medium
The total flow rate of non-wetting and wetting phase volume fluxes per unit volume can be obtained by summing all nanoporous flows in shale multi-scale pore structure by fractal theory for gas and water transport method in Section 2 (Tan et al., 2014), and also consider capillary touristy, that is.
Where Qw is the total volume flow of wetting water phase per unit area in the nanopore of shale porous medium, nm3/s; Qg the total volume flow of non-wetting gas phase per unit area of nanopore of shale porous medium, nm3/s; Ne is the cumulative size of nanopores from the minimum nano-aperture (λmin) to the maximum nano-aperture (λmax) after considering the stress sensitivity (Eq. 37); qw is the flow rate of the wetting water phase in a single nanopore, nm3/s; qg is the flow flux of the non-wetting phase gas in a single nanopore, nm3/s.
Inserting (Eqs. 2, 6, 30, 31, 39–41, 46) into (Eq. 60) and (Eq. 61), one can get the volume flux of non-wetting and wetting phase fluid.
Since in Eqs. 62, 63, the effective viscosity μd in the denominator term of the integral function is a complex function of the diameter of the nanopore tube (Yang et al., 2019), it cannot be integrated easily. Therefore, in order to further simplify Eqs. 62, 63 to facilitate integration, a large number of shale porous media composed of different pipe diameters are divided into J tiny segments according to the nanopore pipe diameter range (
Where,
Then the flow of nanopores in each tiny part of shale is superimposed algebraically to obtain the gas and water phase flow flux of shale porous media:
Where J is the number of tiny segments.
Inserting Eq. 64 into Eq. 71, one can get
Where △pw is the differential pressure of wetting flow. Similarly, inserting Eq. 65 into Eq. 72, one can get:
Where △pg is the differential pressure of non-wetting flow.
According to Darcy’s law, the two-phase flow capacity of the porous medium are given by,
Inserting Eqs. 73, 74 into Eqs. 75, 76, one can get the effective permeability in shale gas porous media as.
Where Kw is the effective permeability of weting flow, Kg is the effective permeability of non-weting flow.
3.2 The two-phase relative permeability in shale porous medium
According to the definition of absolute permeability, it is the flow capacity when only containing single-phase gas or single-phase water. Under the condition that the fluid passes through the rock porous medium without physical and chemical reaction, the absolute permeability will not change because of the nature of the water or gas passing through the rock, which is the inherent property of the rock porous medium (Yu and Li, 2003; Hu and Huang, 2017). Therefore, it is only gas volume flux when the gas saturation is 1.
According to Darcy’s law, the gas flow capacity of the porous medium are given by,
Inserting Eq. 79 into Eq. 80, one can get the absolute permeability in shale gas porous media as.
Then, combining Eqs. 77, 78, 81, the initial two-phase relative permeability can be obtained as:
Considering that τ is the water saturation tortuosity when only one fluid is saturated in the porous medium, and τw and τg are the water-bearing tortuosity of the wetting phase and the gas-bearing tortuosity of non-wetting phase under two-phase seepage conditions. They satisfy the following relationship (Burdine, 1953):
Where Swi is the irreducible water saturation, dimensionless.
Since the water-bearing tortuosity and the gas-bearing tortuosity change with the change of saturation, according to Eqs. 82, 83 combined with Eqs. 84, 85, the following improved formulas are obtained (Burdine, 1953).
Put Eqs. 73, 74, 79 into Eqs. 77, 78, 81 respectively, and then put Eqs. 77, 78, 81 into Eqs. 86, 87, we can get:
Where:
Where
4 Model comparison and validation
In Section 2 and Section 3, the theoretical calculation model of the two-phase relative permeability in shale multi-scale pore structure is derived. This paper aims to study the analysis model of the two-phase relative permeability in shale multi-scale pore structure. Next, we will first verify the proposed model with earlier experimental and theoretical models. Then, study the real gas effect of porous media, gas viscosity effect, structural parameters of porous media (such as pore fractal dimension Df and tortuous fractal dimension DT), variable water viscosity, irreducible water saturation, wetting angle on the two-phase relative permeability are investigated in detail.
4.1 Verification of the proposed model with other models
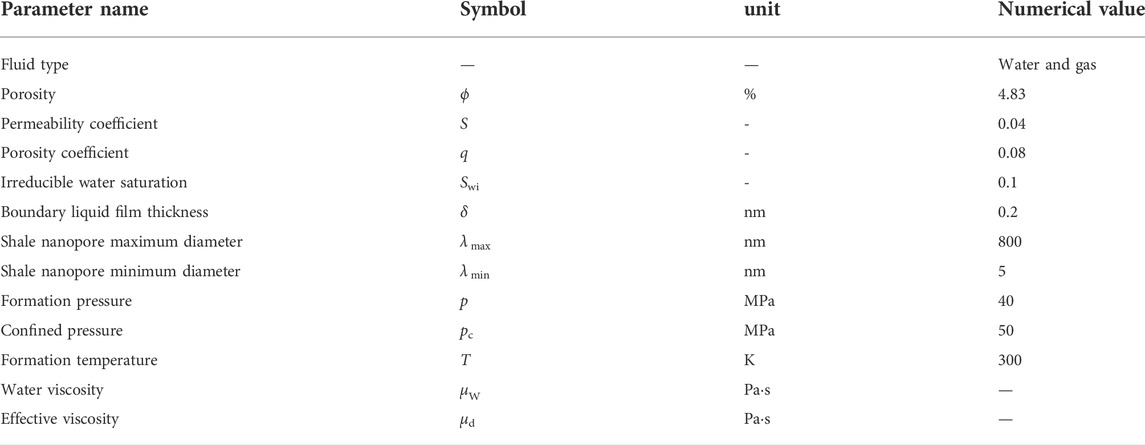
The proposed fractal two-phase relative permeability model is an idealized semi-analytical model. When macroscopic seepage occurs in the whole shale porous medium, the secondary role of pore connection shape and physicochemical reaction between fluid and rock can be ignored in revealing the two-phase relative permeability. In addition, the convergence value of fluid characteristics in shale multi-scale pore structure can be obtained under sufficient simulation conditions and the convergence criterion is satisfied. An approximation of the two-phase relative permeability can be obtained by setting the error of 10−3 and J=10,000 conditions in the following discussion. Other specific parameters are exhibited in Table 1 below.
Then, the rationality and reliability of this proposed model will be verified by mathematical theory verification and experimental simulation results. First, this paper will compare the relative permeability of single capillary with the G. Lei’s model (Lei et al., 2015) and Hagen-Poiseuille’s model. Second, we will perform multiple capillary nanopore relative permeability comparison on the Monte Carlo’s model (Xu et al., 2013) and Abaci’s model (Abaci et al., 1992).
4.1.1 Single capillary nanopore relative permeability comparison
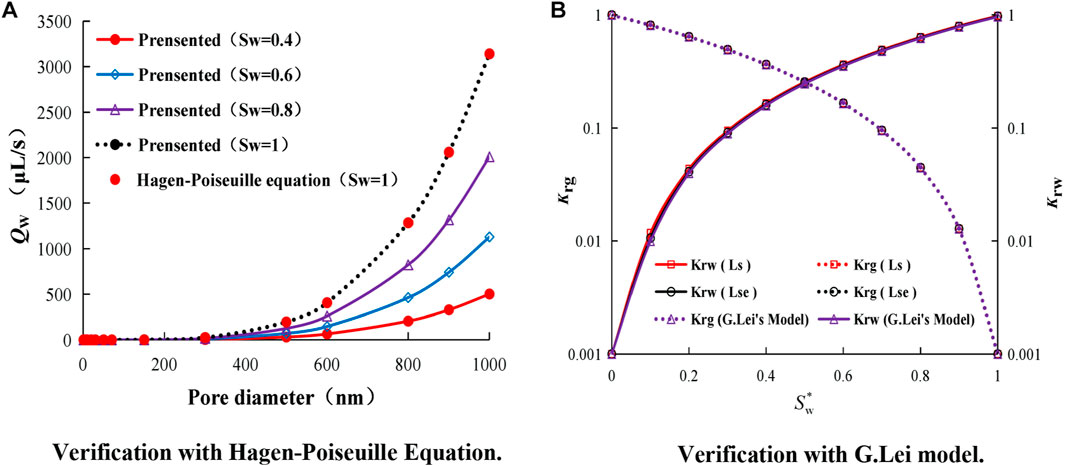
Under the condition of water saturation 1, boundary water film thickness 0 and bound water 0, the Hagen-Poiseuille equation under a single capillary and the water flow rate of the degradation model in this paper are calculated, as well as the comparison of the relative permeability between the G. Lei’s (Lei et al., 2015) model and the degradation model in this paper. As shown in Figure 4 below.
From Figure 4A, it can be observed the phenomenon that when the water saturation of the model in this paper is 0.4, 0.6, 0.8, and 1, our water phase flow gradually increases with the increase of water saturation, and it reaches Hagen-Poiseuille’s result when the water saturation is 1. The results are fully matched, which is sufficient to verify the correctness of the single capillary model in this paper.
Then on this basis, we will consider the single-nanopore flow rate of effective slip length and the two-phase effective permeability and absolute permeability calculated by the generalized Darcy’s law with the gas flow obtained when the gas saturation is 1. Then calculate the two-phase relative permeability according to the definition of relative permeability and compare it with the G. Lei model (Lei et al., 2015) considering the effective slip length (Lse) and slip length (Ls), as shown in Figure 4B As shown. From Figure 4B, it can get the conclusion that for the two-phase relative permeability, the effective slip length (Lse) and slip length (Ls) are considered to match the G. Lei model better. Therefore, it can prove the correctness of the model in this paper.
4.1.2 Multiple capillary nanopore relative permeability comparison
In this section, the effective slip length (Lse), slip length (Ls), and slip length (Ls = 0) under the condition of τw=τg=1 will be considered in comparison with the widely accepted Monte Carlo calculation model (Xu et al., 2013) and Abaci experimental data model (Abaci et al., 1992) parameters. In the experiments of Abaci et al. (Abaci et al., 1992), A relative permeability test was performed on anisotropy sandstones with a porosity of 33%. In the new model we proposed, the other parameters were obtained in the same way as the Monte Carlo calculation model (Xu et al., 2013) and the Abaci experimental model (Abaci et al., 1992) to obtain the results shown in Figure 5 below.
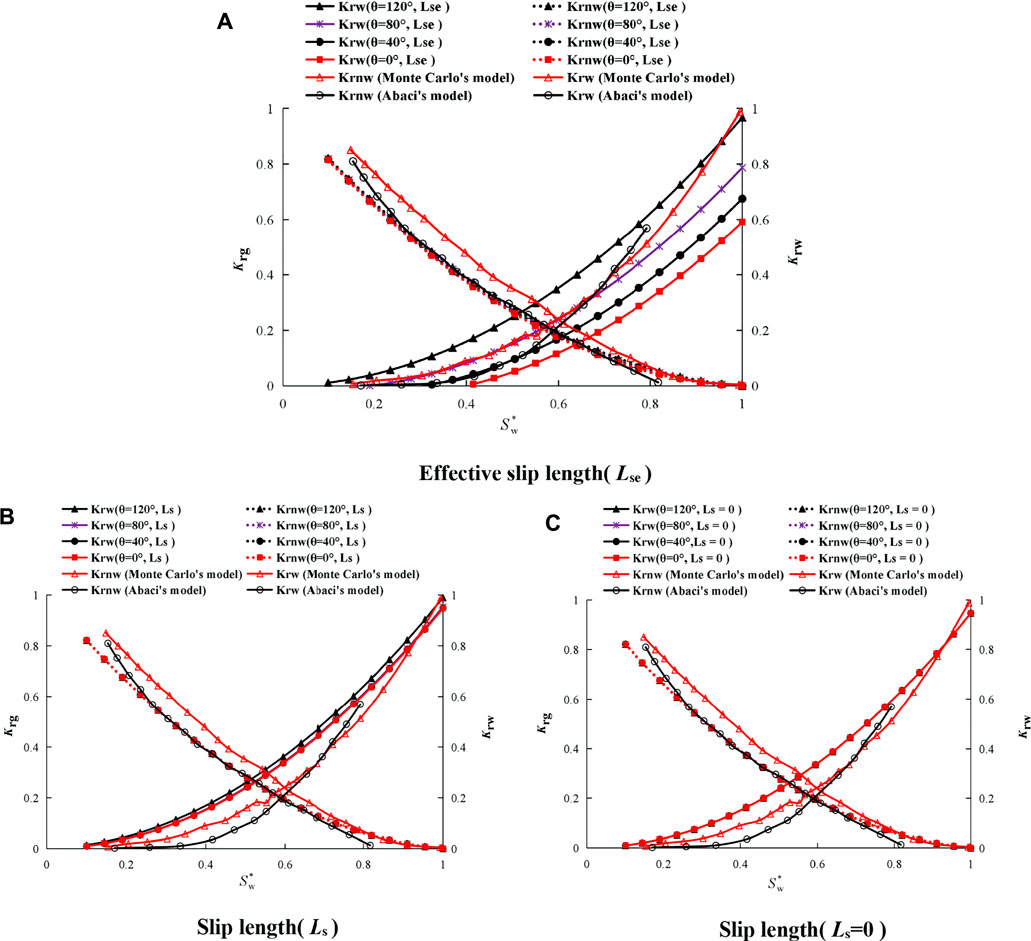
FIGURE 5. Multiple capillary nanopore relative permeability compared with Monte Carlo’s and Abaci’s model.
From Figure 5A, it can be seen that for the two-phase relative permeability, the model (considering effective slip, Lse) for the gas phase’s relative permeability is in good agreement with the Abaci experimental data model (Abaci, Edwards et al., 1992) at Sw = 0.28–0.73. Well, there is a slight difference between Sw <0.28 and Sw> 0.73, and the relative permeability of the water phase gradually changes from inorganic (wetting angle = 0°, 40°, 80°) to organic matter (wetting angle = 120°). It gradually becomes larger due to the increase of the effective slip length, which coincides well with the Abaci experimental data (Abaci et al., 1992) when the wetting angle is equal to 80°, which shows that the rock sample selected in the Abaci experiment (Abaci et al., 1992) is hydrophilic in the middle, and it also proves the presented model is experimentally correct. Moreover, the results also show that the Monte Carlo model and Abaci experimental model studied by previous researchers are special cases of the proposed fractal model, which indicate that the proposed fractal model has obvious advantages.
However, the reason why the model in this paper (Lse, Figure 4A) and (Ls, Figure 4B) shows the water phase’s relative permeability is not equal to 1 or 0 under different wetting angles when the water saturation is 1 or 0–0.15; but the model in this paper (Ls = 0, Figure 4C) does equal to 1 or 0 when the water saturation is 1 or 0. Because when the water saturation is small and the rock is hydrophobic, on the one hand, the natural gas channel compresses the flow of the bulk water channel, and on the other hand, due to the strong water phase viscosity and boundary water viscosity Water absorption causes the effective slip length to be less than 0; when the water saturation is 1, the effective slip length is less than 0 when the rock is hydrophobic and the water phase’s relative permeability is less than 1, and when the rock is hydrophilic, the effective slip length is greater than 0. As a result, the water phase’s relative permeability is greater than one.
5 Results and discussion
5.1 Real gas effect
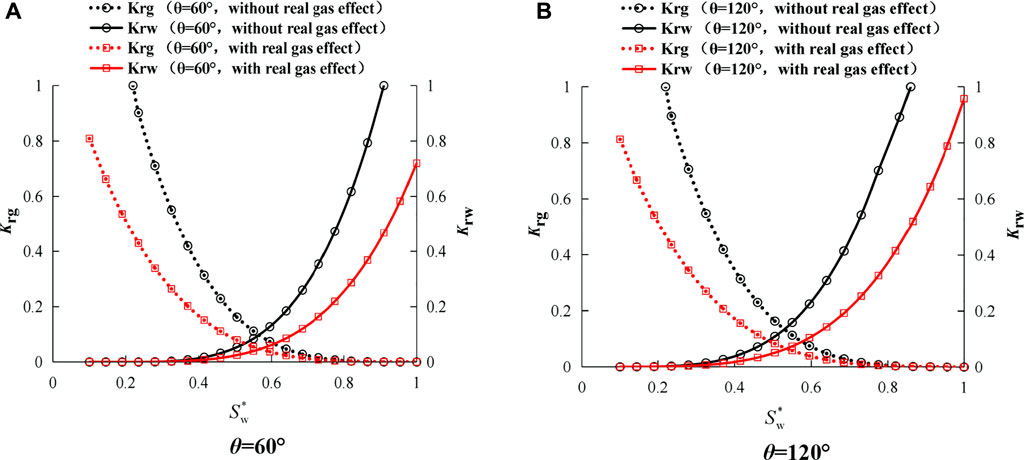
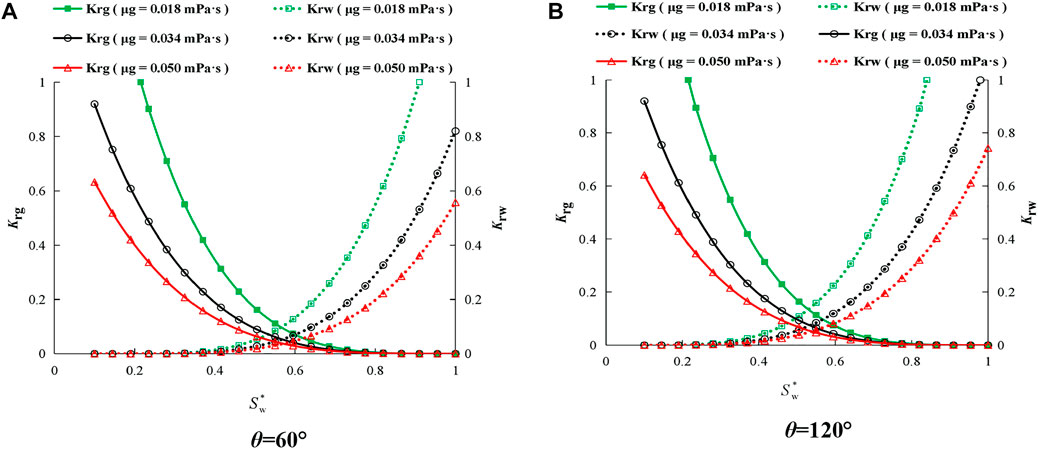
We will analyze the model in this paper considering the real gas effect and analyze it without considering the real gas effect (natural gas viscosity is 0.018 mPa s), as shown in Figure 6 below.
It can be seen from Figure 6 that when the wetting angles are 60° and 120°, the greater the water saturation, the gas phase’s relative permeability decreases exponentially from 1 to 0, while the water phase’s relative permeability increases exponentially from 0 to 1. The comparison of the relative permeability of gas and water with and without considering the real gas effect shows that the real gas effect has great effect on the two-phase relative permeability. In detail, the gas phase’s relative permeability with the real gas effect is 0.52 times (θ=60°) and 0.51 times (θ=120°) that of the gas phase’s relative permeability without the real gas effect under the condition of
5.2 Gas viscosity effect
When two-phase fluid flows in the multi-scale pore structure of shale, natural gas viscosity is an important parameter for obtaining the two-phase relative permeability. Therefore, it is necessary to analyze the effect of natural gas viscosity on the gas-water two-phase relative permeability. The organic wetting angle is 120°, and the inorganic wetting angle is 60°. As shown in Figure 7 below.
It can be observed the phenomenon from Figure 7 that the viscosity of natural gas has an influence on the two-phase relative permeability in inorganic and organic pores. In detail, the relative permeability of gas phase (
5.3 Structural parameters
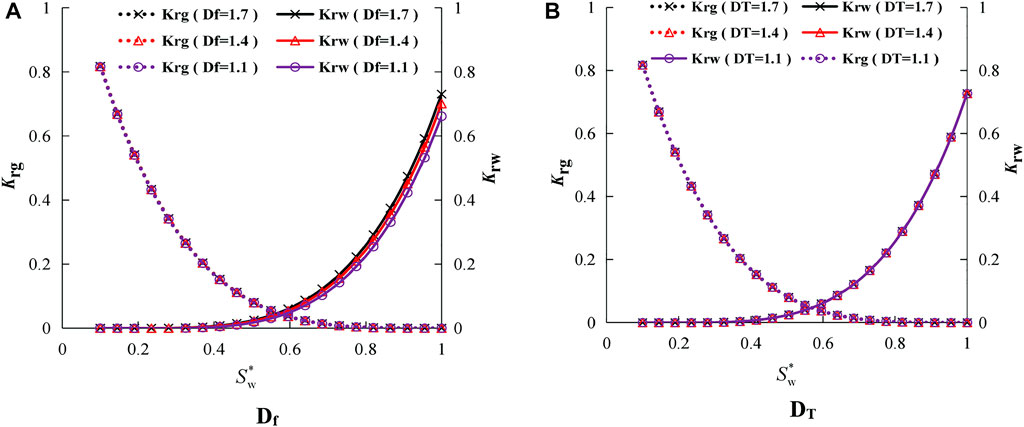
In porous media, there are pore fractal dimensions (Df) and tortuosity fractal dimensions (DT) to characterize porous media. Therefore, the influence of structural parameters on the two-phase relative permeability cannot be ignored, and it is necessary to analyze and study it. Taking an inorganic wetting angle of 60°, the parameter analysis is shown in Figure 8 below.
It can be seen from Figure 8 that the structural parameters have little effect on the gas phase’s relative permeability, but have a greater effect on the water phase’s relative permeability. With the gradual increase of Df, the water phase relative permeability gradually increases (Song et al., 2020), and as the DT gradually increases, the tortuosity fractal dimension has little effect on the water phase’s relative permeability.
5.4 Variable water viscosity
In actual shale reservoirs, the water phase viscosity varies with the diameter of the pipe and is close to the bulk water viscosity and boundary water viscosity. And the viscosity is also affected by the wetting angle. This effect is called the variable water phase viscosity effect. The opposite of this effect is the constant water phase viscosity, that is, the water phase viscosity is equal to the bulk water viscosity (μb). Therefore, it is very important to analyze the effect of the model with variable water phase viscosity and constant water phase viscosity on the two-phase relative permeability. As shown in Figure 9 below.
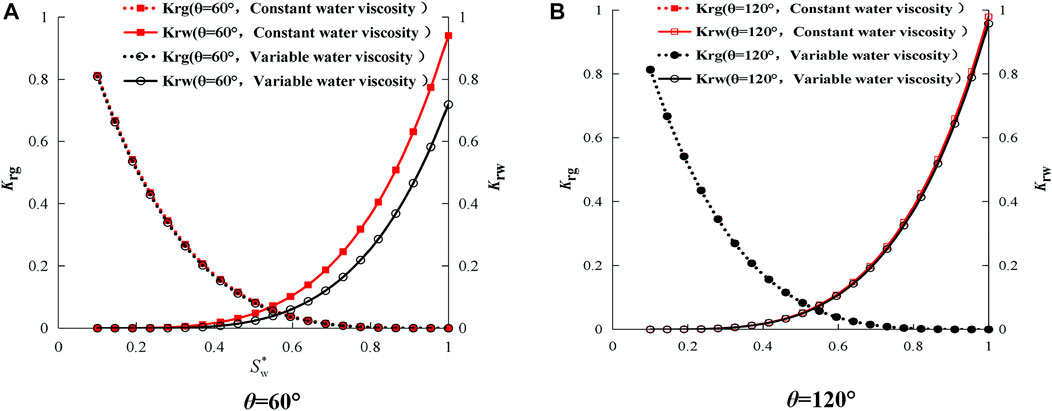
FIGURE 9. Effect of variable water phase viscosity on the two-phase relative permeability in porous media.
It can be seen from Figure 9 that variable water phase viscosity has a greater effect on the inorganic pores and a smaller effect on the organic pores on the two-phase relative permeability in the porous medium compared to constant water phase viscosity at a wetting angle equal to 60°or 120°. When the wetting angle is equal to 120°, the viscosity of the water phase has little effect on the two-phase relative permeability in the porous medium. This is because the rock is hydrophilic when the wetting angle is equal to 60°, and the rock is hydrophobic when the wetting angle is equal to 120°. In addition, it is easy to see that when the water saturation is 1 or 0–0.2, the relative permeability of variable water phase viscosity is less than 1 or 0 at a wetting angle equal to 60°, but the water phase does not appear this case at a wetting angle equal to 120°. This is because the rock is hydrophilic at a wetting angle equal to 60°, and the water phase viscosity and boundary water viscosity cause stronger water absorption effect which leading to the effect of effective slip length less than 0 is greater than the natural gas channel compressing the flow of the bulk water channel; while the water saturation is 1 or 0, the relative permeability of variable water phase viscosity is exactly equal 1 or 0 at a wetting angle equal to 120°, it is because the wetting angle is equal to 120°, the rock is hydrophobic, and the water phase viscosity and boundary water viscosity strongly absorb water effect, which results in the effect that the effective slip length is less than 0, which exactly offsets the natural gas channel compressing the bulk water channel flow. Therefore, the viscosity of water in porous media in this model varies with pipe diameter and the water phase viscosity is the area weighting of bulk water viscosity and boundary water viscosity which is more in line with reality.
5.5 Irreducible water saturation
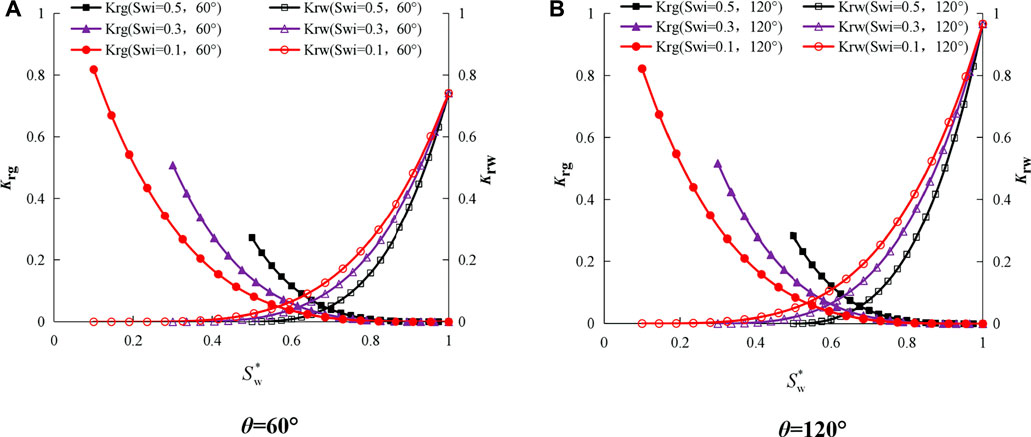
In actual shale reservoirs, the reservoir has irreducible water saturation in the nanopores due to the hydrophilic rocks, irregular pits, and the formation of water films. Therefore, the influence of this model considering irreducible water saturation on the two-phase relative permeability when Swi=0.1, 0.3 and 0.5 cannot be ignored, and it is necessary to analyze and study it. Take the inorganic wetting angle as 60°for parameter analysis, as shown in Figure 10A, and the organic wetting angle as 120° for parameter analysis, as shown in Figure 10B.
It can be seen from Figure 10 that the irreducible water saturation has a significant effect on the gas phase’s relative permeability and the water phase’s relative permeability. With the increase of irreducible water saturation, the water phase’s relative permeability gradually decreases. This is because with the increase of irreducible water saturation, the space of the mobile water phase in the rock nanopores is restricted, causing the water flow rate to gradually decrease.
It is worth noting that for the irreducible water saturation of 0.1, 0.3, 0.5 in inorganic wetting angle as 60°, the relative permeability of the intersection point of the corresponding water phase and gas phase is 0.048 (Sw=0.57), 0.05 (Sw=0.67), 0.057 (Sw=0.76); but for the irreducible water saturation of 0.1, 0.3, 0.5 in organic wetting angle as 120°, the relative permeability of the intersection point of the corresponding water and gas phases is 0.063 (Sw=0.53), 0.064 (Sw=0.63), 0.067 (Sw=0.74); it can be drawn the conclusion that the relative permeability of the intersection point in the organic pore is higher than that of the inorganic porous, but the water saturation at the intersection is less than that of inorganic pores. This is because organic pores are hydrophobic, and capillary force acts as a driving force to increase the water phase’s flow pressure, causing the relative permeability of the intersection point of organic pores to be greater than that of inorganic pores and the water saturation of the intersection point is smaller than that of inorganic pores; while inorganic pores have hydrophilicity, capillary force acts as resistance to reduce the water phase’s flow pressure, causing the relative permeability of the intersection of inorganic pores to be smaller than that of organic pores and the water saturation of the intersection point to be greater than that of organic pores.
5.6 Wetting angle
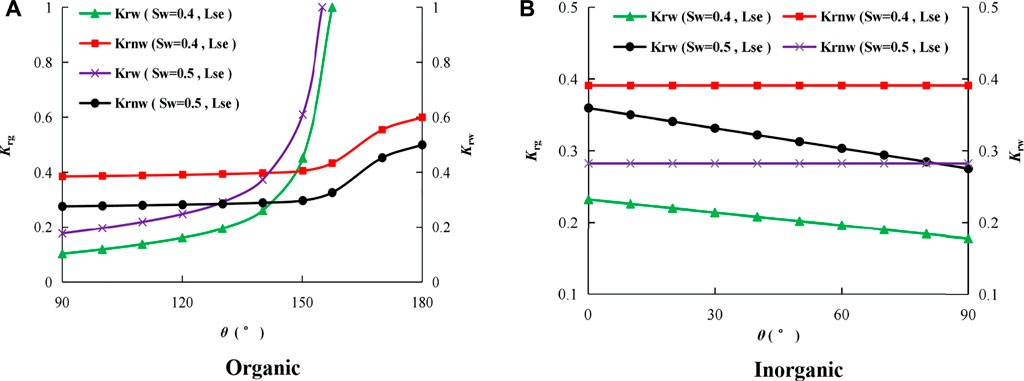
The shale porous medium is divided into organic pores and inorganic pores according to the wetting angle of organic pores >90°and inorganic pores <90°. The effective slip length and slip length under different wetting angles are quite different, so it is vital to analyze and consider the influence of wetting angle on the two-phase relative permeability. In this section, the effective slip length (Lse) will be considered in comparison with slip length (Ls) and slip length (Ls = 0) in organic and inorganic pores, to analyze the effect of wetting angle on the two-phase relative permeability. Take water saturation of 0.4 and 0.5 for analysis.
From Figure 11, it can be observed the phenomenon that with the increase of the wetting angle, the water phase’s relative permeability of the proposed model (Lse) in organic matter is slowly increased when the water saturation is 0.4 between 90° and 150°. When the angle is larger than 150°, the water phase’s relative permeability increases sharply due to the sharp increase of the effective slip length. However, for inorganic matter, the larger the wetting angle, the smaller the water phase’s relative permeability, but the smaller the effect on the gas phase’s relative permeability. This is because as the wetting angle increases, the hydrophobic properties of organic matter become stronger, while the hydrophilic properties of inorganic matter become weaker and gradually transition to hydrophobic properties.
In addition, when the water saturation of organic matter is 0.4, the water phase’s relative permeability curve and the gas phase relative permeability curve intersect at a wetting angle of 150°, and when the water saturation of organic matter is 0.5, the water phase’s relative permeability curve and the gas phase relative permeability curves intersect at a wetting angle of 130°. This is because the larger the water saturation, the larger the water phase flow channel, and the smaller the boundary water viscosity (μrw) for the area weighting that considers the water phase viscosity (μd) as the bulk water viscosity and the boundary water viscosity. It is necessary to reduce the wetting angle (Eq. 41,
6 Conclusion
Based on fractal theory, this paper establishes a fractal model that can accurately calculate the two-phase relative permeability in the multi-scale pore structure of shale. Under the same geological parameters, the proposed model is in good agreement with the mechanism model of Hagen-Poiseuille and G. Lei et al., which proves the proposed model correct. Unlike the earlier models, the proposed model considers the three-layer flow composition of nanopore pore boundary layer, bulk water and bulk gas, the difference between organic pores and inorganic pores is affected and controlled by wettability and effective slip length, the viscosity changes with the diameter of the pipe, the stress dependance effect, confined gas viscosity and real gas effect.
The results demonstrate that the gas phase’s relative permeability gradually decreases with the increase of water saturation; the water phase’s relative permeability gradually increases with the increase of water saturation. Generally, the relative permeability of the intersection point in the organic pore is higher than that of the inorganic porous, but the water saturation at the intersection is less than that of inorganic pores. In real situations, the final relative permeability value is determined by the interplay of the effective stress and slip flow effects. Notably, with the increase of the wetting angle, the water phase’s relative permeability of the model (Lse) in this paper is slowly increased when the water saturation is 0.4 between 90° and 150°. When the angle is larger than 150°, the water phase’s relative permeability increases sharply due to the sharp increase of the effective slip length.
Data availability statement
The original contributions presented in the study are included in the article/supplementary material, further inquiries can be directed to the corresponding author.
Author contributions
LF is responsible for the construction of the overall paper structure, ZF formulates research ideas, technical routes, model establishment and paper writing, SY is responsible for literature research, ZY is responsible for model solving, code writing and paper writing.
Funding
This work was supported by Open Experiment of National Energy Shale Oil Research and Development Center “Geology-engineering integration sweet spot evaluation and intelligent fracturing control technology for continental shale oil” (No. 33550000-21-2C0613-0292).
Conflict of interest
The authors declare that the research was conducted in the absence of any commercial or financial relationships that could be construed as a potential conflict of interest.
Publisher’s note
All claims expressed in this article are solely those of the authors and do not necessarily represent those of their affiliated organizations, or those of the publisher, the editors and the reviewers. Any product that may be evaluated in this article, or claim that may be made by its manufacturer, is not guaranteed or endorsed by the publisher.
References
Abaci, S., Edwards, J. S., and Whittaker, B. N. (1992). Relative permeability measurements for two phase flow in unconsolidated sands. Mine Water Environ. 11 (2), 11–26. doi:10.1007/bf02919583 |
Adler, P. M., and Brenner, H. (1988). Multiphase flow in porous media. Annu. Rev. Fluid Mech. 20, 35–59. doi:10.1146/annurev.fl.20.010188.000343 |
Berkowitz, B. (2002). Characterizing flow and transport in fractured geological media: A review. Adv. Water Resour. 25 (8/12), 861–884. doi:10.1016/s0309-1708(02)00042-8 |
Bocquet, L., and Tabeling, P. (2014). Physics and technological aspects of nanofluidics. Lab. Chip 14 (17), 3143–3158. doi:10.1039/c4lc00325j | |
Burdine, N. T. (1953). Relative permeability calculations from pore size distribution data. J. Petroleum Technol. 98 (3), 71–78. doi:10.2118/225-g |
Christine, Krohn & E. (1988). Fractal measurements of sandstones, shales, and carbonates[J]. J. Geophys. Res. Solid Earth 93 (B4), 3297–3305.
Civan, F. (2010). Effective correlation of apparent gas permeability in tight porous media. Transp. Porous Media 82 (2), 375–384. doi:10.1007/s11242-009-9432-z |
Clennell, M. B. (1997). Tortuosity: A guide through the maze. Geol. Soc. Lond. Special Publ. 122 (1), 299–344. doi:10.1144/gsl.sp.1997.122.01.18 |
Cottin-Bizonne, C., Barrat, J. L., Bocquet, L., and Charlaix, E. (2003). Low-friction flows of liquid at nanopatterned interfaces. Nat. Mat. 2 (4), 237–240. doi:10.1038/nmat857 | |
Curtis, M. E., Sondergeld, C. H., Ambrose, R. J., and Rai, C. S. (2012). Microstructural investigation of gas shales in two and three dimensions using nanometer-scale resolution imaging. Am. Assoc. Pet. Geol. Bull. 96 (4), 665–677. doi:10.1306/08151110188 |
Dong, J. J., Hsu, J. Y., Wu, W. J., Shimamoto, T., Hung, J. H., Yeh, E. C., et al. (2010). Stress-dependence of the permeability and porosity of sandstone and shale from TCDP Hole-A. Int. J. Rock Mech. Min. Sci. (1997). 47 (7), 1141–1157. doi:10.1016/j.ijrmms.2010.06.019 |
Feibelman, P. J. (2013). Viscosity of ultrathin water films confined between aluminol surfaces of kaolinite: Ab initio simulations. J. Phys. Chem. C 117 (12), 6088–6095. doi:10.1021/jp312152h |
Feng, D., Li, X., Wang, X., Li, J., Zhang, T., Sun, Z., et al. (2018). Capillary filling of confined water in nanopores: Coupling the increased viscosity and slippage. Chem. Eng. Sci. 186, 228–239. doi:10.1016/j.ces.2018.04.055 |
Fradin, C., Braslau, A., Luzet, D., Smilgies, D., Alba, M., Boudet, N., et al. (2000). Reduction in the surface energy of liquid interfaces at short length scales. Nature 403 (6772), 871–874. doi:10.1038/35002533 | |
Gad-El-Hak, M. (2006). Gas and liquid transport at the microscale. Heat. Transf. Eng. 27 (4), 13–29. doi:10.1080/01457630500522305 |
Granick, S., Zhu, Y., and Lee, H. (2003). Slippery questions about complex fluids flowing past solids. Nat. Mat. 2 (4), 221–227. doi:10.1038/nmat854 | |
Hu, X., and Huang, S. (2017). Physics of Petroleum reservoirs[M]. Springer Berlin Heidelberg, 1–506. |
Jackson, S. J., Agada, S., Reynolds, C. A., and Krevor, S. (2018). Characterizing drainage multiphase flow in heterogeneous sandstones. Water Resour. Res. 54 (4), 3139–3161. doi:10.1029/2017wr022282 |
Katz, A. J., and Thompson, A. H. (1985). Fractal sandstone pores: Implications for conductivity and pore formation. Phys. Rev. Lett. 54 (12), 1325–1328. doi:10.1103/physrevlett.54.1325 | |
Laliberté, M. (2007). Model for calculating the viscosity of aqueous solutions. J. Chem. Eng. Data 52 (4), 321–335. doi:10.1021/je0604075 |
Lei, G., Dong, P. C., Mo, S. Y., Gai, S. H., and Wu, Z. S. (2015). A novel fractal model for two-phase relative permeability in porous media[J]. Fractals 23 (02), 1550017. doi:10.1142/s0218348x15500176 |
Li, K. (2010). More general capillary pressure and relative permeability models from fractal geometry. J. Contam. Hydrology 111 (1), 13–24. doi:10.1016/j.jconhyd.2009.10.005 | |
Li, T. D., Gao, J., Szoszkiewicz, R., Landman, U., and Riedo, E. (2007). Structured and viscous water in subnanometer gaps. Phys. Rev. B 75 (11), 115415–115416. doi:10.1103/physrevb.75.115415 |
Liu, L., Sun, Q., Wu, N., Liu, C., Ning, F., and Cai, J. (2021). Fractal analyses of the shape factor in kozeny–carman equation for hydraulic permeability in hydrate-bearing sediments. Fractals 29 (07), 2150217. doi:10.1142/s0218348x21502170 |
Liu, Y., and Yu, B. (2007). A fractal model for relative permeability of unsaturated porous media with capillary pressure effect[J]. Fractals 15 (03), 217–222. doi:10.1142/s0218348x07003617 |
Lorenz, U. J., and Zewail, A. H. (2014). Observing liquid flow in nanotubes by 4D electron microscopy. Science 344 (6191), 1496–1500. doi:10.1126/science.1253618 | |
Maali, A., Cohen-Bouhacina, T., and Kellay, H. (2008). Measurement of the slip length of water flow on graphite surface. Appl. Phys. Lett. 92 (5), 053101. doi:10.1063/1.2840717 |
Mashl, R. J., R Aluru, S. Joseph &N., Aluru, N. R., and Jakobsson, E. (2015). Anomalously immobilized Water: A new water phase induced by confinement in nanotubes. Nano Lett. 3 (5), 589–592. doi:10.1021/nl0340226 |
Matyka, M., Khalili, A., and Koza, Z. (2008). Tortuosity-porosity relation in porous media flow. Phys. Rev. E 78 (2), 026306. doi:10.1103/physreve.78.026306 | |
Nair, H. A., and Wu, P. N. (2012). Unimpeded permeation of water through helium-leak-tight graphene-based membranes[J]. Science 335 (6067), 442–444. doi:10.1126/science.1211694 | |
Raviv, U., Laurat, P., and Klein, J. (2001). Fluidity of water confined to subnanometre films. Nature 413 (6851), 51–54. doi:10.1038/35092523 | |
Roy, S., Raju, R., Chuang, H. F., Cruden, B. A., and Meyyappan, M. (2003). Modeling gas flow through microchannels and nanopores. J. Appl. Phys. 93 (8), 4870–4879. doi:10.1063/1.1559936 |
Shaat & Mohamed (2017). Viscosity of water interfaces with hydrophobic nanopores: Application to water flow in carbon nanotubes. Langmuir 33, 12814–12819. doi:10.1021/acs.langmuir.7b02752 | |
Sone, Y., Takata, S., and Ohwada, T. (1990). Numerical analysis of the plane Couette flow of a rarefied gas on the basis of the linearized Boltzmann equation for hard-sphere molecules[J]. Eur. J. Mech. B/fluids 9 (3), 273–288. doi:10.1002/ctpp.2150300611 | |
Song, W., Yao, J., Li, Y., Sun, H., Wang, D., and Yan, X. (2020). GAS–WATER relative permeabilities fractal model in dual-wettability multiscale shale porous media during injected water spontaneous imbibition and flow back process. Fractals 28 (07), 2050103. doi:10.1142/s0218348x20501030 |
Sun, X., and Ripepi, Y. Yao &N. (2018). A novel method for gas–water relative permeability measurement of coal using NMR relaxation[J]. Transp. Porous Media 124 (1), 1–18. doi:10.1007/s11242-018-1053-y |
Tan, X. H., Liu, J. Y., Li, X. P., Zhang, L. H., and Cai, J. (2015). A simulation method for permeability of porous media based on multiple fractal model. Int. J. Eng. Sci. 95, 76–84. doi:10.1016/j.ijengsci.2015.06.007 |
Tan, X. H., Li, X. P., Liu, J. Y., Zhang, G. D., and Zhang, L. H. (2014). Analysis of permeability for transient two-phase flow in fractal porous media. J. Appl. Phys. 115 (11), 113502. doi:10.1063/1.4868596 |
Thomas, J. A., and Mcgaughey, A. J. H . (2008). Reassessing fast water transport through carbon nanotubes. Nano Lett. 8 (9), 2788–2793. doi:10.1021/nl8013617 | |
Thompson, P. D., and Robbins, M. M. (1990). Origin of stick-slip motion in boundary lubrication. Science 250 (4982), 792–794. doi:10.1126/science.250.4982.792 | |
Tran, H., and Sakhaee-Pour, A. (2017). Viscosity of shale gas. Fuel 191, 87–96. doi:10.1016/j.fuel.2016.11.062 |
Tretheway, D. C., and Meinhart, C. D. (2002). Apparent fluid slip at hydrophobic microchannel walls. Phys. Fluids 14 (3), L9–L12. doi:10.1063/1.1432696 |
Vinogradova, O. I., Koynov, K., Best, A., and Feuillebois, F. (2009). Direct measurements of hydrophobic slippage using double-focus fluorescence cross-correlation. Phys. Rev. Lett. 102 (11), 118302. doi:10.1103/physrevlett.102.118302 | |
Wang, F., Jiao, L., Lian, P., and Zeng, J. (2018). Apparent gas permeability, intrinsic permeability and liquid permeability of fractal porous media: Carbonate rock study with experiments and mathematical modelling[J]. J. Petroleum ence Eng. 173. doi:10.1016/j.petrol.2018.10.095 |
Wang, F., Liu, Z., Jiao, L., Wang, C., and Guo, H. (2017). A fractal permeabily model coupling boundary-layer effect for tight oil reservoirs[J]. Fractals 25 (3), 1750042. doi:10.1142/s0218348x17500426 |
Wang, Q., and Cheng, Z. (2019). A fractal model of water transport in shale reservoirs[J]. Chem. Eng. Sci.. doi:10.1016/j.ces.2018.12.042 |
Werder, T., Walther, J. H., Jaffe, R. L., et al. (2002). Molecular dynamics simulation of contact angles of water droplets in carbon nanotubes[J]. Nano Lett. 1 (12). doi:10.1021/nl015640u |
Wheatcraft, S. W., Sharp, G. A., and Tyler, S. W. (1991). Fluid flow and solute transport in fractal heterogeneous porous media[J]. Transport processes in porous media. Editors J. Bear, and M. Y. Corapcioglu . Dordrecht: Springer Netherlands, 695–722. doi:10.1007/978-94-011-3628-0_14 |
Wu, K., Chen, Z., Li, J., Li, X., Xu, J., and Dong, X. (2017). Wettability effect on nanoconfined water flow. Proc. Natl. Acad. Sci. U. S. A. 114 (13), 3358–3363. doi:10.1073/pnas.1612608114 | |
Wu, K., Chen, Z., Li, X., Guo, C., and Wei, M. (2016). A model for multiple transport mechanisms through nanopores of shale gas reservoirs with real gas effect–adsorption-mechanic coupling. Int. J. Heat Mass Transf. 93 (2), 408–426. doi:10.1016/j.ijheatmasstransfer.2015.10.003 |
Xu, J., Chen, Z., Wu, K., Li, R., Liu, X., and Zhan, J. (2019). On the flow regime model for fast estimation of tight sandstone gas apparent permeability in high-pressure reservoirs[J].. Energy sources, Part A: Recovery, utilization, and environmental effects, 1–12. doi:10.1080/15567036.2019.1687625 |
Xu, P., Qiu, S., Yu, B., and Jiang, Z. (2013). Prediction of relative permeability in unsaturated porous media with a fractal approach. Int. J. Heat. Mass Transf. 64 (9), 829–837. doi:10.1016/j.ijheatmasstransfer.2013.05.003 |
Yang, Y., Wang, K., Zhang, L., Sun, H., Zhang, K., and Ma, J. (2019). Pore-scale simulation of shale oil flow based on pore network model. Fuel 251, 683–692. doi:10.1016/j.fuel.2019.03.083 |
Yu, B., J Li, Z. Li, and Zou, M. (2003). Permeabilities of unsaturated fractal porous media. Int. J. Multiph. Flow 29 (10), 1625–1642. doi:10.1016/s0301-9322(03)00140-x |
Yu, B., and Liu, W. (2010). Fractal analysis of permeabilities for porous media. AIChE J. 50 (1), 46–57. doi:10.1002/aic.10004 |
Yu, B., and Ping, C. (2002). A fractal permeability model for bi-dispersed porous media. Int. J. Heat. Mass Transf. 45 (14), 2983–2993. doi:10.1016/s0017-9310(02)00014-5 |
Zeng, F., Zhang, Y., Guo, J., Ren, W., Jiang, Q., and Xiang, J. (2020). Prediction of shale apparent liquid permeability based on fractal theory. Energy fuels. 34 (6), 6822–6833. doi:10.1021/acs.energyfuels.0c00318 |
Keywords: shale, two-phase flow, confined viscosity, irreducible water saturation, tortuosity effect, fractal relative permeability model
Citation: Fengxia L, Fanhui Z, Yunqi S and Yu Z (2022) A fractal relative permeability model for two-phase flow through unsaturated shale porous medium. Front. Earth Sci. 10:1009750. doi: 10.3389/feart.2022.1009750
Received: 02 August 2022; Accepted: 22 August 2022;
Published: 16 September 2022.
Edited by:
Jinze Xu, University of Calgary, CanadaReviewed by:
Wendong Wang, China University of Petroleum, Huadong, ChinaYingzhong Yuan, Chongqing University of Science and Technology, China
Copyright © 2022 Fengxia, Fanhui, Yunqi and Yu. This is an open-access article distributed under the terms of the Creative Commons Attribution License (CC BY). The use, distribution or reproduction in other forums is permitted, provided the original author(s) and the copyright owner(s) are credited and that the original publication in this journal is cited, in accordance with accepted academic practice. No use, distribution or reproduction is permitted which does not comply with these terms.
*Correspondence: Zeng Fanhui, emVuZ2Zhbmh1aTAyMzAyNEAxMjYuY29t
 Li Fengxia1,2
 Zeng Fanhui