 Peng Zang
 Yanhong Zhang1*
 Ziqi Chen
 Guanglei Hou
- 1College of Geo-exploration Science and Technology, Jilin University, Changchun, China
- 2Northeast Institute of Geography and Agriculture, Chinese Academy of Science, Changchun, China
The aboveground biomass (AGB) of withered grass is an important early-warning indicator for grassland fire risk. Most grassland fires occur during the dry-grass season. In order to improve the fire-warning efficiency of withered AGB, it is essential to rapidly acquire the amount of withered-grass biomass. Remote-sensing data has been widely used in monitoring and estimating grassland yields during the growing season. However, applying remote sensing to the estimation of withered grass is still in need of exploration. The aim of this work was to try to establish a remote-sensing estimation model for withered AGB in the dry-grass season. The estimation of aboveground biomass can effectively prevent the occurrence of fire, protect the environment, facilitate local management and reduce economic losses. Our approach was to, first, calculate a dry-grass index based on Sentinel-2 image data and using ENVI, SNAP, and ArcGIS software. Second, a model to estimate the fuel quantity during the dry-grass season was established by regression analysis combined with field-measured data. Finally, the estimation model was used to predict the amount of fuel in different months of the dry-grass season, followed by the fire-defense elements, which were quantified and mapped in the Longzhao Marsh wetlands. It was found that: 1) the two indices were significantly correlated (0.678) with the amount of fuel; 2) the established model could accurately estimate the amount of fuel in the study area during the dry season, and accurate test results demonstrated that the correlation between the estimated results of the best model and the measured values was 0.863, indicating high accuracy; 3) the spatiotemporal variation of withered grass in the study area was obviously different, and the quantities of fuel predicted for the other months were more accurate, which may reflect monthly dynamic changes in actual fuel quantities; and 4) the establishment of a remote-sensing estimation model for fuel quantity in the Longzhao Marsh during the dry-grass season could provide important parameters for fire-risk warning in the western grassland of Jilin Province and Northeast China.
1 Introduction
Grassland resources play an important role in environmental protection, animal husbandry development, ecosystem balance, and carbon sequestration (Jiaxing Huang et al., 2021; Shuqing Feng et al., 2004; Hailiang Li et al., 2009). Aboveground biomass (AGB) is a key indicator of grassland growth and can be used to evaluate the regeneration ability of grassland ecosystems (Shuqing Feng et al., 2004; Hailiang Li et al., 2009). It is also the material basis for maintaining grassland ecosystem and fire research, and one of the most basic elements of grassland fires. Trees promote grass biomass in dry season (Ivan Raniero Hernández Salmerón et al., 2022). Rapid, accurate, and large-scale monitoring of grassland AGB is of great significance in determining the rational carrying capacity of grasslands and ensuring the safety of grassland ecosystems (Tarun K et al., 2021). Grassland fires are caused by the burning of AGB during the dry-grass season (Qingqing Li et al., 2013). Grassland vegetation is the main carrier of grassland fires. As an important part of grassland vegetation, the spatial distribution and quantity of combustible matter has a major impact on grassland fires (Wenyi Yang et al., 2001). Yellow grass in the grassland is the most important fuel, being the main component of, and basis for, combustion. The amount (weight, height, and continuity) of dry grass in a grassland not only changes with space, but also changes with time (Xinghua Li et al., 2007). At the same time, the species composition of grasslands is in constant flux. Changes in all prairie fuels determine or influence prairie fires (Batu Seyin 2007). Therefore, timely and accurate acquisition of grassland AGB data during the dry-grass season is of great significance to grassland fire-warning and fire-risk assessments (Yulong Bao et al., 2012). Moreover, estimating the biomass of withered grass can facilitate the management of local relevant departments. The sustainable utilization of withered grass resources can reduce economic losses and provide a basis for ecological restoration (Yujuan Zhai et al., 2021; Ziqi Chen et al., 2021; Ziqi Chen et al., 2022; Yanhong Zhang et al., 2021).
The most-combustible components in the dry-grass season are the leaves and branches of grassland vegetation, which do not easily decompose (Shan Yu et al., 2014). The main component of grassland fuel––the grass stock––constantly changes, posing a fire risk (Yi Zhuo et al., 2010). Remote-sensing data has been widely used in monitoring and estimating grassland yields during the growing season. After years of study, scholars have made different linear combinations of the band information extracted from remote-sensing images in order to obtain various vegetation indices. Among these, the normalized difference vegetation index can best reflect changes in the fuel coverage, biomass, and leaf-area index. It is mainly used for monitoring grass yields in the peak-grass season (Jianqing Zhou et al., 2019). Compared with the remote-sensing monitoring of vegetation growth and fuel yield in the peak-grass season, due to the influence of cold winters, the remote-sensing monitoring of fuel quantity in the dry-grass season can become more or less difficult. The dry-grass season usually starts in early October of 1 year and ends in early May of the next, which is also the fire-free season. Fires mainly occur in the grassland region of North China during the dry-grass season, so it is very necessary to be able to estimate the amount of fuel available during the dry-grass season. So far, there has been little domestic or foreign research on the use of remote sensing in the dry-grass season to estimate the amount of fuel, and related research on herbaceous vegetation has mainly focused on the cold season. The dry-grass index (DGI) is determined as DGI = 1/Ch1, where Ch1 is the relationship between Moderate Resolution Imaging Spectroradiometer (MODIS) data and the reflectivity of Channel 1 in National Oceanic and Atmospheric Administration (NOAA)/Advanced Very High Resolution Radiometer (AVHRR) data. Using the DGI to monitor fuel quantity during the dry-grass season is based on the principle that the lower the vegetation coverage, the higher the reflectivity of the ground (E. Chuvieco et al., 2002; Yeneayehu Fenetahun et al., 2022; Hao Pei et al., 1995). However, some case studies have indicated that its accuracy in hay estimation is not ideal. For example, Hao Pei et al. (1995) established a relationship between NOAA/AVHRR data and pasture-quantity data obtained quasisynchronously on the ground, producing a map of dry-grass quantity for the area around Xilinhot city. Using the Xilin Gol grassland as the research area, Qingdong Cui established estimation models for herbage stock in the cold season for four grassland types––meadow grassland, typical grassland, desert grassland, and sandy vegetation––using Earth Observing System (EOS)/MODIS and ground-survey data (Qingdong Cui 2009). Based on the EOS/MODIS data of Shan Yu et al. (2014) and using regression analysis, an estimation model for fuel quantity in the dry-grass season has been established, and the fuel quantity for Inner Mongolian grassland in the dry-grass season has been calculated. In recent years, some scholars have put forward a hay fuel estimation method based on spectral reflection characteristics. One of these––Zhengxiang Zhang––used field-measured spectra to create a new hay DGI and establish a model for predicting the amount of fuel in the northeastern China grassland AGB, with the model also being applied to western Songliao; the accuracy of the calculation is relatively high (Zhengxiang Zhang 2010; Zhang et al., 2015). According to above researches, the estimation of withered grass biomass is usually based on low spatial resolution remote sensing images such as modis images, moreover the high spatial resolution remote sensing images are often used for the grassland in the growing season (Chao Liu et al., 2022; Lingxin Bu et al., 2022). The difference between grassland biomass in growing season and withered grass biomass using remote sensing methods is mainly due to the spectral reflection difference in modeling principles. Most studies use remote sensing data to model the grassland biomass in growing season, because the measured spectrum of grassland in growing season has a greater response to the bands of remote sensing images and commonly used indexes, and there is a higher correlation between grassland biomass and indexes. But it is difficult to find these characteristics in the withered grass. However, the discovery of DGI can well promote the estimation of biomass of withered grass and it is more convenient, practical and effective, which can be used for large area application of high-resolution remote sensing satellite in the estimation of withered grass biomass. Therefore, this study will use high spatial resolution remote sensing images to estimate the hay, in order to explore a new method for retrieving the amount of hay fuel. And establishing remote-sensing images with higher spatial resolutions and then calculating the hay biomass from these is a current important mission.
Determinations of the spatial distribution patterns and fuel loads of grasslands during the dry-grass season can not only be used to provide a practice basis of grassland fire safety management, soil carbon accumulation and remediation (Qixia Long et al., 2022), but can also provide a theoretical basis for fire prevention (Duwala et al., 2012; Hui Xu et al., 2015). This is of great importance for the management of grasslands and the formulation of fire-prevention measures (Shirong Chen et al., 2006). In this study, based on high-resolution Sentinel-2 data as the data source and results from previous studies, two kinds of fuel index were calculated, and a remote-sensing estimation model was established. This was done in combination with measured ground data in order to calculate the spatial variations in fuel quantity in the Longzhao Marsh during the dry-grass season, and in order to provide theoretical guidance and a scientific basis for local grassland fire prevention and soil carbon remediation. The study can promote the application of Sentinel-2 with high resolution in the estimation of large-scale grassland AGB, and provide methods and data support for the relevant departments in the study area to reasonably determine the balance of grass and livestock and use grassland resources.
2 Materials and methods
2.1 Overview of the study area
The study area was located in the ecological barrier area in western Northeast China (see Figure 1), within the area defined by 45°00′–45°28′N and 123°15′–124°13′E. The hydrological system comprised one main stream and two tributaries––the Taoer and Huolin Rivers. The abundant water resources in the area have resulted in a series of small brackish-water lakes and a brackish-water marsh. The rich river, lake, marsh, and marsh-meadow ecosystems in the region have given rise to high regional biodiversity. According to incomplete investigations and statistics, there are 239 species of plants in the Longzhao Marsh, belonging to 39 families and 132 genera. The vegetation mainly includes Suaeda salsa community, Artemisia alkali community, Phragmites australis community and Cyperus sedge community. The former two are typical salt-marsh communities, embedded in grasslands, meadows, and marshes, and widely distributed across this area. Suaeda salsa was the dominant species in those two communities, accompanied by Artemisia suaeda, Swertia hydropiper, Polygonum polygonum, and Sibiricum plantarum. Reed and sedge communities occurred in shallow water and around marshes. The dominant species in these was Phragmites communis, accompanied by cattails and small rushes. The dominant species in the sedge community was sedge, accompanied by shallots and Scirpus mariqueter. The dominant natural vegetation provides important habitats for a wide variety of animal populations, rich in 164 species––mainly birds, mammals, amphibians, reptiles, and fish. Abundant animal and plant resources and high quality ecosystems mean that this region has an important position in the ecological strategy of western Northeast China.
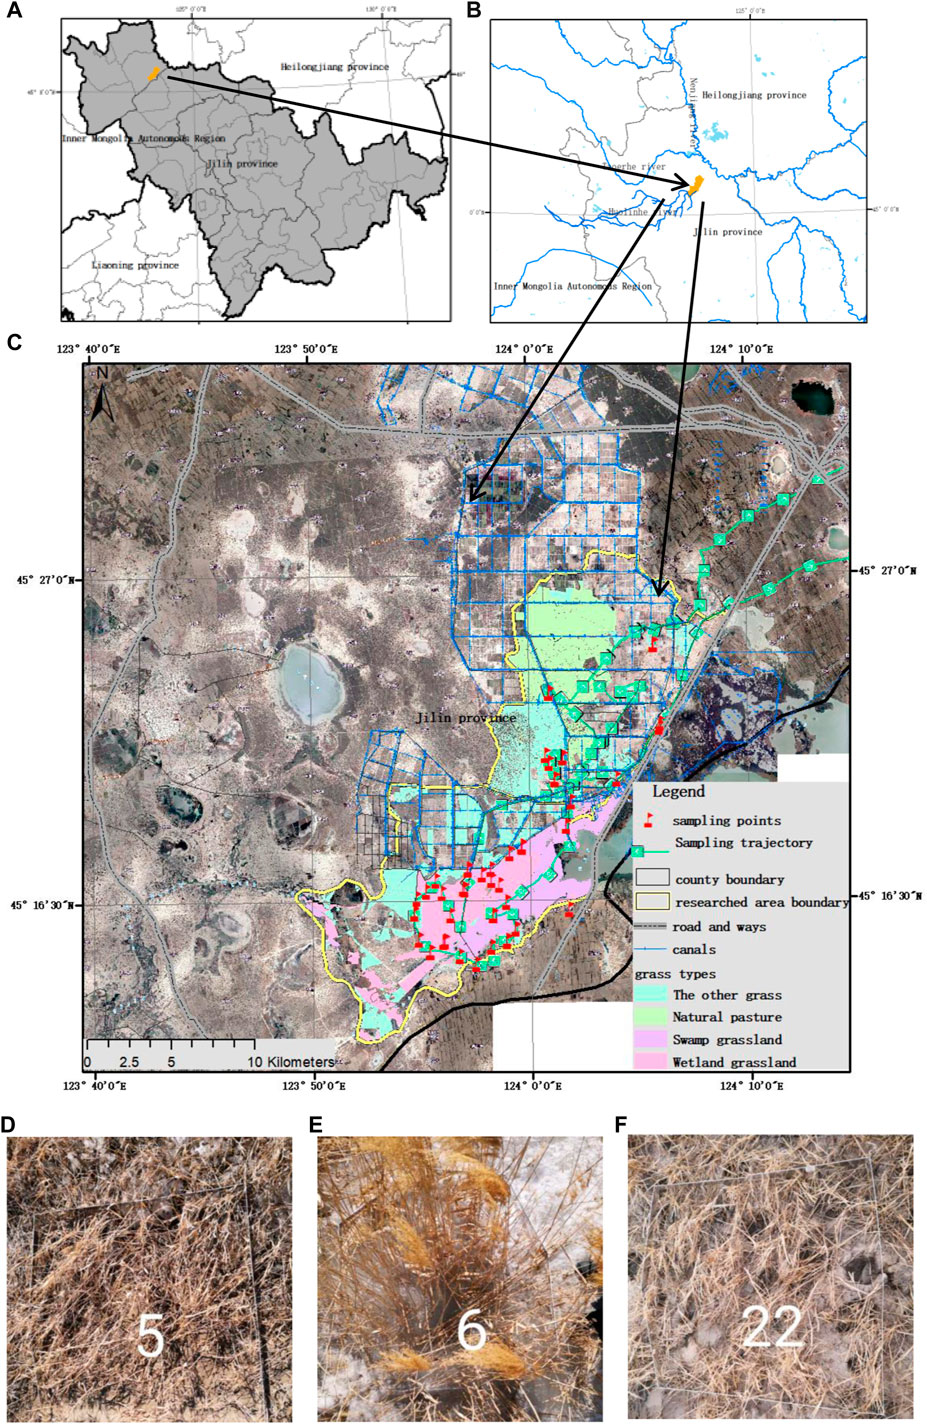
FIGURE 1. Schematic diagrams (A,B) and satellite images (C–F) showing the location of the study area and sampling points.
2.2 Data collection and processing
2.2.1 Sample plot selection and pretreatment
At total of 58 sample sites were set up in the study area in November 2019 and March 2020 based on geomorphic type and vegetation community. The different vegetation types included Suaeda suaeda, Phragmites australis, and sedge communities. Three 1 × 1-m subplots were set up in each sample plot. The locations––longitude and latitude, altitude, plant community composition, height, coverage, and frequency––of each sample site were recorded with the aid of the Global Positioning System (GPS). The location of the study area and the distribution of the sampling points are shown in Figure 1. The AGB harvesting method (Bingru Zhao et al., 2004; Qingdong Cui et al., 2009) was used to obtain direct measurements. The plots were mowed uniformly and the samples taken inside for natural air-drying in order to determine the quantity after finding the constant weight (involving several weighings). The weight of hay (i.e., the measured amount of fuel) was obtained for each sample.
2.2.2 Image data source and preprocessing
Data was accessed via the European Space Agency’s (ESA’s) Copernicus data center website (https://scihub.copernicus.eu/dhus/). Surface reflectance products from the multi-temporal Sentinel-2B remote-sensing image were obtained. This is the only optical satellite with more than three red-edge bands (Yihan Pu et al., 2021). The wavelength distributions and spatial resolutions of the bands are provided in Table 1. Because Northeast China is completely covered in snow in December through February, continuous-time images were not selected. For this work, images from March 2020 that were consistent with the measured data from the ground were selected for modeling. Other data, reflecting changes in the quantity of fuel during the dry-grass season, were selected for predicting the amount of dry grass, including one scene image each from September, October, and November 2019 and one from April and May 2020 (see Table 2). For the downloaded images, first, we made radiometric calibration and atmospheric corrections (Fugen Jiang et al., 2021) using the Sen2cor tool in the Sentinel-2 software toolbox provided by the ESA. Then we applied SNAP software to resample the image at a 10-m spatial resolution for each pixel from a 20-m spatial resolution.
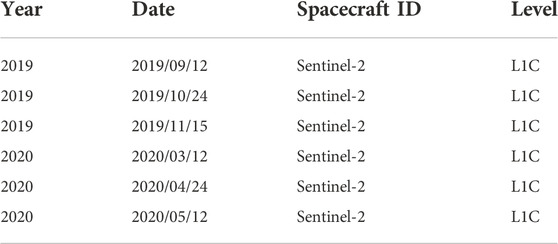
TABLE 1. Description of downloaded Sentinel-2 image data.
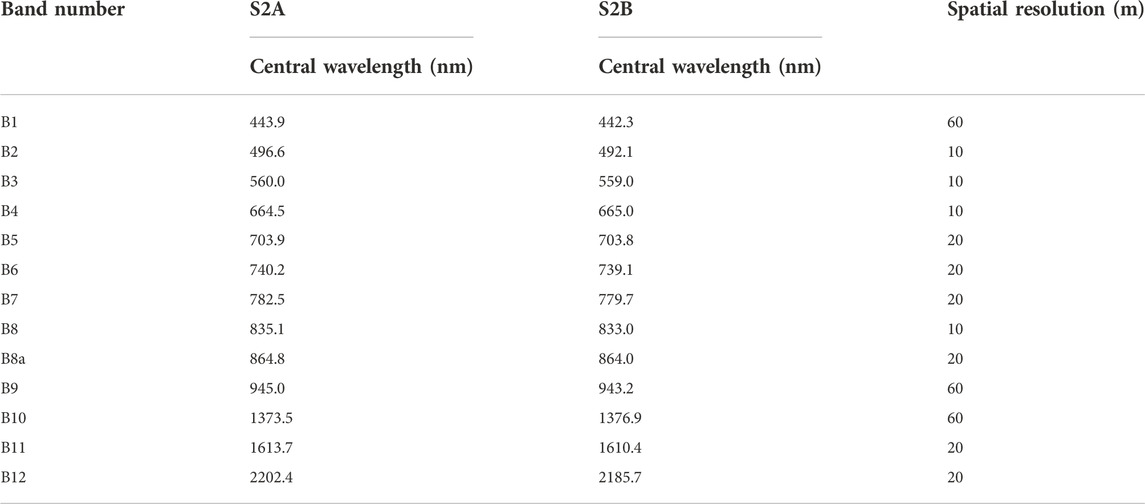
TABLE 2. Description of Sentinel-2 band information.
2.2.3 Calculation of the dry-grass index
The reflectance curves for soil and the subsoil are obviously different, with the reflectance of the subsoil layer being lower than that of soil in the visible and near-infrared bands. The reflectance differs with the amount of subsoil on the surface of the ground, with the reflectance reaching a maximum when the ground is completely bare and a minimum when the ground is completely covered by withered grass. When the ground is covered by subsoil, the reflectance is between the maximum and the minimum. The field spectroscopic measurements showed significant differences between the fuel spectra in these bands. In the short-wave infrared imagery bands (Zhengxiang Zhang 2010), the dominant features of all the reflectance spectra were two water-absorption bands, centered at 1,400 and 1,900 nm, and one reflection peak at 1,650 nm. In the 2,100-nm band, associated with cellulose and lignin, there was a significant absorption feature in the spectra of the dry-grass fuels. This feature was not visible in the soil spectrum. However, the contrast between the reflection peak and the absorption trough was marked. Based on variations in the spectral curve characteristics of the different vegetation types and the soil during the dry-grass season, and with reference to the dry-grass inversion model based on the other satellite images that the relevant MODIS data was based on (Zhenyu Xu et al., 2020; Suying Li et al., 2007), the 1,600-nm band represented a stable reflection peak in the spectral curve of the dry-grass fuel, and 2,100 nm represented the absorption characteristics of lignin and cellulose. In the short-wave infrared region of the electromagnetic spectrum, absorption characteristics associated with cellulose and lignin are usually observed at 2,100 nm in the subsoil spectrum (Zhengxiang Zhang 2010; Zhang et al., 2015). This absorption characteristic does not occur in the soil spectrum. This observation provided the basis for distinguishing dry grass from soil. Because the withered grass has a stable reflection peak at 1600 nm on its reflection spectrum curve, and has lignin absorption and cellulose absorption characteristics at 2100 nm, the B4, B11, B12 bands of the high-resolution remote sensing image Sentinel-2 data can be used to distinguish the withered grass, soil and other surface objects. And the index established between the bands should have a greater response to the biomass of withered grass. Therefore, the dry-grass fuel indices (DGI1 and DGI2), based on Sentinel-2 bands 4, 11, and 12, were significantly correlated with the field measurements of dry-grass fuel quality, and the contrast between the reflection peak and absorption trough was significant. From this, we progressed to determining DGI1 and DGI2 in order to calculate the amount of fuel in the withering-grass season. The specific calculations are as follows:
where B4 is the reflectance of the red band of the Sentinel-2 data, and B11 and B12 are the reflectances of the short-wave infrared band of the Sentinel-2 data.
2.2.4 Evaluation of the accuracy of the calculation
Based on the coordinates of the field survey quadrats, the straw index values of the corresponding pixels were extracted in order to generate datasets for the dry-weight biomass of the grassland. Then, correlation models for the dry weight biomass of the grassland and each straw index were established. Of the 58 measured samples, 45 were selected for establishing the model, while the remaining 13 were used to verify the model. Because the RMSE and R2 are popular in various model evaluations, and the fitting effect is good. The accuracy of the model was evaluated using the root mean square error (RMSE) and coefficient of determination (R2) (Jiaxing Huang et al., 2021; Zhang 2021). In order to make full use of the samples to improve the reliability of the model, the keep-one-cross method was used to verify the estimation results––that is, only one sample site was left as the test set each time, with the other sample sites being used as the training set. The final estimation results were determined after n repeated times (Qingdong Cui et al., 2009). The accuracy of the models were assessed using the R2 and total RMSE values. The formula for calculating the accuracy of the evaluation index is as follows:
where,
The smaller the RMSE, the better the fitting effect. The R2 represented the degree of fitting between the predicted and measured values of the trend line of the regression analysis. When the R2 trend line approached 1, the reliability was higher.
3 Results and analysis
3.1 Construction of the fuel quantity estimation model
Statistical analysis software was used to generate scatter plots of the DGI1 and DGI2 values for all the samples and the measured quantities of combustible matter in the grassland (see Figure 2). According to the scatter plots in Figure 2, there was a significant correlation between the two groups of data.
FIGURE 2. Scatter plots showing the amount of combustibles and the DGI values for construction of the dry-grass biomass model.
The two types of DGI values for all the samples used in the modeling were statistically analyzed, and the correlation between the grassland-fuel field data and the same quasisynchronous DGI was analyzed using SPSS software (Yingzhong Ma et al., 2012). Table 3 provides the correlation between the measured data and the calculated DGI based on Sentinel-2 data.
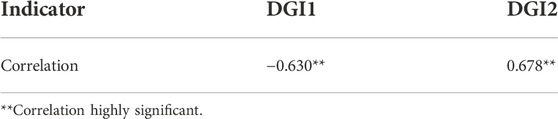
TABLE 3. Correlation between the dry weight of the combustible matter and the subsoil index derived from the Sentinel-2 remote-sensing data.
According to the statistical results, there was a correlation between the Sentinel-2B remote-sensing data and the measured data. The correlation was significant at the test level of 0.01, and the absolute value of the correlation coefficient was greater than 0.6. Therefore, based on the Sentinel-2B remote-sensing data, an estimation model for the dry season was established and can be used to calculate fuel quantity. By comparison, the DGI2 had a higher correlation with the actual fuel measurements.
A regression model for estimating fuel quantity and two kinds of DGI was established using SPSS statistical software. In this study, six models––unary linear regression, quadratic curve, cubic curve, logarithm, exponential, and power function––were set up, and all the established models passed the significance test (see Table 4).
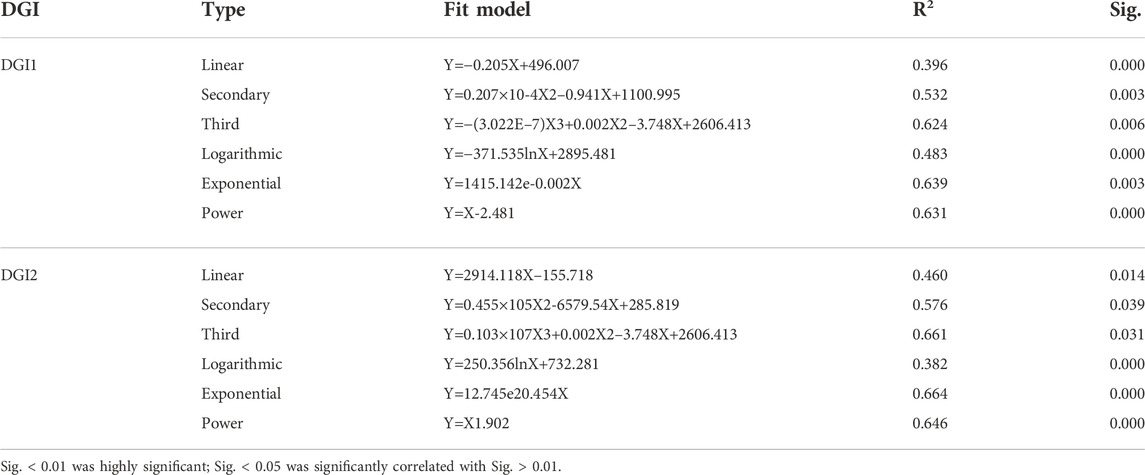
TABLE 4. Model for estimating the amount of combustible matter during the dead-grass season.
The correlation coefficient and significance of each model in Table 4 showed that all the models established based on the two types of subsoil index were significantly correlated. Except for the cubic curve and logarithmic models, all the other R2 values for the index model constructed using DGI2 were greater than for the model constructed using DGI1. The fitting degree of the exponential model based on DGI1 was the best, with R2 = 0.639. The exponential model based on DGI2 also had the best-fitting degree, with R2 =0.664, which was the highest among all the models.
Therefore, according to the significance of the model and the comparison of the fitting degree of R2, the exponential model constructed using DGI1 and DGI2 can be used to estimate and calculate fuel quantities during the dry-grass season.
3.2 Evaluation of model accuracy
The 13 reserved randomly selected independent samples were used for model evaluation (Deng Pan 2017). Based on the two exponential models selected above, the correlation and RMSE between the actual measurements and estimations of fuel quantities were calculated using the cross-validation method to evaluate the model’s accuracy. The accuracy evaluations of the two models are shown in Figures 3, 4. It can be seen from Figure 3 that the two DGI values of the samples used for verification were exponentially correlated with the actual fuel measurement, and can be used to verify the accuracy of the previously selected exponential model. As can be seen from the evaluation results in Figure 4, the correlation coefficient between the estimated measurement and the measured value established by the exponential model based on DGI1 was 0.777, whereas the correlation coefficient between the estimated measurement and the measured value established by the exponential model based on DGI2 was 0.863, with significant correlation, with the R2 being 0.604 and 0.745, respectively. The RMSEs were 43.316 and 32.771 g/m2, respectively, and the model’s accuracy was 63% and 82%, respectively.
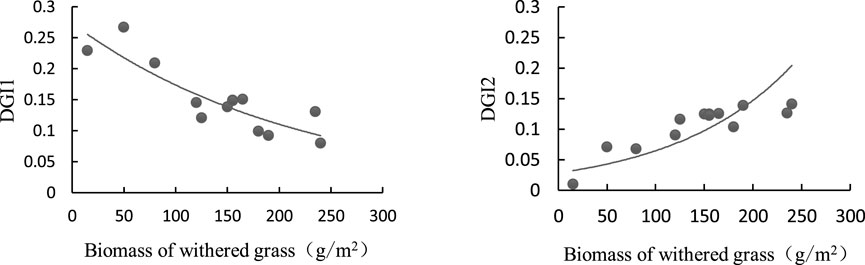
FIGURE 3. Correlations between the field-measured AGB data and the DGI index.
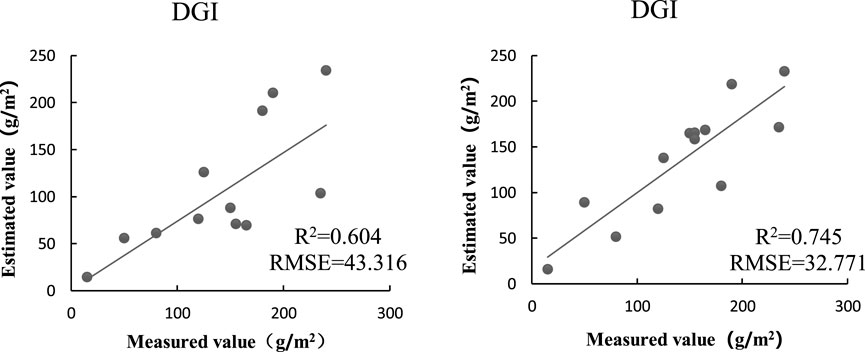
FIGURE 4. Correlations between the field-measured AGB data and the estimated values based on the DGI1 and DGI2 indices.
By comparison, based on the DGI1 exponential model, the simulation effect was mediocre, whereas the DGI2-based exponential model simulation effect was better. The correlation between the estimated and the measured values was high, and the relative minimum RMSE and model precision were the highest. So, this was chosen as the best option and the best model for calculating the amount of fuel in the dry grass in the study area.
3.3 Variation in the spatial characteristics of fuel quantity during the dry-grass season
The exponential model from DGI2 was used to calculate the amount of dry-grass fuel in September, October, and November 2019, and March, April, and May 2020 in the study area. The amount of dry-grass fuel and its spatial distribution are shown in Figure 5. As the map color gets darker, the number of grams of fuel per square meter goes from low to high (Qingqing Li et al., 2013). As can be seen from the spatial distribution of combustible matter in each month (Figure 5), there were significant differences across in the study area. In Figure 5, the aboveground biomass of grassland was the largest in October, and decreased in other months. The biological quantity value in the white area is the lowest, being mainly covered by a water body, roads, residential zones, etc. The biomass of the area near Chagan Lake was higher in the southeast, which is dominated by wetland grasslands and swamp grasslands. The biomass was higher in most parts of the north and lower in saline–alkali land and paddy fields. The central and southwestern regions had less biomass, lower grassland density, and more saline land. The results showed that the aboveground biomass of grassland in the Longzhao Marsh increased gradually from southwest to northeast. Except in April and May, the aboveground biomass of grassland in northeast was generally above 200 g/m2, which was significantly better than that in southwest. And the AGB of different grassland types varies greatly. In order to fully understand the cumulative difference in the combustibility of different vegetation types, including swamp grassland, wetland grassland, natural grassland, and other grasslands, all of which were included in the visual interpretation of the corresponding Sentinel-2B image, and based on the spatial distribution of combustible materials in each month, the combustibility of the four main vegetation types was calculated, as shown in Figure 6. In Figure 6, the grading of the biomass corresponds to the calculated map grade for the subsoil biomass. Levels 1–5 in the figure correspond to the biomass being less than 100, 100–300, 300–500, 500–700, and more than 700 g/m2, respectively. From the statistical bar chart, across the entire study area, regardless of grassland type, most of the grassland biomass fell into Grades 1 and 2, indicating that the withered-grass biomass of various grassland types in the study area was relatively small, being mainly less than 100 and 100–300 g/m2––equivalent to low coverage grassland. In particular, the less-than-100-g/m2 type dominated, followed by 100–300 g/m2. This challenges the protection of the western ecological barrier area.
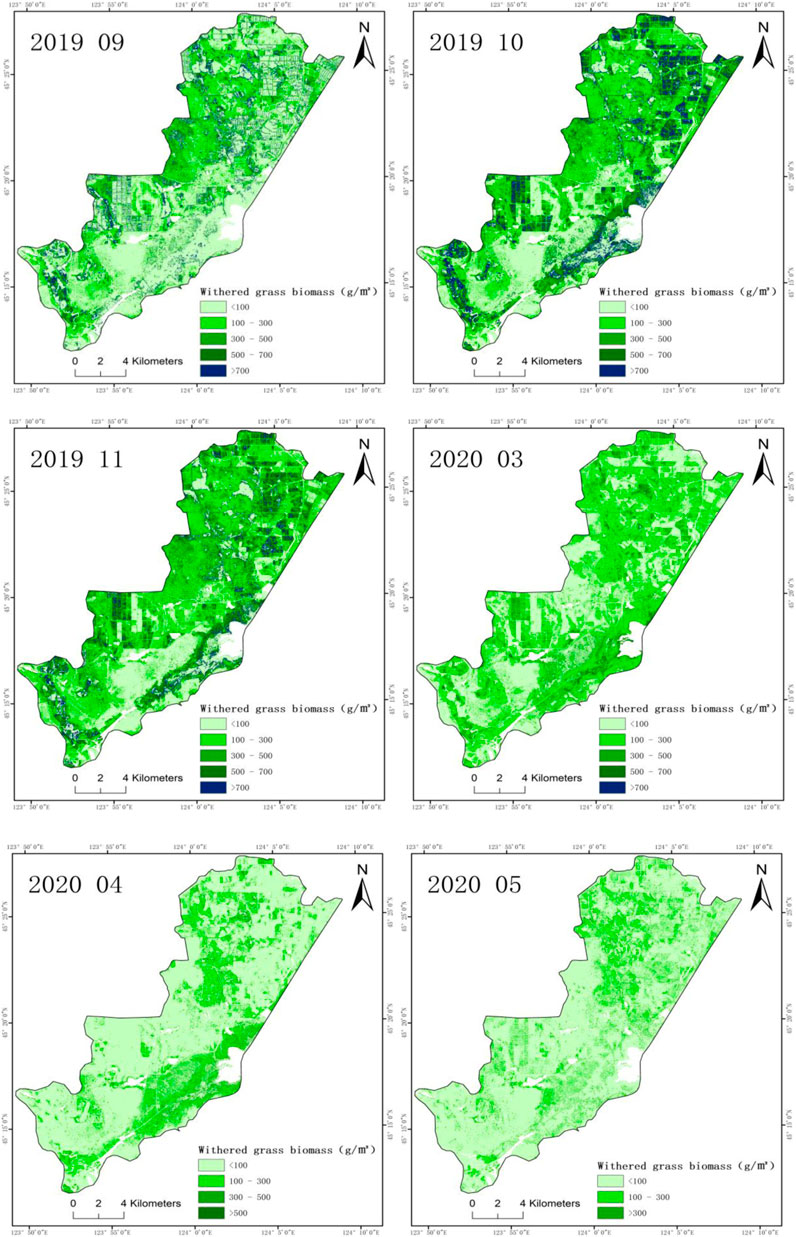
FIGURE 5. Spatial distribution of the dry-grass biomass.
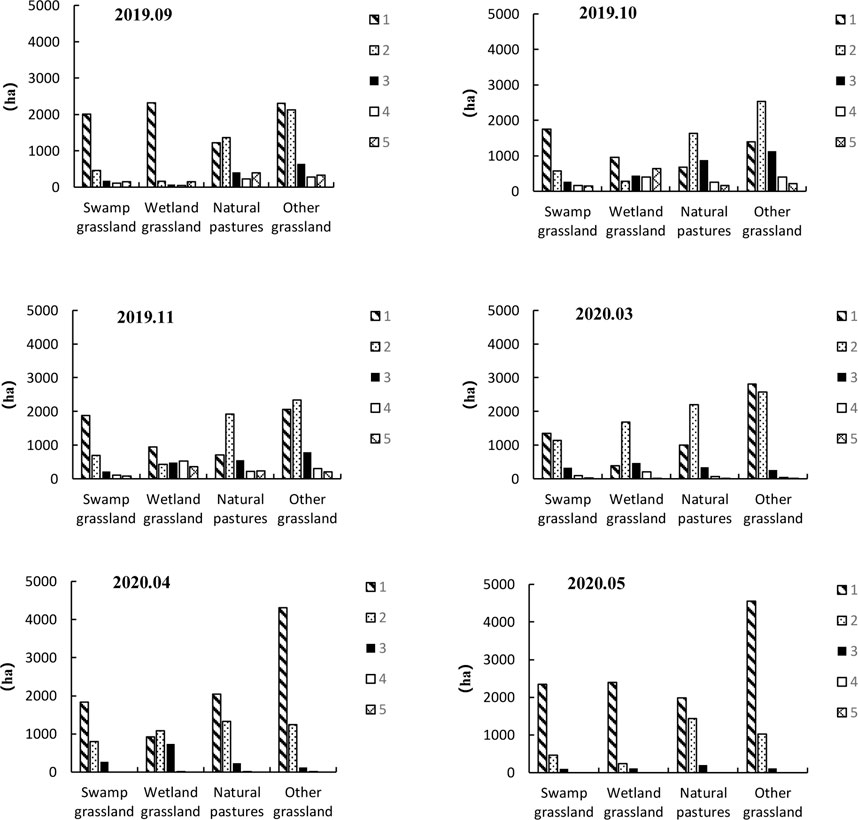
FIGURE 6. Monthly dynamic distributions showing the quantity of combustible grassland.
3.4 Dynamic temporal changes in fuel quantity during the dry-grass season
In order to explore the seasonal cumulative variation in fuel in the study area, based on calculations of the monthly fuel quantity and on the monthly dynamic distribution map of fuel quantity for the dry-grass season as shown in Figure 7A, the average value of available fuel per square meter was calculated and a curve showing the change in fuel quantity during the dry-grass season was drawn, as shown in Figure 7B. The average fuel volumes for the 6 months from October 2019 to May 2020 were 203.8, 285.7, 263.7, 155.6, 90.5, and 70.2 g/m2, respectively. Using the area for September as the base, the ratio of the quantity for each subsequent month to the previous quantity was used as the fuel accumulation rate, as shown in Figure 7B. As can be seen from Figure 7A, the amount of fuel in the study area during the dry-grass season decreased month by month, changing significantly––that is, the amount of fuel present in October 2019 was the highest, and the amount in May 2020 was the lowest. The amount of fuel in March 2020 was significantly less than in November 2019, while the amount of fuel in April and May 2020 was significantly less than in March. It can also be seen from the average values for each month that the fuel stock had a decreasing trend, which is consistent with the change in fuel quantity in the actual dry-grass season. Note that the dry-grass AGB reached its maximum value in October, not the entire AGB of the grassland.
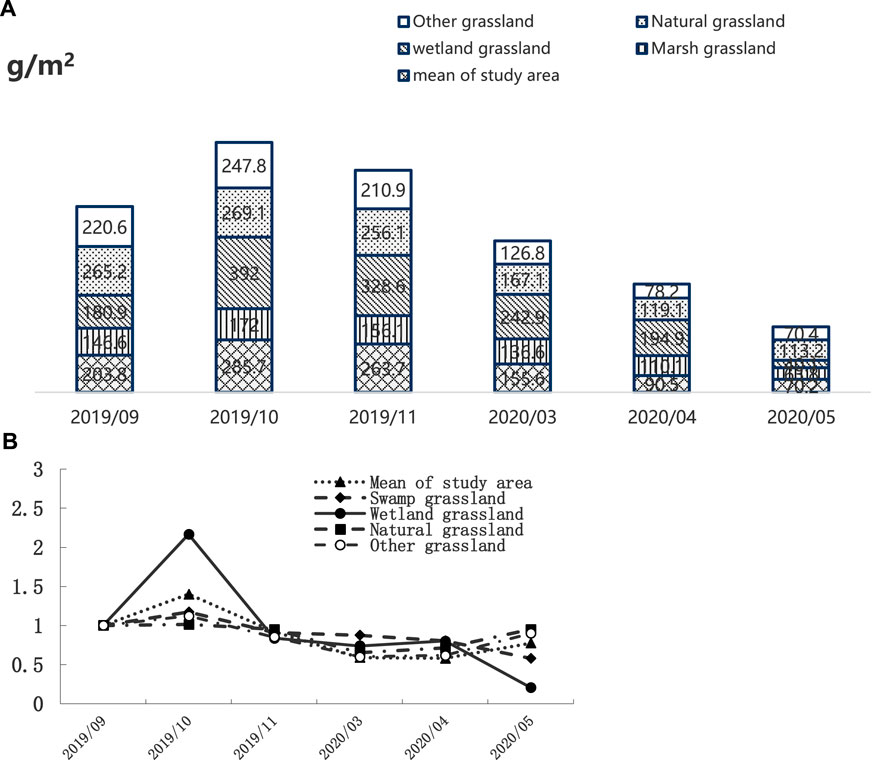
FIGURE 7. Monthly dynamic distribution chart (A) and variation curves (B) showing the amount of combustible matter in the dry season.
4 Discussion
The challenges involved in calculating remotely sensed grass AGB include a lack of effective and stable calculation models based on spectral indices from remote-sensing images that could be used to rapidly and accurately discriminate between grassland and acquire the state and quantity of grassland. Given the improvements required in various applications and the rapid development of high-resolution remote-sensing technology, the extraction and calculation of high-quality remote-sensing information is particularly urgent (Jinlong Gao et al., 2019). In this regard, the aim of this study was to establish an effective model for estimating the biomass of dry grass based on new and high-resolution images from Sentinel-2B. Furthermore, the application of this model to the inversion of withered grass biomass can provide theoretical guidance and scientific basis for local grassland fire prevention, and this study can promote the application of high-resolution Sentinel-2 in the estimation of AGB of large grassland.
4.1 Advantages of using DGI2
In this work, two kinds of DGI were constructed from the Sentinel-2B image, and the calculation model was established using field-measured hay biomass data for the corresponding period. After evaluating the accuracy, the exponential model based on DGI2 had the best fitting effect, with R2 = 0.664, and this was used to calculate the dry-grass biomass for different seasons across the research area. In addition, the spatial and temporal changes in the dry-grass biomass were explored. The significance of this study is that the rapid retrieval of biomass data from small and medium-scale grasslands can be achieved using Sentinel-2B remote-sensing images with high spatial resolution, and which are freely available for use. Compared with the grassland biomass calculation model based on hyperspectral field measurement data (Zhengxiang Zhang 2010; Jinlong Gao et al., 2019), the accuracy of the calculation model, based on an index obtained from images, may not be better (Weize Song et al., 2014; Y Zhang et al., 2019), but this method more convenient, practical, and efficient. Moreover, the construction of DGI index can also provide some theoretical support and reference for the research on the inversion of withered grass biomass with high spatial resolution remote sensing data.
4.2 Further improvements in the number and spatial distribution of sampling points
Different grassland types can be predicted for the AGB by applying the calculation model based on field sampling. According to the reference, the model’s precision is affected by the field sampling, including the spatial distribution and number of sampling points (Sucharita Pradhan et al., 2021). The terrain of the study area was flat, so evenly distributed sampling points was helpful in improving the model’s accuracy, while the principle of mathematical modeling indicates that a sufficient number of sample points is also be beneficial. So, enough spatially well-distributed field sampling points should be used in such studies. Further study of the grassland AGB in this region would be of great use for better understanding vegetation protection and fire-risk warning signs. In a more in-depth study, it would be useful to devise a better form of DGI (Hao Pei et al., 1995), in order to establish a more-representative and accurate monitoring model based on more field-measurement and remote-sensing data, and also to obtain a better understanding of the impact of terrain and other environmental factors (Qingqing Li et al., 2013; Shan Yu et al., 2014).
4.3 Improvement of spatiotemporal inconsistencies
There is a spatial inconsistency between the sampling plots of 1 x 1 m and the DGI pixel of 10 x 10 m, the latter obviously being significantly larger. This large disparity inevitably produces modeling errors (Sucharita Pradhan et al., 2021). Also, in the field, the sample plots were set up in relatively homogenous places, but this choice bias has led to errors in some heterogeneous regions (Shaoqin Yang et al., 2022). In the process of constructing the biomass calculation model, the accuracy was greatly affected by the location and quantity of the hay index value extracted from the image. In order to improve the accuracy of the biomass calculation model, so it better corresponds with the measured field data from GPS-located sample points, the location value could be gradually expanded on the image when the correlation coefficient has reached the maximum value.
There is no absolute synchronization in time between the sampling plots and the remote-sensing image, which will inevitably lead to uncertainty in the calculation model. To address this, we acquired data via the DGI, with data from the sampling sites coming from the same period, as far as possible, and this may have reduced the error in the model simulation to some extent. However, the number of AGB samples in this experiment was still insufficient. In the future, the number of sampling points should be appropriately increased to further improve the accuracy of the calculation model (Lati R.N et al., 2011; Unmesh Khati et al., 2021; Martin Paar et al., 2021).
5 Conclusion
Based on the need for a rapid and accurate remote-sensing model for estimating dry-grass AGB, and using field-measured AGB data from the Longzhao Marsh wetland in Da’an and applying ENVI, SNAP, and ArcGIS software, we established correlations between the AGB and two types of DGI. The two indices were significantly correlated (0.678) with the amount of dry-grass fuel. Six models of DGI fitting, based on Sentinel-2 remote-sensing data, were compared, and the optimal model was used to calculate and define the spatial distribution of the grass subsoil biomass across the study area. It was found that there was a significant correlation between the measured dry AGB and the selected grass indices. The best model had a high calculation accuracy, with the fuel estimation models reaching the standard of macroscopic monitoring, the correlation between the calculated results for the best model and the measured values being 0.863. Therefore, the model for estimating grassland biomass by remote-sensing based on the DGI is feasible. According to the calculation, the fuel content in the Longzhao Marsh had a decreasing trend during the entire dry-grass season, and the decreasing trend was from October to May. Spatially, this equated to a decreasing trend from the northeast to southwest. These findings may provide a scientific reference for the early warning of grassland fires in western Jilin province, facilitate the management of grassland resources by local departments and promote economic development.
Due to the long, cold dry periods that affect the study area, it is difficult to collect field data, and so a model for estimating fuel quantitities would be enhanced by plenty of ground data. Calculations from the remote-sensing image using the model would also be affected by snow cover. In order to improve the accuracy of the estimation model of withered grass biomass and make it better correspond to the measurement data of gps positioning sampling points, the position value can be gradually expanded on the image when the correlation coefficient reaches the maximum value. The most important thing is to increase the number of ground sampling points and the location distribution of sampling points to find classical distribution points as far as possible to improve the accuracy of the estimation model. In future research, it is necessary to build a better DGI, so as to build a more representative and accurate monitoring model based on more field measurements and remote sensing data, and refer to more topographic and other environmental factors to eliminate errors.
Data availability statementt
The original contributions presented in the study are included in the article/Supplementary Material, further inquiries can be directed to the corresponding author:emFuZ3BlbmcxMTA5QDE2My5jb20=.
Author contributions
PZ and YZ designed the paper and wrote the manuscript. ZC, XL and ZL revised the paper. YZ, GH, and PZ contributed to the data.
Funding
This research was funded by the National Key Research and Development Program of China (Project No. 2021YFD1500104-3), and the Strategic Priority Research Program of the Chinese Academy of Sciences (Grant No. XDA28110503).
Acknowledgments
First, thanks are given to the Remote-sensing Unit of the Changguang Satellite Technology Co. Ltd., Changchun, for providing the remote-sensing images and processing workshop. We would also like to thank the Gobi Energy Co. Ltd. for providing guidance in the sample site investigation. Third, thanks go to the Wetland Center, Northeast Institute of Geography and Agroecology, Chinese Academy of Sciences for identifying the wetland plants and plant types. Lastly, we would like to thank the editor and the reviewers for their careful work and thoughtful suggestions, all of which having improved this paper substantially.
Conflict of interest
The authors declare that the research was conducted in the absence of any commercial or financial relationships that could be construed as a potential conflict of interest.
Publisher’s note
All claims expressed in this article are solely those of the authors and do not necessarily represent those of their affiliated organizations, or those of the publisher, the editors and the reviewers. Any product that may be evaluated in this article, or claim that may be made by its manufacturer, is not guaranteed or endorsed by the publisher.
References
Bao, Yulong, Zhang, Jiquan, Liu, Xingpeng, Chen, Peng, Liu, Xiaojing, Zhang, Qi, et al. 2012. Identification of grassland combustibles and estimation of hay content based on hyperspectral remote sensing [C]. Proceedings of the Innovative theoryof risk analysis and crisis response and Methods-Proceedings of the FifthAnnual Meeting of the Risk Analysis Professional Committee of China Disaster Prevention Association, Nanjing, China: Atlantis Press, 127–131.
Bu, Lingxin, Lai, Quan, and Liu, Xinyi. 2022. Study on the adaptability of different machine learning algorithms in grassland biomass estimation [J] Acta Agrestia Sin.: 1–12. http://kns.cnki.net/kcms/detail/11.3362.S.20220922.1407.002.html
Chen, Shirong. 2006. Research on remote sensing monitoring and early warning method of grassland fire [D]. Graduate School of Chinese Academy of Sciences (Remote Sensing Application Institute).Beijing China
Chen, Ziqi, and Zhang, Yanhong (2022). Quantitative identification of temporal-spatial variations of urban heat island (UHI) effects in Changchun, China. IEEE J. Sel. Top. Appl. Earth Obs. Remote Sens. 15, 3052–3060. doi:10.1109/JSTARS.2022.3167831
Chen, Ziqi, Zhang, Yanhong, Wang, Yongjie, and Ye, Li. 2021. Spatial variation and threshold analysis of the urban wetland cooling effect-a case study of Changchun city[J]. IOP Conf. Ser. Earth Environ. Sci., 660(1):012136, doi:10.1088/1755-1315/660/1/012136
Chuvieco, E., Riano, D., Aguado, I., and Cocero, D. 2002. Estimation of fuel moisture content from multitemporal analysis of landsat thematic mapper reflectance data: Applications in fire danger assessment[J]. Int. J. Remote Sens., 23, 2145, 2162, doi:10.1080/0143116011006981811).
Cui, Qingdong, Liu, Guixiang, and Yi, Zhuo. 2009. Dynamic research on theconservation rate of pasture in Xilin Gol grassland in cold season [J]. Chin. J. Grassl., 31(01): 102–108. https://kns.cnki.net/kcms/detail/detail.aspx?FileName=ZGCD200901019&DbName=CJFQ2009
Cui, Qingdong. 2009. Research on the estimation technology of forage stock in natural grassland in cold season [D]. Chinese Academy of Agricultural Sciences.Beijing.
Deng, Pan. 2017. Research on the spatial distribution and potential fire behavior of combustibles in typical plantation forests in South subtropics[D]. Central South University of Forestry and Technology.China.
Duwala, Guixiang Liu, Shan, Yu, and Li, Qingqing. 2012. Research on short-termforecast of fire danger level in Inner Mongolia grassland [J]. Chin. J. Grassl., 34(04): 87–92, doi:10.3969/j.issn.1673-5021.2012.04.015
Fenetahun, Yeneayehu, Yuan, Y., Xu, X. W., and Wang, Y. D. 2022. Borana rangeland of southern Ethiopia: Estimating biomass production and carrying capacity using field and remote sensing data[J]. Plant Divers., 2468–2659, doi:10.1016/j.pld.2022.03.003
Feng, Shuqing, Liu, Qingchun, Jin, Yi'an, and Zhang, Juan. 2004. Research on forage yield monitoring using EOS/MODIS [J]. Qinghai Prataculture, (03):6–10, doi:10.3969/j.issn.1008-1445.2004.03.002
Ivan Raniero Hernández Salmerón Holmgren, Milena. 2022. Global meta-analysis: Sparse tree cover increases grass biomass in dry pastures[J]. Front. Environ. Sci., 10, doi:10.3389/fenvs.2022.949185
Huang, Jiaxing, Wu, Jing, Li, Chunbin, Qin, Gexia, Qian, Juanbing, and Li, Huaihai. 2021. Remote sensing inversion of aboveground biomass of grassland in Tianzhu County based on Sentinel-2 and Landsat 8 data [J]. Acta Agrestia Sin., 29(09):2023–2030.doi:10.1016/j.ecolind.2020.107215
Jiang, Fugen, Sun, Hua, Li, Chengjie, Ma, Kaisen, Chen, Song, Long, Jiangping, et al. 2021. Combined GF-6 and Sentinel-2 red-edge band inversion of forest aboveground biomass [J]. Acta Ecol. Sin., 41(20): 8222–8236.
Jinlong Gao, Baoping Meng, Liang, Tiangang, Feng, Qisheng, Ge, Jing, Yin, Jianpeng, Wu, Caixia, et al. (2019). Modeling alpine grassland forage phosphorus based on hyperspectral remote sensing and a multi-factor machine learning algorithm in the east of Tibetan Plateau, China. ISPRS J. Photogrammetry Remote Sens. 147, 104–117. doi:10.1016/j.isprsjprs.2018.11.015
Khati, Unmesh, Lavalle, Marco, and Singh, Gulab. 2021. The role of time-series L-band SAR and GEDI in mapping sub-tropical above-ground biomass[J]. Front. Earth Sci. (Lausanne)., 9, doi:10.3389/feart.2021.752254
Lati, R. N., Filin, S., and Eizenberg, H. (2011). Robust methods for measurement of leaf-cover area and biomass from image data. Weed Sci. 59 (2), 276–284. doi:10.1614/ws-d-10-00054.1
Li, Hailiang, and Zhao, Jun. 2009. Principles and methods of grassland remote sensing yield estimation[J]. Pratacultural Sci., 26(03) 34–38.
Li, Qingqing, Liu, Guixiang, Duwala, Sachula, Chen, Xiaofei, Yun, Xiangjun, and Hasbagen, .2013. Remote sensing monitoring of combustible matter in hay season in Ujimqin grassland[J]. Chin. J. Grassl., 35(02 ): 64–68, doi:10.3969/j.issn.1673-5021.2013.02.012
Li, Suying, Li, Xiaobing, Ge, Ying, and Fu, Na. 2007. Biomass model of typical grassland area based on vegetation index: An example of Xilinhot city, inner Mongolia [J]. Chin. J. Plant Ecol., 31(01):23–31, doi:10.17521/cjpe.2007.0004
Li, Xinghua. 2007. Research on fire law and early warning of forest and grassland in northeastern Inner Mongolia [D]. Chinese Academy of Agricultural Sciences.Beijing China.
Liu, Chao, Li, Ping, Wu, Yuntao, Pan, Shengnan, Zhou, Jia, and Liu, Lingli. 2022. An estimation method of grassland aboveground biomass based on digital camera images and community canopy structure survey [J] Chin. J. Plant Ecol.: 1–9 http://kns.cnki.net/kcms/detail/11.3397.Q.20221013.1623.010.html
Long, Qixia, Lan, Jiacheng, and Jiang, Yongxiang. 2022. The impact of ecological restoration on the accumulation characteristics and mechanism of soil organic carbon in rocky desertification areas [J]. Acta Ecol. Sin., 42 (18): 7390–7402 https://kns.cnki.net/kcms/detail/detail.aspx?FileName=STXB202218010&DbName=CJFQTEMP
Ma, Yingzhong. 2012. Vegetation index and correlation analysis of natural grassland based on TM image and SPSS software [J]. J. Anhui Agric. Sci., 40(23): 11693–11694, doi:10.3969/j.issn.0517-6611.2012.23.055
Paar, Martin, Berthold, Maximilian, Schumann, Rhena, Dahlke, Sven, and Blindow, Irmgard. 2021. Seasonal variation in biomass and production of the macrophytobenthos in two lagoons in the southern baltic sea[J]. Front. Earth Sci. (Lausanne)., 8, doi:10.3389/feart.2020.542391
Pei, Hao, Li, Yunpeng, and Fan, Yiyi. 1995. Preliminary study on monitoring foragestock in temperate grassland during the dry-weed season using meteorological satellite NOAA/AVHRR data [J]. Grassl. China, (06):44–47.
Pradhan, Sucharita, and Tiwari, Kamlesh Narayan. 2021. Evaluation of Sentinel 2 red edge channel for enhancing land use classification[J]. Water Manag. Water Gov. Water Sci. Technol. Libr., 96:78–89, doi:10.1007/978-3-030-58051-3-6
Pu, Yihan, Zhang, Dong, Xu, Dandan, and Luan, Zhaoqing. 2021. Evaluation of Sentinel-2A red-edge band for vegetation classification in lakeside belts [J]. For. Resour. Manag., (02): 131–139, doi:10.13466/j.cnki.lyzygl.2021.02.018
Seyin, Batu. 2002. Dynamic research on grassland combustibles[J]. Grassl. China, (05):49–53, doi:10.3321/j.issn:1673-5021.2002.05.011
Shan, Yu, Duwala, and Liu, Guixiang. 2014. Research on remote sensing estimation model of combustible matter during subtilization period of grassland in Inner Mongolia [J]. J. Arid Land Resour. Environ., 28(11): 145–151, doi:10.13448/j.cnki.jalre.2014.11.025
Song, Weize, Jia, Haifeng, Liu, Shujie, Liang, Shidong, Wang, Zheng, Hao, Lizhuang, et al. 2014. A remote sensing based forage biomass yield inversion model of Alpine-cold Meadow during grass-withering period in Sanjiangyuan area[J]. IOP Conf. Ser. Earth Environ. Sci., 17, 012042, doi:10.1088/1755-1315/17/1/0120421).
Thakur, Tarun K., Patel, Digvesh K., Thakur, Anita, Kumar, Anirudh, Bijalwan, Arvind, Bhat, Jahangeer A., et al. 2021. Biomass production assessment in a protected area of dry tropical forest ecosystem of India: A field to satellite observation approach[J]. Front. Environ. Sci., 9, doi:10.3389/fenvs.2021.757976
Xu, Hui. 2015. Study on the hyperspectral biomass estimation method of subtilis in typical grassland of Xilingol League [D]. Inner Mongolia Normal University.China.
Xu, Zhenyu, Li, Yingchang, Li, Mingyang, Li, Chao, and Wang, Lin. 2020. Regional forest biomass inversion based on Sentinel-1A and Landsat 8 data [J].J. Central South Univ. For. Technol., 40(11):147–155, doi:10.14067/j.cnki.1673-923x.2020.11.018
Yang, Shaoqin, Wang, Xiang, Xu, Cheng, and Shang, Tianqi. 2022. Estimation of aboveground biomass of bamboo forest based on MODIS time series data [J] J. Zhejiang Agric. For. Univ., 39 (04): 734–741, doi:10.11833/j.issn.2095-0756.20210431
Yang, Wenyi, Wang, Yingshun, and He, Junjie. 2001. Research on establishing a calculation model of grassland cold season stock carrying capacity using remote sensing information [J]. Chin. J. Agrometeorology, (01): 40–43.
Yi, Zhuo, Liu, Guixiang, and Cui, Qingdong. 2010. Research on the dynamic changesof combustibles in the dry season and remote sensing quantitative monitoring in Xilin Gol grassland pastoral area [C]. "Proceedings of the Risk Analysis and CrisisResponse from a Chinese Perspective"-Risk Analysis ProfessionalCommittee of China Disaster Prevention Association Proceedings of theFourth Annual Conference., 147–152.
Zhai, Yujuan, Hao, Libo, Zhang, Yanhong, Ye, Li, and Liu, Zhaoli. 2021. Wetland biodiversity disturbance evaluation induced by a water conservancy project in the flooded plain of the Huolin river lower reaches[J]. Sustainability, 13, 4476, doi:10.3390/su130844768).
Zhang, Jinqi.2021. Study on surface dead combustible matter load and combustibility of different forest types in the southeastern foothills of theGreater Khingan Mountains in Inner Mongolia [D]. Inner Mongolia Agricultural University.China.
Zhang, Y., Shu, Q., Wang, L., et al. July 2019. Estimation of fuel biomass for grasslands using data assimilation technique[C], IGARSS 2019- IEEE International Geoscience and Remote Sensing Symposium. IEEE, 9988–9991.Yokohama, Japan, doi:10.1109/IGARSS.2019.8898322
Zhang, Yanhong, Su, Sheng, Liu, Zhaoli, Hou, Guanglei, Chen, Ziqi, Han, Ying, et al. (2021). Ecological protection of the red area habitat risk assessment [J/OL]. J. Jilin Univ. (Earth Sci. Ed. 1–10. [2022-09-19]. doi:10.13278./.j.carol.carroll.nki.jjuese.20210190
Zhang, Zhengxiang. 2010. Research on grassland fire status based on geographic information system and remote sensing [D]. Northeast Normal University.Changchun, China.
Zhang, Zhengxiang, Zhang, Hongyan, Feng, Zhiqiang, Li, Xuedong, Bi, Yunzhi, Shi, Dongkai, et al. 2015. A method for estimating the amount of dead grass fuel based on spectral reflectance characteristics[J]. Int. J. Wildland Fire, 24(7):940–948, doi:10.1071/WF13149
Zhao, Bingru, Liu, Chuang, Wang, Jingjie, and Chen, Wenbo. 2004. Study on temporal and spatial variation of MODIS vegetation index in Xilin Gol grassland [J]. Grassl. China, (01):2–9, doi:10.3321/j.issn:1673-5021.2004.01.001
Keywords: withered grass biomass, dry grass index, spatial-temporal variation, Sentinel-2 data, Northeast China
Citation: Zang P, Zhang Y, Chen Z, Hou G, Liu Z and Lu X (2023) The inversion modeling and aboveground biomass mapping of withered grass changes in the western grassland of Northeast China. Front. Earth Sci. 10:1031098. doi: 10.3389/feart.2022.1031098
Received: 29 August 2022; Accepted: 01 November 2022;
Published: 18 January 2023.
Edited by:
Jun Yang, Northeastern University, ChinaReviewed by:
Shaohua Wang, Aerospace Information Research Institute (CAS), ChinaXiaoping Zhang, Shandong Jianzhu University, China
Copyright © 2023 Zang, Zhang, Chen, Hou, Liu and Lu. This is an open-access article distributed under the terms of the Creative Commons Attribution License (CC BY). The use, distribution or reproduction in other forums is permitted, provided the original author(s) and the copyright owner(s) are credited and that the original publication in this journal is cited, in accordance with accepted academic practice. No use, distribution or reproduction is permitted which does not comply with these terms.
*Correspondence: Yanhong Zhang, Z2lzd29ya0AxNjMuY29t; Xingchang Lu, bHV4Y0BqbHUuZWR1LmNu