Abstract
A unified method of predicting soil deformations induced by general and special-section tunneling in clays is proposed. Assuming that the tunneling-induced ground loss can be divided into infinite ground loss elements, and the soil deformation induced by the overall ground loss is equal to the sum of deformation due to each unit ground loss, the soil deformation due to unit ground loss is first derived based on elasticity theory solution. The soil deformation induced by random shaped-section tunneling is then obtained by integrating along the overall ground loss distribution, and the expressions are presented in the Cartesian and polar coordinate forms, respectively. By means of several cases of single circular tunneling, the reliability of the unified method is well verified through comparing with the measured data, and the performance of this method is quantitatively evaluated against the error analysis of the predictions. Taking the double-O-tube (DOT) shield tunnel for example, the unified method is further applied to predict soil deformation induced by special-section tunneling. The results show that the shape of the surface settlement curve caused by DOT shield tunneling also presents an inverted Gaussian curve. With the increase of the soil depth, the settlement of soil above the DOT shield tunnel increases slightly first and then decreases, and the settlement trough width keeps decreasing, resulting in the change of the shape of the settlement curve from “V” to “W”.
1 Introduction
Until now, shield tunnel construction method has had a history of about 190 years. During a long period of time in the past, the general circular section shield construction method has obtained sufficient development and been widely used in worldwide underground engineering such as subway tunnels and underground pipelines. With the rapid development of urbanization and modernization, the construction of underground engineering is subject to increasing difficulties and challenges in urban, due to the decrease of available underground space and the densification of underground structures (Simpson and Tatsuoka, 2008). Therefore the advanced special-section shield tunneling technology comes into being, which can save the underground space, decrease the impact of tunneling on ambient structures, or reduce the potential security issues in complicated circumstances (Nakamura et al., 2003; Maeda and Kushiyama, 2005; Chow, 2006; Shen et al., 2009; Fang et al., 2012; Huang and Zeng, 2017; Zeng et al., 2022). For instance, as the most widely used special-section shield tunneling technology, the double-O-tube (DOT) shield tunneling have been carried out successfully in Japan, Shanghai and Taipei, China (Fang et al., 2012). In the recent decade, many species of special-section shield tunneling have also been implemented successfully in China, such as rectangular shield tunneling, quasi-rectangular shield tunneling and horseshoe-shaped shield tunneling, as illustrated in Figure 1.
FIGURE 1
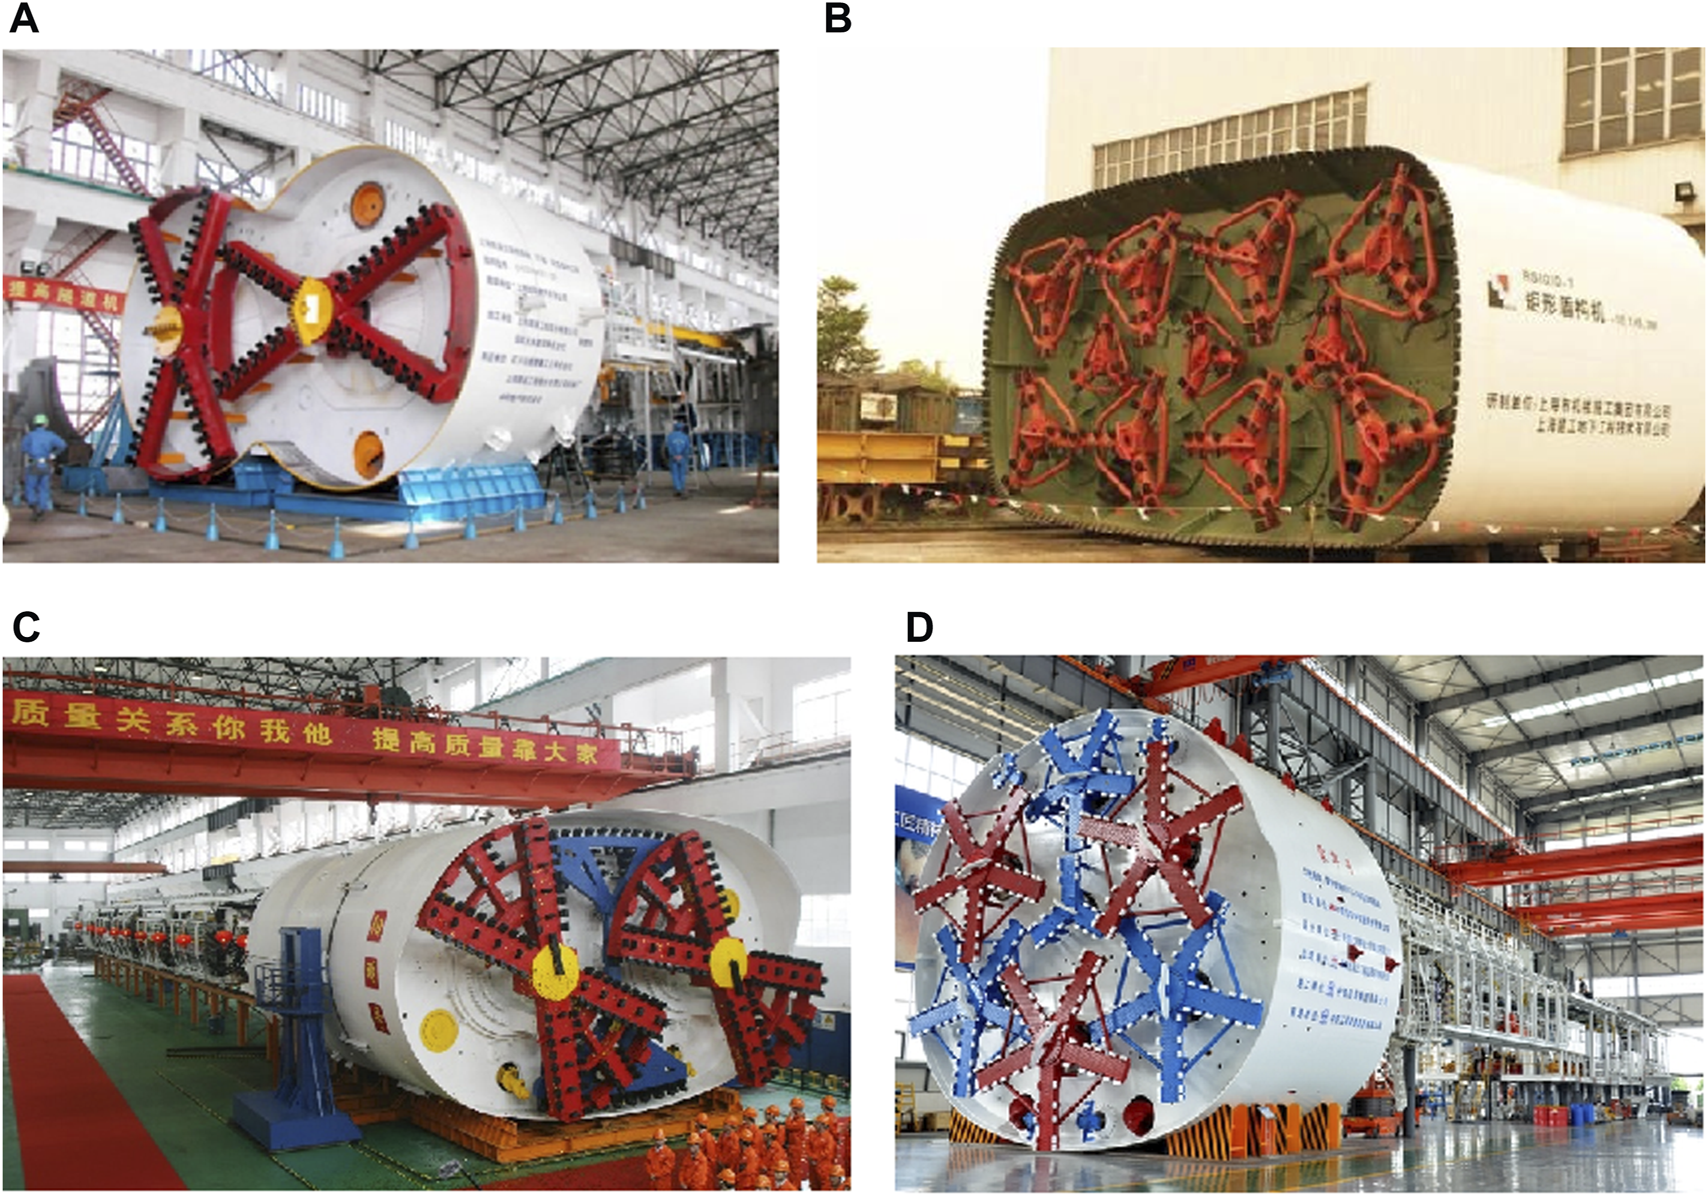
Several representative special-section shield machines: (A) DOT shield machine; (B) rectangular shield machine; (C) quasi-rectangular shield machine; (D) horseshoe-shaped shield machine.
The underground excavation will inevitably cause surface and subsurface deformations, and maybe further affect the performance of adjacent underground structures (Bilotta, 2008; Mohamad et al., 2010; Fargnoli et al., 2015; Ng et al., 2016; Cui et al., 2021; Zhou et al., 2021; Cui et al., 2022; Li et al., 2022). Therefore the prediction of soil deformation induced by tunneling is always a key issue in urban underground engineering (Mair, 2008; Wan et al., 2017). Since Peck (1969) presented an empirical equation by means of the statistical analysis based on numerous measured settlements of surface soils during tunnel construction, various methods have been proposed to predict tunneling-induced soil deformation, such as empirical equations (Mair et al., 1993), elastic-plastic analytical solutions (Wood, 1975; Verruijt, 1997; Bobet, 2001; Park, 2004; Park, 2005; Osman et al., 2006; Puzrin et al., 2012; Zymnis et al., 2013), numerical methods (Franzius et al., 2005; Wongsaroj et al., 2007; Wongsaroj et al., 2013; Bym et al., 2013; Avgerinos et al., 2016), and model tests (Loganathan et al., 2000). Using the virtual image technique, Sagaseta (1987) presented a closed form solution for computing soil deformations due to ground loss induced by tunneling in an isotropic and homogeneous incompressible soil. Considering the compressibility of soil and the ovalization of tunnel, Verruijt and Booker (1996) derived the generalization of Sagaseta’s solution based on the uniform radial convergence model of ground loss. However, the estimated results are inconsistent with the observations of soil deformations, and the predicted settlement trough is wider while the predicted horizontal displacement is larger. In fact, due to the self-weight of tunnel, the upward rebound deformation of soil below the tunnel is limited, which leads to non-uniform void distribution around the tunnel lining. Therefore Loganathan and Poulos (1998) proposed the model of oval-shaped soil deformation and derived the prediction equations of soil deformation with short-term undrained conditions. The predicted results are in good agreement with the measured values.
These methods mentioned above are used to predict soil deformation induced by the general circular section tunnel construction. For special-section shield tunneling, there are few studies on the prediction method of soil deformation. Based on the empirical Peck function (1969), the superposition method and the equivalent excavated area method were carried out to predict surface settlement induced by DOT shield tunneling (Fang et al., 2012; Gui and Chen, 2013). The two methods are rude and the predicted results are rough. More unfortunately, the methods cannot be extended to other special-section shield tunnels. Stochastic medium theory method, which is a flexible mature method for predicting soil deformation induced by underground excavation (Yang et al., 2004; Yang and Wang, 2011), also was been successfully used to predict soil deformation induced by DOT shield tunneling (Zeng and Huang, 2016). However, the method can only calculate soil deformation above the tunnel.
In this paper, soil deformation due to unit ground loss is derived based on the equations proposed by Loganathan and Poulos (1998). The overall ground loss induced by underground excavations can be divided into infinitesimal ground loss elements, and the total soil deformation is the sum of soil deformation due to each unit ground loss. Finally, a unified method is proposed to predict soil deformation induced by general and special-section shield tunneling. The proposed method is then applied to the prediction of soil deformation induced by general circular tunneling and DOT shield tunneling, respectively. The predicted soil deformations are compared with the measured values, and the results verify the reliability of the proposed method.
2 Unified prediction method of soil deformation induced by underground excavation
2.1 Overview of Loganathan’s solution
Based on the elasticity theory solution of solid mechanics in semi-infinite spatial elastomer, Sagaseta (1987) firstly derived the closed form solution by means of a virtual image technique in isotropic and homogeneous incompressible soils. Considering the compressibility of soils and the long-term ground deformation due to the ovalization of tunnel lining, Verruijt and Booker (1996) further derived the generalized Sagaseta’s solution based on the model of uniform radial ground deformation (Figure 2A), and soil settlement W (x, z) and horizontal soil deformation U (x, z) with respect to the soil at (x, z) are expressed as (Verruijt and Booker, 1996):where z is the soil depth; x is the horizontal distance far away from the tunnel axis; R is the radius of excavated tunnel; k = v/(1-v); m is an auxiliary elastic constant, m = 1/(1-2v); ν is the Poisson’s ratio of soil; z0 is the ordinate of the tunnel center (i.e., the depth of the tunnel center, h); z1 = z - z0; z2 = z + z0; δ is the long-term ground deformation parameter due to the ovalization of tunnel lining; ε0 is the ground loss rate, defined as the ratio of ground loss to the excavated volume.
FIGURE 2
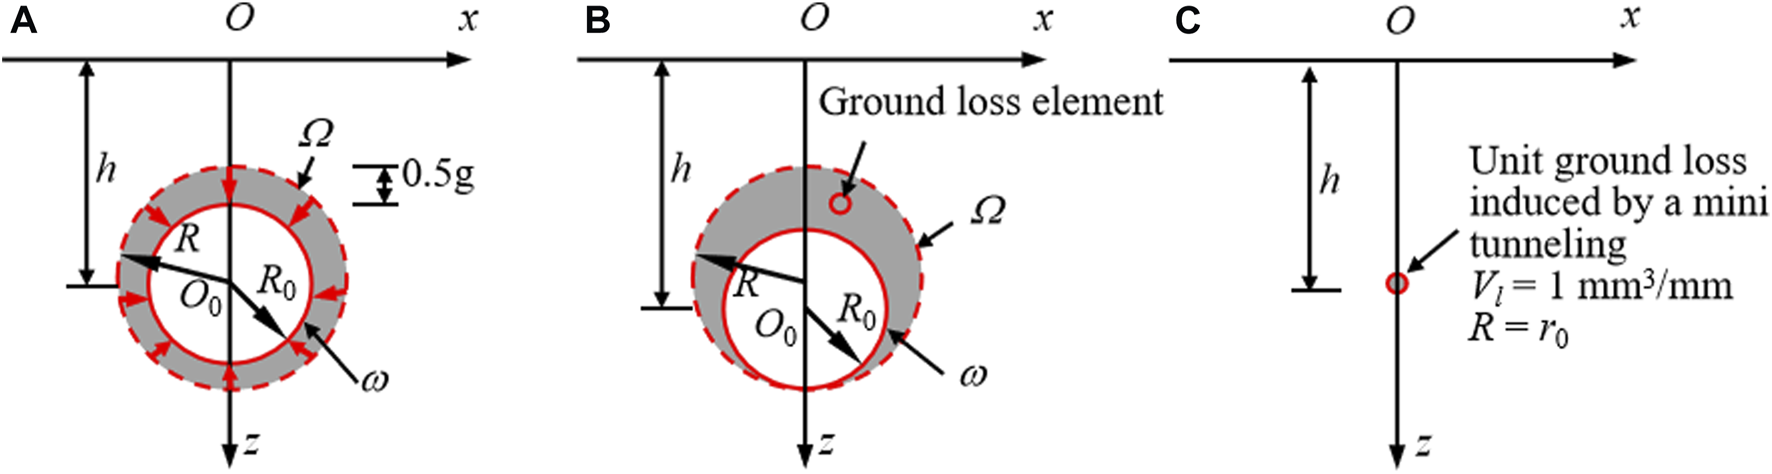
Models of ground deformation induced by circular shield tunnelling: (A) uniform radial ground deformation (Verruijt and Booker, 1996); (B) oval-shaped ground deformation (Loganathan and Poulos, 1998); (C) unit ground loss induced by a mini tunneling with the radius of r0.
For the circular section tunnel, ε0 can be expressed aswhere Vl is the ground loss per unit length along the direction of tunnel axis (i.e., the area difference between the excavated cross section Ω and the convergent cross section ω in Figures 2A,B).
In practice, the ground loss rate, ε0, is usually converted by the equivalent ground loss parameter, g, which was defined and discussed in detail by Lee et al. (1992). The relationship between ε0 and g is (Zeng and Huang, 2016)
The soil deformation, predicted by the generalized Sagaseta’s solution,i.e. Eqs. 1, 2, deviates greatly from the measured value (Loganathan and Poulos, 1998). The analysis from Stallebrass et al. (1996) and Loganathan and Poulos (1998) showed that the tunnel lining would settle due to its self-weight during the tunnel construction, which caused the upward deformation of the soil below the tunnel was limited while the void above the tunnel increased. Therefore Loganathan and Poulos (1998) proposed the model of oval-shaped ground deformation as illustrated in Figure 2B and modified the ground loss rate ε0, as follows
On the other hand, the parameter δ in Eqs 1, 2 characterizes the long-term ground deformation due to the ovalization of tunnel lining. Loganathan and Poulos (1998) only considered soil deformation with short-term undrained conditions during the period of tunnel construction, and neglected the long-term soil deformation (i.e., δ = 0). Substituting Eq. 5 and δ = 0 into Eqs 1, 2, Loganathan and Poulos (1998) obtained the analytical function for predicting tunneling-induced soil deformation in clays, expressed as
2.2 Soil deformation due to unit ground loss
Sagaseta (1987) considered that the ground loss induced by single tunneling was concentrated at the tunnel axis to compute the surface ground deformation. According to this law, with the decrease of the tunnel radius, R, the magnitude of ground loss, Vl, reduces, and the dispersive ground loss also tends to be concentrated in the tunnel center. According to the study by Yang et al. (2004), the whole ground loss volume induced by tunneling can be considered to be divided into infinitesimal ground loss units, and the overall soil deformation is equal to the sum of the soil deformation induced by each unit ground loss. Therefore, it can be assumed that the ground loss in Figures 2A,B can be divided into infinite ground loss elements and that the soil deformation induced by the overall ground loss is equal to the sum of deformation due to each unit ground loss. As a result, the soil deformation equation induced by unit ground loss can be derived through dividing soil deformation formula developed by Verruijt and Booker (1996) and Loganathan and Poulos (1998) by the ground loss induced by the general single circular tunneling, where the ground loss has been assumed to be concentrated at the tunnel center.
As illustrated in Figure 2C, when unit ground loss is generated (i.e., Vl = 1 mm3/mm) induced by a mini tunneling, the corresponding tunnel radius is tagged as r0. According to the definition of the ground loss rate, ε0, in Eq. 3, the following expression can be obtained.
The mini tunnel radius, r0, corresponding to unit ground loss, thus is
Replacing R in Eqs 6, 7 with the mini tunnel radius, r0, soil deformation due to unit ground loss located at (0, z0) can be derived, as follows
The ground loss rate, ε0, is mainly determined by the geological conditions, the construction method and the construction technology level (Standing and Burland, 2006). The analysis carried out by Attewell (1978) showed that the range of ε0 was 0.5%–2.5% in clays. O’Reilly and New (1982) summarized the magnitude of ε0 in various types of soil in the United Kingdom, as listed in Table 1. The study from Mair (1996) showed that ε0 was generally in the range of 0.5%–2.0% in the homogeneous soil, of which 0.5% in sand soils and 1%–2% in soft soils.
TABLE 1
| Soil type | ε 0 (%) |
|---|---|
| Cohesive soil | 0.5–2.5 |
| Stiff clay with fractures | 1.0–2.0 |
| Moraine soil (without air pressure) | 2.0–2.5 |
| Moraine soil (with air pressure) | 1.0–1.5 |
| Newly deposited silty clay (Cu = 10 kPa–40 kPa) | 2.0–10.0 |
| Noncohesive soil (above groundwater level) | 2.0–5.0 |
| Noncohesive soil (below groundwater level) | 2.0–10.0 |
| Artificial fill | >10.0 |
Empirical values of the ground loss rate, ε0, in the United Kingdom (Mair, 1996).
Note: 1. Cu denotes the cohesion of soil; 2. The empirical values of ε0 in this table apply to the tunnels with a medium-sized radius (R = 3.0 m–3.5 m) and the values should increase appropriately for the tunnels with a smaller radius (R < 1.5 m).
Figure 3 shows the relationship between r0 and ε0. When ε0 increases from 0.1% to 15.0%, r0 decreases from 17.84 to 1.46 mm. Especially, the range of r0 in clays is 3.57–7.98 mm z0 in Eqs 10, 11 represents the depth of the mini tunnel (approximatively the ordinate of unit ground loss), which is generally in the order of meter. As a result, the quadratic term (z0 + 1/)2 in Eqs 10, 11 can be approximatively equal to z2 0when subsequently analyzing the influence of the parameters, ν and h, on soil deformation due to unit ground loss.
FIGURE 3
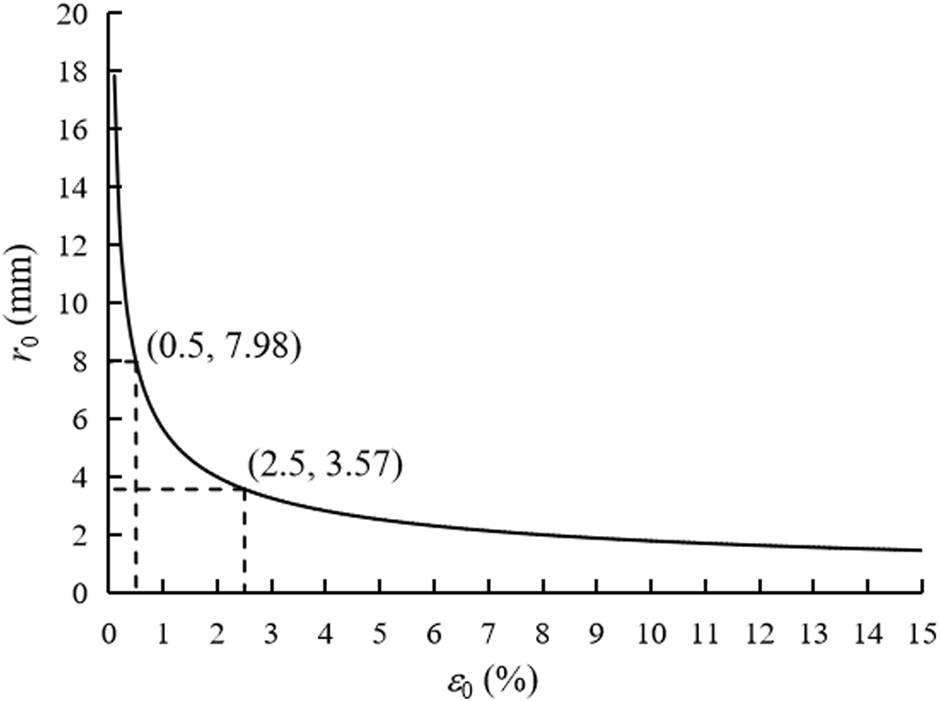
Relationship between r0 and ε0.
The influence of Poisson’s ratio,ν, on surface deformation due to unit ground loss located at (0, h) is shown in Figures 4A,B. It can be seen that Poisson’s ratio of soil will affect significantly soil deformation. With the decrease of Poisson’s ratio, both soil settlement and horizontal deformation almost increase linearly. When ν = 3.5, soil deformation field induced by unit ground loss is shown in Figure 4C. Maximum deformation is about 2h−1 mm, and is located just above and near the ground loss element. Soils in the section all tend to move towards the ground loss element.
FIGURE 4
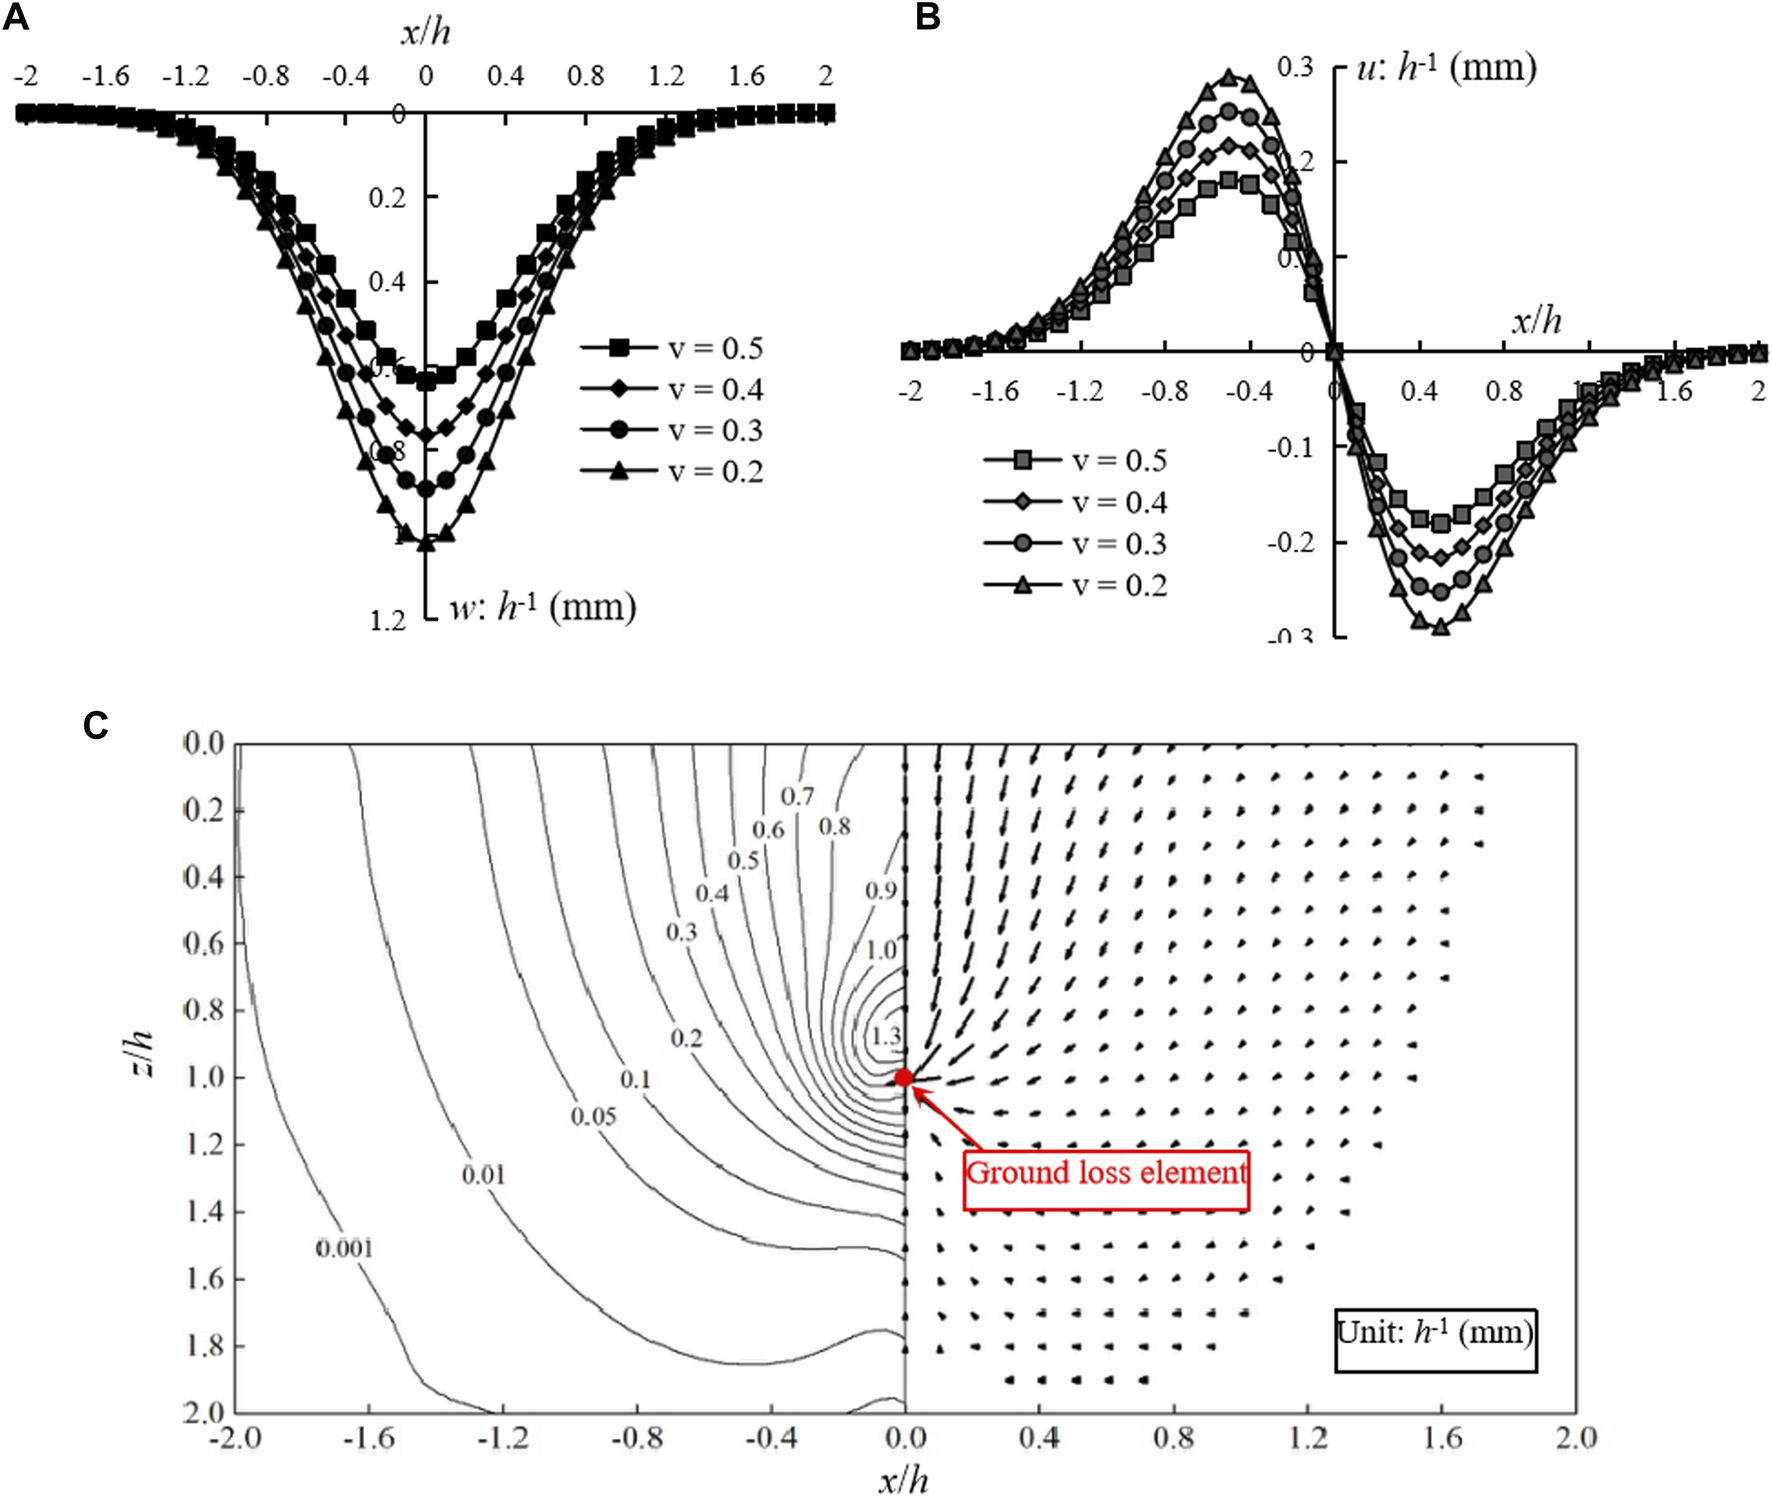
Soil deformation due to unit ground loss: (A) surface settlement; (B) horizontal surface deformation; (C) Soil deformation field.
Eqs. 10, 11 are the formulas for computing soil deformation induced by unit ground loss located at (0, z0). As for unit ground loss located at arbitrary position (x0, z0), according to the translation of coordinate axes, the general expressions for soil deformation due to unit ground loss can be written as
2.3 General formula of unified prediction method
According to the assumption in Section 2.2 that the whole ground loss is divided into infinite ground loss elements and the soil deformation induced by the overall ground loss is equal to the sum of deformation due to each unit ground loss, a unified prediction formula of soil deformation induced by random shaped section tunneling can be expressed in the following Cartesian coordinate form.
In most cases, the outer boundary of the cross section of tunnel is arc-shaped. To provide ease of calculation, the unified prediction formula of soil deformation with a polar coordinate form is needed. As illustrated in Figures 5A,B, the location of arbitrary ground loss element in Cartesian coordinate system (ξ, η) can be denoted by the local polar coordinate (r, θ), and the dimension of ground loss element dξ by dη can also be converted into r by dr by dθ, where (X0, Z0) is the center coordinate of local circle containing the ground loss element. According to the geometrical relationship, the following equations of coordinate transformation can be obtained.
FIGURE 5
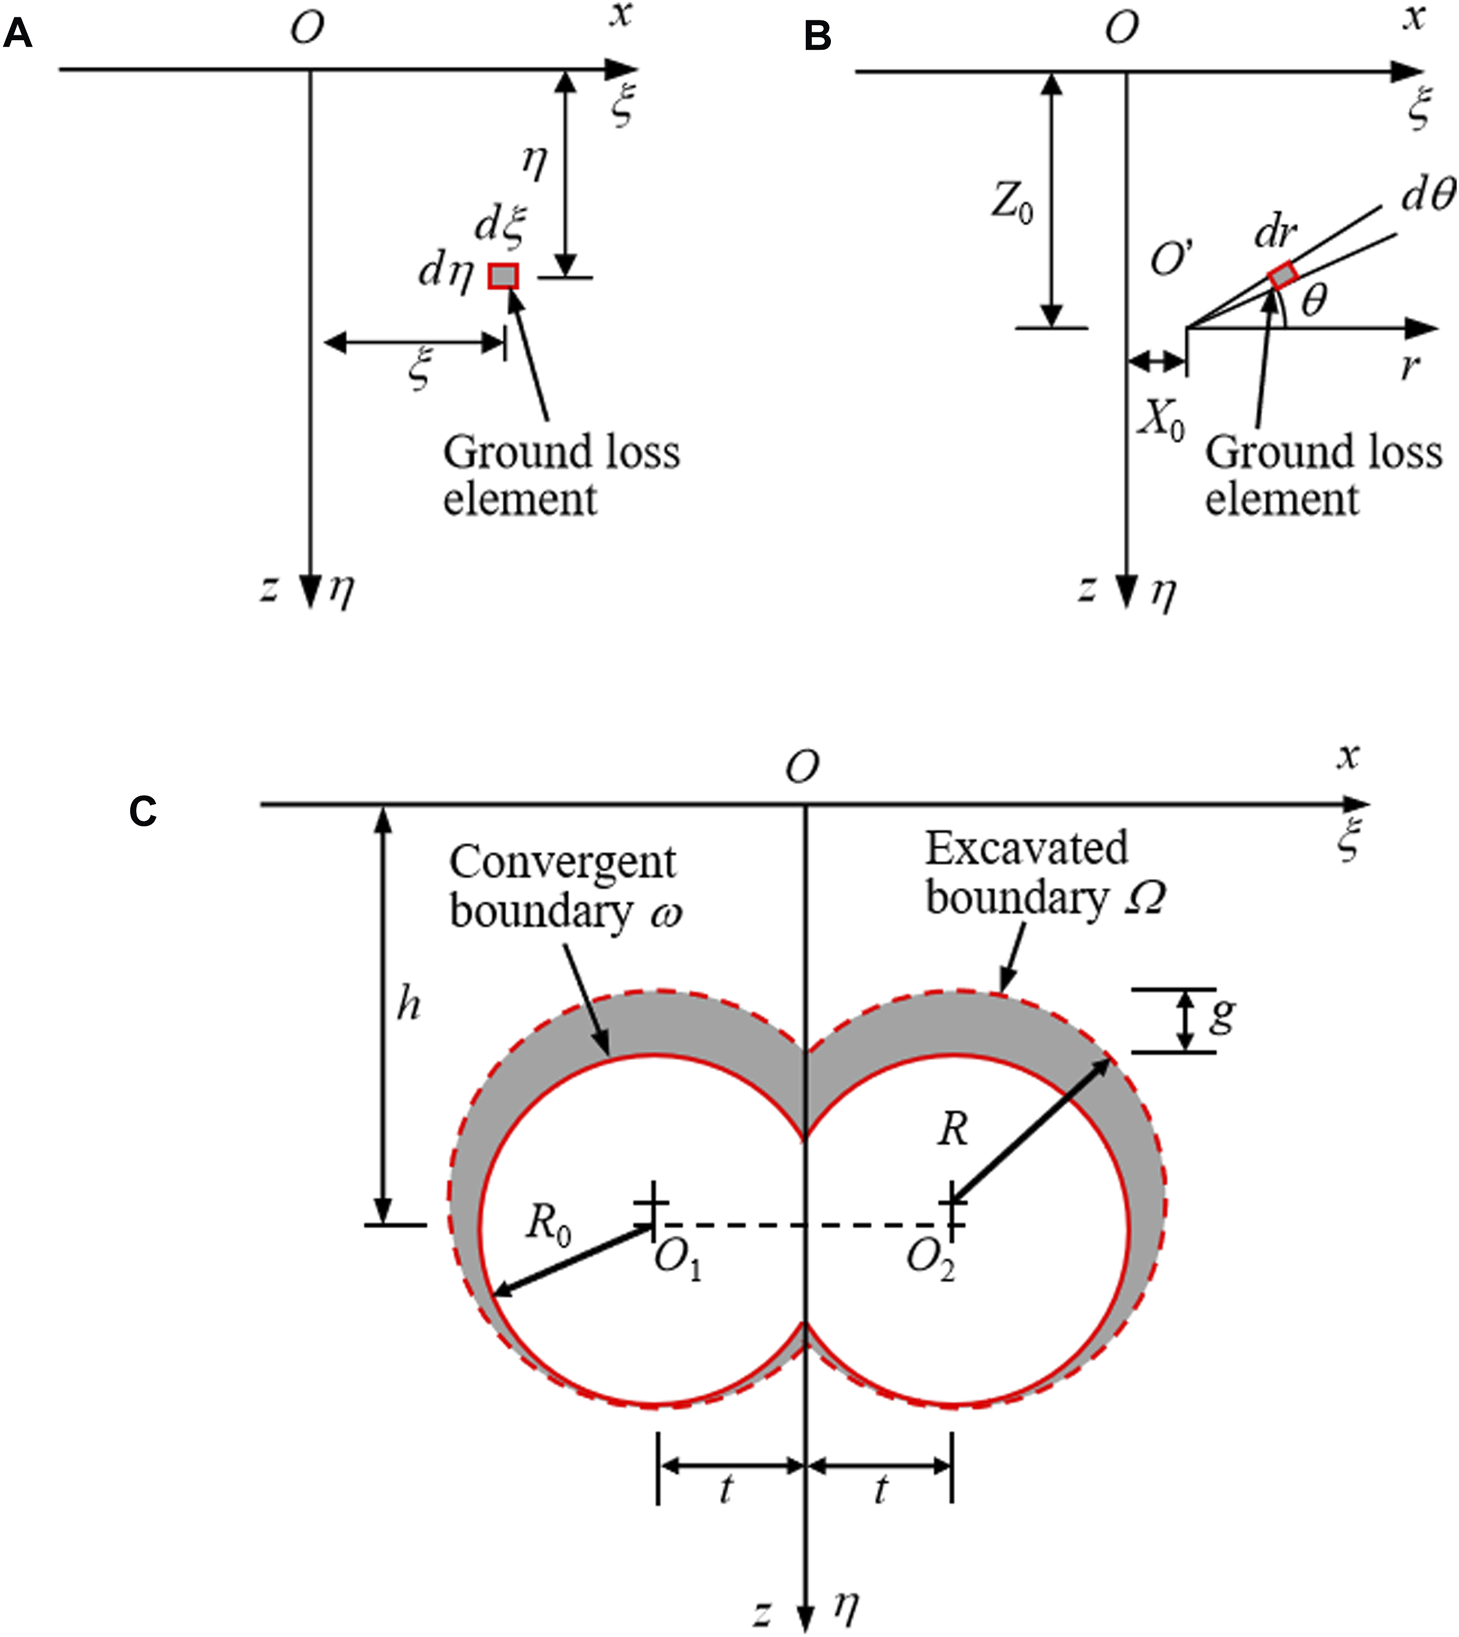
Model of DOT shield tunneling-induced soil deformation: (A) Cartesian coordinate system considering ground loss element; (B) polar coordinate system considering ground loss element; (C) Ground loss model induced by DOT shield tunnelling.
Substituting Eqs 16, 17 into Eqs 14, 15, the unified prediction formula of soil deformation with the polar coordinate form can be expressed as follows.
The above formulas can be applied to predict soil deformation induced by tunneling with a random shaped section, such as the general circular tunnel, the DOT shield tunnel, the rectangular shield tunnel and the quasi-rectangular shield tunnel.
3 General and DOT shield tunneling-induced soil deformation
3.1 General circular section tunneling-induced soil deformation
Circular section tunnels are the most widely adopted in the underground engineering. According to the statement in Section 2.1, the model of oval-shaped ground deformation proposed by Loganathan and Poulos (1998) is more reasonable than the model of uniform radial ground deformation. As shown in Figure 2B, based on the model of oval-shaped ground deformation, herein the unified formulas of soil deformation with the polar coordinate form, i.e., Eqs 18, 19, are chosen to conveniently integrate along the distribution area of ground loss. According to the geometrical relation, the expressions can be written as follows.
3.2 DOT shield tunneling-induced soil deformation
DOT shield tunneling is a typical method of special-section shield tunnel constructions. As shown in Figure 1A, the cross-section of DOT shield machine is formed by two incomplete circles, each of which has a cutter head with four radial spokes in the end to cut the soil. During the advance of DOT shield tunnel, the two cutter heads rotate synchronously at a same speed with a fixed phase angle to avoid the mutual contact and crash. The construction process of DOT shield tunnel was described in detail by Chow (2006), Shen et al. (2009); Shen et al. (2010) and Fang et al. (2012).
Similar to the model of soil deformation induced by the general circular tunneling (Figure 2B), the model of soil deformation induced by DOT shield tunneling is demonstrated in Figure 5C, where t denotes a half of the distance between two tunnel centers, and other parameters have the same meanings with those in Figure 2B. Herein the unified prediction formulas with the Cartesian coordinate form, i.e., Eqs 14, 15, are chosen to calculate soil deformation induced by DOT shield tunneling. According to the geometrical relation, the expressions can be written as follows.
By means of MATLAB programming, Eqs 20–23 can be solved numerically. As a result, soil deformation at an arbitrary position of the cross section, induced by the general and DOT shield tunnel construction, can be computed.
4 Case studies
4.1 General circular tunneling
Five typical circular tunnels presented by Loganathan and Poulos (1998) are selected to verify the reliability of this proposed analytical method, which consists of various construction methods and small to large section tunnels. The background of each case was described by Loganathan and Poulos (1998). The soil layers and the relevant calculation parameters are listed in Table 2. Soil deformations including soil settlements and horizontal deformations predicted by this method are compared with the measured values and the predicted results from Loganathan’s solution.
TABLE 2
| Tunnel | Soil layers | Relevant calculation parameters of soil deformation | |||||
|---|---|---|---|---|---|---|---|
| Elastic modulus, Eu (MPa) | Soil weight, γ (kN·m−3) | Poisson’s ratio of soil, ν | Depth of tunnel center, h (m) | Excavated diameter, D (m) | Equivalent ground loss parameter, g (mm) | ||
| Heathrow expreass, trail tunnel, United Kingdom. | 0 m–2 m: fill ground | 35 | 19 | 0.30 | 19.0 | 8.50 | 58 |
| 2 m–4 m: terrace gravel | |||||||
| >4 m: stiff London clay (Cu = 50 kPa–250 kPa) | |||||||
| Thunder bay tunnel, Canada | 0 m–8 m: silty sand with occasional clay seams | 10 | 18 | 0.45 | 10.7 | 2.47 | 164 |
| 8 m–13 m: soft to firm clay (Cu = 30 kPa–60 kPa) | |||||||
| 13 m–25 m: firm to stiff clay (Cu > 60 kPa) | |||||||
| Geen Park tunnel, United Kingdom. | 0 m–2 m: sand and gravel | 40 | 19 | 0.39 | 29.4 | 4.14 | 34 |
| >2 m: stiff fissured clay (Cu = 50 kPa–250 kPa) | |||||||
| Barcelona subway network extension tunnel, Barcelona | Red and brown clay with some gravel (Cu = 30 kPa–150 kPa) | 25 | 18 | 0.50 | 10.0 | 8.00 | 31 |
| Bangkok, sewer tunnel, Thailand | 0 m–12 m: very soft to soft clay (Cu = 15 kPa–25 kPa) | 20 | 17 | 0.48 | 18.5 | 2.66 | 81 |
| 12 m–25 m: stiff clay (Cu = ∼50 kPa) | |||||||
| 25 m–35 m: fine sand | |||||||
| >35 m: very stiff clay | |||||||
Soil layers and relevant calculation parameters of circular tunneling-induced soil deformation (Loganathan and Poulos, 1998).
Figure 6 shows the predicted and measured surface settlements. As the most important parameters of surface settlement curve, the maximum surface settlement (i.e., the settlement of the surface ground above the tunnel center) and the surface settlement trough width are listed in Table 3. It can be seen that the maximum surface settlement predicted by this proposed method is slightly greater than that predicted by Loganathan’s solution, and the surface settlement trough width computed by this method is smaller than the latter.
FIGURE 6
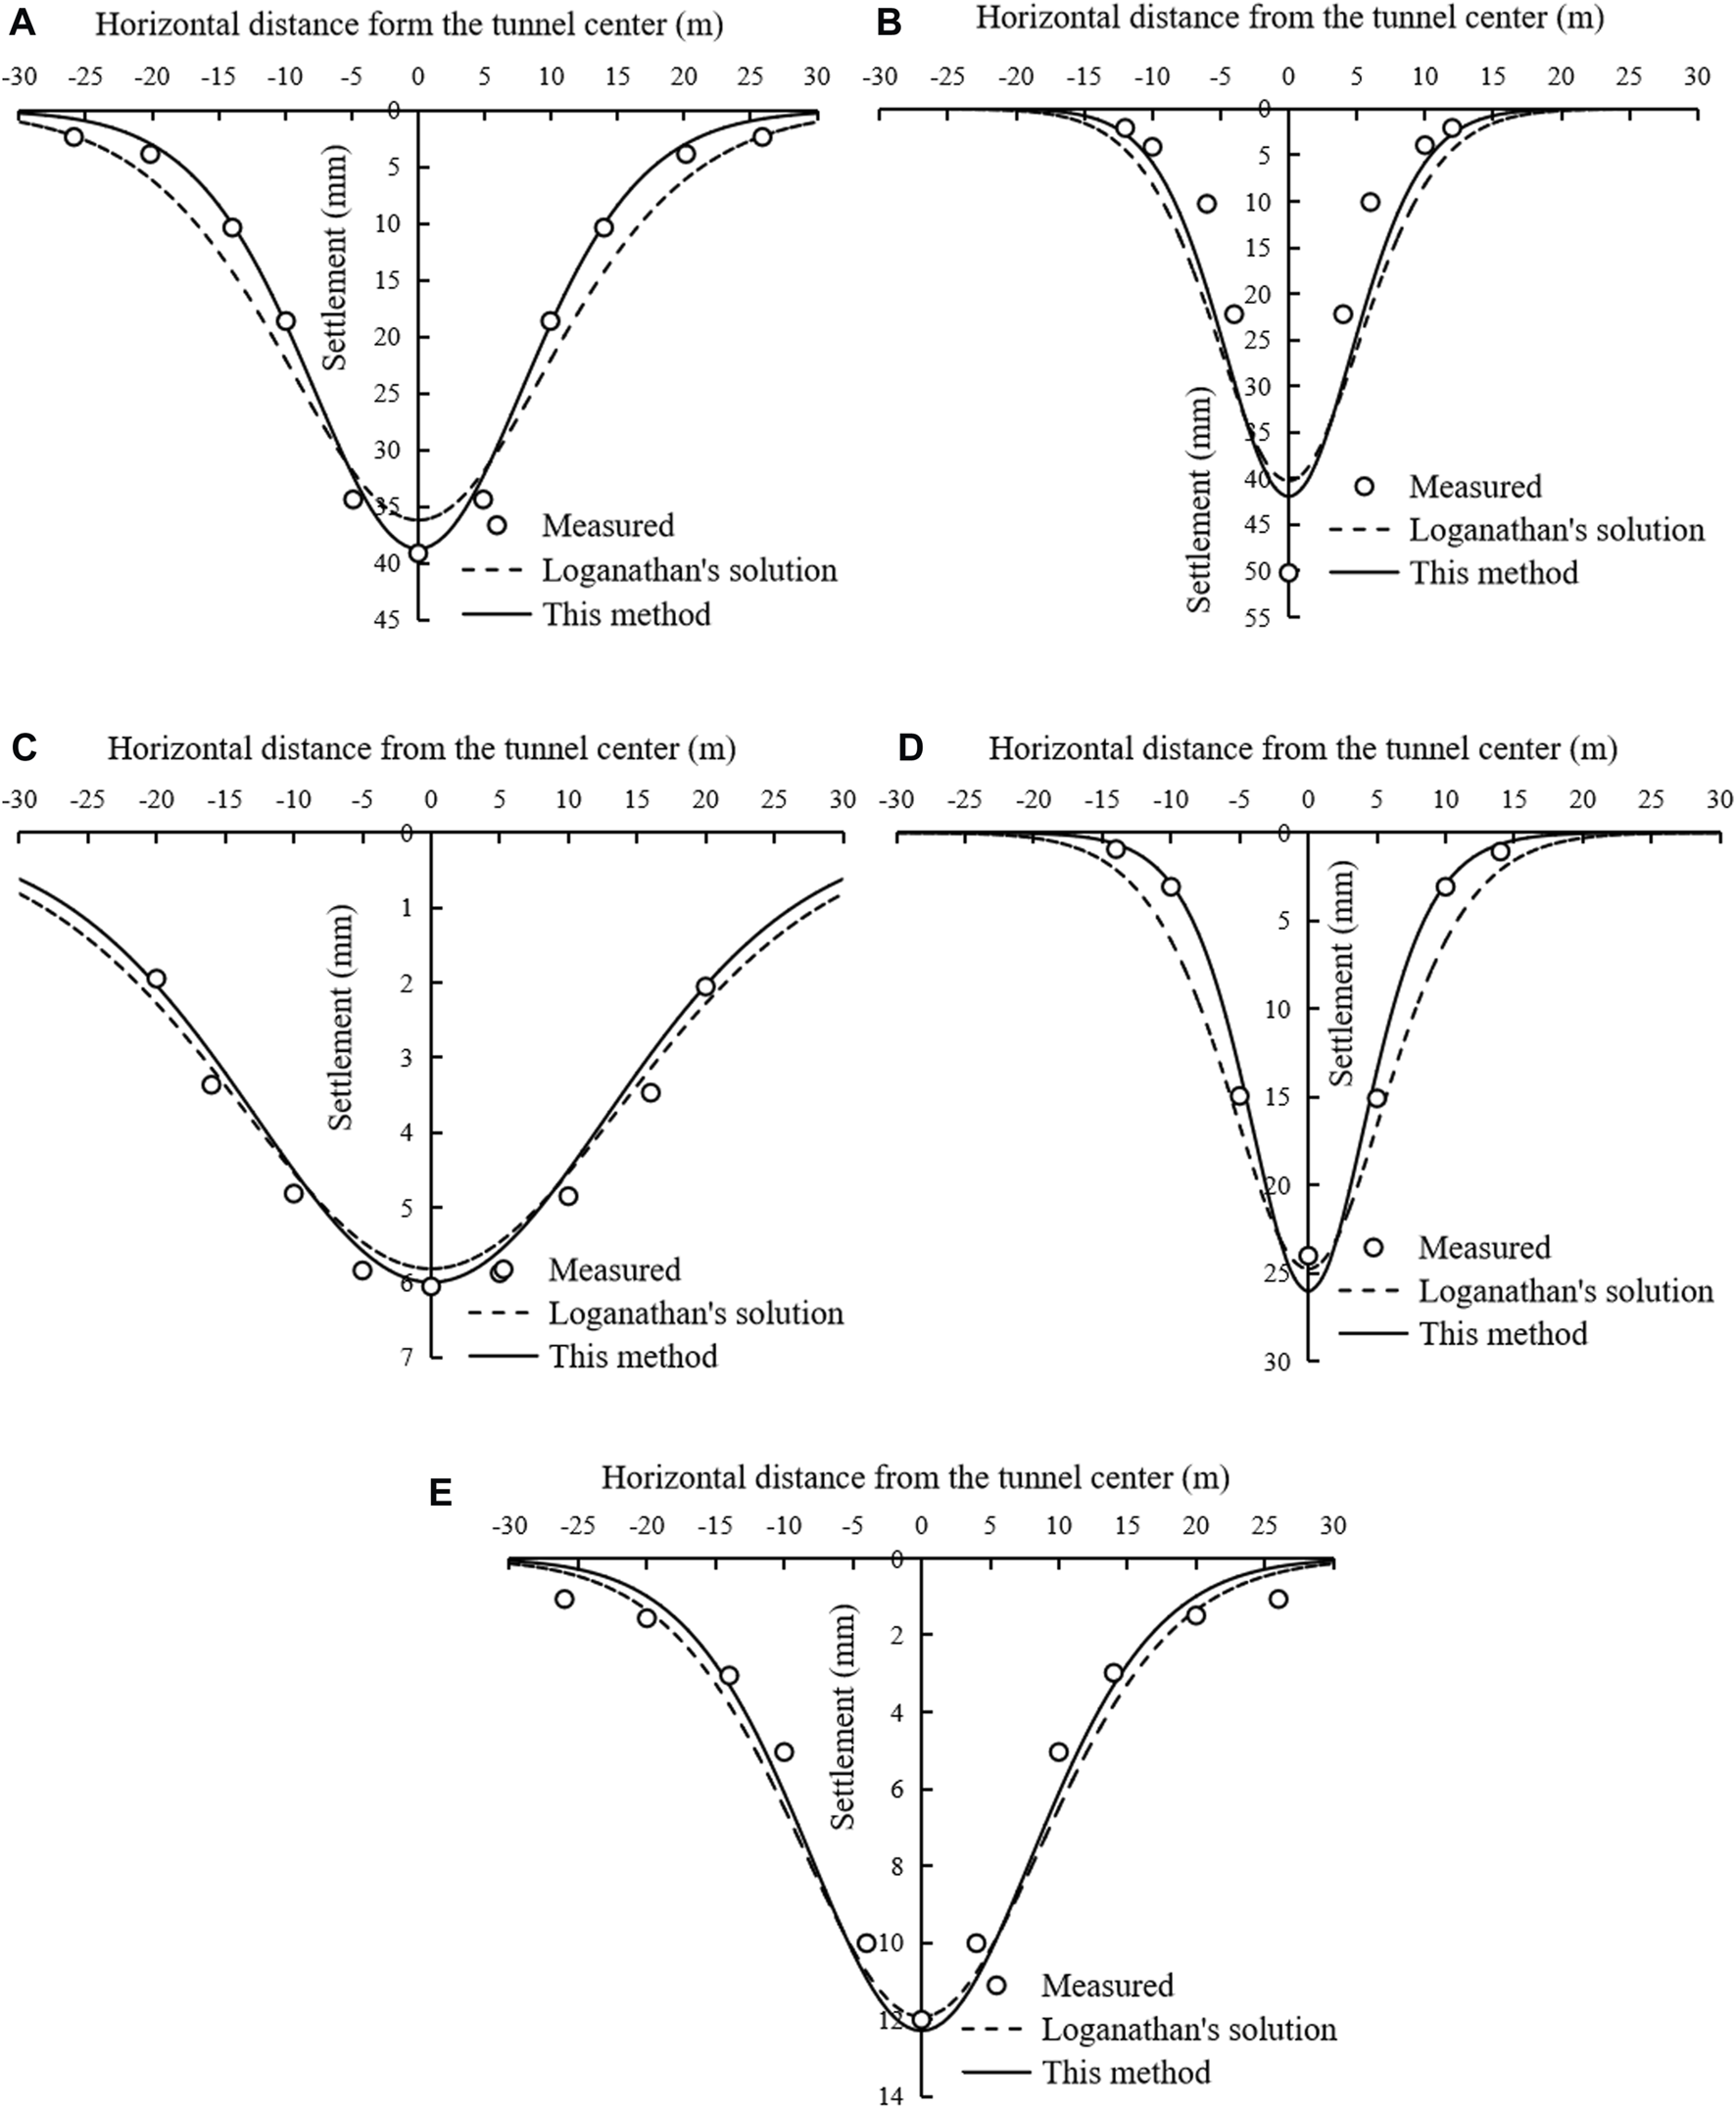
Surface settlement induced by general circular tunneling: (A) Heathrow Express Trail Tunnel; (B) Thunder Bay Tunnel; (C) Green Park Tunnel; (D) Barcelona Subway Tunnel; (E) Sewer Tunnel, Bangkok.
TABLE 3
| Tunnel | Heathrow expreass, trail tunnel, United Kingdom. | Thunder bay tunnel, Canada | Geen park tunnel, United Kingdom. | Barcelona subway network extension tunnel, barcelona | Bangkok, sewer tunnel, Thailand | |
|---|---|---|---|---|---|---|
| Maximum surface settlement (mm) | Measured | 39 | 50 | 6 | 24 | 12 |
| Loganathan’s solution | 36.3 | 40.0 | 5.8 | 24.7 | 11.8 | |
| This method | 38.7 | 42.0 | 6.0 | 26.0 | 12.2 | |
| Trough width (m) | Loganathan’s solution | 10.1 | 5.3 | 13.9 | 5.2 | 8.8 |
| This method | 7.9 | 4.6 | 12.7 | 4.0 | 8.0 | |
| RMSEWX (mm) | Loganathan’s solution | 2.76 | 7.71 | 0.31 | 1.96 | 0.84 |
| This method | 1.19 | 6.28 | 0.30 | 1.13 | 0.75 | |
| RMSEWZ (mm) | Loganathan’s solution | 4.13 | 8.79 | 1.09 | — | — |
| This method | 1.73 | 5.97 | 1.22 | — | — | |
| RMSEUZ (mm) | Loganathan’s solution | 2.45/2.78* | 5.86 | — | — | 1.03 |
| This method | 4.28/3.87* | 6.49 | — | — | 1.06 |
Comparison of predicted and measured soil deformation parameters.
Note: * shows that the former is the RMSEUZ, at x = 6 m while the latter at x = 9 m.
To quantitatively analyze the performance of the proposed method, the root mean square error (RMSE) is introduced to evaluate the difference between the prediction results and the measured values. The expression of RMSE is as follows.where N is the number of the measured points; di and d0i are the predicted and measured soil deformation at the ith measured point, respectively.
The RMSE value of the surface settlement of each case in Figure 6, denoted by RMSEWX, is presented in Table 3. For all the five tunnels, the RMSEWX values calculated by this method are smaller than those computed by Loganathan’s solution. Therefore, the surface settlement predicted by this method is in better agreement with the measured value, and the performance of the unified method is better than that of Loganathan’s solution.
The soil settlements, at different depths above the tunnel center, of three tunnels are evaluated in Figure 7, and the RMSE values of the soil settlements are listed in Table 3, denoted by RMSEWZ. Except for the Green Park Tunnel, where the RMSEWZ value calculated by this method is slightly greater than that obtained from Loganathan’s solution, the RMSEWZ values from this method are obviously smaller for the other two tunnels.
FIGURE 7
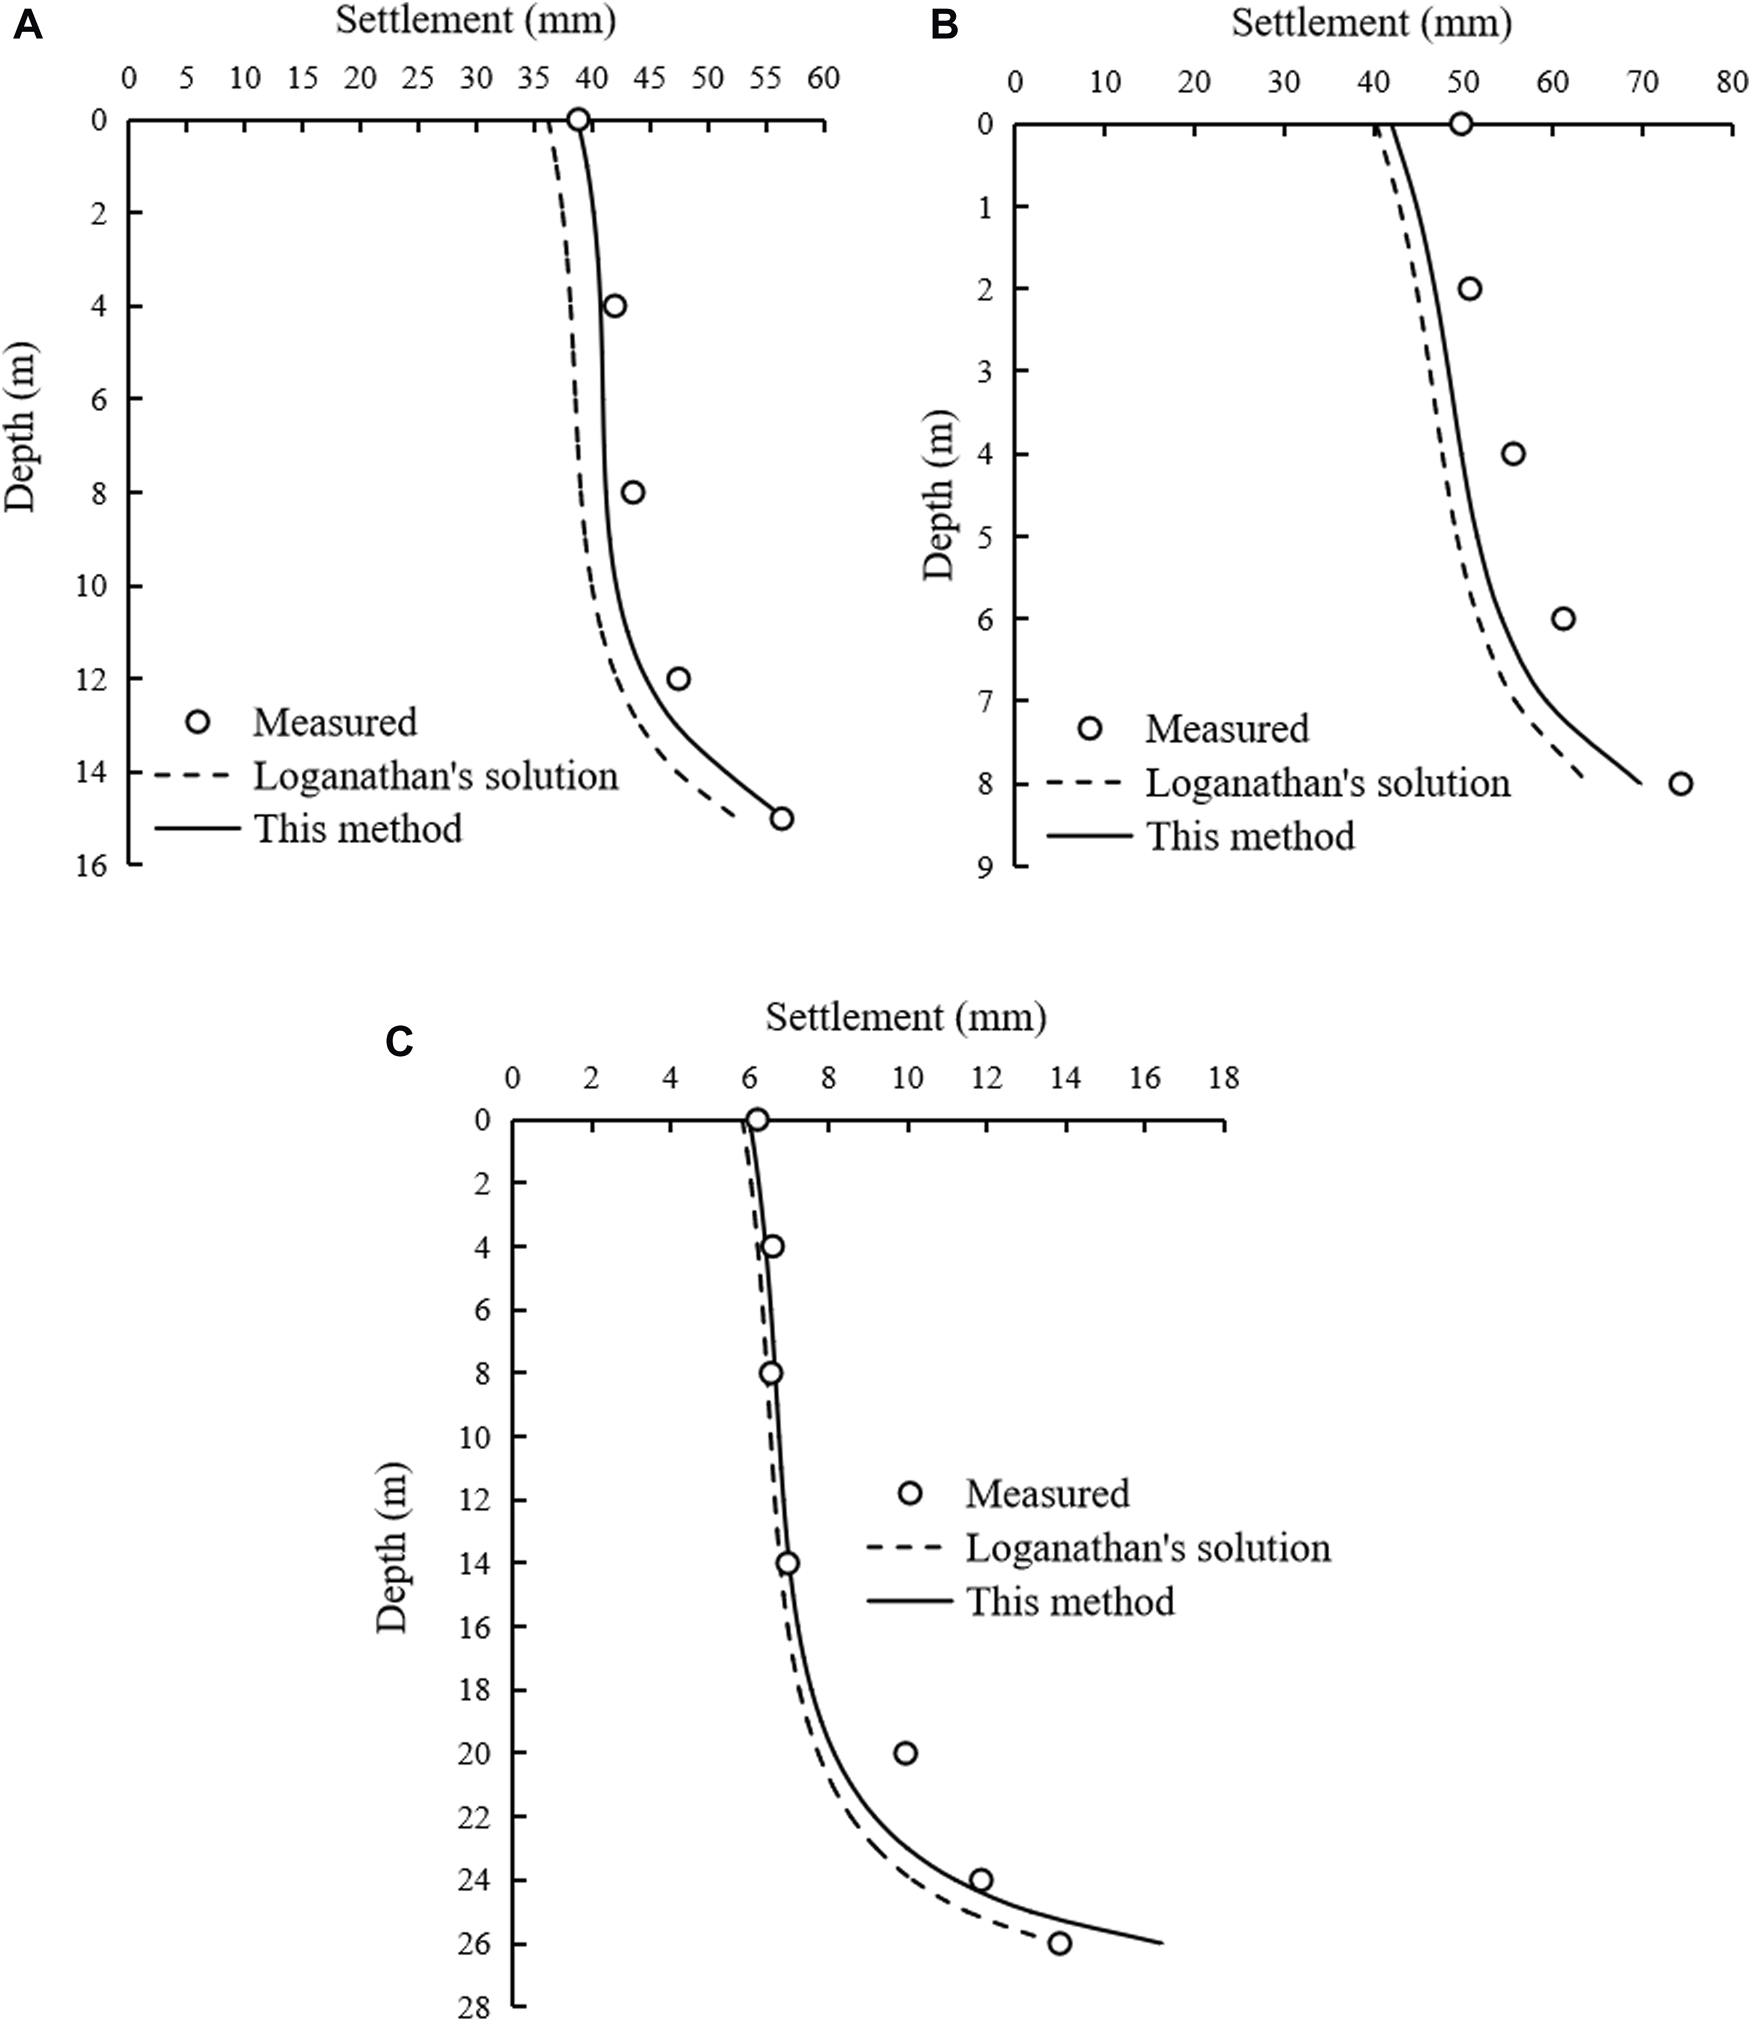
Settlement above the tunnel center induced by general circular tunneling: (A) Heathrow Express Trail Tunnel; (B) Thunder Bay Tunnel; (C) Green Park Tunnel.
Figure 8 shows the horizontal deformations of soils with the same transverse distance from the tunnel center at different depths. It can be seen that the performance of this method is better than that of Loganathan’s solution for the soils above the tunnel, whereas is worse for the soils below the tunnel. The RMSE value of horizontal soil deformation, denoted by RMSEUZ, is shown in Table 3. The RMSEUZ value from this method are slightly greater than those obtained from Loganathan’s solution.
FIGURE 8
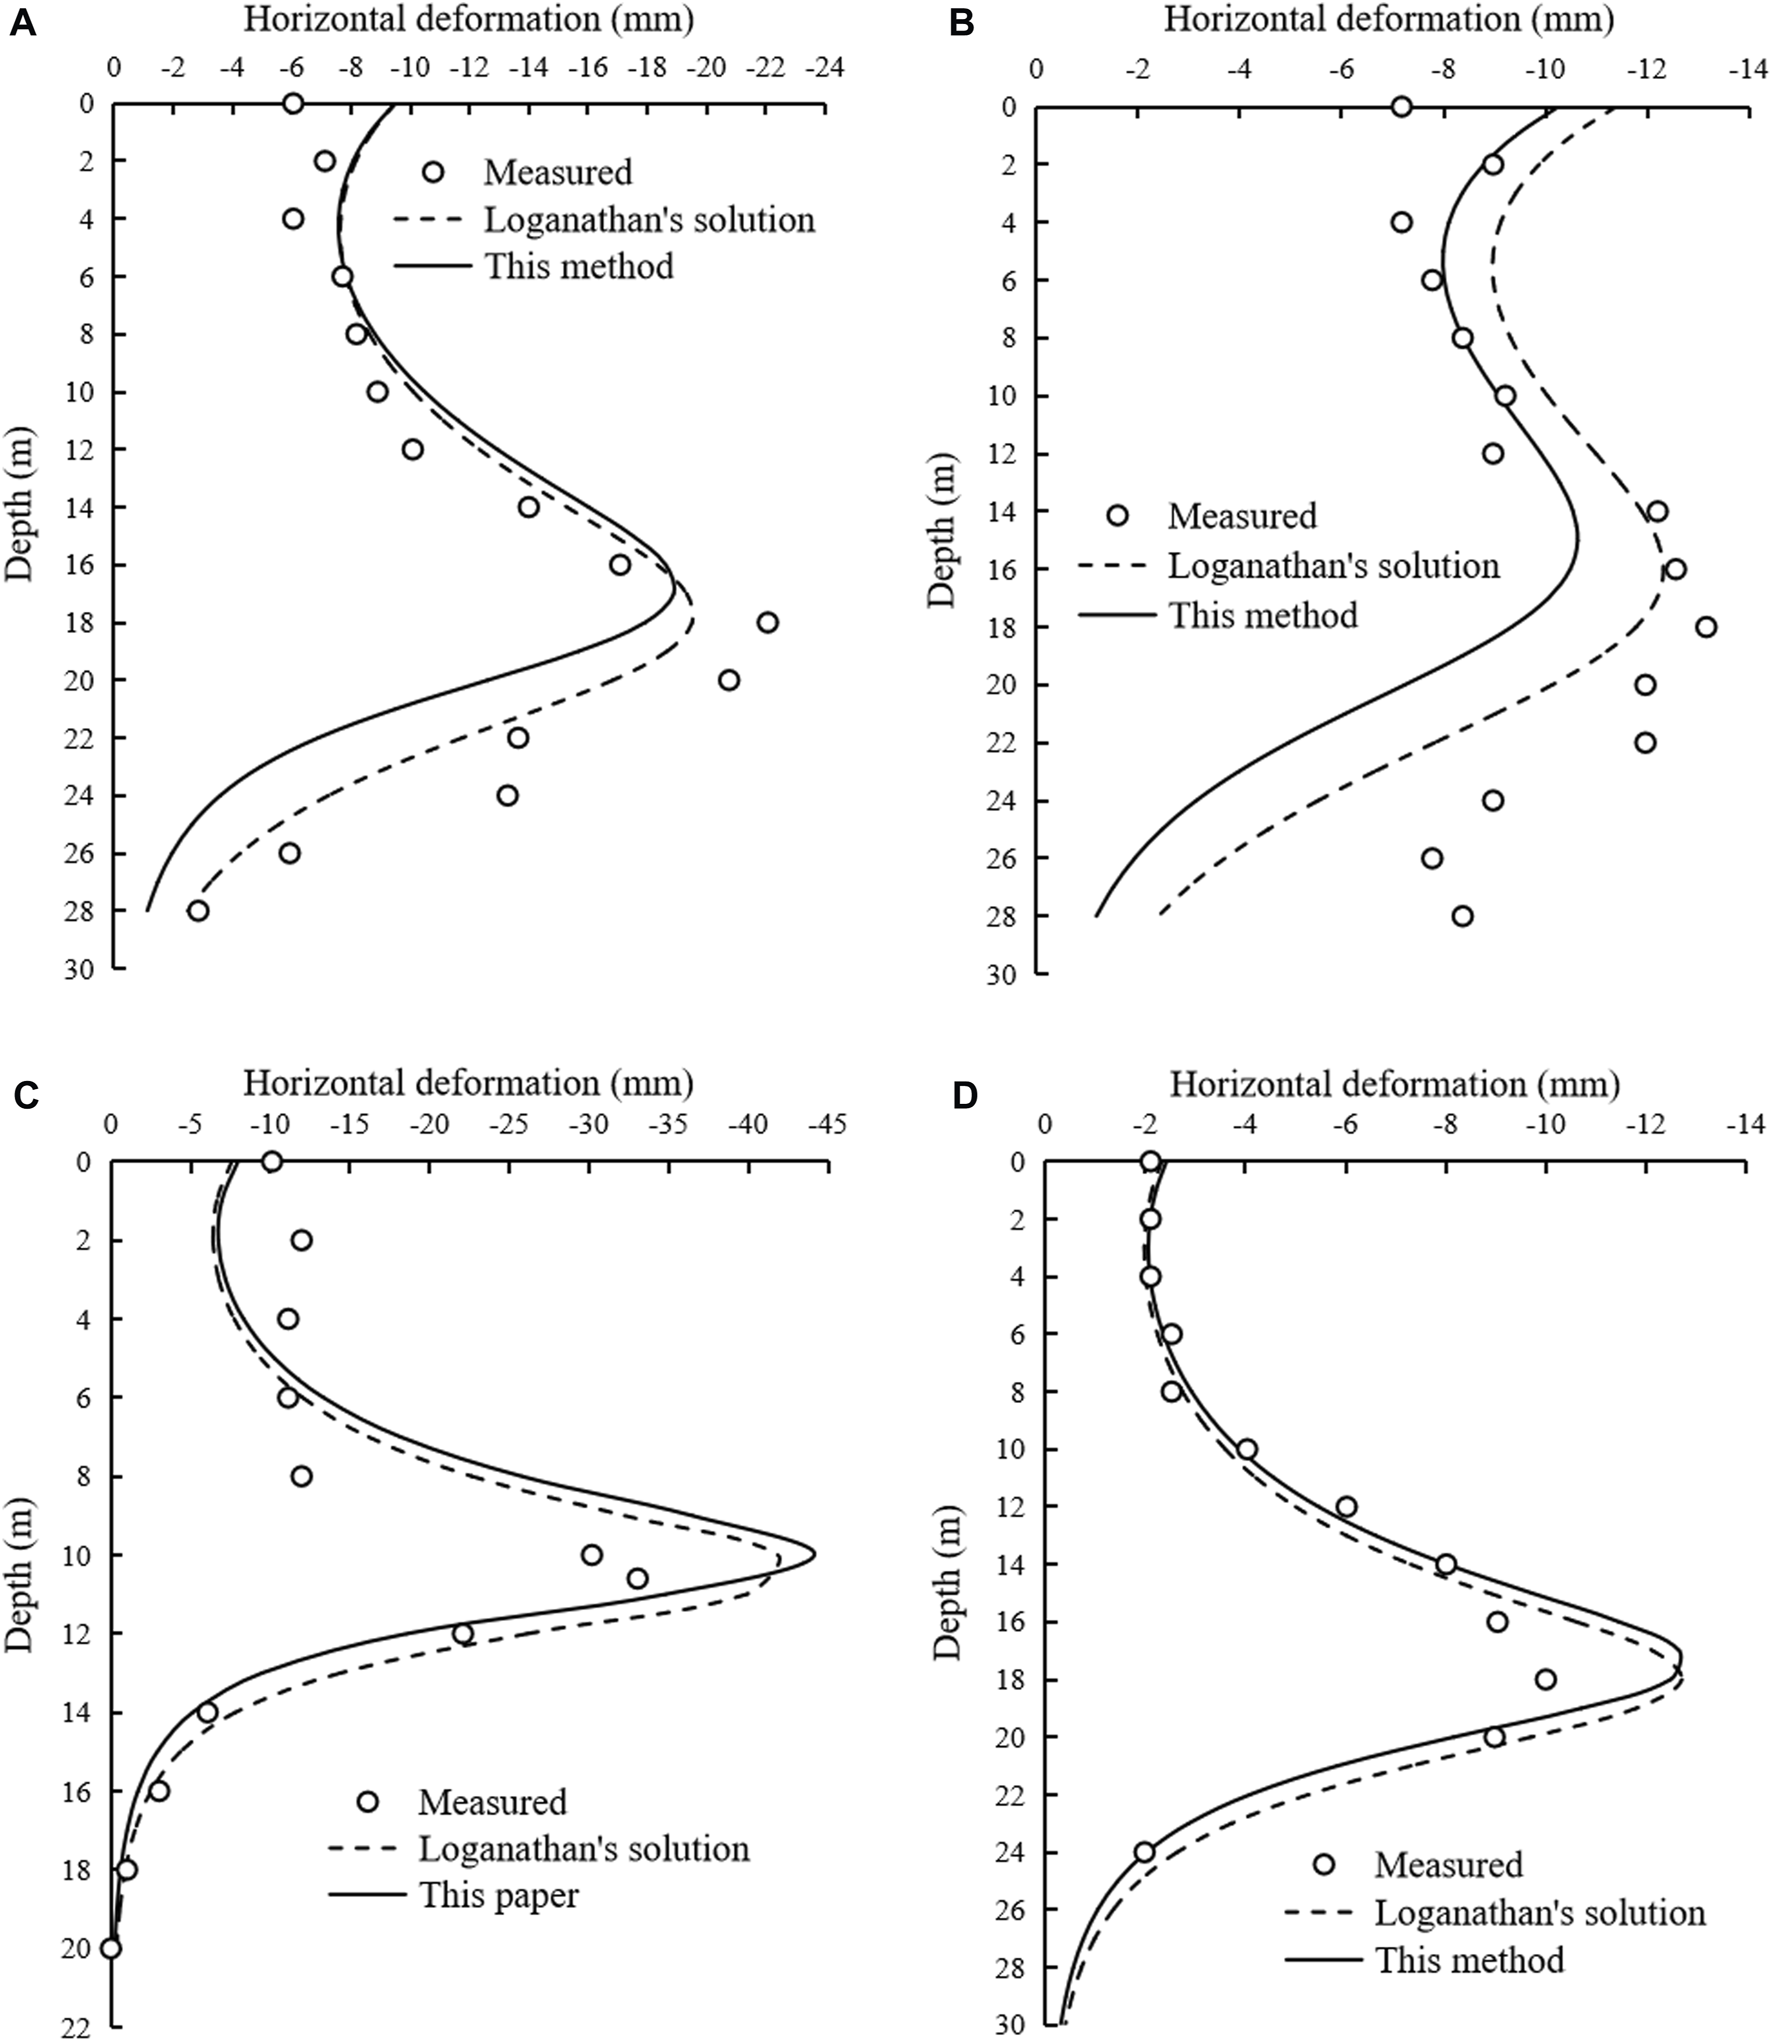
Horizontal deformation induced by general circular tunneling: (A) Heathrow Express Trail Tunnel: x = 6 m; (B) Heathrow Express Trail Tunnel: x = 9 m; (C) Thunder Bay Tunnel: x = 2.2 m; (D) Sewer Tunnel, Bangkok: x = 4 m.
As a whole, the performance of this method is better than that of Loganathan’s solution, especially for the prediction of soil settlement. Therefore, the reliability of this proposed method is verified.
4.2 DOT shield tunneling
The lot 9 of Shanghai metro line 6 was constructed by DOT shield tunneling. The DOT shield machine was manufactured by the Japanese Ishikawajima-Harima Heavy Industries (IHI), with 6,520 mm in external diameter and 11,120 mm in external width, and 6,370 mm in inner diameter and 10,970 mm in inner width. The length of the DOT shield machine was 7,880 mm The lining of the DOT shield tunnel was made up by the prefabricated reinforced concrete components, and each ring of the lining consisted of 11 components. The process of assembling the lining was described by Chow (2006) in detail. The geological condition of the DOT shield tunnel is illustrated in Table 4. Herein the monitored sections at the 100th and 130th ring are studied, labeled by R100 and R130. The relevant calculation parameters of soil deformation in the sections are listed in Table 5.
TABLE 4
| Soil layers | Thickness (m) | Elastic modulus, Eu (MPa) | Soil weight, γ (kN/m3) | Poisson’s ratio of soil, ν | Cohesion, Cu (kPa) | Internal friction angle, ϕ (o) |
|---|---|---|---|---|---|---|
| Miscellaneous fill | 1.00–4.00 | 4.31 | 19.1 | 0.32 | 27 | 22.0 |
| Isabelline silty clay | 0.60–2.20 | 3.24 | 18.2 | 0.28 | 23 | 20.0 |
| Gray muddy silty clay | 0.50–4.10 | 8.36 | 17.3 | 0.28 | 13 | 18.5 |
| Gray clayey silt and silty clay | 0.60–3.50 | 3.44 | 18.2 | 0.28 | 13 | 35.0 |
| Gray muddy silty clay | 1.00–4.30 | 2.17 | 17.2 | 0.35 | 13 | 16.0 |
| Gray muddy clay | 7.00–10.00 | 3.23 | 16.6 | 0.35 | 14 | 11.0 |
| Gray clay | 2.20–5.90 | 3.94 | 17.2 | 0.32 | 16 | 14.0 |
Soil conditions in the project of lot 9 of Shanghai metro line 6 (Zeng et al., 2016).
TABLE 5
| Ring number | R100 | R130 | |
|---|---|---|---|
| Poisson’s ratio of soil, ν | 0.33 | 0.33 | |
| Excavated diameter, D (m) | 6.52 | 6.52 | |
| Half of the distance between two tunnel center, t (m) | 2.3 | 2.3 | |
| Depth of tunnel center, h (m) | 14.32 | 14.32 | |
| Equivalent ground loss parameter, g (mm) | 39.24 | 29.41 | |
| Maximum surface settlement (mm) | Predicted | 26.70 | 19.48 |
| Measured | 25.52 | 20.66 | |
| Predicted trough width (m) | 7.2 | 7.3 | |
| RMSEWX (mm) | 3.10 | 1.86 | |
Calculation parameters of soil deformation induced by DOT shield tunneling and surface deformations.
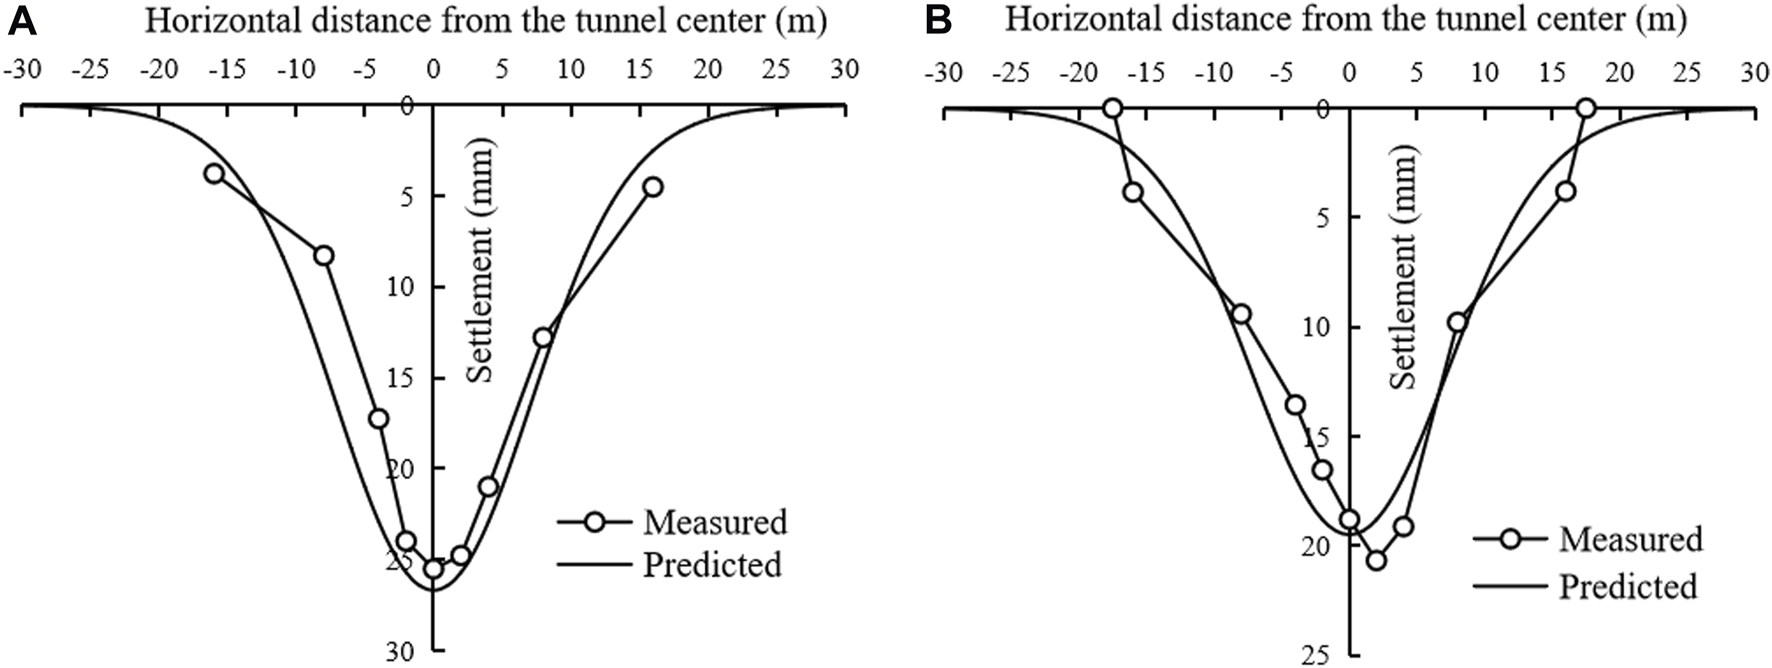
The predicted and measured surface settlements in the two sections are shown in Figure 9. The shape of the surface settlement curve is similar to that in the general single circular tunnel, i.e. an inverted Gaussian curve (Peck, 1969). The maximum surface settlement and the predicted surface settlement trough width are presented in Table 5. It can be seen that the predicted maximum surface settlements are very close to the measured ones. The surface settlement trough widths are ∼7.2 m The RMSE values of surface settlements in the sections R100 and R130, denoted by RMSEWZ in Table 5, are 3.10 mm and 1.86 mm, respectively.
FIGURE 9
Surface settlement induced by DOT shield tunneling: (A) R100; (B) R130.
To analyze the impact of the depth on the soil deformation, taking the section R100 as an example, the soil settlement and horizontal deformation at different depths are shown in Figures 10A–D. With the increase of the soil depth, the settlement of soil above the tunnel center increases slightly first and then decreases dramatically, and the settlement trough width keeps decreasing, which changes the shape of the settlement curve from “V” to “W”. The maximum settlement of soil above the tunnel center is ∼28.00 mm and occurs at ∼3.06 m below the ground. On the other hand, with the increase of the soil depth, the maximum horizontal deformation decreases first and then increases, and the corresponding transverse distance from the tunnel center almost keeps decreasing. Particularly, for the soil at ∼3.61 m depth, the maximum horizontal deformation is ∼4.94 m, which occurs at a transverse distance of ∼7.32 m from the tunnel center, and is smaller than the maximum horizontal deformations at other depths above the tunnel.
FIGURE 10
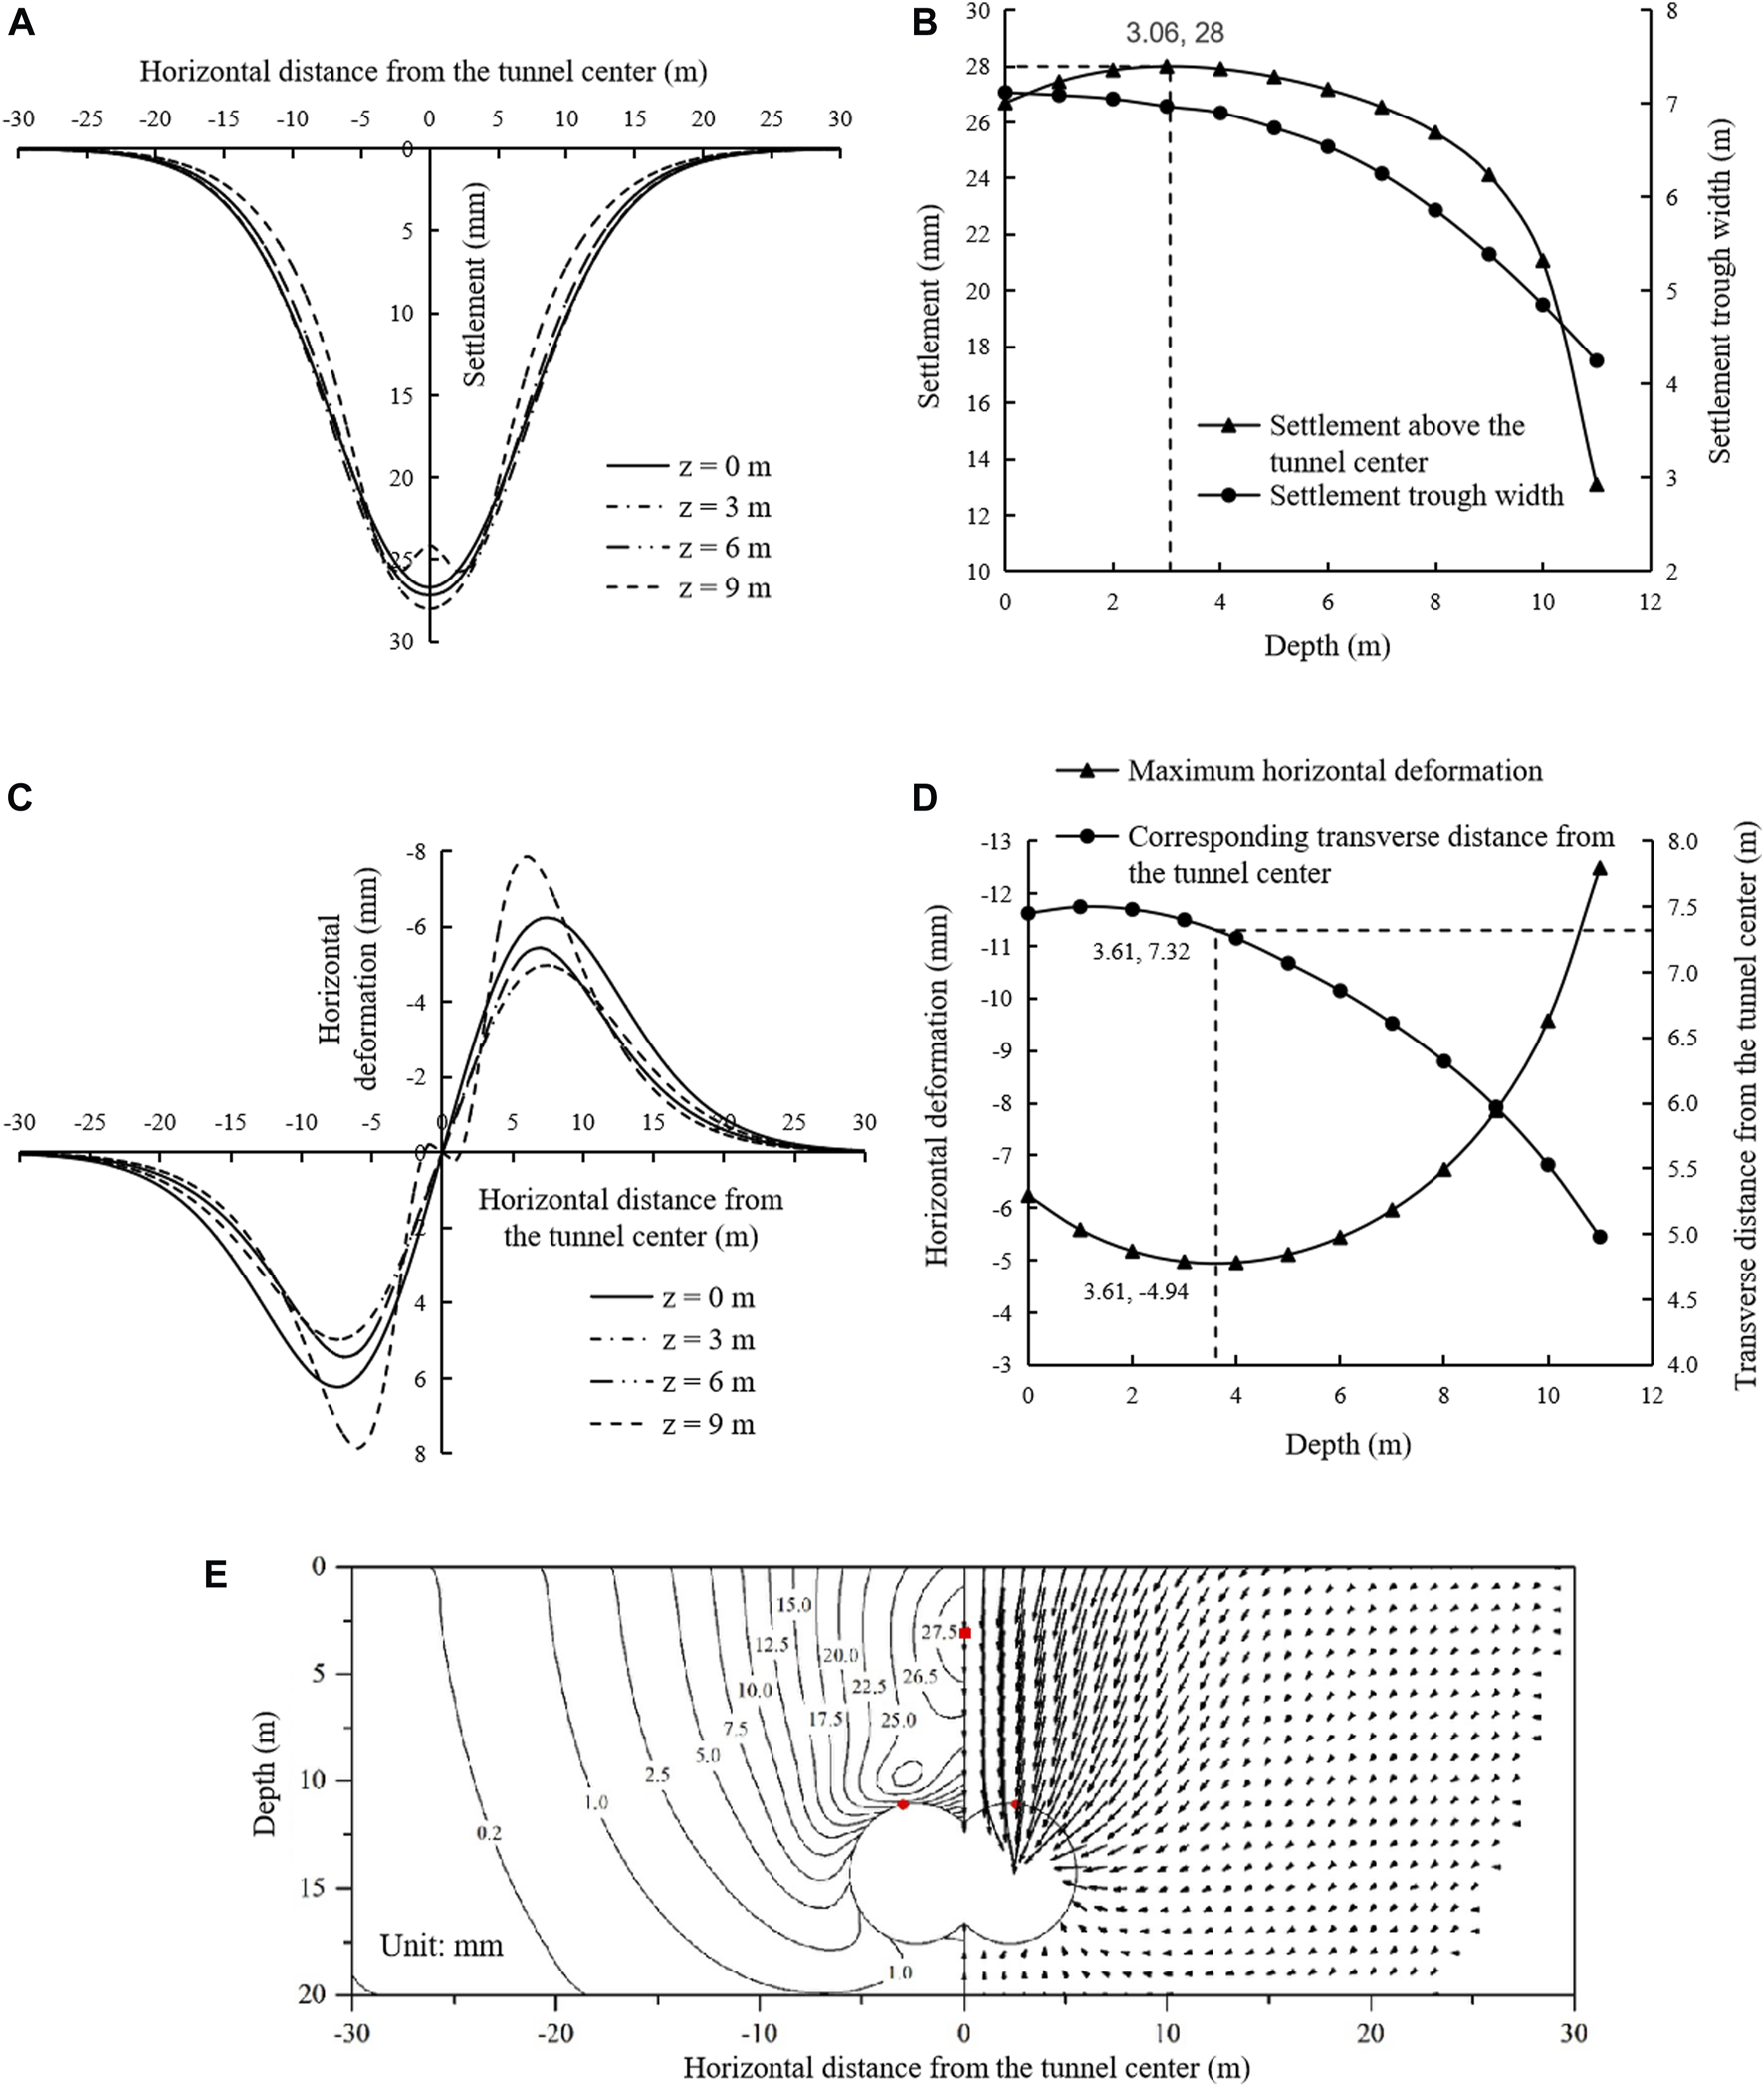
Soil deformations at R100 induced by DOT shield tunneling: (A) settlement curve; (B) characteristic settlement parameters; (C) horizontal deformation curve; (D) maximum horizontal deformation and position; (E) Soil deformation field.
Figure 10E shows the deformation field at the section R100 induced by DOT shield tunneling, where the left part is a contour map and the right part is a vector diagram. As marked by a small rectangular block in Figure 10E, the maximum deformation of soil above the DOT shield tunnel center is ∼28.00 mm and its position is at ∼3.06 m below the ground, which are the same as the maximum soil settlement and location in Figures 10A,B, due to no horizontal deformations above the DOT shield tunnel. In the whole section, the maximum deformation is ∼32.04 mm, and occurs at ∼11.10 m depth and at a transverse distance of ∼2.93 m from the tunnel center (almost on the top of the left and right tunnels), marked by a small circular block in Figure 10E.
5 Conclusion
Based on elasticity theory solution for predicting single circular tunneling-induced soil deformation, this paper first derived the soil deformation due to unit ground loss. Assuming that the tunneling-induced ground loss could be divided into infinite ground loss elements and the soil deformation induced by the overall ground loss was equal to the sum of deformation due to each unit ground loss, a unified method for predicting the soil deformation induced by a random shaped section tunnel construction was proposed, and the expressions were presented in two forms (Cartesian coordinate form and polar coordinate form). Subsequently, the unified method was applied to evaluate the soil deformation induced by the general single circular tunneling and DOT shield tunneling. Through the analysis of several cases, the following conclusions can be summarized.
(1) For general single circular tunneling, the maximum surface settlement predicted by this method is greater than that obtained from Loganathan’s solution, and the surface settlement trough width is smaller. With the increase of the soil depth, the predicted settlement of soil above the tunnel center by this method is always larger than that by Loganathan’s solution. In most cases, the predicted horizontal deformation of soil above the tunnel by this method is slightly larger than that by Loganathan’s solution, whereas that below the tunnel by this method is smaller.
(2) Compared with the measured values, for the soil settlement, the performance of this method is better than that of Loganathan’s solution through calculating the EMSE value. Nevertheless, for the horizontal soil deformation, the latter is slightly better than the former.
(3) For DOT shield tunneling, compared with the measured surface settlements, the predicted results by this method are reliable. With the increase of the soil depth, the settlement of soil above the DOT shield tunnel increases slightly first and then decreases, and the settlement trough width keeps decreasing. Meanwhile, the maximum horizontal soil deformation decreases first and then increases.
(4) The unified prediction method can be used flexibly to compute not only the soil deformation induced by random shaped section tunneling but also the deformation of soil at an arbitrary position in the section, and therefore is of a wide applicability.
Statements
Data availability statement
The original contributions presented in the study are included in the article/Supplementary Material, further inquiries can be directed to the corresponding author.
Author contributions
BZ: writing—original draft preparation; RM: writing—review and editing; DH: resources, data curation; SY: validation and investigation; CY: project administration; HC: supervision and review.
Funding
This research was funded by the National Natural Science Foundation of China (Grant No. 42202322), the Science and Technology Research Program of Chongqing Municipal Education Commission (Grant No. KJQN202200719), China Postdoctoral Science Foundation (Grant No. 2019M653343), Chongqing Postdoctoral Science Foundation (Grant No. cstc2019jcyj-bshX0125) and Key Laboratory of Geological Hazards on Three Gorges Reservoir Area (China Three Gorges University), Ministry of Education (Grant No. 2018KDZ08).
Conflict of interest
Authors BZ and HC were employed by the company China Merchants Chongqing Communications Technology Research and Design Institute Co., Ltd.
The remaining authors declare that the research was conducted in the absence of any commercial or financial relationships that could be construed as a potential conflict of interest.
Publisher’s note
All claims expressed in this article are solely those of the authors and do not necessarily represent those of their affiliated organizations, or those of the publisher, the editors and the reviewers. Any product that may be evaluated in this article, or claim that may be made by its manufacturer, is not guaranteed or endorsed by the publisher.
References
1
Attewell P. B. (1978). “Ground movements caused by tunnelling in soil,”. Conference on large ground movements and structures (London: Pentech Press), 948, 812–948.
2
Avgerinos V. Potts D. M. Standing J. (2016). The use of kinematic hardening models for predicting tunnelling-induced ground movements in London clay. Géotechnique66 (2), 106–120. 10.1680/jgeot.15.p.035
3
Bilotta E. (2008). Use of diaphragm walls to mitigate ground movements induced by tunnelling. Géotechnique58 (2), 143–155. 10.1680/geot.2008.58.2.143
4
Bobet A. (2001). Analytical solutions for shallow tunnels in saturated ground. J. Eng. Mech.127 (12), 1258–1266. 10.1061/(asce)0733-9399(2001)127:12(1258)
5
Bym T. Marketos G. Burland J. B. O'Sullivan C. (2013). Use of a two-dimensional discrete-element line-sink model to gain insight into tunnelling-induced deformations. Géotechnique63 (9), 791–795. 10.1680/geot.12.t.003
6
Chow B. (2006). Double-O-tube shield tunneling technology in the Shanghai rail transit project. Tunn. Undergr. Space Technol.21 (6), 594–601. 10.1016/j.tust.2005.11.003
7
Cui S. Pei X. Jiang Y. Wang G. Fan X. Yang Q. et al (2021). Liquefaction within a bedding fault: Understanding the initiation and movement of the Daguangbao landslide triggered by the 2008 Wenchuan Earthquake (Ms = 8.0). Eng. Geol.295, 106455. 10.1016/j.enggeo.2021.106455
8
Cui S. Pei X. Yang H. Yang Q. Zhu L. (2022). Earthquake-induced stress amplification and rock fragmentation within a deep-seated bedding fault: Case study of the Daguangbao landslide triggered by the 2008 Wenchuan earthquake (Ms=8.0). Lithosphere2021 (7), 6387274. 10.2113/2022/6387274
9
Fang Y. S. Kao C. C. Shiu Y. F. (2012). Double-O-tube shield tunneling for Taoyuan international airport access MRT. Tunn. Undergr. Space Technol.30, 233–245. 10.1016/j.tust.2012.03.001
10
Fargnoli V. Gragnano C. G. Boldini D. Amorosi A. (2015). 3D numerical modelling of soil–structure interaction during EPB tunnelling. Géotechnique65 (1), 23–37. 10.1680/geot.14.p.091
11
Franzius J. N. Potts D. M. Burland J. B. (2005). The influence of soil anisotropy and K 0 on ground surface movements resulting from tunnel excavation. Géotechnique55 (3), 189–199. 10.1680/geot.2005.55.3.189
12
Gui M. W. Chen S. L. (2013). Estimation of transverse ground surface settlement induced by DOT shield tunneling. Tunn. Undergr. Space Technol.33, 119–130. 10.1016/j.tust.2012.08.003
13
Huang D. Zeng B. (2017). Influence of double-o-tube shield rolling on soil deformation during tunneling. Int. J. Geomech.17 (11), 04017105. 10.1061/(asce)gm.1943-5622.0001008
14
Lee K. M. Rowe R. K. Lo K. Y. (1992). Subsidence owing to tunnelling. I. Estimating the gap parameter. Can. Geotech. J.29 (6), 929–940. 10.1139/t92-104
15
Li H. He Y. Xu Q. Deng J. Li W. Wei Y. (2022). Detection and segmentation of loess landslides via satellite images: A two-phase framework. Landslides19, 673–686. 10.1007/s10346-021-01789-0
16
Loganathan N. Poulos H. G. (1998). Analytical prediction for tunneling-induced ground movements in clays. J. Geotech. Geoenviron. Eng.124 (9), 846–856. 10.1061/(asce)1090-0241(1998)124:9(846)
17
Loganathan N. Poulos H. G. Stewart D. P. (2000). Centrifuge model testing of tunnelling-induced ground and pile deformations. Geotechnique50 (3), 283–294. 10.1680/geot.2000.50.3.283
18
Maeda M. Kushiyama K. (2005). Use of compact shield tunneling method in urban underground construction. Tunn. Undergr. Space Technol.20 (2), 159–166. 10.1016/j.tust.2003.11.008
19
Mair R. J. (1996). “General report on settlement effects of bored tunnels,” in Fourth international symposium of international conference of geotechnical aspects on underground construction in soft (Rotterdam, Netherlands: A. A. Balkema), 43–53.
20
Mair R. J. Taylor R. N. Bracegirdle A. (1993). Subsurface settlement profiles above tunnels in clays. Geotechnique43 (2), 315–320. 10.1680/geot.1993.43.2.315
21
Mair R. J. (2008). Tunnelling and geotechnics: New horizons. Géotechnique58 (9), 695–736. 10.1680/geot.2008.58.9.695
22
Mohamad H. Bennett P. J. Soga K. Mair R. J. Bowers K. (2010). Behaviour of an old masonry tunnel due to tunnelling-induced ground settlement. Géotechnique60 (12), 927–938. 10.1680/geot.8.p.074
23
Nakamura H. Kubota T. Furukawa M. Nakao T. (2003). Unified construction of running track tunnel and crossover tunnel for subway by rectangular shape double track cross-section shield machine. Tunn. Undergr. Space Technol.18 (2), 253–262. 10.1016/s0886-7798(03)00034-8
24
Ng C. W. Wang R. Boonyarak T. (2016). A comparative study of the different responses of circular and horseshoe-shaped tunnels to an advancing tunnel underneath. Géotechnique Lett.6 (2), 168–175. 10.1680/jgele.16.00001
25
O'Reilly M. P. New B. M. (1982). “Settlements above tunnels in the United Kingdom-their magnitude and prediction,” in Proceedings of the tunnelling 82, institution of mining and metallurgy (London: Pentech Press), 173–181.
26
Osman A. S. Bolton M. D. Mair R. J. (2006). Predicting 2D ground movements around tunnels in undrained clay. Geotechnique56 (9), 597–604. 10.1680/geot.2006.56.9.597
27
Park K. H. (2005). Analytical solution for tunnelling-induced ground movement in clays. Tunn. Undergr. Space Technol.20 (3), 249–261. 10.1016/j.tust.2004.08.009
28
Park K. H. (2004). Elastic solution for tunneling-induced ground movements in clays. Int. J. Geomech.4 (4), 310–318. 10.1061/(asce)1532-3641(2004)4:4(310)
29
Peck R. B. (1969). “Deep excavations and tunneling in soft ground: State of the art report,” in Proceedings of the 7th international conference on soil mechanics and foundation engineering (Mexico City, 225–290.
30
Puzrin A. M. Burland J. B. Standing J. R. (2012). Simple approach to predicting ground displacements caused by tunnelling in undrained anisotropic elastic soil. Géotechnique62 (4), 341–352. 10.1680/geot.10.p.127
31
Sagaseta C. (1987). Analysis of undrained soil deformation due to ground loss. Géotechnique37 (3), 301–320. 10.1680/geot.1987.37.3.301
32
Shen S. L. Horpibulsuk S. Liao S. M. Peng F. L. (2009). Analysis of the behavior of DOT tunnel lining caused by rolling correction operation. Tunn. Undergr. Space Technol.24 (1), 84–90. 10.1016/j.tust.2008.05.003
33
Shen S. L. Du Y. J. Luo C. Y. (2010). Evaluation of the effect of rolling correction of double-o-tunnel shields via one-side loading. Can. Geotech. J.47 (10), 1060–1070. 10.1139/t10-013
34
Simpson B. Tatsuoka F. (2008). Geotechnics: The next 60 years. Géotechnique58 (5), 357–368. 10.1680/geot.2008.58.5.357
35
Stallebrass S. E. Grant R. J. Taylor R. N. (1996). “A finite element study of ground movements measured in centrifuge model tests of tunnels,” in Proceedings of the international symposium on geotechnical aspects of underground construction in soft ground. Editors MairR. J.TaylorR. N. (Rotterdam, Netherlands: A. A. Balkema).
36
Standing J. R. Burland J. B. (2006). Unexpected tunnelling volume losses in the Westminster area, London. Géotechnique56 (1), 11–26. 10.1680/geot.2006.56.1.11
37
Verruijt A. (1997). A complex variable solution for a deforming circular tunnel in an elastic half-plane. Int. J. Numer. Anal. Methods Geomech.21 (2), 77–89. 10.1002/(sici)1096-9853(199702)21:2<77:aid-nag857>3.0.co;2-m
38
Verruijt A. Booker J. R. (1996). Surface settlements due to deformation of a tunnel in an elastic half plane. Géotechnique46 (4), 753–756. 10.1680/geot.1996.46.4.753
39
Wan M. S. P. Standing J. R. Potts D. M. Burland J. B. (2017). Measured short-term ground surface response to EPBM tunnelling in London Clay. Géotechnique67 (5), 420–445. 10.1680/jgeot.16.p.099
40
Wongsaroj J. Soga K. Mair R. J. (2007). Modelling of long-term ground response to tunnelling under St James's Park, London. Géotechnique57 (1), 75–90. 10.1680/geot.2007.57.1.75
41
Wongsaroj J. Soga K. Mair R. J. (2013). Tunnelling-induced consolidation settlements in london clay. Géotechnique63 (13), 1103–1115. 10.1680/geot.12.p.126
42
Wood A. M. (1975). The circular tunnel in elastic ground. Géotechnique25 (1), 115–127. 10.1680/geot.1975.25.1.115
43
Yang J. S. Liu B. C. Wang M. C. (2004). Modeling of tunneling-induced ground surface movements using stochastic medium theory. Tunn. Undergr. Space Technol.19 (2), 113–123. 10.1016/j.tust.2003.07.002
44
Yang X. L. Wang J. M. (2011). Ground movement prediction for tunnels using simplified procedure. Tunn. Undergr. Space Technol.26 (3), 462–471. 10.1016/j.tust.2011.01.002
45
Zeng B. Huang D. He J. (2016). Analysis of double-O-tube shield tunnelling-induced soil deformation due to ground loss. Géotechnique Lett.6 (1), 7–15. 10.1680/jgele.15.00099
46
Zeng B. Huang D. (2016). Soil deformation induced by Double-O-Tube shield tunneling with rolling based on stochastic medium theory. Tunn. Undergr. Space Technol.60, 165–177. 10.1016/j.tust.2016.09.001
47
Zeng B. Zhu Y. Ye S. Zheng Y. He L. Ma R. (2022). Double-o-tube shield tunneling-induced soil displacement considering burial depth and convergence mode: Transparent soil experiment and DEM simulation. Front. Earth Sci. (Lausanne).10, 925356. 10.3389/feart.2022.925356
48
Zhou J. Wei J. Yang T. Zhang P. Liu F. Chen J. (2021). Seepage channel development in the crown pillar: Insights from induced microseismicity. Int. J. Rock Mech. Min. Sci.145, 104851. 10.1016/j.ijrmms.2021.104851
49
Zymnis D. M. Chatzigiannelis I. Whittle A. J. (2013). Effect of anisotropy in ground movements caused by tunnelling. Géotechnique63 (13), 1083–1102. 10.1680/geot.12.p.056
Summary
Keywords
soil deformation, tunnels and tunnelling, double-O-tube (DOT) shield, analytical method, special-section tunnel
Citation
Zeng B, Ma R, Huang D, Ye S, Yang C and Chai H (2023) A unified method of predicting soil deformations induced by various shaped-section tunnelling in clays. Front. Earth Sci. 10:1031332. doi: 10.3389/feart.2022.1031332
Received
29 August 2022
Accepted
26 October 2022
Published
11 January 2023
Volume
10 - 2022
Edited by
Shenghua Cui, Chengdu University of Technology, China
Reviewed by
Xiaocheng Huang, Hunan University of Science and Technology, China
Hao Cheng, Wuhan University, China
Updates
Copyright
© 2023 Zeng, Ma, Huang, Ye, Yang and Chai.
This is an open-access article distributed under the terms of the Creative Commons Attribution License (CC BY). The use, distribution or reproduction in other forums is permitted, provided the original author(s) and the copyright owner(s) are credited and that the original publication in this journal is cited, in accordance with accepted academic practice. No use, distribution or reproduction is permitted which does not comply with these terms.
*Correspondence: Chao Yang, yangchao0615@ctgu.edu.cn
This article was submitted to Geohazards and Georisks, a section of the journal Frontiers in Earth Science
Disclaimer
All claims expressed in this article are solely those of the authors and do not necessarily represent those of their affiliated organizations, or those of the publisher, the editors and the reviewers. Any product that may be evaluated in this article or claim that may be made by its manufacturer is not guaranteed or endorsed by the publisher.