 Xiang Fu1*
 Hongda Liu
- 1College of Mining, Liaoning Technical University, Fuxin, China
- 2College of Safety Science and Engineering, Liaoning Technical University, Fuxin, China
In order to quantitatively characterize the pore structure of thermally contacted metamorphic coal by igneous intrusion and investigate the intrinsic connection between the pore and dispersion properties of coal, the samples of metamorphic coal from different locations of Daxing Coal Mine were collected and processed. The correlative analysis on pore characteristics, including pore area, perimeter, shape factor and fractal dimension of pores with different sizes, were carried out by using scanning electron microscopy (SEM) and pore-fracture analysis system (PCAS). The results show that the porosity of macro- and meso-pores and the number of pores in the metamorphic coal are larger than those of the normal coal. The total length of pores per unit area and the average shape factor increase, and the connectivity of pore is raised, resulting in an enhanced gas release capacity (increased V1) within the first one second. The proportion of gas emission in the first one second of metamorphic coal is much higher than that of other coals. The decrease of pore volume and specific surface area of micropores makes the adsorption capacity weaker, which results in a decrease in the total amount of emission - smaller Δp value, and earlier inflection point and faster attenuation on the emission curve, namely an increased α value. In addition, the V1, α value and volatile content satisfy the quadratic nonlinear and linear relationships, respectively. In the prediction of outburst risk of thermally contacted metamorphic coal, it is more reasonable to use the V1 index to characterize the gas release rate.
Introduction
China’s northeast region is rich in coal resources, but igneous intrusion is common Igneous rock activity in Tiefa Daxing Coal Mine is much developed, which has direct correlation with coal and gas outbursts, and fire disasters. Therefore, the impact area of igneous rock on safe mining has become a significant issue.
Coal is a porous medium with dual structure of pores and fractures. The characteristics of pore structure have a controlling role in the behaviors of gas storage and transport (adsorption, diffusion and seepage), which will directly determine the gas emission of coal. The investigation on pore characteristics has a crucial role in the prevention of coal and gas outburst (Fu et al., 2017). Coal seams are subjected to different degrees of metamorphism by igneous intrusion, which changes the microstructure and macroscopically, as well as the adsorption and dispersion characteristics (Fan et al., 2022; Zhou et al., 2022). As a result, the gas outburst risk of coal seams is changed. The metamorphism raised by igneous intrusion includes regional metamorphism, contacted metamorphism, and dynamic metamorphism. Due to the different period and mode of metamorphism, the regional metamorphism has obvious influence on coal seam zoning. The large scope of the action, the stable assignment of the metamorphic zone. Contacted metamorphic coal has small scope of action and unstable assignment of metamorphic zone, and is easy to form highly metamorphic coal (Arora et al., 2017; Fan et al., 2021; Teicherta et al., 2022).
The effect of soluble organic matter on the specific surface area pore volume, average pore size and porosity of coal has been researched (Yang et al., 2018). Some scholars concluded that the porosity of coal seam shows a change pattern of increasing and then decreasing as the distance to igneous rocks gets closer (Wang, 2015; Zhang et al., 2019). Li et al. studied the microscopic pore characteristics of coal by combining SEM-PCAS with gas adsorption methods (Li et al., 2022). Temperature has a significant transforming effect on the pore structure of coal, especially the macropore and microporous structure (Zhao et al., 2021). The quantitative analysis is also limited to the pore volume statistics.
Previous studies have verified that the initial velocity of gas emission increases with the degree of metamorphism (Liu and Wang, 2013; Song et al., 2019). The initial velocity of gas emission is experimentally related to the specific surface area of coal as a primary function (Luo, 1989; Wang et al., 2021). The larger the pore specific surface area, the smaller the initial velocity of gas emission (Wang et al., 2020). There is also a primary function between the specific surface area of micropores and the initial velocity of gas emission, and the initial velocity of gas emission decreases exponentially with the degree of metamorphism (Zhao et al., 2017). In conclusion, it is believed that the initial velocity of gas emission increases with the degree of metamorphism. Chinese scholars have used Δp (ie, Δp10-60, representing the emission amount from 10 s to 60 s) to characterize the gas emission rate of coal when carrying out the above researches. Although the Δp indicator has high practical value in field application, it is impossible to describe the microscopic characteristics of the release velocity curve in the first 60 s when conducting in-depth scientific research. Some literatures have mentioned that this indicator may have missed the outburst prediction in metamorphic coal by igneous intrusion. However, there are few literatures on the contacted metamorphic coal.
The scale, shape, structure, number, fractal and other factors of pore-fracture directly affect the gas emission characteristics of coal, and can also in turn infer and verify the coal microstructure. Pore-fracture analysis system (PCAS) is a special software for identifying and quantitatively analyzing pore systems and fracture systems, and PCAS has been successfully applied in quantitative identification and structural analysis of pore-fractures in geotechnical soils and shale pore-fractures (Liu et al., 2011; Lin et al., 2016; Wang et al., 2016; Liu et al., 2017; Wang et al., 2017; Zhao et al., 2020). In this paper, the microscopic characteristics of 5 coal samples of No. 9 coal in Daxing Coal Mine were researched and analyzed by using scanning electron microscope (SEM) and pore fracture analysis system (PCAS), and the emission velocity curve in the first 60 s were measured and described. The internal relationship between the microscopic characteristics of thermally contacted metamorphic coal and the macroscopic performance of the emission characteristics will be revealed to provide guidance for prevention of the gas disaster resulted from igneous rock intrusion.
Collection and description of coal samples
Collection of coal samples
The experimental coal samples was selected from the No. 9 coal seam in the North 2# mining area of Daxing Coal Mine. The coal seam is 4 m thick, with local basal shallow faience intrusions - mostly existing as a rock wall or a bed of intrusion along the top and bottom plate and locally engulfing the coal seam to form a coal-free zone, as shown in Figure 1. The gabbro intrusions in N2908 panel have been uncovered many times near the in-seam roadway and the open cut. Hence, they are the ideal sampling sites. 5 coal samples were collected this time, and the sampling locations are shown in Figure 2.
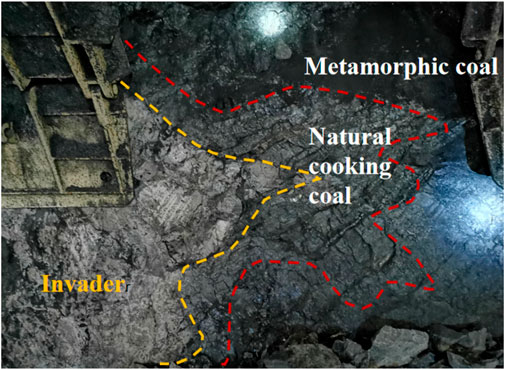
FIGURE 1. Thermally contacted metamorphic coal.
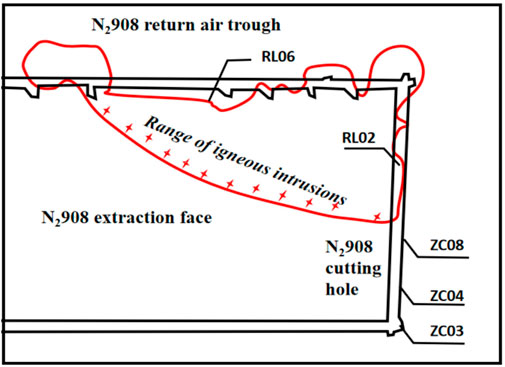
FIGURE 2. Location of sampling coals.
Industrial analysis of coal samples
The industrial analysis data of the coal samples is listed in Table 1. The coal distancing 8 m from the intrusion is characterized by the moisture of 4.46%, fixed carbon of 40.58%, ash of 10.11% and volatile matter of 44.85%. The change trend is not obvious. In the range of 0.4 m–5.5 m, the internal moisture of coal was heat gasified by the high temperature baking effect during the intrusion of igneous rocks, and the moisture content of all coal samples is lower than that of normal coal samples, with the lowest ∼1.58%. The ash content of coal with igneous intrusion increases from 10.11% to 19.29% compared to that of normal coal. As the distance from igneous intrusion decreases, the volatile content decreases from 44.85% to 8.89%, and the metamorphic area is obviously lower than normal coal. Due to the decrease of water and volatile matter, the percentage of fixed carbon increases, from 47.19% at 5.5 m to 69.55% at 0.4 m.
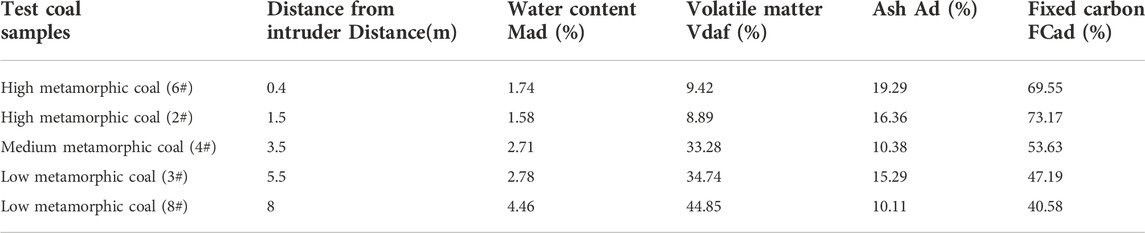
TABLE 1. Industrial analysis of coal samples.
Pore characteristics of contacted metamorphic coal samples
Observation of pore shape in coal samples using SEM
The SEM model Jsm-7800f was used to observe the pore shape in coal samples. The collected coal block was processed to be cubic samples with a size of 5 mm × 5 mm × 5 mm. The surface of these coal samples were coated with a layer of gold with a thickness of 5–10 nm to enhance the conductivity of the surface. Then the coated coal samples were put into the sample chamber, and evacuated it to 10∼3 Pa. The magnification of 500–100000 times were selected to observe the images. Problems of differences in scanned images caused by different scanning positions can be solved by using multi-point scanning.
The primary low-metamorphic coal in the No. 9 coal seam in the North Second Mining Area of Daxing Coal Mine has good homogeneity and integrity, as shown in Figure 3A. There are few 1um-level pores in this area, and pores can be seen above the magnification of 10,000. Pores are seen in all coal samples, but more in metamorphic coals, as shown in Figure 3B. Fast metamorphism rate is a significant external factor for the development of pores. Thermally contacted metamorphism is characterized by high temperature, low pressure, short time, fast metamorphism rate, and obvious gas generation peak. The solidified hydrocarbon-rich components in coal are easy to soften, flow and gasify, resulting in well development of the pores. A series of small-scale parallel fissures appear in the uniform vitrinite of metamorphic coal, which do not penetrate the entire sample, are perpendicular to the bedding without crossing the bedding plane. They are arranged in parallel at equal intervals and are not connected to each other, proving that these fissures are endogenous fissures in the process of coal metamorphism. As shown in Figure 3C, the shape of the hydrostatic fractures can be classified as plate shape. Breccia pores are distributed in all coal samples, but more developed in metamorphic coals with complex and changeable shapes and good connectivity, as shown in Figure 3D. Illite is present in the breccia pores of metamorphic coals (Hwang and Pini, 2019).
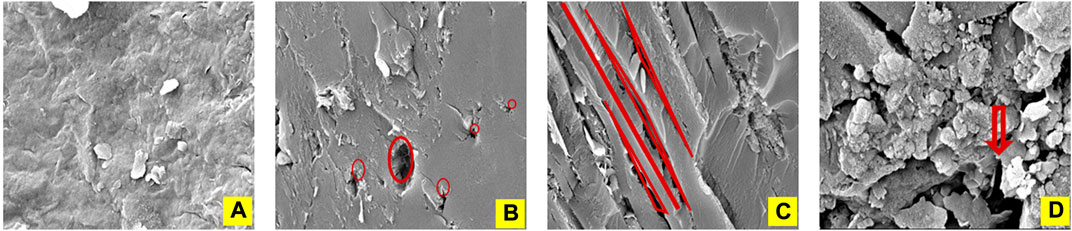
FIGURE 3. Types of coal pores at the test site.
Binarization of SEM images
The SEM images were analyzed by using PCAS, and the image unit radius was set to 1 pixel (pix) and the minimum analysis area was 5 pix. Coal pores were divided into four categories: micropores (<10 nm), small pores (10–100 nm), mesopores (100–1000 nm) and macropores (>1000 nm) (Huoduote, 1966). Due to the irregularity of the pore shape, on the SEM plane images, the circular area was used to classify the pores: micropores (<78.5 nm2), small pores (78.5–7850 nm2), and mesopores (7850–785000 nm2) and macropores (>785000 nm2) (Li et al., 2022). This method can better identify small, medium and large pores, but the accuracy of identifying micropores is poor even with a maximum 100000-fold SEM image. The images were binarized, as shown in Figure 4.
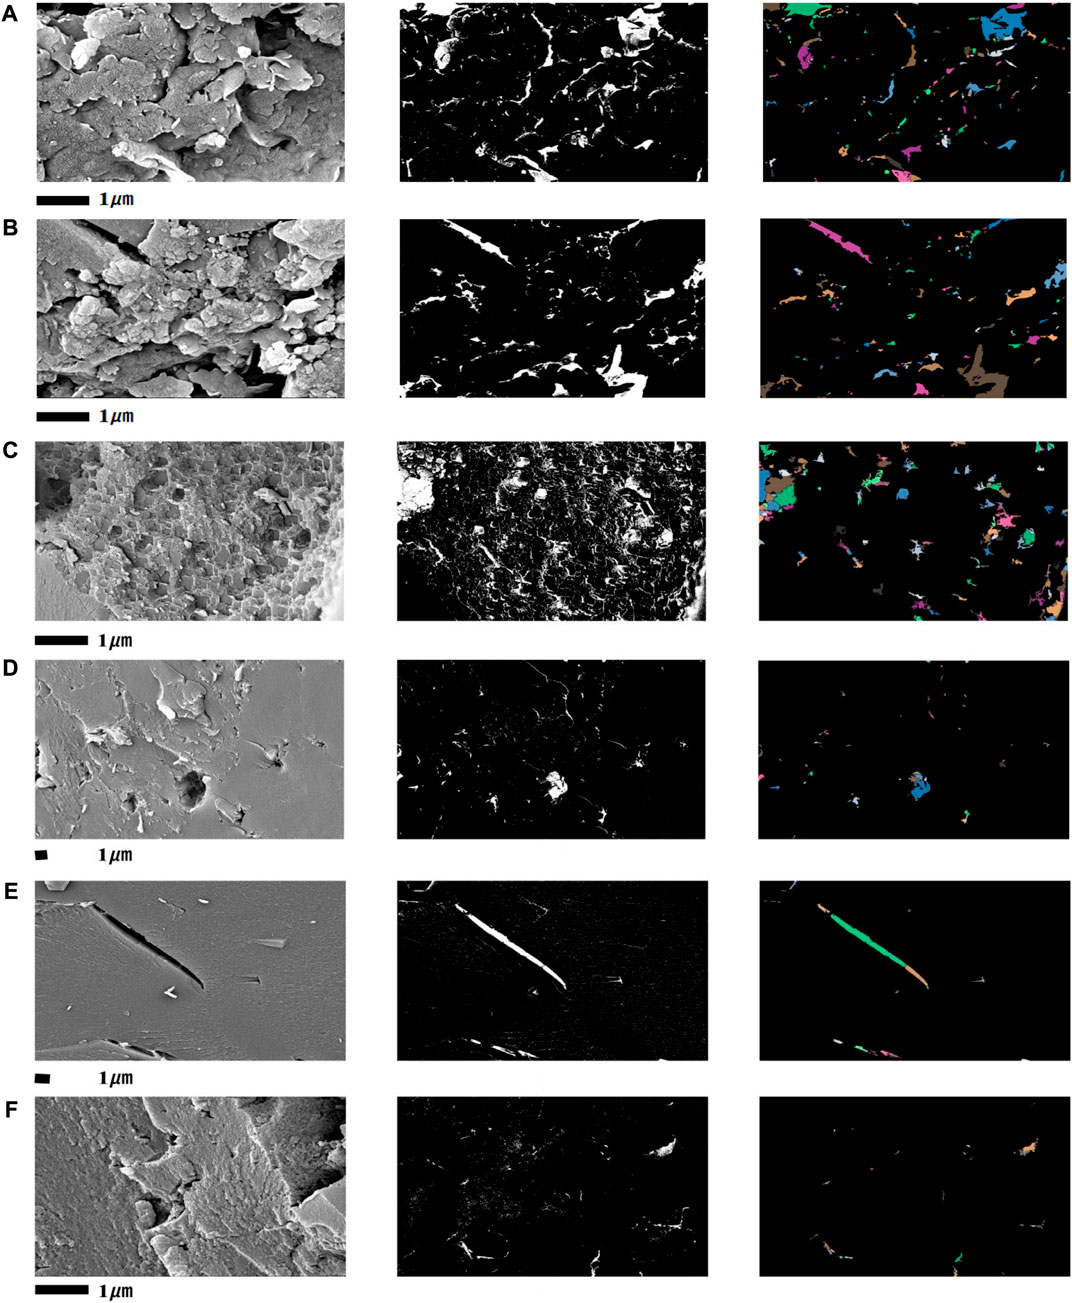
FIGURE 4. SEM and parametric processing of pictures.
Figure 4A and Figure 4B belong to thermally contacted metamorphic coal samples, the surface is mainly polycondensation cracks or pores in endogenous fissures, and the surface is filled with minerals. The fractal picture shows that the fissures are curved, non-directional, and have different lengths, irregular shape. Figure 4C is a coal sample damaged by shear stress structure, which is filled with minerals in the later stage, and the surface is honeycomb-like distribution. Figure 4D and Figure 4E are normal coal samples without obvious damage, and the surface is relatively continuous flat. Figure 4F is more complicated to damage, reflecting in pores caused by endogenous evanescent condensation and condensation, and compressive fractures caused by tectonic stress damage.
Characterization of pore by PCAS method
Geometric characteristics of pores in coal
According to the characteristics of adsorption loops, pores in coal are generally divided into cylindrical, slit, wedge and ink bottle shapes. For the binarized images of SEM, the morphological characteristics of pores should include three independent characteristics, namely pore shape (overall outline, such as roundness), angularity (curvature of corners and edges of pores) and pores surface roughness, as shown in Figure 5. The three represent the spatial variation of the pore profile at different dimensional scales. The following attempts to quantitatively characterize individual pores and regional pore aggregates by using different methods.
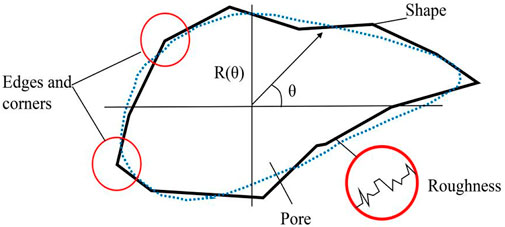
FIGURE 5. Schematic diagram of overall shape, angularity and surface roughness of pores.
Fourier series can be used to describe the morphological characteristics of pores (roundness, angularity, roughness) (Kandasami and Murthy, 2017; Barone and Sen, 2018; Wenjuan et al., 2018; Ren et al., 2021). The Fourier series equation describing the boundary contour of the stack pores is:
Where
Since R(θ) and θ are discrete variables, the above integral expressions can be listed in the form of summation. The area of the pore contour in Figure 5 can be described as:
Among them,
Eqs. 7, 8, and Eq. 9 define the Fourier shape index, angularity index, and surface texture index of pore morphology, which are functions of m. The larger m is, the closer
Total length of holes (cracks) in studied area
The length of the simple hole (crack) can be represented by the long axis L1, and the length of the complex hole (crack) is represented by multiple continuous broken lines. Hole (crack) gap bifurcations or intersections are individually marked as nodes, such as point P in Figure 6B. Complex holes (cracks) can be simplified as graphs (graph theory term for discrete mathematics), where C, D, and E are the vertices of the graph, and PD, PE, and PC are the edges of the graph. The total length of the hole (crack) in the area after the graph is calculated can be expressed as:
Where
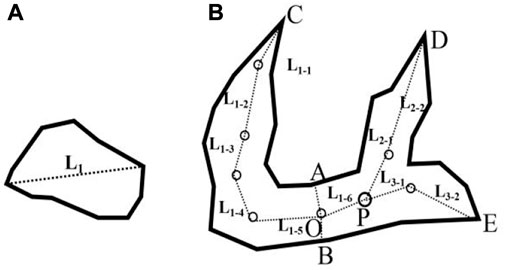
FIGURE 6. Calculation of the total length of the hole (crack) gap.
The total pore length comprehensively characterizes the degree of pore development and pore shape. The total length La of regional pores (cracks) is related to the shape of a single pore (crack), and is also determined by the shape and number of pores (cracks). The larger the
Shape factor of pores
Under the same pore volume, due to the different pore surface characteristics and shapes, the specific surface area may vary greatly, showing the difference in the gas adsorption capacity on the macroscopic level. However, due to the difference in the pore shape, the porosity and specific surface area cannot be directly determined. The ability of the coal to release gas. In the coal micro-pore system, pores and fissures cannot be strictly distinguished, especially for severely damaged coal. Therefore, in certain cases, the two can be treated equally and described by the shape factor.
The ratio of the square of the pore contour perimeter l to the pore contour area is defined as the shape factor of the pores, namely:
where Na is the shape factor of the pores; l is the perimeter of the pore contour, pix; S is the pore contour area, pix2 (pixel2).
For binarizated images of coal pores, the shape factor of pores represents the perimeter of a certain area of pores, which depends on the circularity and rough edges of the pores. The larger the value, the narrower the pores and the rougher the boundary. The larger the Na, the greater the probability that the pores (cracks) are connected to each other. The ideal circular
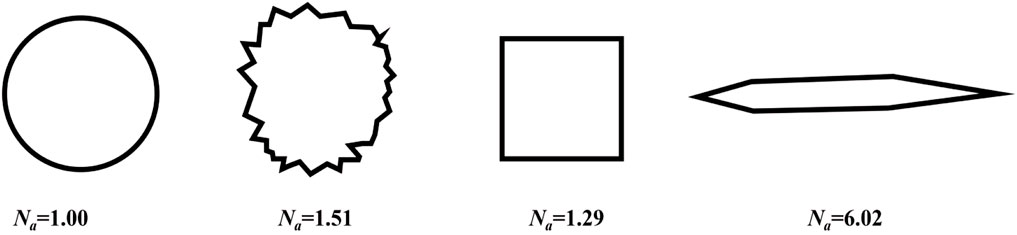
FIGURE 7. Shape factors for different geometries.
Equation. 11 is suitable for describing the shape characteristics of a single pore (crack), and statistical methods can be used to describe the group characteristics of pores (cracks). If the total perimeter and total area of pores (cracks) in the specific area are known, the average shape factor
Where
Binarization quantitative analysis of coal pore characteristics
The PCAS analysis can accurately identify all pores larger than 5 pixels in the electron microscope image through the algorithm, then use image analysis software to calculate fractal, and obtain porosity, shape factor, fractal dimension, and finally calculate the total length of pores.
Pore volume based on PCAS analysis
The parameters such as pore area, perimeter, shape factor, and fractal dimension are counted according to macropores, mesopores, small pores, and micropores, respectively, as shown in Figure 8. The number of pores is counted according to the unit area of 1220000pi.
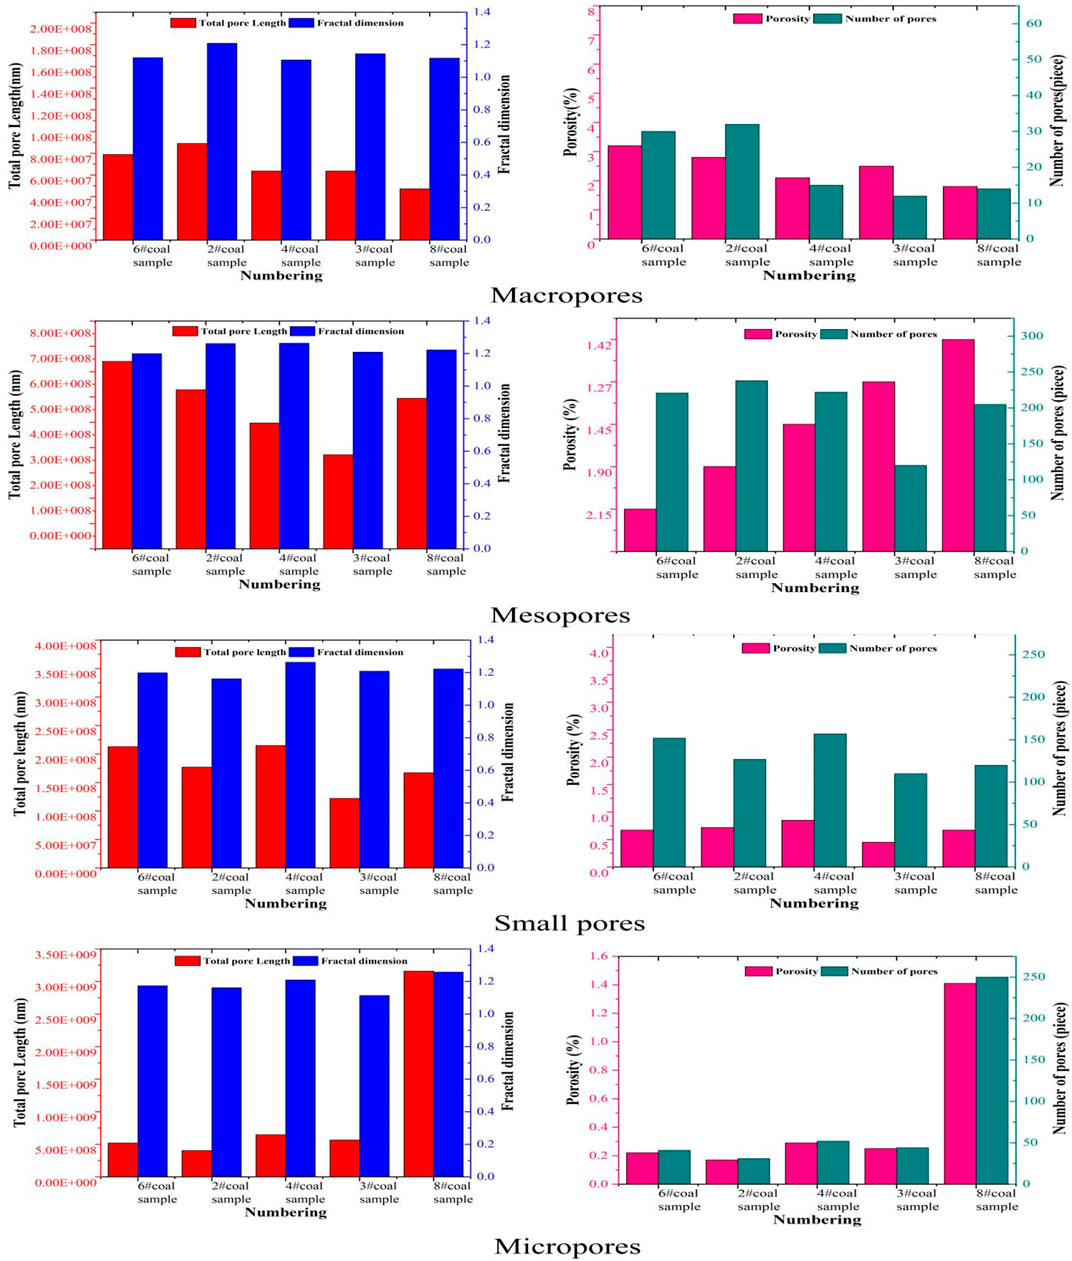
FIGURE 8. PCAS analysis of each coal sample.
For metamorphic coal and non-metamorphic coal samples, no obvious difference is found in the porosity and pore number of small pores. Statistics show that the macropores and mesopores of 2# and 6# metamorphic coal samples and the number of pores is generally larger than those of the other coal samples, indicating that the thermal contacted metamorphic coal samples have more macropores and mesopores than the other coal samples.
The fractal dimension reflects the validity of the space occupied by the coal matrix and is used to measure the irregularity of the coal. The statistical results show that there is no obvious regularity in the change of fractal dimension with the degree of metamorphism of the five coal samples.
The total length of the macropores of the 2# and 6# coal samples of metamorphic coal is more than 78806200 nm, which is 31% higher than that of normal coal samples. The total length of mesoporous pores reaches more than 628019000 nm, which is 29% higher than the average value of other coal samples.
The shape factors of each coal sample were statistically analyzed and compared. As shown in Figure 9, the shape factors of macropores, mesopores and small pores are 3.8–4.3, 3.47–3.88, 2.2–2.8, respectively, and the average values are 4.01, 3.65, and 2.53, respectively. The average shape factor of large pores of non-metamorphic coal samples is 3.89, and the average shape factor of large pores of metamorphic coal is 4.12, which is 7.5% higher than the former. The average shape factor of mesopores in non-metamorphic coal samples is 3.62, and the average shape factor of mesopores in metamorphic coal is 3.71, an increase of 2.4% compared with the former. For metamorphic coal and non-metamorphic coal, the average shape factors of the pores are 2.50 and 2.55, respectively, and there is no significant difference between the two. It shows that the macropore and mesopore shape factor values of thermal contacted metamorphic coal samples have a certain increase, that is, for the same pore volume, the probability of inter-pore connectivity increases significantly, which is more conducive to the movement of methane molecules.
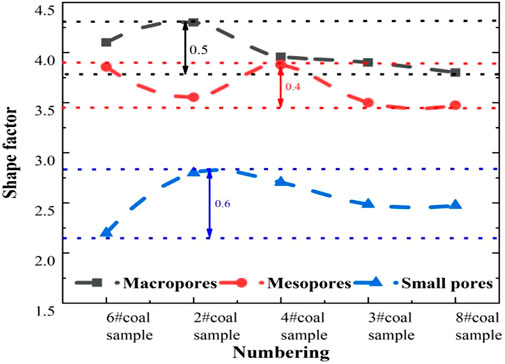
FIGURE 9. PCAS shape factor analysis of each coal sample.
Determination of micropores by nitrogen adsorption at low temperature
It is difficult to distinguish pores below 5 nm by using SEM images of 100,000 times, so the specific surface area and micropore pore volume were determined by low-temperature nitrogen adsorption method. The specific surface area analyzer was used to compare the surface area and microvolume volume by conducting a low-temperature nitrogen adsorption test (Zhao et al., 2016), and the results are listed in Table 3 (Qiang, 2017).
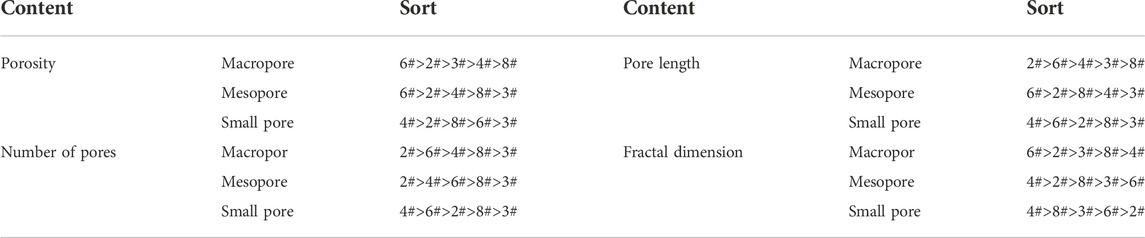
TABLE 2. Statistical comparison of PCAS of coal samples with different grades of pores.
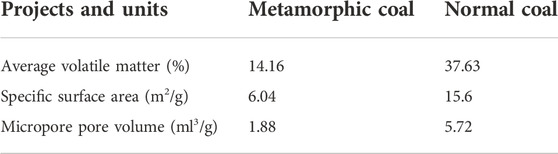
TABLE 3. Characteristic parameters of microporous pores.
The specific surface area of coal is proportional to the amount of adsorption (Zhu et al., 2021), and its value mainly depends on the micropore system. The degree of development of micropores determines the adsorption capacity of methane on coal. The measured specific surface area of metamorphic coal is only 38.7% that of normal coal, and the pore volume of micropores is only 32.9% that of normal coal. Due to thermal contacted metamorphism, the pore volume and specific surface area of the microporous system are greatly reduced, and the gas adsorption capacity is weakened.
Comparative tests on coal emission characteristics
Methods and instruments of measurement
Under a certain gas pressure, the coal reaches adsorption equilibrium, and then it is quickly released to the external low-pressure space. The measured gas release speed is the gas emission rate. Coal particles in free state are not subjected to mechanic stress, and the micropore (crack) system remains in a natural state and is basically stable. The experiments on the gas emission rate were carried out using the developed WT-1A gas emission velocity measuring apparatus. The sensor response speed is 10 ms, the sampling frequency is 1000Hz, and 2 coal samples can be tested at one time. The gas source uses standard gas with a purity of 99.99%. The coal samples were crushed and dried. Coal samples of 5 g with a particle size of 0.25–0.5 mm were screened and loaded into the instrument. After degassing for 90 min, they were inflated for 90 min at a pressure of 0.1 MPa, and measured in a venting space with a pressure close to vacuum.
Measured results of gas emission amount and rate
The measured gas emission curve is shown in Figure 10. On the whole, there is little difference in the cumulative emission of all coal samples, but the curves are very different in the three stages of gas emission. In the first stage, the emission rate of all samples increases sharply, and the gas emission rate reaches the maximum value in an instant. The emission rate of the 2# coal sample closest to the intrusive body increases significantly. The emission amount reaches 4.45 ml/g in 1s, reaching 94% of the emission amount in 60 s. The 3#, 4#, 8# coal samples grow relatively slowly. In the second stage, an inflection point appears in the emission curve, and the increase in emission slows down significantly. The 2# and 6# coal samples have a fast decay rate, from 0.3 ml/g to 0.01 ml/g, and the inflection point appears earlier than other coal samples. The cumulative emission of 2# and 6# coal samples at the end of this stage account for 99% of the total emission in 60 s, and the emission amount is overtaken by the 3# coal sample. The gas emission of 3#, 4# and 8# coal samples still maintain a relatively rapid growth rate. In the third stage, the emission rate of coal samples stabilizes and the growth rate slows down. The emission amount of 2# and 6# coal samples only accounts for 1% of the total emission amount in the first 60 s. Generally speaking, in the first stage, the proportion of the 2# and 6# coal samples in the total emission is much higher than that of the other coal samples. In the second and third stages, the cumulative emission of the 2# and 6# coal samples is much lower than that of the other coal samples.
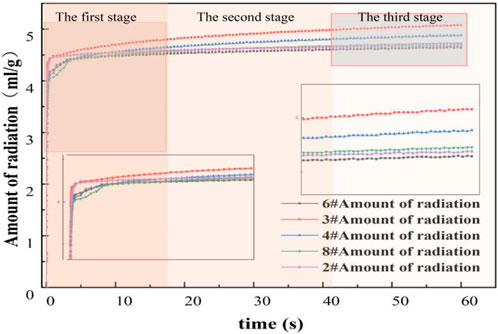
FIGURE 10. Gas emission curve of raw coal.
In the experiment, the pressure difference inside and outside the coal particles and the concentration gradient difference are the driving forces for the flow of methane molecules in the coal particles. The gas emission rate depends on the coal adsorption capacity and the resistance of methane molecules to move. The more developed the micropores, the greater the adsorption capacity of methane, the greater the number of stored methane molecules, the more gas sources in the emission process, and the greater the cumulative emission amount. Due to the small particle size of the experimental coal sample, the short migration route of methane molecules and the fast overall release rate, the emission amount in 0–60s can largely reflect the total amount of emission. Δp is basically equivalent to the gas emission from 0 to 60s in application (Fu, 2006). Taking the distance from the intrusive body as the abscissa, the two parameters and the volatile content were plotted as a curve, as shown in Figure 11. Different from the conclusions of most literatures, whether it is the Δp value or the accumulated amount of gas released from 0 to 60 s, the trend is not monotonically decreasing with the increase of the intrusion distance, and even has an increasing trend. The reasons for this are further analyzed below. Referring to the results of PCAS analysis and low-temperature nitrogen adsorption method, the micropore volume and specific surface area of each coal sample were compared and analyzed with the total emission in 0–60 s, the average volatile content and the specific surface area of thermal contacted metamorphic coal are 14.16% and 6.04 m2/g, which are much smaller than 37.63% and 15.6 m2/g of normal coal. Its micropore volume is 1.88 ml3/g, much smaller than 5.72 ml3/g of normal coal. The emission amount of metamorphic coal in 0–60s is 4.67 ml/g, while that of normal coal is 4.9 ml/g. Tthe average value of the total emission of normal coal in 0–60 s is larger than that of metamorphic coal in terms of macroscopic performance. PCAS analysis shows that normal coal does not develop macropores and mesopores, but has large specific surface area, high micropore porosity, larger methane adsorption capacity, and more gas sources during the release process. The farther away from the intrusive body, the higher the volatile matter, the larger the Δp value, the better the continuation of the emission process, and the slower the decay.
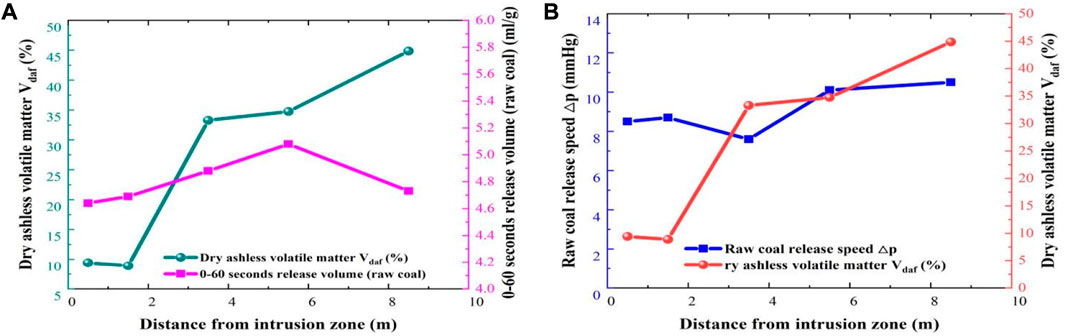
FIGURE 11. Variation of Δp value and total gas emission in 0–60s of coal in igneous rock intrusive zone.
The increase in ash content caused by thermal contacted deterioration is also another reason for the decrease in the total emission from 0 to 60 s. Non-coal minerals occupy a part of the volume of raw coal, but its effective pores are very few. Observation of coal SEM shows that pyroxene, quartzite, illite, feldspar and other crystals are filled in the primary pores, blocking the gas migration channel.
The above PCAS analysis shows that thermal contacted metamorphic coal has small specific surface area, low microporosity, smaller methane adsorption capacity, fewer stored methane molecules, and relatively fewer gas sources during the release process, and the closer it is to the intrusion, the lower the volatile matter, the smaller the total emission. However, the porosity, total pore length, and pore number of the macropores and mesopores of thermally contacted metamorphic coal are larger than those of normal coal. It has more developed migration channels, and methane molecules have little resistance to movement, resulting in a violent gas emission in a few seconds before the test, followed by a rapid decay.
Mathematical characterization of gas emission from metamorphic coal
The gas emission velocity curve of the raw coal can well conform to Vt=V1t−α, and the fitted curve is shown in Figure 12 (Fu, 2006; Zhao et al., 2022; Zhu et al., 2022). The V1 is defined as the gas emission velocity in the first second, and the α is defined as the attenuation coefficient. The curve of V1 via Vdaf is shown in Figure 13, with fitting formula of Eq. 13, and R2of 0.98. The V1 value of the 2# and 6# coal samples is significantly larger than that of the other coal samples. With the increase of volatile matter, the V1 decreases monotonically, satisfying the quadratic nonlinear relationship.
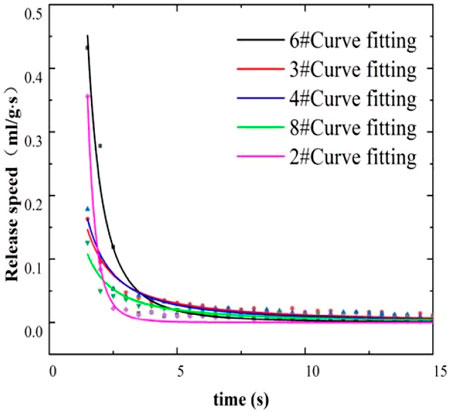
FIGURE 12. Curve of gas emission velocity of raw coal.
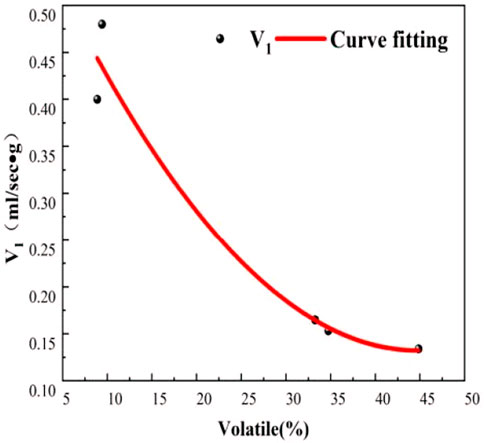
FIGURE 13. Fitting curve of V1 value of coal sample in igneous intrusion zone.
The relationship of α value and the volatile content are fitted linearly, as shown in Figure 14. The fitted formula is shown in Eq. 14. The value of α decreases linearly with the increase of volatile content.
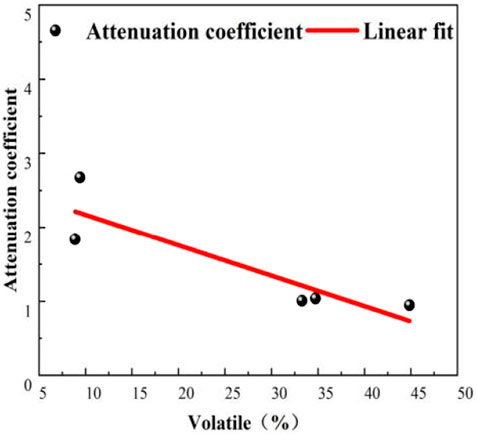
FIGURE 14. Fitting curve of attenuation coefficient values of coal samples in igneous intrusion zone.
Microscopic interpretation of gas emission from the metamorphic coal
When the covering layer of the coal seam is thin, the shallow intrusive bodies such as rock walls, dykes, and rock beds contact or intrude into the coal seam. Because of their high temperature, volatile matter and pressure, and the coal undergoes thermal contacted metamorphism. After the water and volatiles are gasified and released, the coal is rapidly cooled and transformed into natural coke and highly metamorphic coal. This rapid heating process is similar to the coking process. On the one hand, the gasification of volatiles causes the formation of pores in the coal body, on the other hand, the gasification of volatiles escapes to form more throats or pores to connect the pores with each other. Rapid cooling makes these structures fully retained, resulting in the development of macropores and mesopores with complex, long - narrow pore shape, and greater connectivity. For the same gas content, the gas release rate is faster in a short period of time (0–1 s), the V1 value is larger, and the inflection point decays earlier (within 2 s), which increases the amount of released gas in the second and third stages. In the cooling process after thermal contacted metamorphism, re-compaction causes the micropores to shrink, and the micropore volume and specific surface decrease, resulting in a decrease in the adsorption capacity. This is manifested as a smaller Δp value. On the contrary, the normal coal sample has stronger adsorption capacity and can store more methane molecules, but the development of macropores and mesopores is relatively poor, and it cannot escape quickly within a few seconds. The decay is slow, but more gas can be released within 0–60 s, showing a larger Δp value.
When coal and gas outbursts occur, the gas release capacity in a very short period of time will play a more significant role in promoting the outbursts. In actual production, if the Δp value is used to characterize the gas emission rate of thermally contacted metamorphic coal, there may be a phenomenon that the Δp value does not exceed the critical value, but still has outstanding danger. In particular, when thermally contacted metamorphic coal is affected by tectonic stress and is in a high stress and high gas pressure area, the microporous system can still store enough methane molecules, and it is very prone to outburst during mining. Therefore, it is more reasonable to use the V1 index to measure the gas emission rate of thermally contacted metamorphic coal.
Conclusion
1) As the distance from the igneous rock intrusion decreases, the volatile matter and water content tend to decrease, and the ash content gradually increases. The direct contacted position generates natural coke and high metamorphic coal.
2) The PCAS analysis on porosity and pore quantity index of thermal contacted metamorphic coal show that there is no obvious difference of small pores between metamorphic coal and normal coal, while the large and medium pores in metamorphic coal are generally larger than the that of normal coals. The pore volume and specific surface area of micropores decrease significantly, and the adsorption capacity is weakened. The total pore length and average shape factor of macropores and mesopores in per unit area of thermally contacted metamorphic coals increase compared with normal coals, indicating better connectivity among pores.
3) V1 and volatile matter conform to a parabolic equation, and V1 decreases monotonically with the volatile matter. The decay coefficient α value has a linear relationship with the volatile matter, and the α value decreases linearly with the volatile matter.
4) Micropore shrinkage in thermal contacted metamorphic coal leads to a decrease in the total amount of gas emission and Δp value in 0–60 s but the development of macropores and mesopores will form more throat pores, and initially sharp increase of the emission amount. And the emission amount within 1 s accounts for the total amount of emission is larger than other samples. The inflection point appears earlier, the attenuation is faster, and the gas emission ability is enhanced within a few seconds, namely the V1 value increases.
5) In field applications, it is more reasonable to use the V1 index, the gas emission velocity in the first second, to characterize the gas emission rate of thermally contacted metamorphic coal.
Data availability statement
The original contributions presented in the study are included in the article/Supplementary Material, further inquiries can be directed to the corresponding author.
Author contributions
XF, as an industry expert, guided and completed the overall content of the paper and provided relevant experimental conditions. HL is the main writer of the paper, and is responsible for completing the sampling, SEM experiments, gas emission experiments and data analysis. HS assisted in the completion of the SEM experiment and the gas emission experiment, and assisted in the completion of the relevant data processing. ZW provided guidance on scanning electron microscopy and microscopic analysis as an instructor, and provided great support for the completion of the thesis. XL completed the fractalization of SEM images, applied computer software to carry out PCAS analysis, and researched and analyzed the data.
Funding
This research was financially supported by the National Natural Science Foundation of China (Grant Nos. 52174117, 52004117), and the project supported by the discipline innovation team of Liaoning Technical University (Grant No. LNTU20TD-30).
Acknowledgments
The author(s) would like to thank all editors and reviewers for their comments and suggestions.
Conflict of interest
The authors declare that the research was conducted in the absence of any commercial or financial relationships that could be construed as a potential conflict of interest.
Publisher’s note
All claims expressed in this article are solely those of the authors and do not necessarily represent those of their affiliated organizations, or those of the publisher, the editors and the reviewers. Any product that may be evaluated in this article, or claim that may be made by its manufacturer, is not guaranteed or endorsed by the publisher.
Supplementary material
The Supplementary Material for this article can be found online at: https://www.frontiersin.org/articles/10.3389/feart.2022.1040147/full#supplementary-material
References
Arora, A., Dutta, S., Gogoi, B., and Banerjee, S. (2017). The effects of igneous dike intrusion on organic geochemistry of black shale and its implications: Late Jurassic Jhuran Formation, India. Int. J. Coal Geol. 178, 84–99. doi:10.1016/j.coal.2017.05.002
Barone, A., and Sen, M. K. (2018). A new Fourier azimuthal amplitude variation fracture characterization method: Case study in the Haynesville Shale. Geophysics 83, WA101–WA120. doi:10.1190/geo2017-0030.1
Fan, C., Wen, H., Sun, H., Zhou, L., Zhang, X., Zhu, C., et al. (2022). Experimental investigation on the effect of loading and unloading on coal permeability with different sediment beddings. Lithosphere, 2022, 9949201. doi:10.2113/2022/9949201
Fan, C., Yang, L., Wang, G., Huang, Q., Fu, X., and Wen, H. (2021). Investigation on coal skeleton deformation in CO2 injection enhanced CH4 drainage from underground coal seam. Front. Earth Sci. (Lausanne). 9, 766011. doi:10.3389/feart.2021.766011
Fu, H., Tang, D., Xu, T., Xu, H., Tao, S., Li, S., et al. (2017). Characteristics of pore structure and fractal dimension of low-rank coal: A case study of lower jurassic XiShanYao coal in the southern junggar basin, NW China. Fuel 193 (1), 254–264. doi:10.1016/j.fuel.2016.11.069
Fu, X., (2006). Experimental study on gas instantaneous release velocity index V_1 under minimum outburst pressure. Coal Mine Safety (09), 4–6.
Huoduote, B. B. (1966). Coal and gas outburst. Editor S.-Z. Song, and Y.-A. Wang (Beijing: China Industry Press).
Hwang, J., and Pini, R. (2019). Supercritical CO2 and CH4 uptake by illite-smectite clay minerals. Environ. Sci. Technol. 53 (19), 11588–11596. doi:10.1021/acs.est.9b03638
Kandasami, R. K., and Murthy, T. G. (2017). Manifestation of particle morphology on the mechanical behaviour of granular ensembles. Granul. Matter 19 (2), 21–13. doi:10.1007/s10035-017-0703-z
Li, X., Xia, M., Dong, X., Long, R., Liu, Y., Huang, Y., et al. (2022). High mechanical properties of stretching oriented poly(butylene succinate) with two-step chain extension. Polymers 47 (05), 1876–1889. doi:10.3390/polym14091876
Lin, Q., Jiajia, Y., Jian, Z., and Zhigang, C. (2016). Microstructure study on intact clay behavior subjected to cyclic principal stress rotation. Procedia Eng. 143, 991–998. doi:10.1016/j.proeng.2016.06.088
Liu, B., Yi, L. U., Liu, C., Gu, K., and Shu, R., (2017). Extraction technology of sandy soil microstructure during compression. J. Eng. Geol., 25, 968–974. doi:10.13544/j.cnki.jeg.2017.04.010
Liu, C., Shi, B., Zhou, J., and Tang, C. (2011). Quantification and characterization of microporosity by image processing, geometric measurement and statistical methods: Application on SEM images of clay materials. Appl. Clay Sci. 54 (1), 97–106. doi:10.1016/j.clay.2011.07.022
Liu, J., and Wang, Z. (2013). The effect of coal metamorphism on the initial velocity of gas release. J. Liaoning Tech. Univ. Sci. Ed. 32 (06), 745–748. doi:10.3969/j.issn.1008-0562.2013.06.006
Luo, Z. (1989). Study on the relationship between coal specific surface area and coal and gas outburst. Chin. J. Coal (01), 44–54. doi:10.1007/BF02005959
Qiang, Bi (2017). Study on coal spontaneous combustion characteristics and prevention technology under the condition of igneous rock intrusion in Daxing Mine. Liaoning Tech. Univ.. Doctoral dissertation, 150.
Ren, J., Mao, X., and Fu, S. (2021). Image-based flow decomposition using empirical wavelet transform. J. Fluid Mech. 906, A22. doi:10.1017/jfm.2020.817
Song, Y., Yang, S., Xu, Q., Cai, J., Hu, X., Sang, N., et al. (2019). Effect of low-temperature oxidation of coal with different metamorphic degrees on coal quality characteristics and outburst comprehensive index. Process Saf. Environ. Prot., 132, 142–152. doi:10.1016/j.psep.2019.10.009
Teicherta, Z., Ebleb, C. F., Bosea, M., and Williamsa, L. B. (2022). Effects of contact metamorphism on the lithium content and isotopic composition of kerogen in coal. Chem. Geol. 602, 120885. doi:10.1016/j.chemgeo.2022.120885
Wang, F., (2015). Research on the influence of magmatic intrusion on coal properties in Daxing Coal Mine. Coal Sci. Technol. 43 (12), 61–65+71. doi:10.13199/j.cnki.cst.2015.12.013
Wang, H., Li, T., Zou, Q., Cheng, Z., and Yang, Z. (2020). Influences of path control effects on characteristics of gas migration in a coal reservoir. Fuel 267, 117212. doi:10.1016/j.fuel.2020.117212
Wang, H., Yong, Z., Zhang, X., Ran, B., Yang, D., Luo, C., et al. (2016). Depositional environment and micropore characteristics of the ediacaran doushantuo formation black shale in western hubei, China. Arabian J. Geosciences 9 (5), 1–13. doi:10.1007/s12517-016-2408-8
Wang, K., Peng, C., Pan, J., Wan, X., Zheng, D., and Lv, R. (2017). Pore structure characteristics of coal-bearing organic shale in Yuzhou coalfield, China using low pressure N-2 adsorption and FESEM methods. J. Pet. Sci. Eng. 153, 234–243. doi:10.1016/j.petrol.2017.03.043
Wang, W., Hong, L., Gao, D., Lun, J., et al. (2021). Filling characteristics of the micropores in coals with different metamorphic degrees. AIP Adv., 11, 125016. doi:10.1063/5.0070299
Wenjuan, S., Wang, L., and Tutumluer, E. (2018). Image analysis technique for aggregate morphology analysis with two-dimensional fourier transform method. Transp. Res. Rec. 2267 (1), 3–13. doi:10.3141/2267-01
Yang, Y., Sun, J., Li, Z., Zhang, X., Liu, L., Yan, D., et al. (2018). Influence of soluble organic matter on mechanical properties of coal and occurrence of coal and gas outburst. Powder Technol. 332, 8–17. doi:10.1016/j.powtec.2018.03.053
Zhang, Y., Chen, L., Zhao, J., Deng, J., and Yang, H. (2019). Evaluation of the spontaneous combustion characteristics of coal of different metamorphic degrees based on a temperature-programmed oil bath experimental system. J. Loss Prev. Process Industries 60, 17–27. doi:10.1016/j.jlp.2019.03.007
Zhao, B., Wen, G., Nian, J., Ma, Q., Fan, C., Lv, X., et al. (2022). Numerical simulation study on the multi-physical field response to underground coal and gas outburst under high geo-stress conditions. Minerals 12, 151. doi:10.3390/min12020151
Zhao, D., Guo, Y., Wang, G., Jiao, W., Liu, J., Hai, Y., et al. (2020). Quantitative characterization of nano-scale pores in shale reservoirs of Wufeng-Longmaxi formation based on image processing. Fresenius Environ. Bull. 29 (5), 3992–3999.
Zhao, J., Xu, H., Tang, D., Mathews, J. P., Li, S., and Tao, S. (2016). A comparative evaluation of coal specific surface area by CO2 and N2 adsorption and its influence on CH4 adsorption capacity at different pore sizes. Fuel 183 (1), 420–431. doi:10.1016/j.fuel.2016.06.076
Zhao, L., Qin, Y., Cai, C., Xie, Y., Wang, G., Huang, B., et al. (2017). Control of coal facies to adsorption-desorption divergence of coals: A case from the xiqu drainage area, gujiao cbm block, North China. Int. J. Coal Geol., 171, 169–184. doi:10.1016/j.coal.2017.01.006
Zhao, S., Chen, X., Li, X., Qi, L., and Zhang, G. (2021). Experimental analysis of the effect of temperature on coal pore structure transformation. Fuel 305, 121613. doi:10.1016/j.fuel.2021.121613
Zhou, L., Zhou, X., Fan*, C., and Bai, G. (2022). Coal permeability evolution triggered by variable injection parameters during gas mixture enhanced methane recovery. Energy 252, 124065. doi:10.1016/j.energy.2022.124065
Zhu, H., Huang, C., Ju, Y., Bu, H., Li, X., Yang, M., et al. (2021). Multi-scale multi-dimensional characterization of clay-hosted pore networks of shale using FIBSEM, TEM, and X-ray micro-tomography: Implications for methane storage and migration. Appl. Clay Sci. 213, 106239. doi:10.1016/j.clay.2021.106239
Keywords: initial velocity of gas emission, coal and gas outburst, thermally contacted metamorphic coal, pore structure, PCAS
Citation: Fu X, Liu H, Sha H, Wang Z and Liu X (2023) Micro-Porosity and gas emission characteristics of thermally contacted metamorphic coal by igneous intrusion. Front. Earth Sci. 10:1040147. doi: 10.3389/feart.2022.1040147
Received: 09 September 2022; Accepted: 22 September 2022;
Published: 06 January 2023.
Edited by:
Yu Song, China University of Mining and Technology, ChinaReviewed by:
Dong Duan, Taiyuan University of Technology, ChinaHongwei Yang, North China University of Science and Technology, China
Copyright © 2023 Fu, Liu, Sha, Wang and Liu. This is an open-access article distributed under the terms of the Creative Commons Attribution License (CC BY). The use, distribution or reproduction in other forums is permitted, provided the original author(s) and the copyright owner(s) are credited and that the original publication in this journal is cited, in accordance with accepted academic practice. No use, distribution or reproduction is permitted which does not comply with these terms.
*Correspondence: Xiang Fu, MzM0ODIzMDIzQHFxLmNvbQ==