Abstract
The accuracy of data-driven landslide susceptibility mapping (LSM) is closely affected by the quality of non-landslide samples. This research proposes a method combining a self-organizing-map (SOM) and a one-class SVM (SOM-OCSVM) to generate more reasonable non-landslide samples. We designed two steps: first, a random selection, a SOM network, a one class SVM model, and a SOM-OCSVM model were used to generate non-landslide sample datasets. Second, four machine learning models (MLs)—namely logistic regression (LRG), multilayer perceptron (MLP), support vector machine (SVM), and random forest (RF)—were used to verify the effects of four non-landslide sample datasets on LSM. From the region along the Sichuan-Tibet Highway, we selected 11 conditioning factors and 1186 investigated landslides to perform the aforementioned experiments. The results show that the SOM-OCSVM method achieves the highest AUC (>0.94) and minimum standard deviation (<0.081) compared with other methods. Moreover, RF achieves the best performance in different datasets compared with other ML models. The aforementioned results prove that the proposed method can enhance the performance of ML models to produce more reliable LSM.
1 Introduction
The fragile geological environment of the Sichuan-Tibet highway, with its complex geotechnical and climatic conditions, has created suitable conditions for mountain disasters such as landslides, debris flows, and flash floods (Chen et al., 2019; Wang et al., 2020a; Liu et al., 2022; Wang et al., 2022). The area is frequently exposed to the risk of slope instability and landslides, which seriously affect sustainable socio-economic development and pose a major security risk for national defense construction and national communication. It is therefore of great practical significance to complete landslide susceptibility mapping (LSM) along the highway, and hence improve decision-making aimed at reducing highway disasters.
LSM has developed rapidly over the past two decades and is considered an effective measure for mitigating landslide effects (Wang et al., 2020b). LSM focuses on the quantitative analysis of landslide spatial distribution, using a set of region-specific conditioning factors (Hess et al., 2017). Recently, machine learning (ML) algorithms have shown promising and effective ways of solving non-linear real-world problems with high accuracy and are widely used in LSM, including random forest (RF), support vector machine (SVM), multilayer perceptron (MLP), logistic regression (LGR), decision tree, and artificial neural network (ANN) models (Aditian et al., 2018; Ye et al., 2022). These methods have essential similarities in the way they select critical condition factors, which reduce the impact of highly correlated factors on the generalization ability of the model. However, when assessing landslide susceptibility based on machine learning—which is data-driven—accuracy depends on the selection of landslide (positive) and non-landslide (negative) samples.
Landslide samples can be produced by field surveys, remote sensing interpretation of landslides, and historical landslide cataloging data. By contrast, non-landslide samples are less certain. In the past, researchers mainly used the following methods to obtain non-landslide samples: 1) random selection (Felicísimo et al., 2013); 2) the creation of landslide buffers (Pham et al., 2016); and 3) collection from low-slope streams and topographic areas (Kavzoglu et al., 2014). These methods depend on subjective speculation or random selection, however, and cannot make good use of existing landslide contributing factors. The spatial distribution relationship between landslides and contributing factors is ignored, yet this needs to be rationally considered when designing a method to optimize the samples.
To solve the aforementioned problems, we propose a method based on the spatial distribution relationship between landslides and contributing factors to obtain the frequency ratio of non-landslide samples. This is achieved, first, by randomly selecting non-landslide samples beyond a certain distance from the landslides; second, by combining the frequency ratio information on the factors and the landslides and using the SOM unsupervised learning method to obtain the low frequency ratio partition; third, by combining the contributing factors and landslide data to train the OC-SVM and screen out the non-landslide samples with low similarity; and finally, by combining the two methods to screen out the non-landslide samples with low similarity by the trained OC-SVM in the low frequency ratio partition, using the SOM. To assess its effectiveness, we applied our SOM-OCSVM method to the area along the Sichuan-Tibet Highway.
2 Materials
2.1 Study area
The Sichuan-Tibet Highway starts at Chengdu in the east and ends at Lhasa in the west, includes the G318 and G317 national roads, and is 2142 km in length (Figure 1). The highway is located in the collision zone between the Indian and Eurasian plates, which is a zone of strong geological and tectonic activity (Ma et al., 2020). The Sichuan-Tibet Highway crosses a large area from the basin to the plateau, spanning three major geomorphological types: the Chengdu Plain, the Hengduan Mountains, and the Tibetan Plateau. The stratigraphy along the highway is geologically complex, ranging from the Upper Paleozoic Aurignacian to the Cenozoic Quaternary. The G318 passes through a region with terrain that is high in the west and low in the east and that crosses three major mountain systems: the Hengduan, the Nyingchi Tanggula, and the Himalayas; and four major water systems: the Yangtze, Lancang, Nujiang, and Yarlung Tsangpo rivers.
FIGURE 1

Historical landslide inventory and the Sichuan-Tibet Highway location.
2.2 Data
2.2.1 Landslide inventory
In this study, we collected data from 1186 landslides. The spatial distribution of the landslide inventory within the study area is shown in Figure 1. The landslide inventory was obtained from remote sensing interpretations, field surveys, and historical records.
2.2.2 Landslide conditioning factors
Landslide occurrence is controlled by a variety of conditioning factors, and therefore, reasonable selection of such factors is essential for improving LSM reliability. Drawing on extensive research in the study area (Ma et al., 2020; Wei et al., 2022; Ye et al., 2022), 11 factors were chosen for LSM (Figure 2), i.e., slope, aspect, plan curvature, profile curvature, relief amplitude, annual rainfall, distance to fault, land use, geomorphology, lithology, and distance to river. We divided the original ongoing factors into several subclasses according to their variable impact on landslide occurrence, as shown in Figure 5.
FIGURE 2
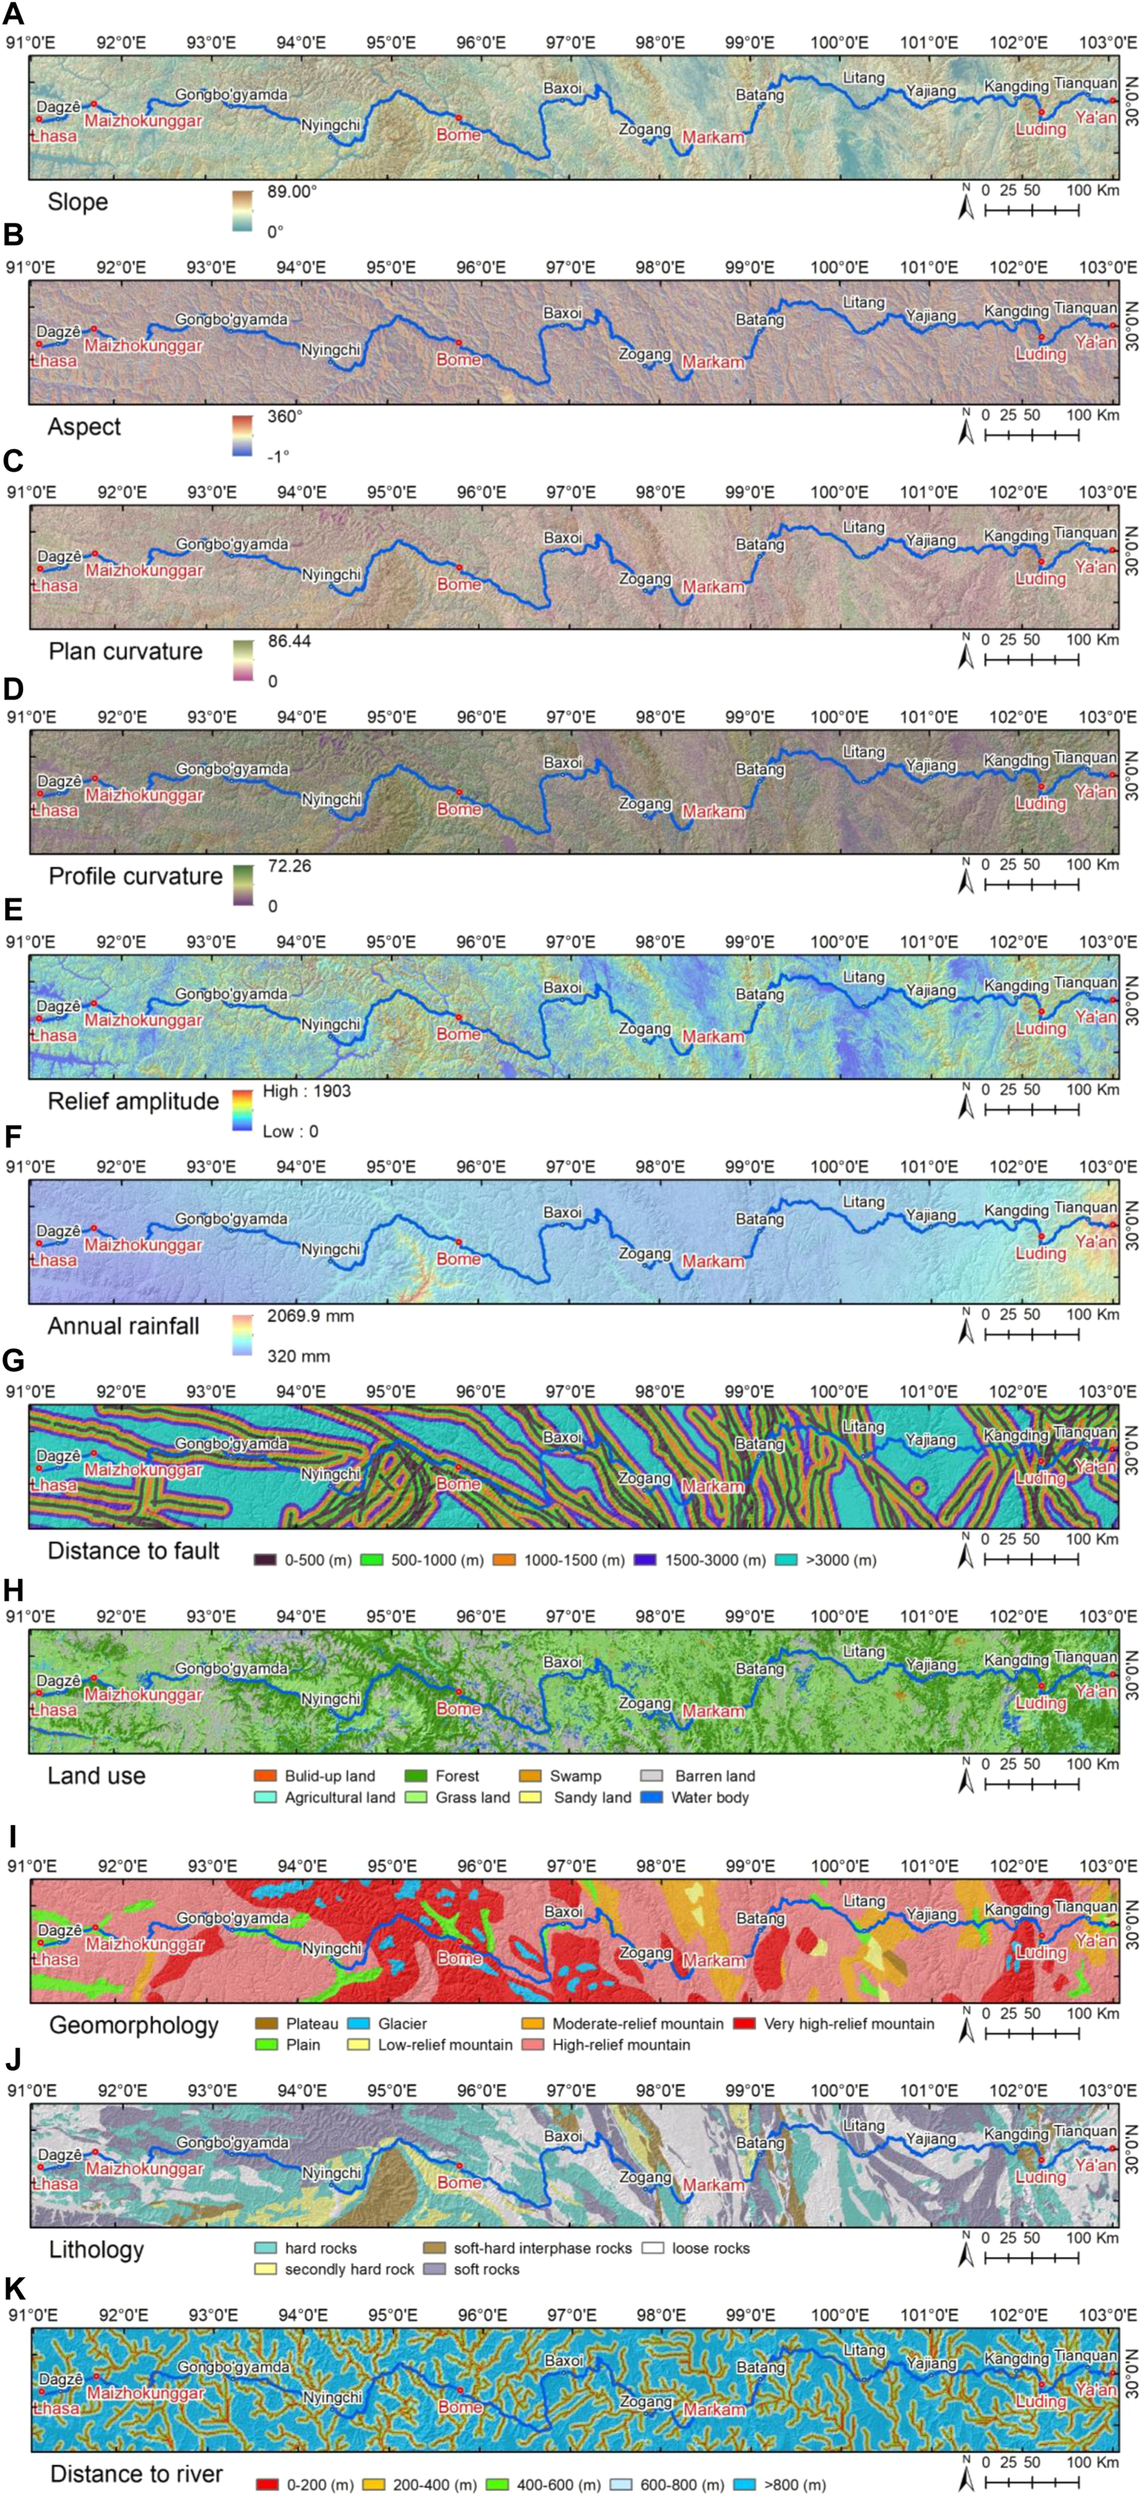
Landslide conditioning factor along the Sichuan-Tibet Highway: (A) slope, (B) aspect, (C) plan curvature, (D) profile curvature, (E) relief amplitude, (F) annual rainfall, (G) distance to fault, (H) land use, (I) geomorphology, (G) lithology, (K) distance to river.
Slope is considered a key topographical factor directly affecting slope body stability (Keles and Nefeslioglu, 2021). Generally, slopes between 20° and 40° are considered prone to causing landslides. Aspect was chosen because it affects erosion. The non-continuous direction of wind and sunlight, which regulates soil moisture and vegetation growth, in turn affects the stability of soil (Bordoni et al., 2020). Relief amplitude describes the variation in terrain associated with landslide occurrence (Qiu et al., 2022), with landslides more likely in areas with greater relief amplitude.
Landslide occurrence is also closely related to geomorphology. Land-use type is one of the most sensitive factors, with slope body stability vulnerable to a constantly changing environment due to human activities. Lithology is often considered one of the more important factors in LSM because it directly affects rock strength and the soil permeability (Kavzoglu et al., 2014). In this study, the geomorphology, land use, and lithology are classified into seven, eight, and five categories, respectively, and the detailed information is shown in Figure 5.
There is a strong correlation between distance to a river and landslide susceptibility, as rivers are associated with slope toe erosion (Erener and Düzgün, 2010). The area near the fault is also more favorable to landslide occurrence (Yalcin et al., 2011); hence, the distance to fault was taken into account in this study. The buffer map along faults and rivers was constructed and reclassified into five groups.
Plan curvature describes the terrain’s horizontal characteristics and expresses the change rate. Profile curvature reflects the slope change rate and the flatness of the flow line slope. Rainfall is one of the key contributing factors here. Landslides induced by heavy and extreme rainfall in steep mountainous regions occur frequently (Zhou et al., 2022).
3 Methods
A detailed flowchart of the present study is given in Figure 3, and the process contains the following specific steps. First, we prepared a positive sample dataset of 1186 landslides with a label value of 1. Next, four non-landslide sample datasets, as negative samples with a label value of 0, were constructed using four methods. The number of samples in each negative sample dataset was consistent with the positive samples (Petschko et al., 2014). Third, we combined the positive samples, negative samples, and the 11 conditioning factors to generate four sample datasets, which were divided for training and validation at 70% and 30%, respectively. Finally, the performance of the ML models was assessed and the final LSM obtained by comparison.
FIGURE 3

Flowchart of this study.
3.1 Non-landslide data generation
Traditionally, non-landslide samples are randomly selected from areas outside the area of recorded landslides. However, these areas usually include a large number of unstable slopes and many unidentified landslides, and hence cannot be used as negative samples. To overcome these drawbacks, this study presents a negative sample generation method based on a self-organizing-map and a one-class SVM model. The flowchart is given in Figure 4.
FIGURE 4
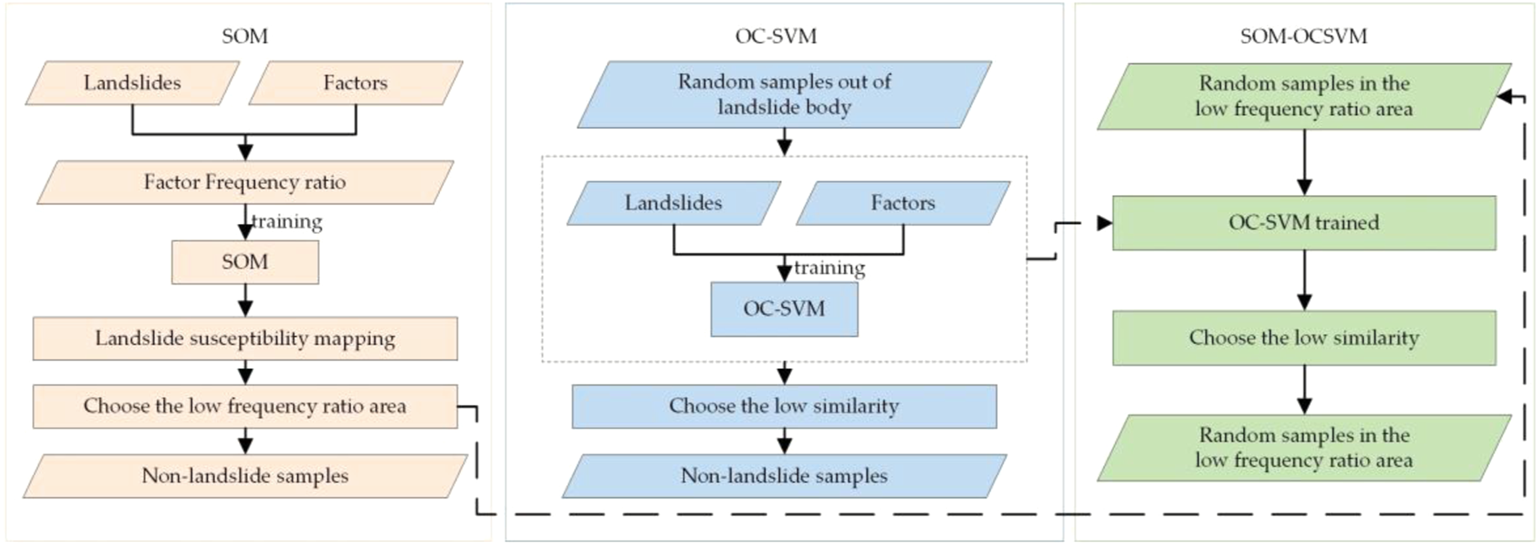
Flowchart of non-landslide dataset generation.
3.1.1 Self-organizing map
A self-organizing map (SOM) (Ritter and Kohonen, 1989) is an unsupervised learning algorithm and a special artificial neural network (ANN). The SOM can map high dimensional data with complex and nonlinear relationships onto a low-dimensional space with simple geometrical structures and relationships. It can perform cluster analysis and divide the entire input space into several disjointed regions. The SOM network has an input layer and a competitive layer.
If we assume that is the input variable, and is the weight coefficient of neurons, where is the number of neurons in the competitive layer. In the competitive layer, neighboring neurons are connected to each other through certain relationships. The SOM employs a competitive learning algorithm in training (Huang et al., 2017). The learning rule is to calculate the distance between the and , and the neuron with the smallest distance is considered the winner. In this study, the distance is calculated using the Euclidean distance formula:
3.1.2 One-class SVM
The one-class SVM (OC-SVM) (Schölkopf et al., 1999) is the more classical single classification algorithm and unsupervised classification method. Assuming that is the nonlinear mapping kernel function defined in the n-dimensional data space, the samples are . The OC-SVM maps the samples from low-dimensional to high-dimensional space through the , establishing an optimal hyperplane between the zero point and the high-dimensional space (Chen et al., 2021). This hyperplane can be described by the n-dimensional vector and a constant . The determination function is defined as the following:
To ensure that the hyperplane clusters the samples with the optimal bounds, the quadratic programming problem needs to be optimized:where is the weight and threshold of the support vector, is the relaxation variable, is the mapping function that maps to a higher dimensional space, and . This method creates a hyperplane with parameters that maximizes the hyperplane distance from the zero point in the feature space and separates the zero point from all data.
3.2 Machine learning
In this study, four machine learning (ML) models, which are currently widely used, were selected to verify the effects of non-landslide samples on LSM, i.e., the logistic regression (LGR) (Aslam et al., 2022), multilayer perceptron (MLP) (Li et al., 2019), support vector machine (SVM) (Cortes and Vapnik, 1995), and random forest (RF) models (Breiman, 2001).
3.3 Model evaluation
The standard deviation (Std) effectively reflects the stability of the model. The smaller the value of the Std, the more stable the model. Receiver operating characteristics (ROCs) are important tools for model evaluation (Swets, 1988). Formula 5 calculates the true positive rate (TPR) and the false positive rate (FPR) and plots a curve with both the TPR and FPR. The area under the curve (AUC) is used to reflect the model performance and is usually between 0.5 and 1.
4 Experimental results
4.1 Factor analysis
Frequency ratios (FRs) are often used to reflect the effects of factors on landslide occurrence. Figure 5 shows the FR value of all factors and their subclass percentages. It reveals that the probability of a landslide increases as the slope, the profile curvature, and the annual rainfall rise, and decreases as the distance to fault and to river rise. For aspect, the flat class had a lower FR value, indicating less probability of landslide in flat areas. The majority of landslides occur on built-up and agricultural land. In terms of geomorphology, there are small landslides in the glaciers, low-relief mountains, and moderate-relief mountains. Concerning relief amplitude, the range of 25–79 m is generally prone to landslides, while in terms of lithology, second-hand rocks and soft-hard interphase rocks are more prone to landslides.
FIGURE 5
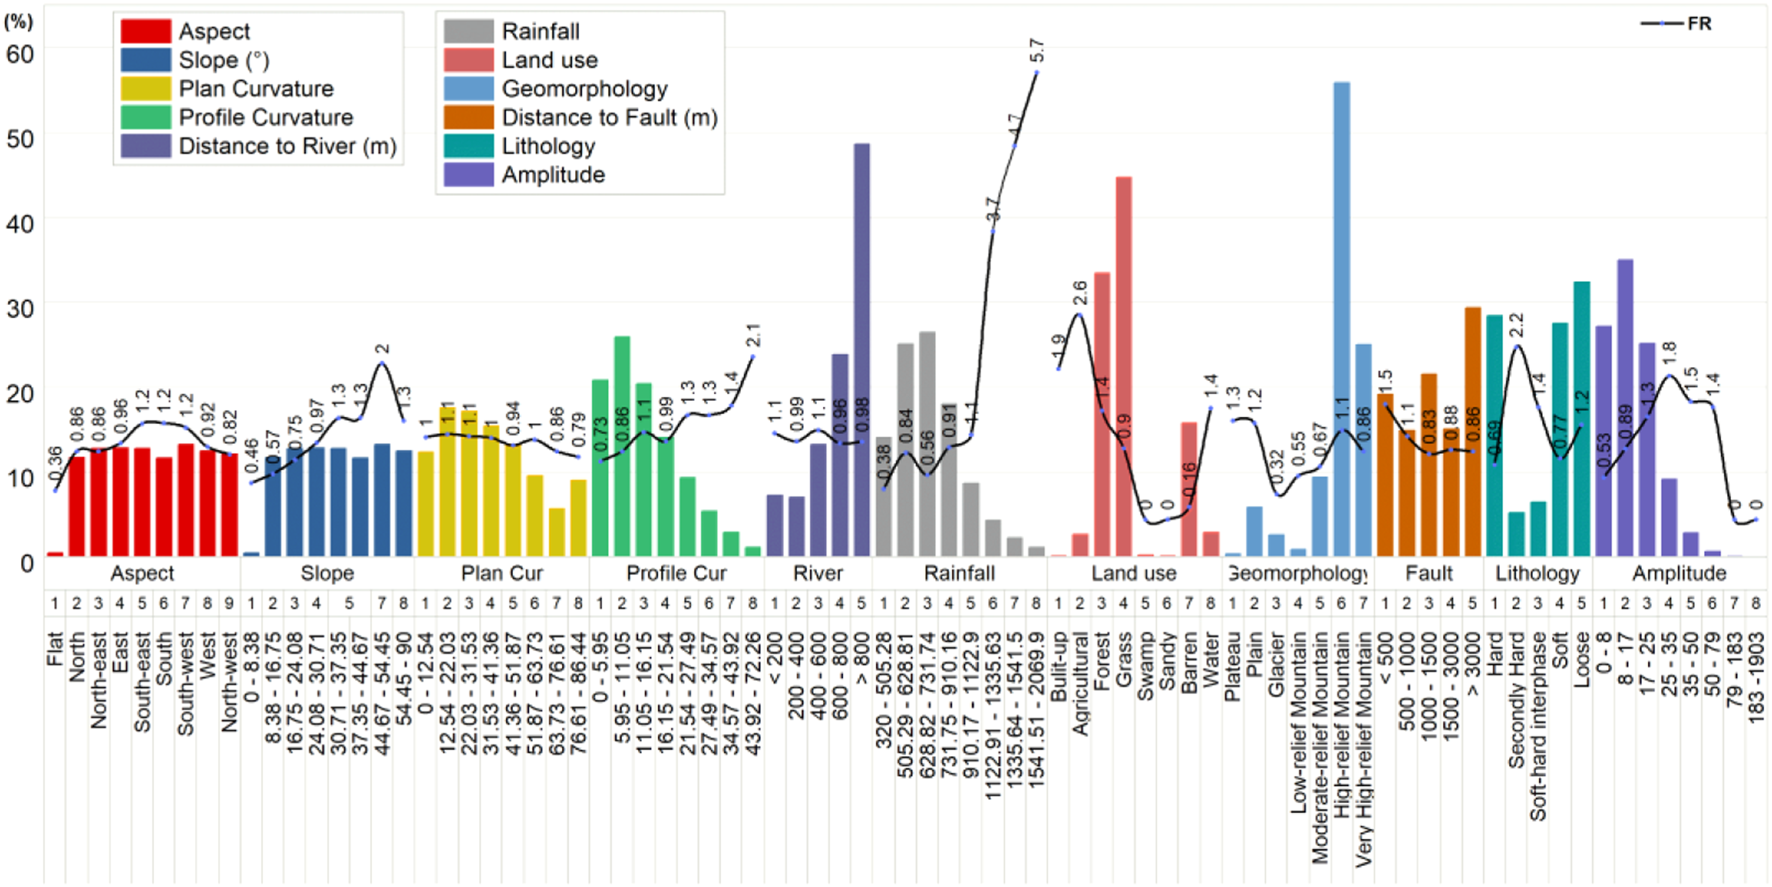
Statistical distribution and frequency ratio (FR) values of conditioning factors.
4.2 Non-landslide sample generation
4.2.1 Non-landslide sample generation based on the SOM network
The SOM network was used to generate reasonable non-landslide samples. We used the normalized frequency ratios of the factors as the input variables, which consider about the distribution relationship between landslides and factors. The output variables are the four levels of landslide susceptibility. Therefore, the input layer has eleven neurons representing the frequency ratio of the conditioning factors, and the output layer has four neurons representing four different susceptibility levels. For the training process, the learning rate is initialized to a value of 0.5 and reduced linearly to 0.01 during the training process. The maximum number of iterations is set at 1000. When it is reached, the training process is finished.
As shown in Figure 6, the landslide susceptibility map produced using the SOM network is classified into four levels: very low (3.64%), low (12.84%), medium (49.60%), and high (33.92%). Table 1 shows the frequency ratio of each level. The levels of very low, low, and medium susceptibility have low frequency ratios. It is therefore reasonable that non-landslide samples were randomly selected from them.
FIGURE 6
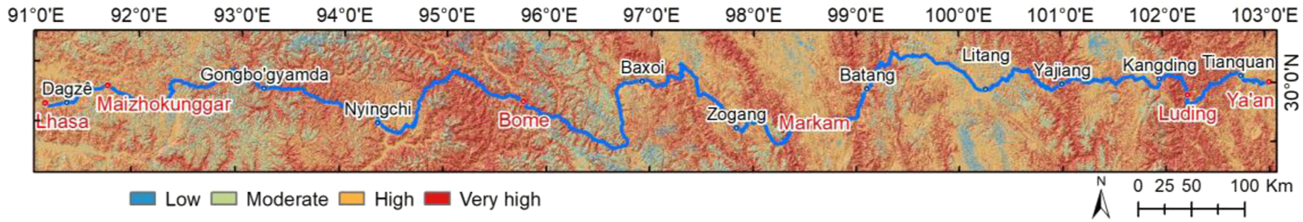
Landslide susceptibility map generated by SOM.
TABLE 1
| Classification | Pixels | Percentage of pixels (%) | Number of landslides | Percentage of landslides (%) | Frequency ratio | |
|---|---|---|---|---|---|---|
| SOM | Very low | 23863 | 3.64 | 4 | 0.34 | 0.09 |
| Low | 84268 | 12.84 | 25 | 2.11 | 0.16 | |
| Moderate | 325473 | 49.60 | 485 | 40.89 | 0.82 | |
| High | 222531 | 33.92 | 672 | 56.66 | 1.67 |
Frequency ratios of the four susceptibility levels of SOM network.
4.2.2 Non-landslide sample generation based on a one-class SVM method
The OC-SVM only needs to input landslide samples to the network for training since it only focuses on learning the features of the landslides. The specific process is as follows: First, we inputted the landslide samples to train the OC-SVM model. Second, we randomly selected five times the number of landslides as the prediction data in the areas outside the landslides, and inputted them into the model. These were assigned a value of 1 or −1, according to their similarity with the features of the landslides learned by the model. The value of low similarity was −1. We selected the data with low similarity as the non-landslide samples, and the spatial distribution is shown in Figure 7.
FIGURE 7
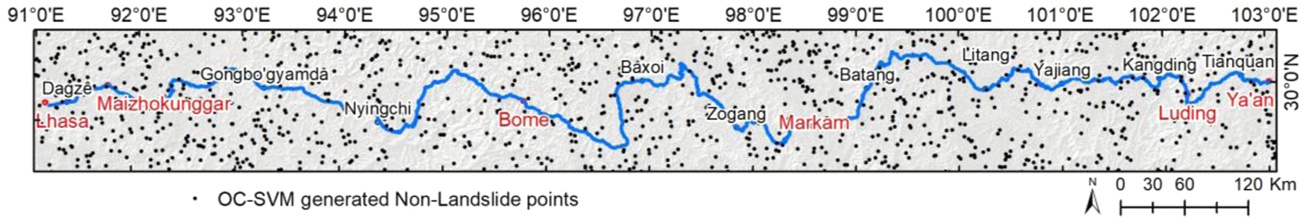
OC-SVM generated distribution map of non-landslide samples.
4.2.3 Non-landslide sample generation based on the SOM-OCSVM method
In order to further optimize the selection of non-landslide samples and enhance the performance of data-driven models, this study combined the SOM network with the OC-SVM network to determine the non-landslide samples participating in ML-based LSM. The specific process was as follows: First, we randomly selected the prediction data in the susceptible area with the low frequency ratios generated by the SOM network. Next, we inputted the prediction data into the OC-SVM model trained by the landslides and screened out the data with low similarity. The spatial distribution is shown in Figure 8. The final non-landslide samples were all outside the landslide and high susceptibility area generated by the SOM, which can better ensure the separation of the positive and negative samples inputted to the ML model and generate more accurate LSM.
FIGURE 8
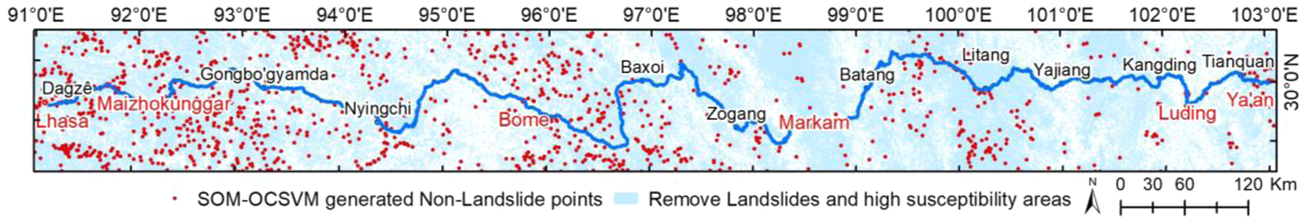
SOM-OCSVM generated distribution map of non-landslide samples.
4.3 Effects of non-landslide sample selection
Figure 9 shows the LSMs generated by the RF model based on different non-landslide sample datasets. The natural break classification was applied to divide landslide susceptibility into five levels: very high, high, moderate, low, and very low. The LSMs show significant differences in the spatial distribution of the susceptibility area. As the ML algorithm and the landslide samples are consistent, this difference comes from the different non-landslide sample datasets. This result suggests a close relationship between the quality of non-landslide samples and the performance of LSM. To quantitatively evaluate the performance of the model, Figure 10 shows the ROC curves for the four non-landslide sample datasets. The AUC values are 0.8328, 0.9180, 0.9765, and 0.9877, respectively. Among the four datasets, the RF based on the SOM-OCSVM reached the highest AUC value (0.9877). The AUC value of the SOM-OCSVM had the most significant improvement (0.1549), confirming that the non-landslide sample generation method proposed in this study results in a remarkable improvement in the performance of RF-based LSM.
FIGURE 9
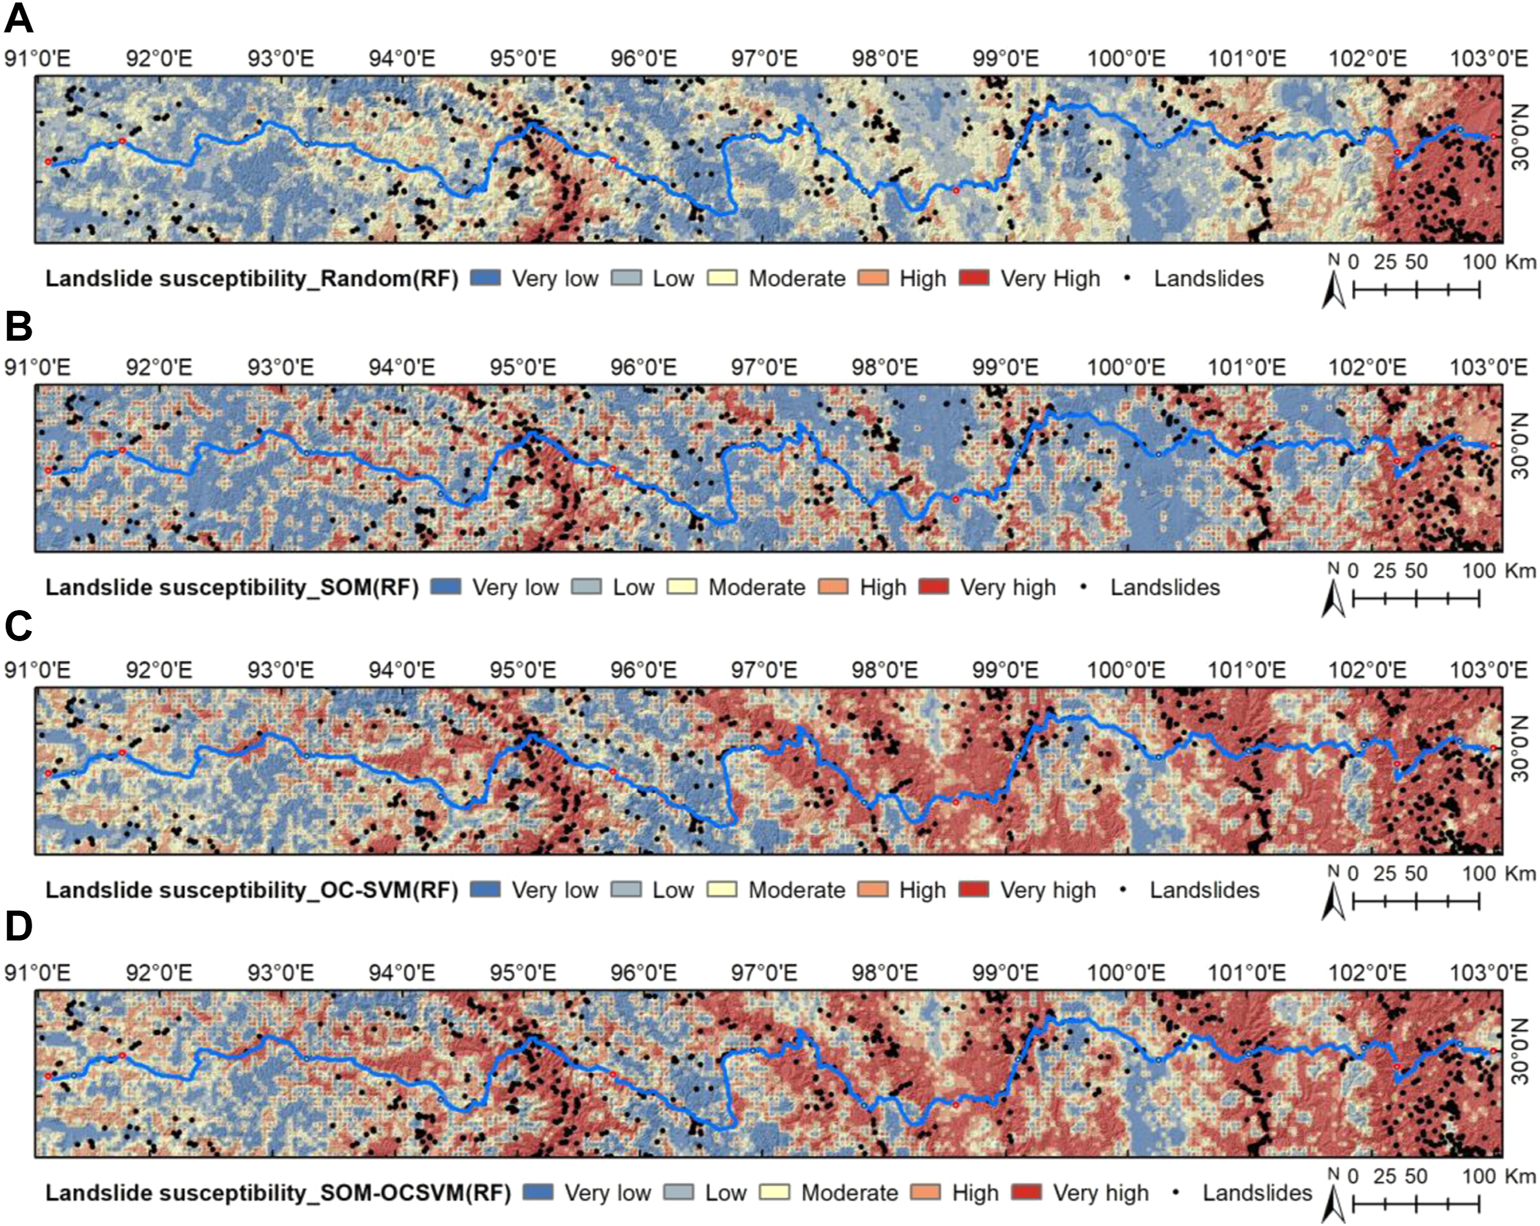
Landslide susceptibility map based on the RF with different negative data: (A) random, (B) SOM, (C) OC-SVM, and (D) SOM-OCSVM.
FIGURE 10
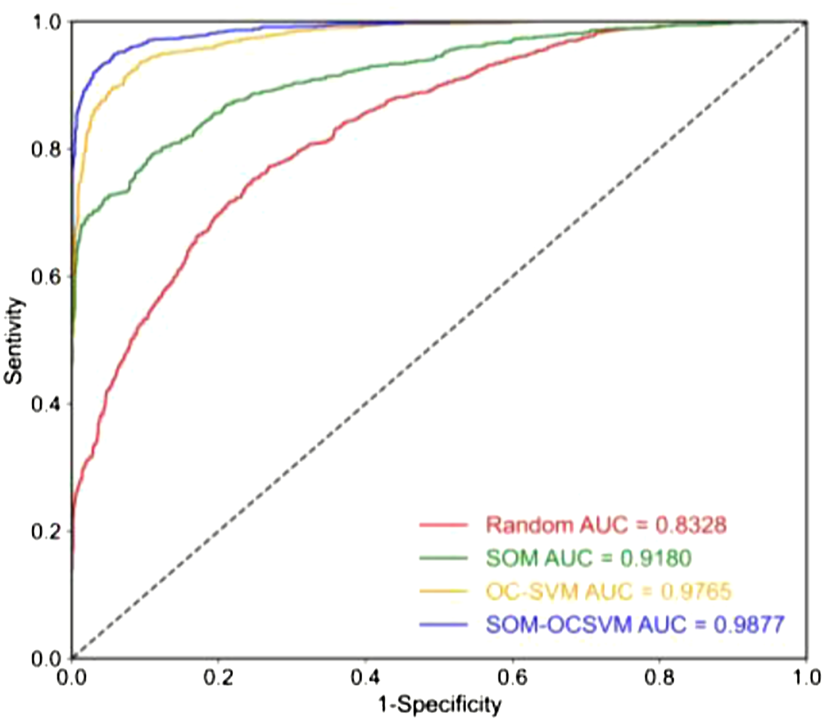
ROC curves of four non-landslide data generation strategies.
In order to quantitatively describe the differences brought by different non-landslide sample datasets to LSM, we computed the proportion of areas from each susceptibility level and the proportion of the landslides by overlaying the landslide distribution, as shown in Table 2. The evaluation results reflect a great difference. The levels of moderate, high, and very high are the landslide hazard areas. From the randomly generated non-landslide sample dataset, 86.17% of the landslides exist in 51.63% of the hazard area of LSM. For SOM, 80.19% of the landslides exist in 49.66% of the hazard area. For OC-SVM, 93.59% of the landslides exist in 73.15% of the hazard area. For SOM-OCSVM, however, 94.27% of landslides exist in 74.09% of the hazard area, with only 5.73% of landslides in the very low and low susceptibility areas. This confirms that the SOM-OCSVM can effectively obtain the areas with a small probability of landslide occurrence in the study area and hence better eliminate the influence of unstable slopes and unidentified landslides on LSM.
TABLE 2
| Susceptibility level | Pixels | Percentage of pixels (%) | Number of landslides | Percentage of landslides (%) |
|---|---|---|---|---|
| Random | ||||
| Very low | 112787 | 17.20 | 23 | 1.94 |
| Low | 204504 | 31.18 | 141 | 11.89 |
| Moderate | 199040 | 30.35 | 288 | 24.28 |
| High | 89736 | 13.68 | 378 | 31.87 |
| Very high | 49787 | 7.60 | 356 | 30.02 |
| SOM | ||||
| Very low | 172593 | 26.32 | 74 | 6.24 |
| Low | 158675 | 24.19 | 161 | 13.58 |
| Moderate | 111092 | 16.93 | 182 | 15.35 |
| High | 110798 | 16.89 | 317 | 26.73 |
| Very high | 102696 | 15.66 | 452 | 38.11 |
| OC-SVM | ||||
| Very low | 79357 | 12.10 | 25 | 2.11 |
| Low | 96733 | 14.75 | 51 | 4.30 |
| Moderate | 116826 | 17.81 | 100 | 8.43 |
| High | 150057 | 22.88 | 272 | 22.93 |
| Very high | 212881 | 32.46 | 738 | 62.23 |
| SOM-OCSVM | ||||
| Very low | 76198 | 11.62 | 19 | 1.60 |
| Low | 93700 | 14.29 | 49 | 4.13 |
| Moderate | 113573 | 17.32 | 111 | 9.36 |
| High | 155069 | 23.64 | 250 | 21.08 |
| Very high | 217314 | 33.13 | 757 | 63.83 |
Landslide susceptibility levels and percentage of landslides in the study area.
To further validate the impact of non-landslide samples on ML-based landslide susceptibility evaluation (LSE), we compared four ML models: MLP, SVM, LGR, and RF. Table 3 shows in detail the AUC and Std of the four ML models for different non-landslide sample datasets. It can be seen that for the randomly generated non-landslide sample dataset, the AUC values are the lowest and the Std values are the highest. The non-landslide sample dataset, generated based on the SOM-OCSVM model, has the most elevated AUC values and the most reduced Std values of the four machine learning models. That is, the accuracy and stability of all four models increased sequentially as the non-landslide sample dataset changed. The result confirms that the non-landslide samples can affect the accuracy of the models driven by data, and that the non-landslide samples generated by the SOM-OCSVM method proposed in this study are reasonable and accurate.
TABLE 3
| Sample method | LGR | MLP | SVM | RF | ||||
|---|---|---|---|---|---|---|---|---|
| AUC | Std | AUC | Std | AUC | Std | AUC | Std | |
| Random | 0.7194 | 0.1947 | 0.7048 | 0.1754 | 0.7206 | 0.1963 | 0.8328 | 0.1703 |
| SOM | 0.8420 | 0.1160 | 0.7810 | 0.1576 | 0.8467 | 0.1207 | 0.9180 | 0.1025 |
| OC-SVM | 0.9073 | 0.0856 | 0.9360 | 0.0864 | 0.9485 | 0.0601 | 0.9765 | 0.0519 |
| SOM-OCSVM | 0.9480 | 0.0517 | 0.9562 | 0.0803 | 0.9689 | 0.0445 | 0.9877 | 0.0354 |
AUC and Std of four machine learning models with different non-landslide datasets.
5 Discussion
As stated in the introduction, most data-driven methods for predicting the distribution of areas of landslide susceptibility depend on data sets with both positive (landslide) and negative (non-landslide) data. However, the list of landslides obtained by remote sensing interpretations, field surveys, and historical records is incomplete. Therefore, unidentified landslides and unstable slopes may be mistakenly selected as non-landslides when the non-landslide samples are considered, which can affect the reliability of LSM. Based on results, the method proposed in this study can improve the reliability of the data-driven model-based LSM by providing reliable non-landslide samples.
There are differences in the performance of the four machine-learning algorithms (MLP, SVM, LGR, and RF) utilized in this work to estimate landslide susceptibility in the same study area. The RF outperformed the other models. It is impossible to find a general approach that applies to all regions. It is therefore necessary to evaluate and compare multiple methods and models in an integrated manner (Lv et al., 2022), or to integrate different algorithmic models (Dou et al., 2020). This will ensure the most suitable method for obtaining reliable LSMs and predicting the location of future landslides more accurately is found, thereby mitigating the damage and loss caused by such disasters.
6 Conclusion
In this study, we proposed a method combining SOM and OC-SVM (SOM-OCSVM) models to generate more reasonable non-landslide samples. Based on four ML models (LGR, MLP, SVM, and RF) established by the generated negative datasets (random, SOM, OC-SVM, and SOM-OCSVM), we performed LSM for the landslides of the Sichuan-Tibet Highway (G318). Model performance was compared using the ROC curve, AUC, and Std. The results show that the selection of non-landslide samples has great influence on the ML model performance in LSM studies, and the method presented in this study can effectively reduce the uncertainty surrounding negative data and significantly improve the performance of the landslide susceptibility model. This method of landslide susceptibility mapping may also be extended to regions with different geological conditions, which may in turn be helpful for further landslide prevention and mitigation.
Statements
Data availability statement
The raw data supporting the conclusion of this article will be made available by the authors, without undue reservation.
Author contributions
CY: model design, formal analysis, conceptualization and writing—review; RT: formal analysis, conceptualization, writing—review and editing; RW, ZG, and HZ: visualization, writing—review and editing, software, and methodology.
Funding
This work was supported in part by the Second Tibetan Plateau Scientific Expedition and Research Program (2019QZKK0902), the National Natural Science Foundation of China (42071411), and the key research and development program of Sichuan Province (2022YFG0200).
Conflict of interest
The authors declare that the research was conducted in the absence of any commercial or financial relationships that could be construed as a potential conflict of interest.
Publisher’s note
All claims expressed in this article are solely those of the authors and do not necessarily represent those of their affiliated organizations, or those of the publisher, the editors, and the reviewers. Any product that may be evaluated in this article, or claim that may be made by its manufacturer, is not guaranteed or endorsed by the publisher.
References
1
Aditian A. Kubota T. Shinohara Y. (2018). Comparison of GIS-based landslide susceptibility models using frequency ratio, logistic regression, and artificial neural network in a tertiary region of Ambon, Indonesia. Geomorphology318, 101–111. 10.1016/j.geomorph.2018.06.006
2
Aslam B. Maqsoom A. Khalil U. Ghorbanzadeh O. Blaschke T. Farooq D. et al (2022). Evaluation of different landslide susceptibility models for a local scale in the chitral district, northern Pakistan. Sensors22, 3107. 10.3390/s22093107
3
Bordoni M. Galanti Y. Bartelletti C. Persichillo M. G. Barsanti M. Giannecchini R. et al (2020). The influence of the inventory on the determination of the rainfall-induced shallow landslides susceptibility using generalized additive models. CATENA193, 104630. 10.1016/j.catena.2020.104630
4
Breiman L. (2001). Random forests. Mach. Learn.45, 5–32. 10.1023/A:1010933404324
5
Chen F. Chen J. Huang W. Chen S. Huang X. Jin L. et al (2019). Westerlies Asia and monsoonal Asia: Spatiotemporal differences in climate change and possible mechanisms on decadal to sub-orbital timescales. Earth. Sci. Rev.192, 337–354. 10.1016/j.earscirev.2019.03.005
6
Chen S. Miao Z. Wu L. Zhang A. Li Q. He Y. (2021). A one-class-classifier-based negative data generation method for rapid earthquake-induced landslide susceptibility mapping. Front. Earth Sci.9. 10.3389/feart.2021.609896
7
Cortes C. Vapnik V. (1995). Support-vector networks. Mach. Learn.20, 273–297. 10.1023/A:1022627411411
8
Dou J. Yunus A. P. Bui D. T. Merghadi A. Sahana M. Zhu Z. et al (2020). Improved landslide assessment using support vector machine with bagging, boosting, and stacking ensemble machine learning framework in a mountainous watershed, Japan. Landslides17, 641–658. 10.1007/s10346-019-01286-5
9
Erener A. Düzgün H. S. B. (2010). Improvement of statistical landslide susceptibility mapping by using spatial and global regression methods in the case of More and Romsdal (Norway). Landslides7, 55–68. 10.1007/s10346-009-0188-x
10
Felicísimo Á. M. Cuartero A. Remondo J. Quirós E. (2013). Mapping landslide susceptibility with logistic regression, multiple adaptive regression splines, classification and regression trees, and maximum entropy methods: A comparative study. Landslides10, 175–189. 10.1007/s10346-012-0320-1
11
Hess D. M. Leshchinsky B. A. Bunn M. Benjamin Mason H. Olsen M. J. (2017). A simplified three-dimensional shallow landslide susceptibility framework considering topography and seismicity. Landslides14, 1677–1697. 10.1007/s10346-017-0810-2
12
Huang F. Yin K. Huang J. Gui L. Wang P. (2017). Landslide susceptibility mapping based on self-organizing-map network and extreme learning machine. Eng. Geol.223, 11–22. 10.1016/j.enggeo.2017.04.013
13
Kavzoglu T. Sahin E. K. Colkesen I. (2014). Landslide susceptibility mapping using GIS-based multi-criteria decision analysis, support vector machines, and logistic regression. Landslides11, 425–439. 10.1007/s10346-013-0391-7
14
Keles F. Nefeslioglu H. A. (2021). Infinite slope stability model and steady-state hydrology-based shallow landslide susceptibility evaluations: The Guneysu catchment area (Rize, Turkey). CATENA200, 105161. 10.1016/j.catena.2021.105161
15
Li D. Huang F. Yan L. Cao Z. Chen J. Ye Z. (2019). Landslide susceptibility prediction using particle-swarm-optimized multilayer perceptron: Comparisons with multilayer-perceptron-only, BP neural network, and information value models. Appl. Sci. (Basel).9, 3664. 10.3390/app9183664
16
Liu Z. Qiu H. Zhu Y. Liu Y. Yang D. Ma S. et al (2022). Efficient identification and monitoring of landslides by time-series InSAR combining single- and multi-look phases. Remote Sens. (Basel).14, 1026. 10.3390/rs14041026
17
Lv L. Chen T. Dou J. Plaza A. (2022). A hybrid ensemble-based deep-learning framework for landslide susceptibility mapping. Int. J. Appl. Earth Obs. Geoinf.108, 102713. 10.1016/j.jag.2022.102713
18
Ma S. Xu C. Shao X. (2020). Spatial prediction strategy for landslides triggered by large earthquakes oriented to emergency response, mid-term resettlement and later reconstruction. Int. J. Disaster Risk Reduct.43, 101362. 10.1016/j.ijdrr.2019.101362
19
Petschko H. Brenning A. Bell R. Goetz J. Glade T. (2014). Assessing the quality of landslide susceptibility maps – case study Lower Austria. Nat. Hazards Earth Syst. Sci.14, 95–118. 10.5194/nhess-14-95-2014
20
Pham B. T. Pradhan B. Tien Bui D. Prakash I. Dholakia M. B. (2016). A comparative study of different machine learning methods for landslide susceptibility assessment: A case study of uttarakhand area (India). Environ. Model. Softw.84, 240–250. 10.1016/j.envsoft.2016.07.005
21
Qiu H. Zhu Y. Zhou W. Sun H. He J. Liu Z. (2022). Influence of DEM resolution on landslide simulation performance based on the Scoops3D model. Geomat. Nat. Hazards Risk13, 1663–1681. 10.1080/19475705.2022.2097451
22
Ritter H. Kohonen T. (1989). Self-organizing semantic maps. Biol. Cybern.61, 241–254. 10.1007/BF00203171
23
Schölkopf B. Williamson R. C. Smola A. Shawe-Taylor J. Platt J. (1999). “Support vector method for novelty detection,” in Advances in neural information processing systems (MIT Press).
24
Swets J. A. (1988). Measuring the accuracy of diagnostic systems. Science240, 1285–1293. 10.1126/science.3287615
25
Wang L. Qiu H. Zhou W. Zhu Y. Liu Z. Ma S. et al (2022). The post-failure spatiotemporal deformation of certain translational landslides may follow the pre-failure pattern. Remote Sens. (Basel).14, 2333. 10.3390/rs14102333
26
Wang W. He Z. Han Z. Li Y. Dou J. Huang J. (2020a). Mapping the susceptibility to landslides based on the deep belief network: A case study in sichuan Province, China. Nat. Hazards103, 3239–3261. 10.1007/s11069-020-04128-z
27
Wang Y. Feng L. Li S. Ren F. Du Q. (2020b). A hybrid model considering spatial heterogeneity for landslide susceptibility mapping in Zhejiang Province, China. CATENA188, 104425. 10.1016/j.catena.2019.104425
28
Wei R. Ye C. Sui T. Ge Y. Li Y. Li J. (2022). Combining spatial response features and machine learning classifiers for landslide susceptibility mapping. Int. J. Appl. Earth Obs. Geoinf.107, 102681. 10.1016/j.jag.2022.102681
29
Yalcin A. Reis S. Aydinoglu A. C. Yomralioglu T. (2011). A GIS-based comparative study of frequency ratio, analytical hierarchy process, bivariate statistics and logistics regression methods for landslide susceptibility mapping in Trabzon, NE Turkey. CATENA85, 274–287. 10.1016/j.catena.2011.01.014
30
Ye C. Wei R. Ge Y. Li Y. Junior J. M. Li J. (2022). GIS-based spatial prediction of landslide using road factors and random forest for Sichuan-Tibet Highway. J. Mt. Sci.19, 461–476. 10.1007/s11629-021-6848-6
31
Zhou W. Qiu H. Wang L. Pei Y. Tang B. Ma S. et al (2022). Combining rainfall-induced shallow landslides and subsequent debris flows for hazard chain prediction. CATENA213, 106199. 10.1016/j.catena.2022.106199
Summary
Keywords
landslide susceptibility mapping, self-organizing map, one-class SVM, the Sichuan-Tibet highway, machine learning
Citation
Ye C, Tang R, Wei R, Guo Z and Zhang H (2023) Generating accurate negative samples for landslide susceptibility mapping: A combined self-organizing-map and one-class SVM method. Front. Earth Sci. 10:1054027. doi: 10.3389/feart.2022.1054027
Received
26 September 2022
Accepted
21 October 2022
Published
16 January 2023
Volume
10 - 2022
Edited by
Haijun Qiu, Northwest University, China
Reviewed by
Yingjun Sun, Shandong Jianzhu University, China
Qi Wen, Technology and Engineering Center for Space Utilization (CAS), Beijing, China
Updates
Copyright
© 2023 Ye, Tang, Wei, Guo and Zhang.
This is an open-access article distributed under the terms of the Creative Commons Attribution License (CC BY). The use, distribution or reproduction in other forums is permitted, provided the original author(s) and the copyright owner(s) are credited and that the original publication in this journal is cited, in accordance with accepted academic practice. No use, distribution or reproduction is permitted which does not comply with these terms.
*Correspondence: Rong Tang, trr_trr@163.com
This article was submitted to Geohazards and Georisks, a section of the journal Frontiers in Earth Science
Disclaimer
All claims expressed in this article are solely those of the authors and do not necessarily represent those of their affiliated organizations, or those of the publisher, the editors and the reviewers. Any product that may be evaluated in this article or claim that may be made by its manufacturer is not guaranteed or endorsed by the publisher.