 Xiaochun Wang
 Duane Waliser2*
 Xianan Jiang
 Frederic Vitart
- 1Joint Institute for Regional Earth System Science and Engineering, University of California at Los Angeles, Los Angeles, CA, United States
- 2Jet Propulsion Laboratory, California Institute of Technology, Pasadena, CA, United States
- 3European Center for Medium-Range Weather Forecasts, Reading, United Kingdom
- 4China Meteorological Administration, Beijing, China
The Daily Tropical Cyclone Probability (DTCP), defined as the probability of tropical cyclone occurrence within 500 km of a location in 1 day, is proposed and used in evaluating subseasonal to seasonal (S2S) predictions from the subseasonal to seasonal Prediction Project Database, from May 1 to October 31, 1999 to 2010. The ensemble forecasts are collected from eleven operational centers, the Bureau of Meteorology (BoM), China Meteorological Administration (CMA), Environment and Climate Change Canada (ECCC), European Centre for Medium-Range Weather Forecasts (ECMWF), Hydrometeorological Centre of Russia (HMCR), the Institute of Atmospheric Sciences and Climate of the National Research Council of Italy (ISAC), the Japan Meteorological Agency (JMA), the Korea Meteorological Administration (KMA), Météo-France/Centre National de Recherche Meteorologiques (METFR), the United States National Centers for Environmental Prediction (NCEP), and the United Kingdom Met Office (UKMO). In both observation and these eleven forecast models, the daily tropical cyclone probability is modulated by the Boreal Summer Intraseasonal Oscillation (BSISO), depicted by the two indices, boreal summer intraseasonal oscillation 1 and boreal summer intraseasonal oscillation 2. During boreal summer intraseasonal oscillation 1 phases 1, 5, 6, 7, and 8, the daily tropical cyclone probability in the western North Pacific region is ∼3.5 times higher. Similarly, during phases 1, 2, 3, 4, and 8 of boreal summer intraseasonal oscillation 2, the daily tropical cyclone probability is ∼2.5 times higher. Among the eleven models, the European Centre for Medium-Range Weather Forecasts model best reproduces the climatological daily tropical cyclone probability and its modulation by the boreal summer intraseasonal oscillation in the western North Pacific region, followed by the United States National Centers for Environmental Prediction, the Korea Meteorological Administration, the Japan Meteorological Agency models. Using the daily tropical cyclone probability metric, the highest debiased Brier Skill Score of the eleven models is from European Centre for Medium-Range Weather Forecasts, which has a slightly less skillful prediction than the reference climatological forecast with lead time 11–30 days. The skill of the eleven models is higher during the non-active phases of tropical cyclone activity than their skill during the active phases.
1 Introduction
The skill of synoptic weather forecast has improved steadily over the last several decades because of the advancing capabilities of numerical prediction models, data assimilation algorithms, computational hardware, and the increasing amounts and types of observational data (Bauer et al., 2015). An opportunity and recent focus for the scientific and operational communities is to make forecasts on Subseasonal to Seasonal (S2S) timescale (NAS, 2016). Research questions regarding S2S forecasting include: what aspects of weather and climate can we predict; what prediction skill should we expect for these phenomena/features; how do we achieve the expected skill; and how to make the best use of the predictable signals and associated forecasts at S2S timescale? In present research, we focus on the S2S prediction of tropical cyclones: what to predict for tropical cyclones on S2S timescale; how to evaluate the S2S tropical cyclone prediction; what aspects of the model contribute to the prediction skill?
Regarding predicting tropical cyclones at medium range timescale (e.g., 0–14 days), track and intensity are used to measure prediction accuracy (e.g., DeMaria et al., 2014; Cangialosi and Franklin 2017). However, when evaluating tropical cyclone prediction skill at S2S timescale, such as between 11 and 30 days, metrics such as track and intensity are not applicable anymore since the current S2S forecast systems cannot predict tropical cyclone with the needed accuracy. What aspects of tropical cyclones to predict and how to evaluate prediction skill on S2S timescale still need further research (Camargo et al., 2019).
On the S2S timescale, it is generally agreed that the tropical intraseasonal oscillations, including the Madden Julian Oscillation (MJO) and Boreal Summer Intraseasonal Oscillation (BSISO), exhibit predictability (e.g., Kim et al., 2008; Waliser 2011; Neena et al., 2014a; Neena et al., 2014b; Lee et al., 2015; Xiang et al., 2015). In addition, research has shown that the MJO and BSISO can modulate the activity of tropical cyclones (e.g., Maloney and Hartmann 2000; Goswami et al., 2003; Camargo et al., 2009; Vitart 2009; Zhao et al., 2015; Jiang et al., 2018). For example, during phases of intraseasonal oscillation with enhanced convection in the western North Pacific Ocean in boreal summer, there is a tendency for tropical cyclones to form in the region (e.g., Zhao et al., 2015). Thus, our capabilities to predict the MJO or BSISO out to 3–5 weeks provide the means to forecast tropical cyclone activity.
In order to promote research, improve prediction skills and expand the capacity of operational S2S forecasting, the World Meteorological Organization (WMO) has launched a 5-year Subseasonal to Seasonal Prediction Project (Vitart et al., 2017; Vitart and Robertson 2018), which has recently been extended for another 5 years (2019–2023). As part of the project, a S2S Prediction Project Database was formed by collecting reforecasts from eleven operational forecast centers. These eleven operational centers are the Australian Bureau of Meteorology (BoM), the China Meteorological Administration (CMA), the European Centre for Medium-Range Weather Forecasts (ECMWF), Environment and Climate Change Canada (ECCC), the Institute of Atmospheric Sciences and Climate of the National Research Council of Italy (ISAC), the Hydrometeorological Centre of Russia (HMCR), the Japan Meteorological Agency (JMA), the Korea Meteorological Administration (KMA), Météo-France/Centre National de Recherche Meteorologiques (METFR), the United States National Centers for Environmental Prediction (NCEP), and the United Kingdom Met Office (UKMO). Using reforecasts from systems of these centers, it was demonstrated that these systems indeed have skill in predicting the BSISO up to two to 3 weeks, although they tend to underestimate the BSISO amplitude as lead time increases (Lee et al., 2015; Jie et al., 2017).
On the S2S timescale, different metrics were proposed to evaluate tropical cyclone prediction skill. These metrics also reflect the level of tropical cyclone prediction skill for that time. The count of tropical cyclones during the tropical cyclone season was proposed at an early stage and is still used at present (Camargo et al., 2019). The striking probability of tropical cyclones for a specific period with a specified distance was also proposed (Vitart et al., 2011). In Yamaguchi et al. (2015), the metric used was the probability of the tropical cyclone occurrence within a 300-km radius from a specific location during a 3-day forecast time window. Their evaluation, however, was combined together for each of the seven tropical cyclone basins, instead of individual grid points. The metrics used by Vitart et al. (2010), Camp et al. (2018) and Gregory et al. (2019) and Lee et al. (2020) is weekly tropical cyclone occurrence over 15olatitude
Instead of using weekly tropical cyclone occurrence in 15olatitude
This paper is organized as follows. After the introduction, Section 2 presents the data and methods used in this study, especially the computation of DTCP and the debiased Brier Skill Score (Weigel et al., 2007) to evaluate the performance of the systems in the S2S Prediction Project Database. Section 3 analyzes the capability of these operational S2S forecast systems in reproducing the modulation of DTCP in the western North Pacific, compares their forecast skill of DTCP, and investigates the relationship between model prediction skill and its performance in representing climatological DTCP and its modulation by BSISO. Section 4 summarizes our main findings and discusses the limitations of current research.
2 Data and methods
2.1 Tropical cyclone track observation and BSISO indices
The tropical cyclone best track data used in the present research is from the Joint Typhoon Warning Center, http://www.metoc.navy.mil/jtwc, which provides the latitude, longitude, wind speed, and sea level pressure of tropical cyclones for every 6 h (Chu et al., 2002). Our study period is from 1999 to 2010, the common period of the reforecasts of the WMO S2S Prediction Project Database (Table 1). Since tropical cyclones tend to appear in boreal summer in the western North Pacific, for each year we only analyze the period from May 1 to November 30, with the last forecast starting from the end of October. We also only use those tropical cyclones with sustained 10 min wind speeds greater than 17.2 m/s at least once during their life cycle, which is a standard criterion for separating tropical storms from tropical cyclones in the Indian Ocean and western North Pacific Ocean (Holland 1993).
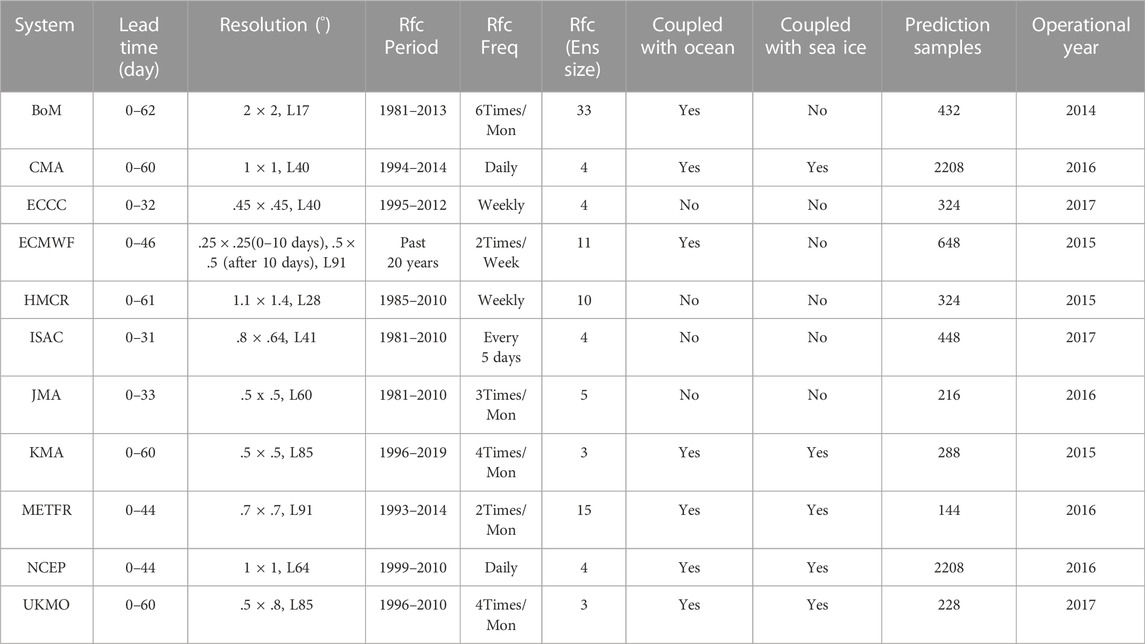
TABLE 1. Details of eleven subseasonal to seasonal (S2S) forecast systems in the WMO S2S Prediction Project Database whose 30-day reforecasts from 1 May to 31 October 1999 to 2010 were used in present research. The lead time (column 2) is forecast lead time in days. The resolution (column 3) is longitude (o) and latitude resolution (o) and the number of levels. The reforecast period (Rfc Period, column 4) is the period when reforecasts are run with reforecast frequency (Rfc Freq, column 5) and ensemble size (Rfc Ens. Size, column 6). The coupling status of these systems is indicated in the column 8 Coupled with Ocean and Coupled with Sea Ice. The number of prediction samples is shown in column 9 and the operational year (column 10) shows the version of the system. Some of the columns are based on Table 1 of Vitart et al. (2017).
To describe the intraseasonal variability during boreal summer, especially the variability in the south and east Asia monsoon region, Lee et al. (2013) proposed BSISO index using multi-variable Empirical Orthogonal Function analysis of 850 hPa zonal wind and outgoing longwave radiation. The time series of the first four principal components are used to construct two indices, BSISO1 and BSISO2. The BSISO1 and 2 indices used are directly from the website http://www.iprc.soest.hawaii.edu/users/jylee/bsiso/, computed using NCEP/DOE Reanalysis II (Kanamitsu et al., 2002). BSISO1 and BSISO2 describe different aspects of boreal summer intraseasonal variability. These two indices are associated with different spatial patterns of wind and outgoing longwave radiation and temporal scales. The temporal scale of BSISO1 is around 30–60 days, while the temporal scale of BSISO2 is around 10–30 days.
2.2 S2S reforecasts
The details of the eleven S2S forecast systems in the S2S Prediction Project Database are summarized in Table 1 which is based on Vitart et al. (2017). The S2S forecast systems have a typical spatial resolution of .25o to 2o degrees. Seven of them are coupled systems with a dynamic oceanic component. The other four systems are not coupled. These systems provide S2S reforecast with lead time varying from 33 to 62 days. In addition, each system has different forecast days and frequencies for their reforecasts, with the number of ensemble members varying from as few as 3 to as many as 33. Only two systems (NCEP, CMA) made reforecasts every day. The number of S2S prediction samples will influence the prediction skill evaluation in subtle ways since tropical cyclones are rare events. The operational year of these systems (last column in Table 1) is also different. In comparing their skill for predicting tropical cyclone activity in the western North Pacific, we used a common grid of 1o × 1o, a prediction lead time of 30 days, prediction samples of common operational years from 1999 to 2010.
The output from these systems in the S2S Prediction Project Database was archived on a 1.5o × 1.5o grid every 24 h. Previous research has shown that tropical cyclones, or close proxies, can be identified and tracked in the output of these systems and used successfully in the evaluation of the genesis (Lee et al., 2018) and weekly tropical cyclone occurrence for 15olatitude
Different forecast systems usually have their own tracking algorithm to identify tropical cyclones in their output (e.g., Camp et al., 2018), which may render different results from the tracking algorithm used in our research. However, the output in the S2S Prediction Project Database was already archived on a 1.5° × 1.5° grid, and it is not practical to use different tracking algorithm for different forecast systems since the tracking algorithms used in different systems and specific criteria are resolution-dependent. The DTCP we used to quantify the evolution and movement of tropical cyclones, only makes use of the location information of tropical cyclones. The influence of using different tracking algorithms may not be significant. On the other hand, all the S2S forecasting systems are directly evaluated against the observed tropical cyclones. Postprocessing, which is forecast system dependent and can improve the prediction skill of a forecast system (e.g., Camp et al., 2018; Lee et al., 2020), is not applied for any of the systems.
2.3 Definition of daily tropical cyclone probability
The DTCP in the present research is defined as the probability of tropical cyclone occurrence within 500 km of a grid point during a particular day. The temporal and spatial criteria of 1 day and 500 km from a specified location are selected for their simplicity in terms of interpretation and application. Different criteria may also be used, like 1 week and 15olatitude
The DTCP is computed on a common 1° × 1° grid over the western North Pacific (0°-30°N, 100°-180°E) for both observation and model outputs. The computation of DTCP is slightly different for ensemble model output and observation. For a particular ensemble forecast system, DTCP is computed for each day as the number of tropical cyclones present in all the ensemble members within 500 km of a location divided by the total number of ensemble members. If this value is greater than 1, it is set as 1. As such, the computed DTCP on each grid is the probability that a tropical cyclone would occur within a radius of 500 km in the ensemble forecast in 1 day. Strictly speaking, the above definition is the average of the number of tropical cyclones capped by one as pointed out by one reviewer. The DTCP from ensemble model output should be the number of members that have tropical cyclones within 500 km of a location divided by the total number of members. Since it is very rare to have two tropical cyclones within 500 km in a model with course resolution of ∼1o degree, we ignore the difference of the two computations.
For observations, the DTCP is computed as the number of tropical cyclones within 500 km of a location at 0GMT for each day. When the number of tropical cyclones exceeds 1, it is set as one. Different from the definition of tropical cyclone density used in Vitart and Robertson (2018), which is the number of tropical cyclones within 200 km of a location, DTCP defined in the present research is always less than or equal to one, and can be interpreted as the probability a tropical cyclone (or tropical cyclones) would occur within 500 km of a particular location. Following the above definition, the occurrence of a tropical cyclone can be treated as a dichotomous event. The DTCP from an ensemble forecast and observation can be directly compared and the forecast skill of tropical cyclones can be measured by debiased Brier Skill Score (Weigel et al., 2007) which can account for the difference in the number of ensemble members compared to the Brier Skill Score proposed by Brier (1950).
As an example, Figure 1 presents DTCPs from eleven forecast systems (Figures 1A–K) and from the observation (Figure 1L) on 20 May 2004. Forecast lead times for this case are selected from 11 to 20 days to focus on the S2S timescale and simultaneously have a minimum difference in lead time among models. On this day, two tropical cyclones are observed in the western North Pacific (Figure 1L), located in the east of the Philippines, one around 12oN, the other around 21oN. In observation (Figure 1L), the DTCP is 1 around the neighborhood of these two tropical cyclones. The eleven forecast models exhibit varying skills in predicting these two tropical cyclones (Figures 1A–K), partly related to different lead times and partly related to their skills in general. For this case, several models, except JMA and HMCR, predict the existence of at least one tropical cyclone. However, these models have various errors in the location of these two tropical cyclones. It should be noted that some of the forecast models tend to overpredict the number of tropical cyclones (ECCC, METFR, NCEP, UKMO). Overall, the forecast results are encouraging and it is plausible to directly compare the DTCP from observation and forecast models to assess the prediction skill of tropical cyclones in these models on the S2S timescale. If the metric to evaluate the skill of tropical cyclone prediction is the number of tropical cyclones within a region (say, 110E-150E, 0-30N), eight of these 11 systems predict one or more tropical cyclones within the region and would have some skills based on this metric. However, the location information of the tropical cyclone might be too broad to be useful for societal applications (Camargo et al., 2019).
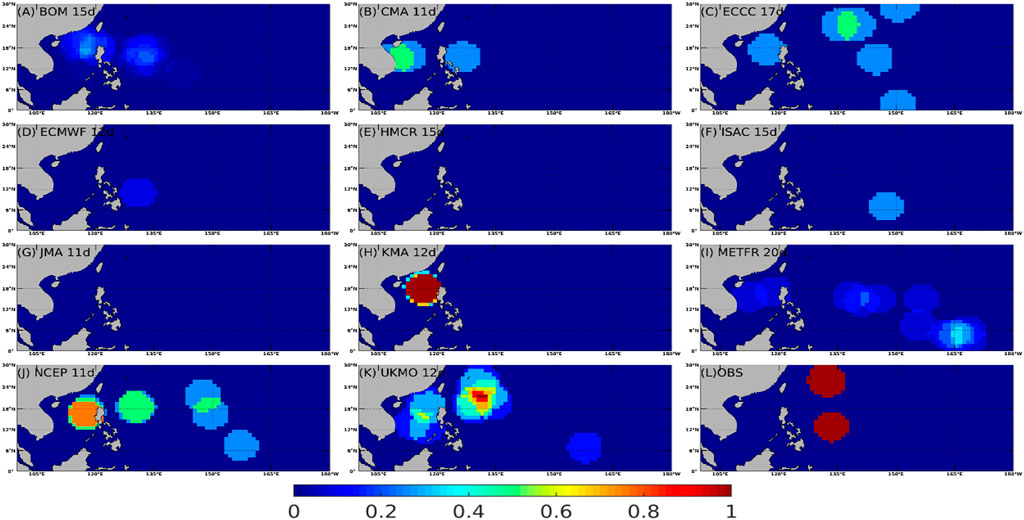
FIGURE 1. The daily tropical cyclone probability on 20 May 2004 computed from reforecast outputs of the eleven forecast systems (A–K) and from observation (L). The lead time of reforecasts, also shown in the figure, varies from 11 to 20 days.
2.4 Debiased brier skill score
With the above definition of DTCP, the daily occurrence of tropical cyclones can be treated as dichotomous events with 1 if the event (tropical cyclone) occurs and 0 if it does not. The Brier Score can then be used as a measure of the accuracy of the tropical cyclone prediction (Brier 1950),
where
In order to assess the skill of a probability forecast, the Brier Skill Score compares the forecast with a reference forecast, such as a climatological forecast, and is defined as
in which
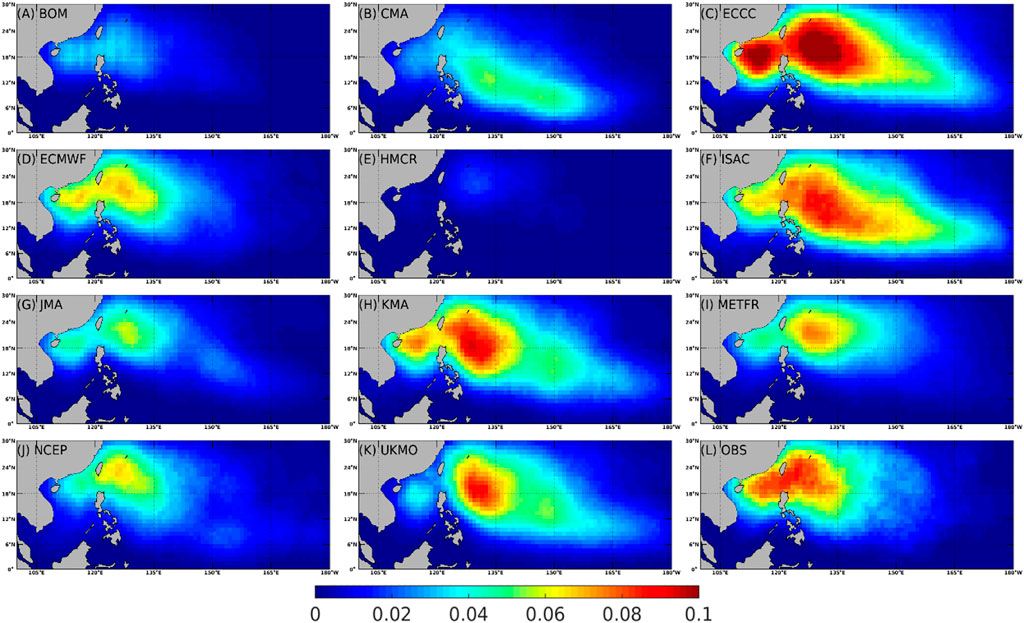
FIGURE 2. The climatological daily tropical cyclone probability based on the reforecasts from the eleven forecast systems (A–K) and from observation (L). For each forecast system, the closest reforecast is used to fill each day from 1 May to 31 October 1999 to 2010, which is the period for averaging.
When ensemble forecasts are involved, small number of ensembles tends to cause a negative bias in the value of the Brier Skill Score as defined by Eq. 2. To remove the bias, a debiased Brier Skill Score (
In Eq. 3, D is
in which M is the number of ensembles and p is the observed climatological DTCP defined above. The term D is used to correct the negative bias when the number of ensemble members is small. As evident from Eq. 4, the correction term D is reciprocal to the number of ensemble members, which becomes small for a large ensemble size. The debiased Brier Skill Score
2.5 Taylor score index
To quantify the skill of the S2S models for reproducing the climatological DTCP and its modulation by BSISO, the Taylor Score (TS) index proposed by Taylor (2001) was used,
where R is the pattern correlation coefficient between the model results and observations, and R0 is the maximum attainable pattern correlation coefficient between the model results and observations, which was taken as 1 in the present research. The pattern correlation coefficient of DTCP was computed using DTCP from each oceanic grid point. The variables
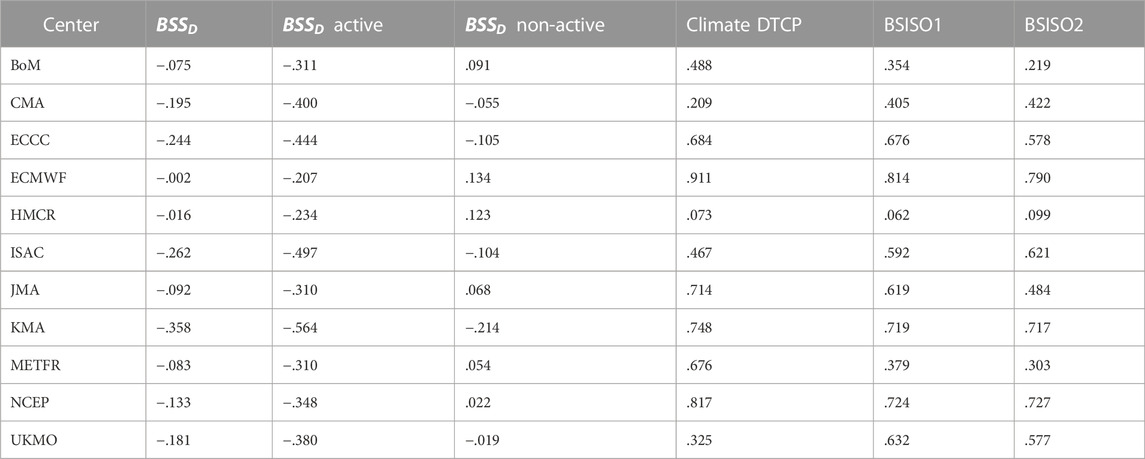
TABLE 2. Averaged debiased Brier Skill Score of daily tropical cyclone probability (DTCP) of the eleven S2S forecast systems between lead time day 11–30 (column 2), averaged debiased Brier Skill Score between lead time day 11–30 for the tropical cyclone active phases (column 2) and tropical cyclone non-active phases of BSISO1 (column 3). The Taylor Score indices of models for reproducing climatological DTCP are shown in column 4 and its modulation by BSISO1 in column 5 and BSISO2 in column 6.
3 Results
3.1 Climatological daily tropical cyclone probability
In order to assess the tropical cyclone prediction in these eleven models, we first evaluate their skill in reproducing the climatological DTCP from 1999 to 2010. To have a robust comparison among eleven models, the days from May 1 to October 30 of each year from 1999 to 2010 are all filled with the closest reforecasts. Thus, all the eleven forecast models have the same number of reforecast of DTCP to compare with observations. Figure 2 compares the climatological DTCP from these forecast models (Figures 2A–K) and the observation (Figure 2L). As expected, a large DTCP appears in the northern part of the South China Sea and east of the Philippines. These forecast models can more or less capture the spatial distribution of the observed DTCP, although fidelity varies. Most of these models (Figures 2D, F, G, I–K) can reproduce the DTCP east of the Philippines, but underestimate DTCP in the northern part of the South China Sea. The maximum observed DTCP is around .1 (Figure 2L), which means one would expect one tropical cyclone every 10 days.
To qualitatively compare the skill of these models in reproducing the observed climatological DTCP, the Taylor diagram is used following Taylor (2001). The ECMWF model can represent the spatial distribution of climatological DTCP the best, followed by NCEP, KMA. and JMA, as shown in the Taylor diagram (Figure 3) and Table 2. The capability of these models in reproducing climatological DTCP will influence their forecast skills.
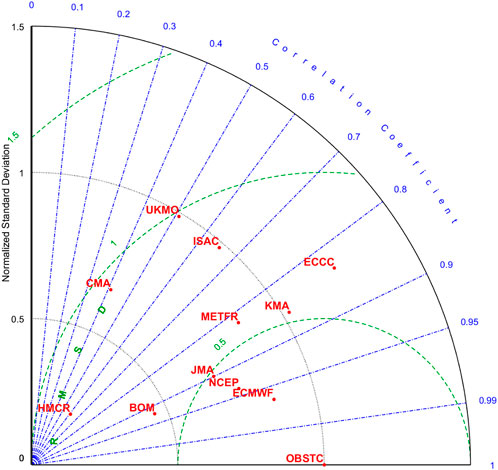
FIGURE 3. Taylor diagram comparison of averaged daily tropical cyclone probability with observation. The ECMWF system can best reproduce the climatological daily tropical cyclone probability, followed by the NCEP, JMA, and KMA systems.
3.2 Modulation of daily tropical cyclone probability by BSISO
Tropical cyclone variability in the western North Pacific is modulated by intraseasonal oscillation (e.g., Vitart 2009; Zhao et al., 2015; Nakano et al., 2021). To evaluate the performance of the eleven forecast models in reproducing the modulation of tropical cyclone variability by intraseasonal oscillation, the DTCP composite for eight phases of BSISO1 and BSISO2 are compared with that from the observation. The same method used in Section 3.1 is also used here to have a 2184-day output from 1999 to 2010 between May 1 and October 31. It should be noted that the composite for model output is based on the observed BSISO index computed by Lee et al. (2013) using NCEP/Department of Energy Reanalysis Ⅱ (Kanamitsu et al., 2002). When constructing composite for BSISO phases, only the days when the magnitude of the BSISO index is greater than 1.5 are used as in Lee et al. (2013).
Modulation of the DTCP by the BSISO is evident in observation (bottom row of Figure 4). It is obvious that the DTCP is much more prominent when BSISO1 is in phases 5, 6, 7, 8, and 1 than that in phases 2, 3, and 4. Eleven models can reproduce this modulation feature with various fidelity. Based on the Outgoing Longwave Radiation (OLR) and 850 hPa wind anomaly patterns of different phases of BSISO1 (Lee et al., 2013), it is evident that the enhanced DTCP is associated with active convection in the northern part of the South China Sea and western North Pacific and the low-level cyclonic circulation that gradually moves northeastward when BSISO1 is in phases 5, 6, 7, 8, and 1 (Figure 9 in Lee et al., 2013). From the observed DTCP, the northeastward movement of large DTCP fields is quite apparent for BSISO1 phases 5, 6, 7, 8, and 1. The observed average DTCP over the northern part of the South China Sea and east of the Philippines (10°-30°N, 105°-150°E) is ∼3.5 times larger during the active phases of the BSISO1 (phases 5, 6, 7, 8, and 1) than that during the non-active phases (phases 2, 3, and 4).
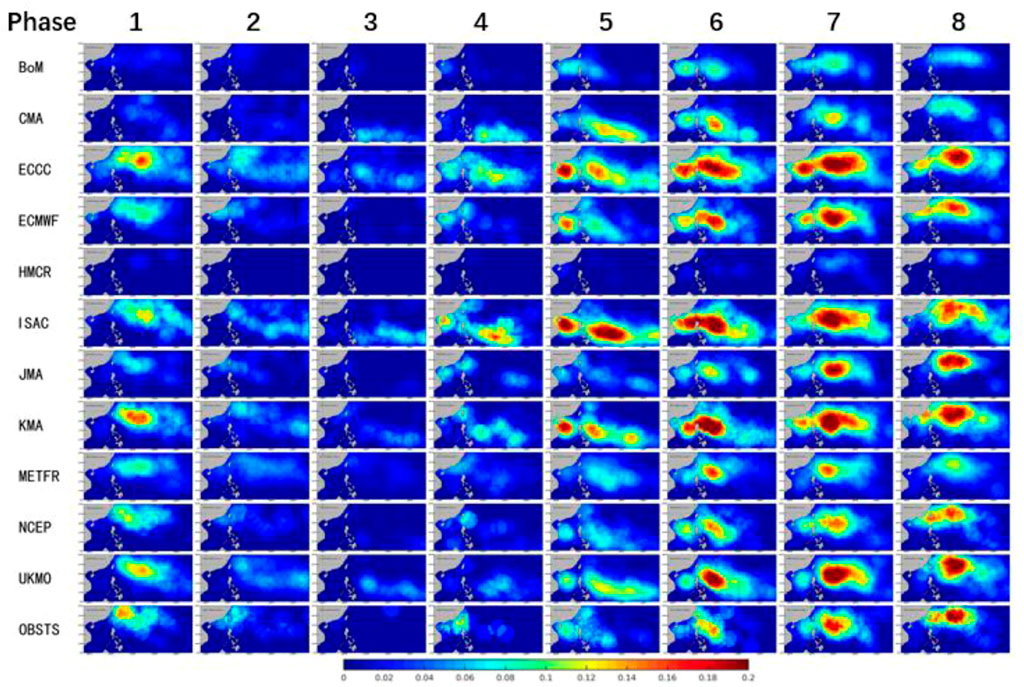
FIGURE 4. Composite daily tropical cyclone probability for eleven forecast systems in the Subseasonal to Seasonal Prediction Project Database and from observation for different phases of BSISO1. The analysis period is from 1 May to 31 October, 1999 to 2010. The columns from left to right are for phases 1 to 8 of BSISO1 when the square root of the sum of squares of principle component 1 and 2 is greater than 1.5. The rows from 1 to 11 are for different forecast systems (BoM, CMA, ECCC, ECMWF, HMCR, JMA, KMA, METFR, NCEP and UKMO). The row 12 is for observed tropical cyclones whose wind speed is greater than 17.2 m/s during its life cycle. The daily tropical cyclone probability is much larger when BSISO1 is in phases 5, 6, 7, 8, and 1 than that in phases 2, 3, and 4.
Similarly, BSISO2 can also modulate the activity of tropical cyclones. Figure 5 illustrates the composite DTCP during the eight phases of BSISO2. When BSISO2 is in phases of 8, 1, 2, 3, and 4, the DTCP is enhanced in the northern part of the South China Sea and north of Taiwan (the bottom row of Figure 5). The average DTCP of the northern part of the South China Sea and east of the Philippines (10°-30°N, 105°-150°E) is ∼2.5 times larger during the phases 8, 1, 2, 3, and 4 than that during the phases 5, 6, and 7. The modulation of DTCP by BSISO, which would have been reproduced in forecasting models, would certainly provide a source of predictability of tropical cyclone activity at the S2S timescale.
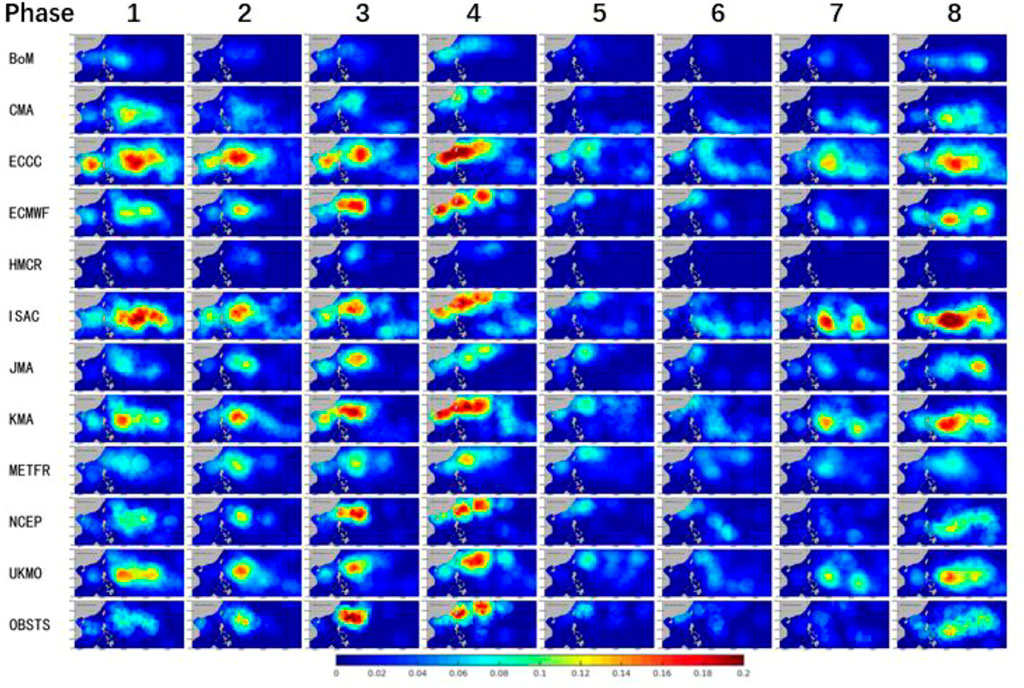
FIGURE 5. The same as Figure 4 except it is for BSISO2, and the daily tropical cyclone probability is much larger when BSISO2 is in phases 8, 1, 2, 3, and 4 than that in phases 5, 6, and 7.
To qualitatively compare the skill of these models in reproducing the modulation of tropical cyclone activity of BSISO, the DTCP fields for eight phases of BSISO over the northern part of the South China Sea and east of the Philippines (10°-30°N,105°-150°E) are combined to compare with the observation in Taylor diagrams (Figure 6A for BSISO1; Figure 6B for BSISO2). From Figures 6A, B, it is evident that the ECMWF model stands out as the best one to reproduce the modulation of tropical cyclone activity by BSISO, followed by NCEP, KMA and other systems. ECMWF has the highest Taylor Score in reproducing the climatological DTCP and its modulation by BSISO1 and BSISO2 (Table 2). The relationship between the model performance in representing the climatological DTCP and the modulation of tropical cyclone activity by BSISO and the skill of S2S tropical cyclone forecast is discussed in Section 3.5 using these Taylor Score indices.
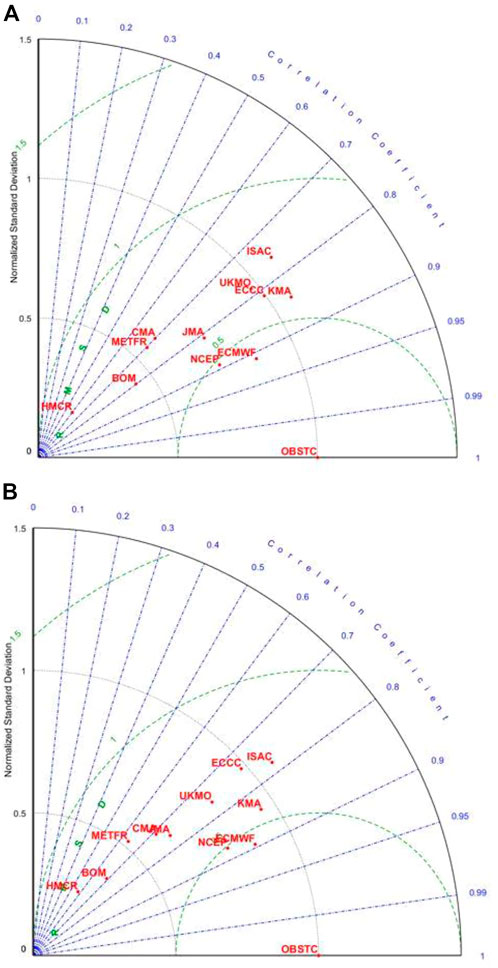
FIGURE 6. Taylor diagram comparison of aggregated composite daily tropical cyclone probability for eight phases of BSISO and observation, (A) for BSISO1, (B) for BSISO2. The ECMWF system can best reproduce the modulation of tropical cyclone activity by BSISO1 and BSISO2, followed by the NCEP system.
3.3 S2S forecast skill of daily tropical cyclone probability
From Figure 2, the climatological DTCP has large values around the northern part of the South China Sea and east of the Philippines (10°-30°N,105°-150°E). To evaluate the performance of these models in terms of their skills in forecasting tropical cyclones, the debiased Brier Skill Score
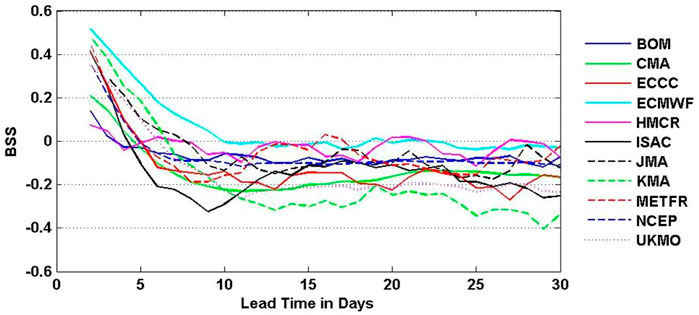
FIGURE 7. Debiased Brier Skill Score (
Regarding the performance of ECMWF, the results above can be compared with that of Lee et al. (2018), Lee et al. (2020). Using the same S2S Prediction Project Database but only for reforecasts from six models, Lee et al. (2018) shows that the ECMWF model has the best performance in predicting tropical cyclone genesis at weekly time windows for all the tropical cyclone basins. Using weekly tropical cyclone occurrence for 15o latitude × 20o longitude boxes, Lee et al. (2020) shows that the ECMWF model has the highest prediction skill in all the tropical cyclone basins. The temporal window and spatial distance selection can impact significantly prediction evaluation results.
In terms of the spatial distribution of
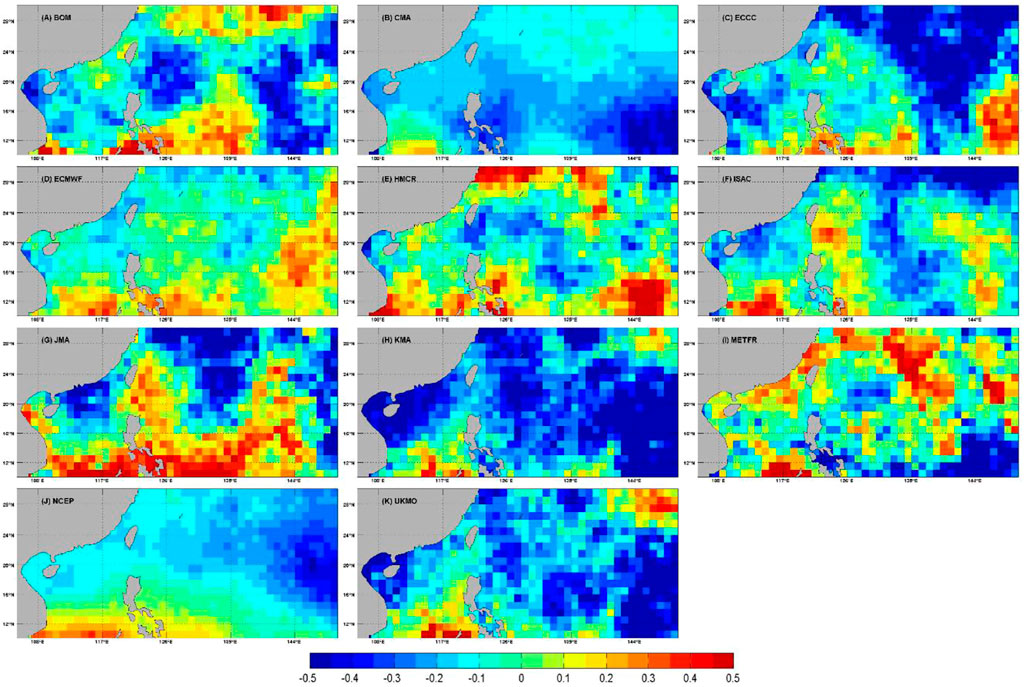
FIGURE 8. The spatial distribution of debiased Brier Skill Score (
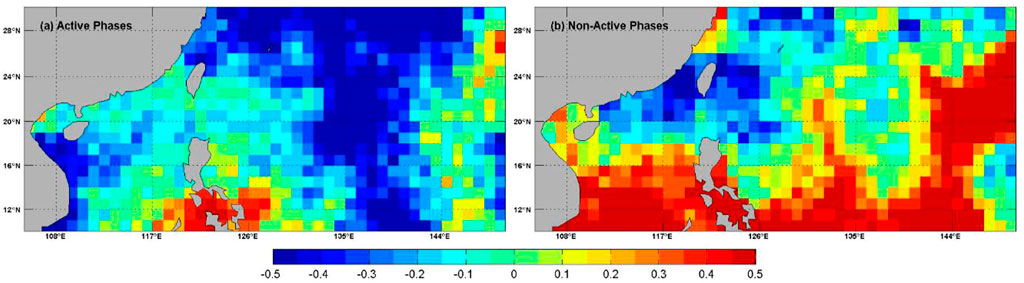
FIGURE 9. The spatial distribution of debiased Brier Skill Score (
3.4 Modulation of S2S tropical cyclone forecast skill by BSISO
The modulation of DTCP by BSISO can also influence its forecast skill. Here we consider the DTCP forecast with lead time 11–30 days and compare the skill between the active phases of tropical cyclones (phases 8, 1, 2, 3, and 4) and non-active phases (phases 5, 6, and 7) for BSISO1. We specifically examine the influence in the ECMWF model given that it demonstrates better forecast skills than the reference climatological forecast for lead time longer than 10 days. Figure 9 compares the
3.5 Relationship of model climatology and its S2S prediction skill
To understand which factors can better explain the S2S prediction skill difference among models, we compute the correlation coefficient between the averaged
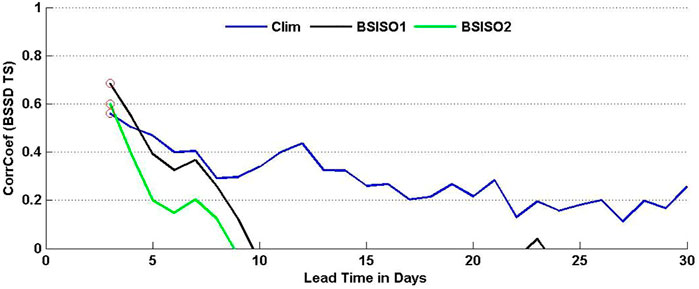
FIGURE 10. The correlation coefficients of spatially averaged debiased Brier Skill Score (
4 Summary and discussion
In order to evaluate the evolution and movement of tropical cyclones at the S2S timescale, especially 11–30 days, daily tropical cyclone probability, or DTCP, is defined as the probability of tropical cyclone occurrence within 500 km of a particular location within 1 day. By using DTCP, the occurrence and movement of tropical cyclones can be treated as dichotomous events in observation and ensemble S2S forecast models and the debiased Brier Skill Score can be used to assess the prediction skill of S2S forecast models for each location. Eleven forecasting models from the WMO S2S Prediction Project Database are evaluated for their capability in reproducing the observed climatological DTCP, modulation of DTCP by the BSISO, and the forecast skill of tropical cyclones on the 11–30 days timescale stemming from this modulation. These eleven models are from the BoM, CMA, ECCC, ECMWF, HMCR, ISAC, JMA, KMA, METFR, NCEP, and UKMO. The BSISO can modulate the tropical cyclone activity. When the BSISO1 is in phases 1, 5, 6, 7, and 8, the DTCP is ∼3.5 times larger than that in phases 2, 3, and 4 in the northern part of the South China Sea and east of the Philippines (10°-30°N,105°-150°E). Similarly, when BSISO2 is in phases 1, 2, 3, 4, and 8, the DTCP is ∼2.5 times larger than that in phases 5, 6, and 7. These eleven models have various skills in reproducing the climatological DTCP and its modulation by BSISO. Forecast models that faithfully reproduce observed DTCP and its modulation by intraseasonal oscillation are also better at forecasting tropical cyclones.
In the framework presented, the ECMWF model has the highest debiased Brier Skill Score in predicting tropical cyclones at the 11–30 days timescale and is slightly less skillful than the reference climatological forecast. This result remains the same even if we modify the definition of Daily Tropical Cyclone Probability to Three-Day Tropical Cyclone Probability since the reference climatological probability used in the debiased Brier Skill Score is also increased accordingly. Like other models, the ECMWF model has a better skill for the non-active phases of tropical cyclone, indicating that part of its prediction skill comes from predicting low DTCP conditions correctly. The difference in S2S tropical cyclone prediction skill is positively correlated with the performance of models in reproducing the climatological DTCP. In addition, in order to make robust evaluation of extreme events of S2S forecast, the number of forecast samples needs to be large enough. Models that cannot reproduce the climatological feature of extreme events and only make prediction occasionally might achieve an artificially high debiased Brier Skill Score and need to be treated with caution when interpreting their prediction skill. This work is based on earlier versions of the eleven forecast models from the S2S Prediction Project Database. Currently the Database was extended to include reforecasts from the updated versions of these models and the twelfth model was just added to the Database. In current research, tropical cyclone forecasts have not been calibrated. Improvements in prediction skill scores can be gained by correcting model systematic errors. All these aspects should be further explored in future research.
Data availability statement
The original contributions presented in the study are included in the article/supplementary material, further inquiries can be directed to the corresponding author.
Author contributions
XW conducted the Daily Tropical Cyclone Probability analysis and drafted the manuscript. FV and WJ conducted the tracking of tropical cyclones in the WMO S2S Database. DW secured the funding and provided general directions. XJ and SA contributed to the revision of the manuscript.
Funding
XW was partly supported by NASA grant NNH16ZDA001-WEATHER.
Acknowledgments
The research was carried out, in part, by the Jet Propulsion Laboratory (JPL), California Institute of Technology, under contract with the National Aeronautics and Space Administration (NASA). The access to ECMWF archived data through account DS-6485 is greatly appreciated. Comments from reviewers helped us greatly in clarifying some details.
Conflict of interest
The authors declare that the research was conducted in the absence of any commercial or financial relationships that could be construed as a potential conflict of interest.
Publisher’s note
All claims expressed in this article are solely those of the authors and do not necessarily represent those of their affiliated organizations, or those of the publisher, the editors and the reviewers. Any product that may be evaluated in this article, or claim that may be made by its manufacturer, is not guaranteed or endorsed by the publisher.
References
Bauer, P., Thorpe, A., and Brunet, G. (2015). The quiet revolution of numerical weather prediction. Nature 525, 47–55. doi:10.1038/nature14956
Brier, G. W. (1950). Verification of forecasts in expressed in terms of probability. Mon. Wea. Rev. 78 (1), 1–3. doi:10.1175/1520-0493(1950)078<0001:vofeit>2.0.co;2
Camargo, S. J., Wheeler, M. C., and Sobel, A. H. (2009). Diagnosis of the MJO modulation of tropical cyclogenesis using an empirical index. J. Atmos. Sci. 66, 3061–3074. doi:10.1175/2009jas3101.1
Camargo, S. J., Camp, J., Elsberry, R. L., Gregory, P. A., Klotzbach, P. J., Schreck, C. J., et al. (2019). Tropical cyclone prediction on subseasonal time-scales. Trop. Cyclone Res. Rev. 8, 150–165. doi:10.1016/j.tcrr.2019.10.004
Camp, J., Wheeler, M. C., Hendon, H. H., Gregory, P. A., Marshall, A. G., Tory, K. J., et al. (2018). Skilful multiweek tropical cyclone prediction in ACCESS-S1 and the role of the MJO. Q. J. R. Meteorol. Soc. 144, 1337–1351. doi:10.1002/qj.3260
Cangialosi, J. P., and Franklin, J. L. (2017). National hurricane center forecast verification report: 2016 hurricane season. Miami, FL: National Hurricane Center, 72. Available at: www.nhc.noaa.gov/verification/pdfs/Verification_2016.pdf.
Chu, J.-H., Sampson, C. R., Lavine, A., and Fukada, E. (2002). The Joint Typhoon warning center tropical cyclone best-tracks, 1945-2000. Tech. Rep. NRL/MR/7540-02-16. Honolulu, HI: Naval Research Laboratory, 22.
DeMaria, M., Sampson, C. R., Knaff, J. A., and Musgrave, K. D. (2014). Is tropical cyclone intensity guidance improving? Bull. Amer. Meteor. Soc. 95, 387–398. doi:10.1175/BAMS-D-12-00240.1
Goswami, B. N., Ajayamohan, R. S., Savier, P. K., and Sengupta, D. (2003). Clustering of synoptic activity by Indian summer monsoon intraseasonal oscillations. Geophys. Res. Lett. 30, 8. doi:10.1029/2002GL016734
Gregory, P. A., Camp, J., Bigelow, K., and Brown, A. (2019). Subseasonal predictability of the 2017-2018 Southern Hemisphere tropical cyclone season. Amos. Sci. Lett. 20, e886. doi:10.1002/asl.886
Holland, G. J. (1993). Global guide to tropical cyclone forecasting. Report No. TCP-31, 9.1-9.26. Geneva, Switzerland: World Meteorological Organization. WMO/TC-No. 560.
Jiang, X., Xiang, B., Zhao, M., Li, T., Lin, S.-J., Wang, Z., et al. (2018). Intraseasonal tropical cyclogenesis prediction in a global coupled model system. J. Clim. 31, 6209–6227. doi:10.1175/JCLI-D-17-0454.1
Jie, W., Vitart, F., Wu, T., and Liu, X. (2017). Simulations of the Asian summer monsoon in the sub-seasonal to seasonal prediction project (S2S) database. Q. J. R. Meteorol. Soc. 143, 2282–2295. doi:10.1002/qj.3085
Kanamitsu, M., Ebisuzaki, W., Woollen, J., Yang, S.-K., Hnilo, J. J., Fiorino, M., et al. (2002). NCEP-DOE AMIP-II Reanalysis (R-2). Bull. Am. Meteorol. Soc. 83, 1631–1644. doi:10.1175/BAMS-83-11-1631
Kim, H.-M., Hoyos, C. D., Webster, P., and Kang, I.-S. (2008). Sensitivity of MJO simulation and predictability to sea surface temperature variability. J. Clim. 21, 5304–5317. doi:10.1175/2008jcli2078.1
Lee, J., Wang, B., Wheeler, M. C., Fu, X., Waliser, D. E., and Kang, I. S. (2013). Real-time multivariate indices for the boreal summer intraseasonal oscillation over the Asian summer monsoon region. Clim. Dyn. 40, 493–509. doi:10.1007/s00382-012-1544-4
Lee, S.-S., Wang, B., Waliser, D. F., Neena, J. M., and Lee, J.-Y. (2015). Predictability and prediction skill of the boreal summer intraseasonal oscillation in the Intraseasonal Variability Hindcast Experiment. Clim. Dyn. 45, 2123–2135. doi:10.1007/s00382-014-2461-5
Lee, C., Camargo, S., Vitart, F., Sobel, A., and Tippett, M. (2018). Sub-seasonal tropical cyclone Genesis prediction and MJO in the S2S dataset. Wea. Forecast. 33, 967–988. doi:10.1175/WAF-D-17-0165.1
Lee, C-Y., Camargo, S. J., Vitart, F., Sobel, A. H., Camp, J., Wang, S., et al. (2020). Subseasonal predictions of tropical cyclone occurrence and ACE in the S2S database. Weather Forecast.35, 921–938. doi:10.1175/WAF-D=19-0217.1
Maloney, E. D., and Hartmann, D. L. (2000). Modulation of eastern north Pacific hurricanes by the madden–julian oscillation. J. Clim. 13 (9), 1451–1460. doi:10.1175/1520-0442(2000)013<1451:moenph>2.0.co;2
Nakano, M., Vitart, F., and Kikuchi, K. (2021). Impact of the boreal summer intraseasonal oscillation on typhoon tracks in the Western North Pacific and the prediction skill of the ECMWF model. Geophys. Res. Lett. 48, e2020GL091505. doi:10.1029/2020GL091505
NAS (2016). Next generation Earth system prediction: Strategies for subseasonal to seasonal forecasts. Washington DC: National Research Council, National Academy of Sciences, 290. ISBN-978-0-309-38880-1.
Neena, J. M., Jiang, X., Waliser, D., Lee, J.-Y., and Wang, B. (2014a). Eastern pacific intraseasonal variability: A predictability perspective. J. Clim. 27, 8869–8883. doi:10.1175/jcli-d-14-00336.1
Neena, J. M., Lee, J.-Y., Waliser, D., Wang, B., and Jiang, X. (2014b). Predictability of the madden–julian oscillation in the intraseasonal variability hindcast experiment (ISVHE). J. Clim. 27, 4531–4543. doi:10.1175/jcli-d-13-00624.1
Taylor, K. E. (2001). Summarizing multiple aspects of model performance in a single diagram. J. Geophys. Res. 106 (D7), 7183–7192. doi:10.1029/2000jd900719
Vitart, F., and Robertson, A. W. (2018). The sub-seasonal to seasonal prediction project (S2S) and the prediction of extreme events. Clim. Atmos. Sci. 1, 3. doi:10.1038/s41612-018-0013-0
Vitart, F., and Stockdale, T. N. (2001). Seasonal forecasting of tropical storms using coupled GCM integrations. Mon. Wea. Rev. 129, 2521–2537. doi:10.1175/1520-0493(2001)129<2521:sfotsu>2.0.co;2
Vitart, F., Anderson, J. L., and Stern, W. F. (1997). Simulation of interannual variability of tropical storm frequency in an ensemble of GCM integrations. J. Clim. 10, 745–760. doi:10.1175/1520-0442(1997)010<0745:soivot>2.0.co;2
Vitart, F., Leroy, A., and Wheeler, M. C. (2010). A comparison of dynamical and statistical predictions of weekly tropical cyclone activity in the southern hemisphere. Mon. Wea. Rev. 138, 3671–3682. doi:10.1175/2010MWR3343.1
Vitart, F., Prates, F., Bonet, A., and Sahin, C. C. (2011). New tropical cyclone products on the web. ECMWF Newsletter, No. 130, Reading. United Kingdom, 17–23. Available online at: http://old.ecmwf.int/publications/newsletters/pdf/130.pdf.
Vitart, F., Ardilouze, C., Bonet, A., Brookshaw, A., Chen, M., Codorean, C., et al. (2017). The subseasonal to seasonal (S2S) prediction project database. Bull. Am. Meteorol. Soc. 98 (1), 163–173. doi:10.1175/bams-d-16-0017.1
Vitart, F. (2009). Impact of the Madden Julian Oscillation on tropical storms and risk of landfall in the ECMWF forecast system. Geophys. Res. Lett. 35, L15802. doi:10.1029/2009GL039089
Waliser, D. E. (2011). “Predictability and forecasting,” in Intraseasonal variability of the atmosphere-ocean climate system. Editors W. K. M. Lau, and D. E. Waliser 2nd Edition (Heidelberg, Germany: Springer), 613.
Weigel, A. P., Liniger, M. A., and Appenzeller, C. (2007). The discrete brier and ranked probability skill scores. Mon. Weather Rev. 135 (1), 118–124. doi:10.1175/mwr3280.1
Xiang, B., Zhao, M., Jiang, X., Lin, S.-J., Li, T., Fu, X., et al. (2015). The 3–4-week MJO prediction skill in a GFDL coupled model. J. Clim. 28, 5351–5364. doi:10.1175/jcli-d-15-0102.1
Yamaguchi, M., Vitart, F., Lang, S. T. K., Magnusson, L., Elsberry, R. L., Elliot, G., et al. (2015). Global distribution of the skill of tropical cyclone activity forecasts on short-to medium-range time scales. Wea. Forecast. 30, 1695–1709. doi:10.1175/WAFD-14-00136.1
Keywords: subseasonal to seasonal (S2S), boreal summer intraseasonal oscillation (BSISO), daily tropical cyclone probability, WMO S2S prediction project database, western North Pacific, debiased brier skill score, ensemble forecast
Citation: Wang X, Waliser D, Jiang X, Asharaf S, Vitart F and Jie W (2023) Evaluating western North Pacific tropical cyclone forecast in the subseasonal to seasonal prediction project database. Front. Earth Sci. 10:1064960. doi: 10.3389/feart.2022.1064960
Received: 09 October 2022; Accepted: 26 December 2022;
Published: 10 January 2023.
Edited by:
Johnna Maria Infanti, Climate Prediction Center (NOAA), United StatesReviewed by:
Chao Wang, Nanjing University of Information Science and Technology, ChinaKurt Hansen, Naval Research Laboratory Marine Meteorology Division, United States
Copyright © 2023 Wang, Waliser, Jiang, Asharaf, Vitart and Jie. This is an open-access article distributed under the terms of the Creative Commons Attribution License (CC BY). The use, distribution or reproduction in other forums is permitted, provided the original author(s) and the copyright owner(s) are credited and that the original publication in this journal is cited, in accordance with accepted academic practice. No use, distribution or reproduction is permitted which does not comply with these terms.
*Correspondence: Duane Waliser, ZHVhbmUuZS53YWxpc2VyQGpwbC5uYXNhLmdvdg==