 QingHua Li
 Cong Chen
- School of Economics and Management, University of Science and Technology Beijing, Beijing, China
The city’s industrial transformation leads to a large amount of carbon emissions, which poses a thorny problem for the allocation of carbon responsibilities. This study established a multi-dimension long-term carbon emission analysis model to explore the characteristic of Beijing’s embodied carbon emissions, which could calculate the production-based, consumption-based and income-based carbon emissions. Then, structural decomposition analysis was adopted to quantify the contribution of socioeconomic factors in local and imported carbon emissions. In addition, emission linkage analysis was used for revealing the long-term evolutionary trajectories of sectors. The key discovery can be summarized as follows: 1) the fluctuation trend of production-side and income-side carbon emissions in Beijing is stable and decreased by 3.53% from 2002 to 2017, while consumption-side carbon emissions increased rapidly by 795.45%. 2) The energy, transportation and other services sectors from the supply, production and consumption perspectives. 3)Per capita consumption, production structure and consumption structure are the major contributors of carbon emissions. The study is expected to provide decision support for policymakers to reasonably formulate carbon mitigation policies and allocate carbon mitigation responsibilities from multiple perspectives, and promote the realization of the “carbon peak and carbon neutrality” strategy.
1 Introduction
Modern cities and industries have significantly improved people’s living conditions, but they have also brought enormous pressure on the ecological environment (Giannakis et al., 2019; Sun et al., 2022). Climate disasters caused by greenhouse gas emissions, especially carbon dioxide, have become a serious problem that threatens the survival of all human beings. China, as the world’s largest emitter of carbon dioxide, has announced a series of climate commitments and policies to achieve carbon mitigation goals in order to curb climate warming and promote global carbon neutrality (Guilhot, 2022; Zhang and Wang, 2022). The Chinese government pledged to peak carbon by 2030 and achieve carbon neutrality by 2060 at the international summit (Xinhua News Agency, 2020). Domestically, the Chinese government has issued a series of detailed policy documents to provide guidance for carbon mitigation, such as the Action Plan for Carbon Dioxide Peaking Before 2030 and the 14th Five-Year Plan for Circular Economy Development. However, the formulation of current policies was mostly based on production-based carbon accounting method, which could not adequately assess the complex impacts of cities on the carbon emissions system (Zhai et al., 2020a). The lack of scientific carbon emission accounting methods will mislead the allocation of urban carbon emission responsibilities and have a negative impact on the implementation of carbon mitigation policies (Xu et al., 2020). Therefore, it is necessary to explore scientific and multi-dimension urban carbon emission accounting method, and propose policy suggestions from multiple perspectives to promote the realization of carbon mitigation goals.
Previously, many scholars have conducted extensive research on carbon emission accounting methods to analyze key emission sectors in cities, many of which focused on the production-based carbon emission (PBE) (Zhang et al., 2016; Liu et al., 2020; Wang and Yang, 2021). Production-based accounting method can calculate carbon emissions from local production, which is caused by local and export demand (Peters, 2008; Wiedenhofer et al., 2017; Mi et al., 2020). For example, Xu et al. (2021) argued that production-based accounting method can be used to compile provincial carbon inventories and track the flow of implied carbon emissions. In addition, Luo et al. (2020) and Li et al. (2022) showed that the production-based accounting method can analyze the trend of carbon emission changes in specific sectors. It was widely used in the United Nations Framework Convention on Climate Change (UNFCCC) and gas emission inventories at the national and city level. However, with the development of international and inter-provincial trade, more and more emissions are implied in the trade of goods and services (Wu et al., 2022). Production-based accounting method cannot calculate the carbon emissions contained in imported goods, and ignores the important role of the final consumer in the carbon emissions process (Atkinson et al., 2011; Chen et al., 2020). This will negatively impact the allocation of overall carbon responsibility (Shao et al., 2020). A consumption-oriented city is often regarded as a low-carbon city from the perspective of production, because many cities transferred production activities to other regions in the industrial transformation (Wen and Wang, 2020). This is obviously unfair. It interferes with the reasonable allocation of carbon emission reduction responsibilities and hinders the realization of carbon emission reduction goals.
To address the above problem, some studies have proposed a consumption-based carbon emission (CBE) accounting method (Feng et al., 2014; Mi et al., 2016; Mi et al., 2019). Compared with production-based accounting method, consumption-based accounting method could calculate the carbon emissions contained in regional imported products, and assess the carbon responsibility of consumers (Peters and Hertwich, 2008; Wiedmann, 2009; Kim and Tromp, 2021). For example, Hubacek et al. (2017) indicated that consumption-based accounting method can estimate the contribution of final demand on carbon emissions. Steininger et al. (2014) concluded that consumption-based accounting method can improve the cost-effectiveness and justice of carbon mitigation. In addition, this method is also increasingly applied to the analysis of national perspective (Steininger et al., 2016; Rocco et al., 2020). Based on consumption accounting method, Zhang and Liang (2022) and Ma et al. (2022) studied the heterogeneity of carbon intensity in China’s inter-provincial trade, and discussed the impact of consumption on regional carbon emissions responsibility. In summary, consumption-based accounting method promotes the understanding of the relationship between inter-regional trade and carbon transfer, and provides a theoretical basis for the allocation of carbon mitigation responsibilities in consumption-oriented cities. Although consumption-based accounting method can track various types of carbon emissions driven by demand at the end of the industrial chain and complement the blind spots of production-based perspective (Harris et al., 2020), but it ignores the role of primary inputs (e.g., labor forces, capital and government services) in the industrial chain, and underestimates the carbon mitigation potential on the supply side (Roca and Serrano, 2007). Therefore, scientific assessment of the carbon emission structure of cities requires more research perspectives.
Fortunately, income-based accounting method can assess the impact of primary inputs on the production process and identify the key supply-side sectors (Li et al., 2018; Xu et al., 2019), which can be used by policymakers to quantify the responsibility of supply-side sectors in the industrial chain (Xie et al., 2017). Liang et al. (2017) found that resource exporters such as Russia and Saudi Arabia should be more responsible for carbon emissions from primary inputs between 1995 and 2009. In addition, income-based accounting method can also provide support for the formulation of supply-side policies for industrial clusters (Chen et al., 2019). Liang et al. (2016) used income-based accounting method to calculate greenhouse gas emissions across United States industries and identified key sectors on the supply side. This method has also been used in many researches to study the situation in China (Zhang, 2015; Yan et al., 2018; Chen et al., 2019). In general, most of the previous studies on urban income-based carbon emissions (IBE) are from an isolated perspective (Xu et al., 2020), lacking a systematic analysis linked to the production and consumption sides. This will lead to unscientific carbon emission policies. Therefore, it is necessary to explore a comprehensive carbon emission accounting model from multiple perspectives, which is a preliminary preparation for formulating urban carbon mitigation policies.
Analyzing the socioeconomic factors that cause changes in carbon emissions is critical for developing urban carbon mitigation targets and policies. To investigate this problem, the decomposition analysis (DA) provides a practical tool to quantify the effect of different socioeconomic factors on specific objects (Hoekstra and Bergh, 2002). There are two commonly used DA tools, namely index decomposition analysis (IDA) and structural decomposition analysis (SDA), which are widely used in the study of changes in environmental indicators (Wang et al., 2017; Jiang et al., 2022). The advantage of SDA is that the impacts of changes in socioeconomic factors on environmental indicators can be analyzed from a macro perspective, which is achieved by decomposing the change in environmental indicators into multiple components. Due to the flexibility and practicality of this approach, this method is widely used in carbon emission studies based on input-output (IO) table (Chen and Zhu, 2019; Wang and Yang, 2021; Wen et al., 2022). For example, Wen et al. (2022) analyzed the carbon emission drivers of 38 industrial sub-sectors in China through SDA, and identified potential emission reduction strategies. Wang and Yang (2021) argued that SDA can be used to compare the differences in the economic structure of regions or countries, and provide systematic recommendations for industrial policy. Findings from SDA are helpful to explore the impacts of important socioeconomic factors on carbon emissions. However, previous SDA studies on carbon emissions rarely focused on the changing mechanism of urban CBE, and most of them regard cities as a producer of carbon emissions (Zhai et al., 2020a). In addition, many studies ignored the heterogeneity of carbon emission structure between local and imported products. Therefore, there are fewer studies decomposing the socioeconomic influences of local and imported CBE. A comprehensive analysis of urban CBE from the two perspectives of local and imported consumption will help to deepen the comprehension of urban carbon emission mechanism.
Neither the three-perspective carbon emission accounting (i.e., production-based, consumption-based, income-based) method nor SDA can analyze the internal relationship of urban industries, but carbon emission linkage analysis (ELA) can fill this research gap. There are two forms of interaction between sectors in the industrial chain, which are called forward linkage effect (FLE) and backward linkage effect (BLE) (Lenzen, 2003). This method can analyze the upstream and downstream relationships between sectors, quantify the influence of sectors in the industrial chain, and discover important production and consumption sectors (Wang et al., 2013; Wang G et al., 2022). For example, Zhang et al. (2018) identified high-priority sectors for environmental emissions using ELA, while Xu et al. (2020) analyzed the long-term impact of carbon mitigation policies on the industrial chain by tracking and observing changes in sectoral roles. In summary, ELA can help city managers understand the carbon interaction mechanism within the industrial chain and study the changes in carbon structure caused by industrial transformation.
In previous studies, a lot of important work has been carried out to analyze carbon emissions and formulate the scientific carbon mitigation strategies. However, several research gaps still need to be remedied. First, the majority of studies focus on the singleness perspective carbon analysis from consumption or production sides, and few of them analyze the carbon emissions from multi-dimension perspectives. It may lead to unreasonable allocation of carbon emission responsibilities. Second, many studies assumed that cities are producers of carbon emissions, ignoring the contribution of cities on the consumption side when using SDA. Furthermore, research on the distinction between local and imported products in the SDA of CBE remains insufficient. Third, few studies focused on the upstream and downstream linkages between sectoral carbon emissions in the production process at the city level. Filling the existence of these research gaps is of great significance for exploring the internal mechanism of urban carbon emissions.
In order to bridge the research gaps, this contribution of this study are as follows: 1) different from most previous studies based on single perspective analysis, this paper proposes a multiple-dimension carbon emission accounting model based on production, consumption and income perspectives, and studies the characteristics in sectoral carbon emissions from different perspectives. This model can be used to analyze the carbon emissions of different types of cities. 2) In order to further study the carbon emission structure of consumption-oriented cities, this paper conducts structural decomposition analysis on the local and import parts of CBE respectively, and studies the difference and change mechanisms of socioeconomic factors (e.g., population, per capita consumption, consumption structure, production structure, carbon emission intensity) that affect the change of carbon emissions. 3) Analyze the direction of carbon transfer and observe the changes in carbon relationship between sectors after urban industrial transformation through ELA. 4) Conduct a dynamic analysis from long-term coherent data (2002–2017) and study the change characteristics of carbon emissions in different periods in Beijing. In summary, this study establishes a multi-dimension long-term carbon emission analysis model, which can identify key sectors from multiple perspectives and explore the carbon emission characteristics and development trends of the sectors. This study is expected to provide decision support for decision makers’ carbon reduction strategies and provide a theoretical basis for the rational allocation of carbon reduction responsibilities, which will facilitate the realization of “carbon peak and carbon neutrality” strategy.
As the capital of China, Beijing is the epitome of China’s urban industrial transformation (Yang et al., 2018), as evidenced by the share of the tertiary industry increased from 23.69% to 83.09% between 1978 and 2018 (National Bureau of Statistics, 2019). Meanwhile, the energy consumption intensity in Beijing is decreasing rapidly, from 0.377 in 2013 to 0.182 in 2021 (tons of standard coal consumed per 10,000 Yuan of GDP). In 2021, Beijing’s urban forest cover is 44.6%, while annual GDP per capita is 184,000 Yuan, ranking first in the country (Beijing Municipal Bureau of Statistics, 2022). This data shows that Beijing is striking a balance between carbon reduction and economic development. However, Beijing is a typical consumption-oriented city, and most of the energy and commodities consumed by household consumption and commercial activities are dependent on imports. In this case, the heavy burden of reducing carbon emissions will fall on producers, and the responsibility of consumer is underestimated under traditional production-based accounting methods (Mi et al., 2019; Wu et al., 2019; Dong B et al., 2022; Du et al., 2022). The lack of regulation of carbon emissions from multiple perspectives will have a negative impact on the achievement of the overall regional carbon emission target. Therefore, Beijing as a typical consumption city, is selected as a research case in this study, and a multi-dimension long-term carbon emission analysis model is established to explore the characteristics and evolution mechanism of carbon emissions in Beijing from various perspective.
The rest of this study is organized as follows: Section 2 introduces the main research methodology, Section 3 reveals the computational results and interpretation of the results, Section 3.6 discusses issues encountered in the research, and Section 4 presents conclusions and policy recommendations.
2 Method
2.1 Three-perspective carbon emission accounting method
The IO model designed by Leontief can quantify the inflow and outflow relationship between sectors by counting the monetary flows of economic sectors (Leontief, 1936). It can reveal the potential environmental impacts caused by production activities such as resource exploitation, so it was widely applied in the accounting of carbon emissions (Fan et al., 2018; Zha et al., 2022), air pollution (Dong J et al., 2022; Sun et al., 2022), fossil energy (Li et al., 2020; Wang Q et al., 2022), water utilization (Zheng et al., 2020; Wang P et al., 2022), and other environmental studies (Zhang et al., 2018; Shi et al., 2021; Jiang and Hao, 2022). According to the different compilation scopes of the IO table, it can be divided into single-region input-output (SRIO) table and multi-region input-output (MRIO) table. Compared with the MRIO table, SRIO table assumes that local and imported goods in the same sector are homogeneous, and it is more commonly used to analyze inter-sectoral characteristics in a specific area (Zhang et al., 2022). Production-based, consumption-based and income-based carbon emissions can all be calculated through the SRIO model. In this study, a three-perspective accounting method based on SRIO table is conducted to calculate the sectoral carbon emissions in Beijing.
The basic formula of the SRIO table can be expressed by Eq. 1 and Eq. 2:
where
The IO table published by Beijing is a competitive IO table, which does not distinguish between local and imported products. Since there are differences in the production process between imported and local products in Beijing, the embodied carbon emission of them will be different. For example, the average carbon emission intensity of Inner Mongolia is significantly higher than that of Beijing (Chen et al., 2019). If the same method is used to calculate the carbon emissions of local and imported products, the calculation result of the imported part will be significantly lower. Therefore, in order to improve the rationality of the calculation process and avoid underestimating the embodied carbon emissions, it is necessary to calculate the carbon emissions of local and imported products separately. The import coefficient matrix
where,
Under this framework, PBE can be calculated by Eq. 4:
where
CBE can be calculated using the relationship between PBE and CBE: “CBE = PBE—carbon emissions embodied in exports + carbon emissions embodied in imports” (Mi et al., 2016). By replacing
where,
where CE is CBE.
IBE can be expressed as Eq. 7:
where
2.2 Structural decomposition analysis for driving factors
Since Beijing is a consumption-oriented city, CBE dominates the carbon emission system. It is necessary to decompose the CBE of local and imported products in Beijing from 2002 to 2017 to investigate the driving factors. Based on the SDA and Leontief’s IO table, the CBE of local and imported can be further decomposed into multiple components. After referring to previous literature and studying the characteristics of Beijing industries (Chen and Zhu, 2019; Wang and Yang, 2021; Wen et al., 2022), we designed five socioeconomic influencing factors, including carbon emission intensity, production structure, consumption structure, per capita consumption, and population. These socioeconomic factors can explain the mechanisms of carbon emission changes from a macro perspective. In addition, most previous studies focus on overall carbon emissions (Zhai et al., 2020a; Wen et al., 2022), while this paper divides CBE into local and imported components, and decomposes the structure separately. The impact of each socioeconomic factor on CBE can be analyzed in more detail. The calculation formula is as follows:
where the symbols
The symbols
2.3 Carbon emission linages analysis
ELA is commonly used to analyze the upstream and downstream relationships of sectors and to identify key consumption-side and supply-side sectors. By calculating FLE and BLE, the interaction between sectors and the transmission mechanism of the industrial chain can be revealed. As shown in Eq. 11 and Eq. 12, key influential sectors with high potential to reduce emissions through industrial chain policies can be discerned.
where n represents the number of sectors.
2.4 Data sources
The economic and environmental data collected by this research model are currency IO tables, population, and carbon emission inventories. The currency IO tables in 2002, 2007, 2012 and 2017 are released by the Beijing Municipal Bureau of Statistics (Beijing Municipal Bureau of Statistics, 2022). Avoiding the impact of price fluctuations on the monetary IO table is the basis of the research model (Xu et al., 2020; Xu et al., 2021). Therefore, monetary values in all IO tables are adjusted to 2017 prices. Population data are derived from Beijing Statistical Yearbook (Beijing Municipal Bureau of Statistics, 2003; Beijing Municipal Bureau of Statistics, 2008; Beijing Municipal Bureau of Statistics, 2013; Beijing Municipal Bureau of Statistics, 2018). The carbon emission inventories of Beijing are freely available from the China Emission Accounts and Datasets (CEADs) (China Emission Accounts and Datasets, 2022), including fossil fuel consumption and fossil fuel-related carbon emissions. There are significant differences in sectoral classification between the above data. In order to bridge the data differences and simplify the calculation process, sectors need to be integrated. Based on the reference to previous studies (Chen and Zhu, 2019; Mi et al., 2019; Zhai et al., 2020a; Xu et al., 2021), the original 42 sectors were integrated into 19 aggregated sectors according to the characteristics of Beijing sectors, as shown in Table 1.
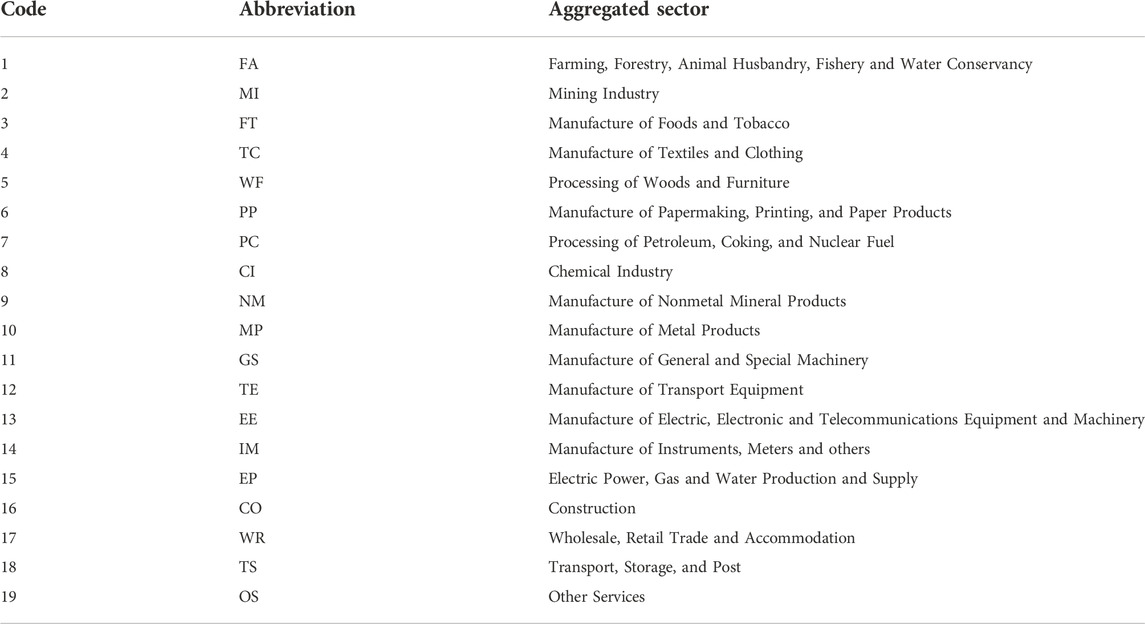
TABLE 1. The 19 aggregated sectors and the corresponding abbreviations.
In summary, the theoretical framework of this study is shown in Figure 1. First, on the basis of previous research, this study collected the IO table and carbon emission inventory of Beijing in 2002, 2007, 2012, and 2017, and integrated the data for the convenience of calculation. Secondly, based on the three-perspective accounting method (i.e., production-based, consumption-based and income-based accounting methods), this study analyzed the differences in carbon emission characteristics of various industries. Thirdly, based on SDA, this study revealed the impact of changes in socioeconomic factors on carbon emissions of urban consumption. Fourth, based on ELA, this study described the evolutionary trajectory of the sector. The research framework of this study is composed of the above data and research methods.
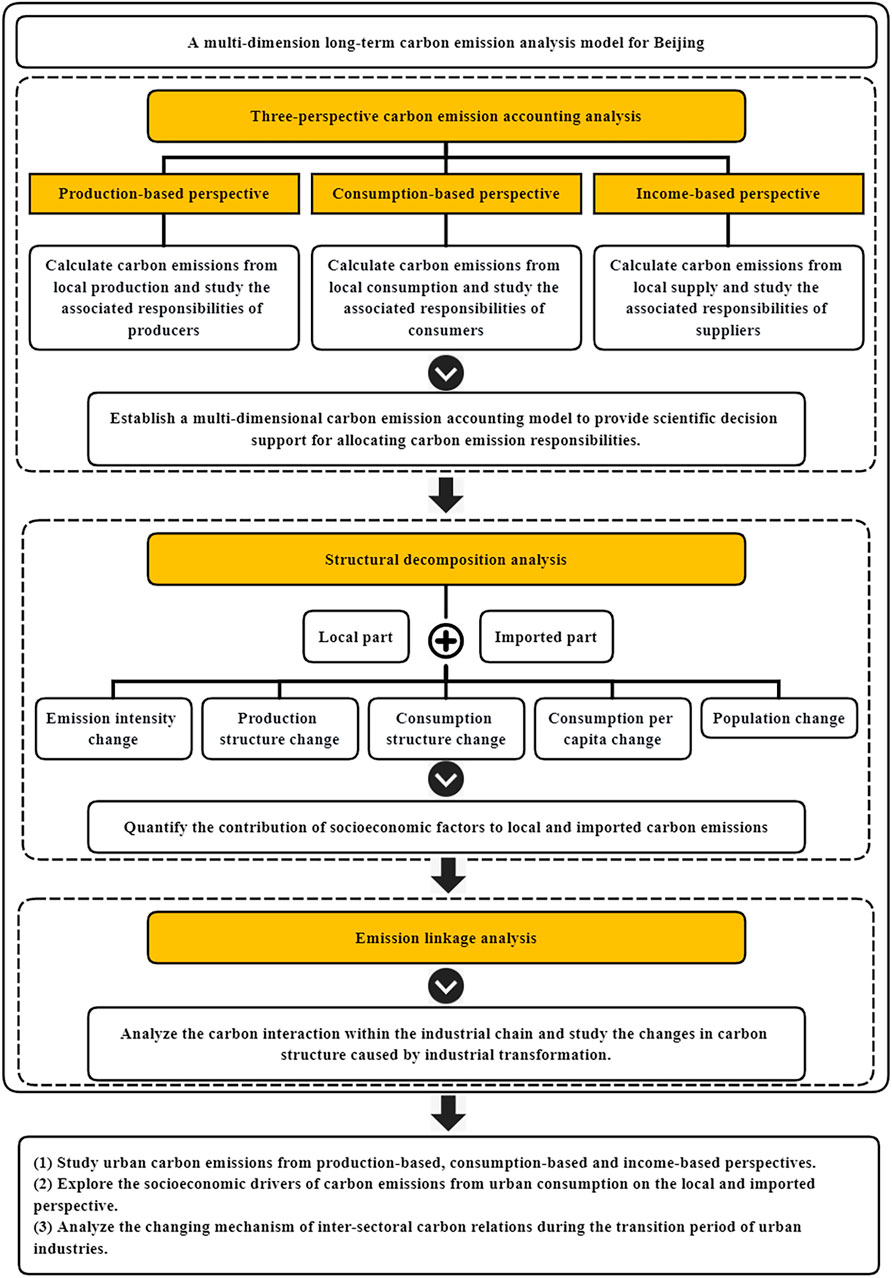
FIGURE 1. Theoretical framework for this study.
3 Result
3.1 Intersectoral carbon flows in local and import regions
Due to the stark difference in carbon emission intensity and flow direction between local and imported products, the imported carbon flows are more complex than expected. Thus, the system is fundamentally different when considering the imported carbon flows. The analysis of carbon flows among different sectors is essential to be conducted to further reveal the difference in carbon emissions between local and imported products. The local and imported carbon flows among sectors are shown in Figure 2 and Figure 3, respectively. The values of all carbon flows across sectors are positive. The color of each sector is different. Streamlines between sectors can show the direction of carbon flow. The color of the flow line between industries represents the origin of carbon flow. The width of carbon flow in each sector indicates the amount of carbon flow between this sector and others. For example, the yellow flow line between EP and OS in Figure 2A represented the local carbon flow from EP to OS, and the amount of carbon emission was 10.25 million tons (Mt). Compared with Figure 2 and Figure 3, it can be seen that the change in the structure of imported carbon flows was not as large as that of local carbon flows, which indicated that the relationship of imported products among sectors was more stable than that of local products. For instance, the imported carbon flows from NM and MP to CO persisted between 2002 and 2017, while the relationship in local carbon flows disappeared after 2012. It indicated that the local carbon flow of CO was more susceptible than its imported carbon flow. Changing the carbon structure of imported products was more difficult than changing that of local products.
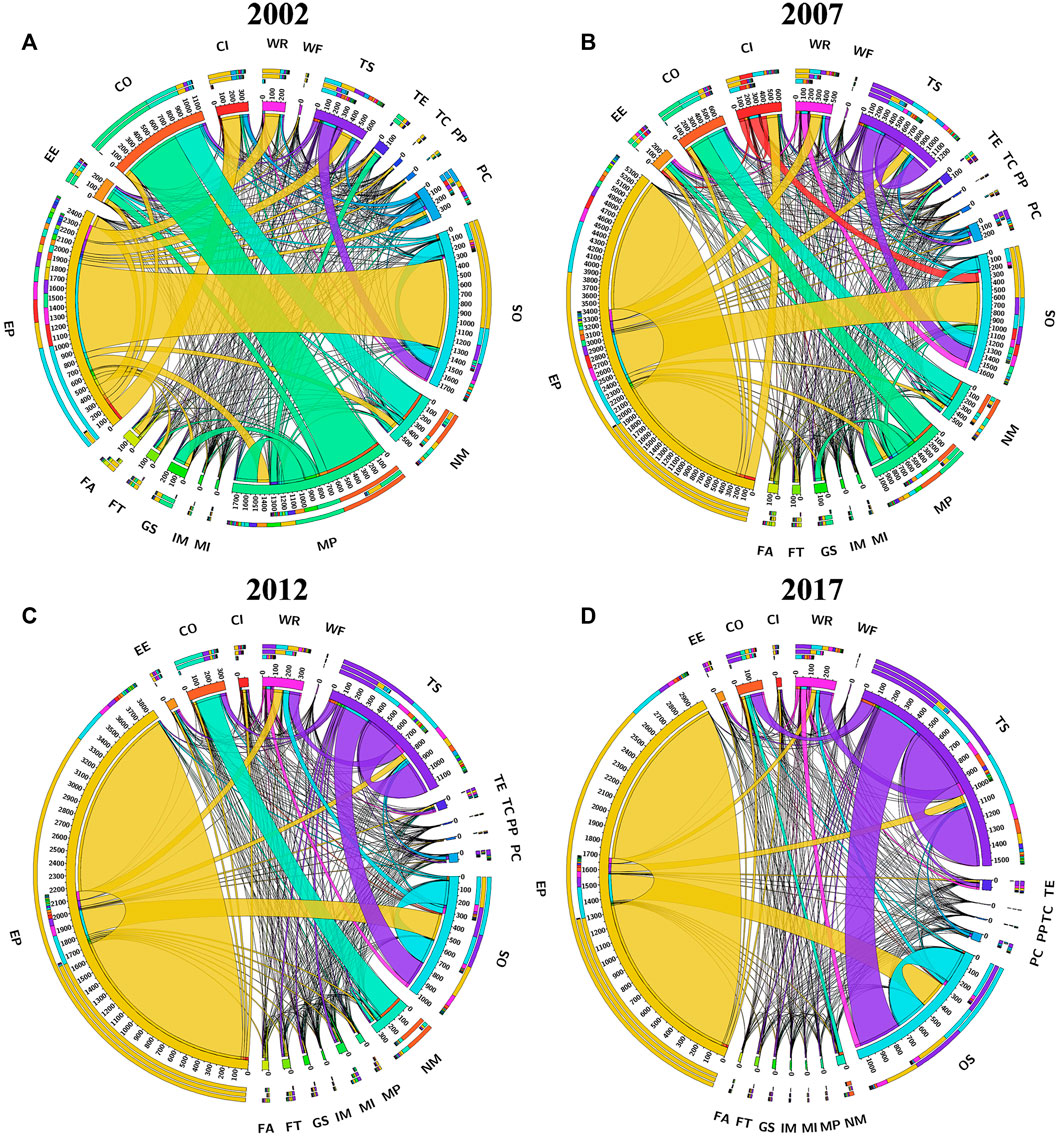
FIGURE 2. Local carbon flows among different sectors from 2002 to 2017. (A) 2002 (B) 2007 (C) 2012 (D) 2017.
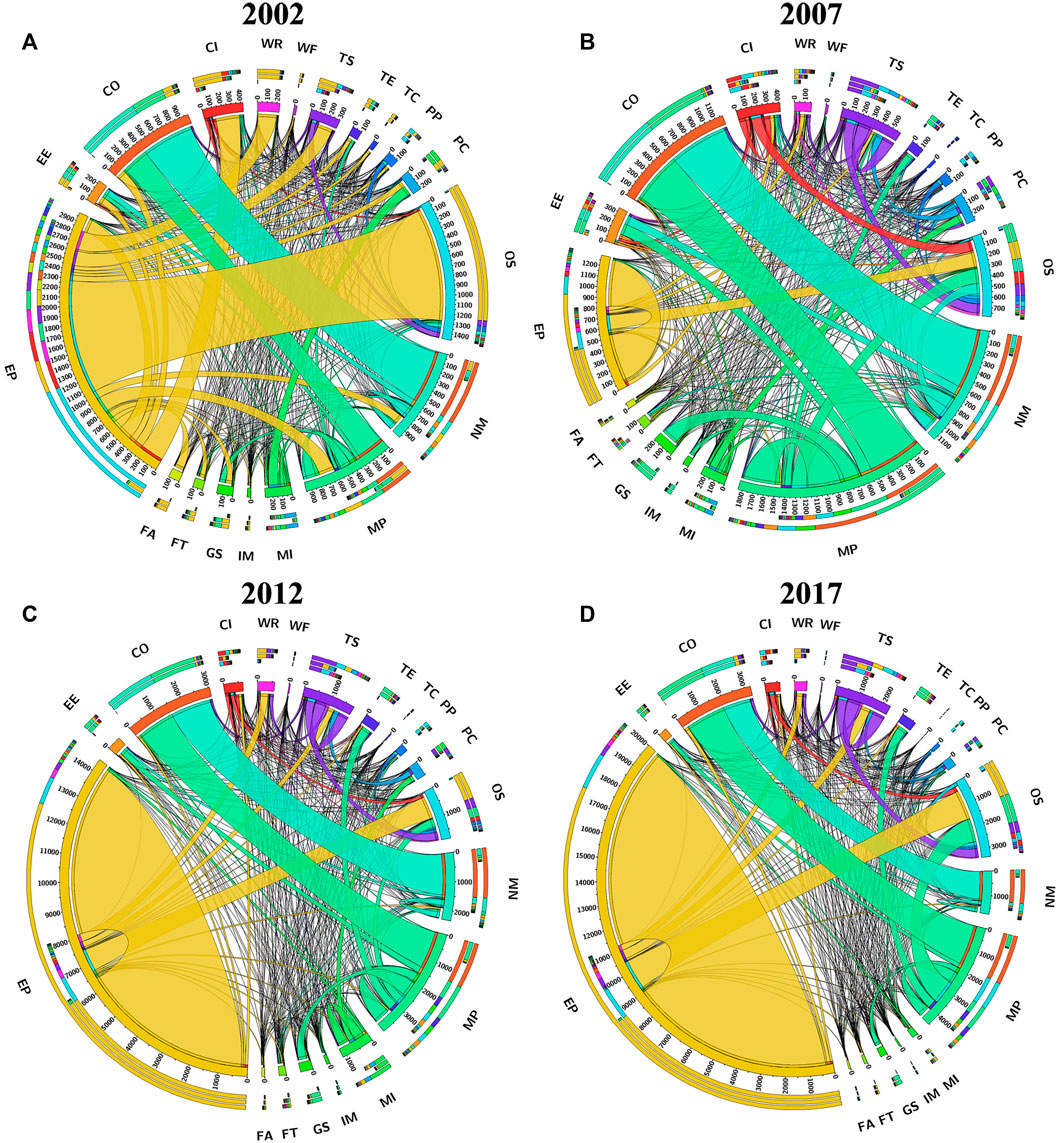
FIGURE 3. Imported carbon flows among different sectors from 2002 to 2017. (A) 2002 (B) 2007 (C) 2012 (D) 2017.
According to Figure 2A, the major contributors of local carbon flows were EP, MP, and NM, which contributed 23.45, 13.44, and 4.37 Mt, respectively. Among them, MP contributed most of its local carbon flow to CO (6.48 Mt) and itself (2.33 Mt), while the rest of local carbon flow mainly contributed to GS (1.29 Mt). Figure 2B–D reveal that TS and OS gradually replaced NM and MP as the main contributors of local carbon flow after 2007. Furthermore, the main contributor to the local carbon flow of EP has always been itself, while the rest of the local carbon mainly flowed to TS and OS. In general, the structure of local carbon flows changed significantly between 2002 and 2017. By contrast, Figure 3A shows that the major contributors of imported carbon flows were EP, MP, and NM with the contribution of 28.24, 8.01, and 6.07 Mt, respectively. Among them, EP contributed a part of the imported carbon flow to OS (12.34 Mt), while the rest evenly contributed to other sectors. According to Figure 3B–D, the structure of imported carbon flows is stable every year, except for EP. The imported carbon flow within EP increased from 4.61 to 86.92 Mt, which reflected Beijing’s rapidly increasing demand for imported energy. In summary, imported carbon flows mainly came from EP, NM, and MP sectors and flowed to EP, CO, and OS sectors. This result was in line with the characteristics of the developed tertiary industry in Beijing.
3.2 Carbon emissions analysis from multiple perspectives
3.2.1 Comparison of different perspectives
Based on the carbon emission inventories released by CEADs and the environmentally extended (IO) model constructed in this study, PBE, CBE, and IBE in 2002, 2007, 2012, and 2017 for 19 aggregated sectors were calculated. As shown in Figures 4A–D, embodied carbon emissions differ significantly across the three types of accounting methods, reflecting the different focus on the allocation of various methods. Several major findings were revealed by the overall comparison of three accounting methods.
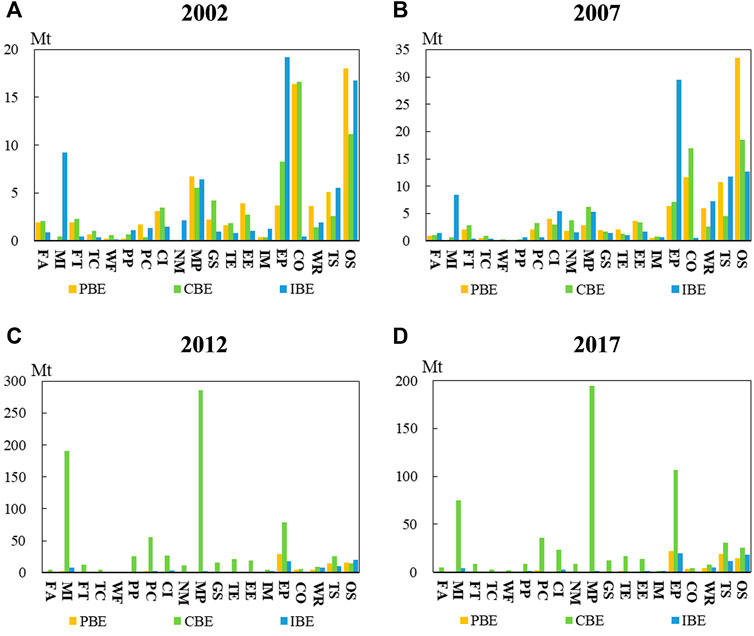
FIGURE 4. Comparison of sectoral PBE, CBE, and IBE in Beijing from 2002 to 2017. (A) 2002 (B) 2007 (C) 2012 (D) 2017.
First, during the study period, the fluctuation trend of PBE and IBE in Beijing was stable, while CBE grew rapidly. Beijing’s CBE was the lowest among the three perspectives carbon emission in 2002 and 2007, but it reversed in 2012 and 2017. During the critical period of change (2007–2012), the total amount of PBE and IBE in Beijing decreased by 7.97 Mt (8.73%), while the total amount of CBE increased hugely by 731.52 Mt (924.83%). In 2017, the total amount of CBE was 584.01 Mt, which was significantly higher than that of PBE (68.94 Mt). The result reflected that the carbon emission caused by consumption behavior in Beijing was greater than that caused by the production and supply processes. The industrial transformation and deindustrialization in Beijing were cited as the main reasons. The decline in manufacturing capacity forced Beijing to import products from other regions to meet the local demands of industry and residents.
Second, the key sectors of carbon emissions calculated by the three accounting methods were different. This study defined sectors that once accounted for more than 10% of total carbon emissions as key sectors. Take 2017 as an example, the key sectors of PBE were EP, TS and OS, the key sectors of CBE were MI, MP, and EP, while the key sectors of IBE were EP, TS, and OS. Compared with different accounting methods, it could be found that EP was an important carbon emission contributor from three perspectives. TS and OS had an important position in both PBE and IBE, which indicated that they were both producers and suppliers in the industrial chain. Traditionally, MI was considered to be the supplying sector of raw materials, but in 2012 and 2017, MI was found to be the key sector of CBE. The results showed that the carbon emission characteristics of MI were changed in 2012, and its role in the industrial chain needs to be re-evaluated. Therefore, policymakers should pay more attention to the import process of MI.
Third, the results of PBE, CBE, and IBE vary widely when calculating a specific industry. For example, the IBE of MI was 8.41 Mt in 2007, much higher than its PBE (0.11 Mt) and CBE (0.68 Mt). For TE in 2012, CBE was 15.23MT, PBE and IBE were 0.61 and 1.32 MT. The difference of carbon emission results from three perspectives is significant. Obviously, developing carbon policies based on traditional production-side accounting method cannot achieve a good effect of carbon mitigation for the consumption-oriented cities. Generally, the results imply that the carbon accounting method from single perspective is detrimental to comprehensive evaluate of urban carbon emissions, and formulate of carbon mitigation policies and allocate carbon emission responsibilities. Therefore, it is necessary to evaluate the carbon emissions from different perspectives.
3.2.2 Characteristic analysis of sectoral direct carbon emission
The compositions of direct carbon emission (DCE) for 19 sectors in four statistical years are shown in Figure 5. These compositions varied by year but show certain structural and temporal characteristics. Several results and policy implications are presented in Figure 5. First, EP was the main emitter of DCE in Beijing, which accounted for about 40% of the total DCE with emissions of 26.95, 37.05, 37.35, and 28.5 Mt in 2002, 2007, 2012, and 2017, respectively. In the process of supplying water, electricity and heat to other sectors, a large amount of carbon emission was emitted by EP. The government should promote the development of emerging energy technologies (e.g., hydrogen, wind, solar, and other energy sources) to build a cleaner modern energy system. Second, the structure of DCE differed significantly in different periods. MP contributed 18.65 Mt of DCE and became the second largest DCE emitting sector in 2002, however, its share dropped rapidly from 26.1% to 0.14% between 2002 and 2017. During this period, the total proportion of DCE in the tertiary industry increased rapidly, especially in TS and OS. Therefore, DCE of the tertiary industry should be more concerned by policymakers after the industrial transformation.
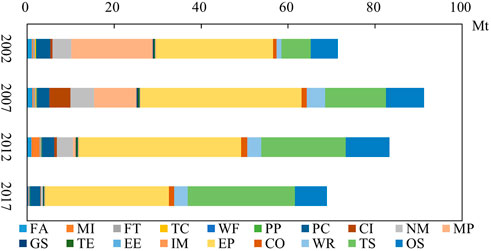
FIGURE 5. Proportion of DCE among different sectors from 2002 to 2017.
3.2.3 Characteristic analysis of sectoral PBE
As shown in Figure 6, compared with the sector clusters of DCE, the main contributors of PBE are partly different. First, the proportion of PBE in EP increased from 5.19% to 31.28% during 2002–2017 and became the largest source of PBE in 2017. This result reflected Beijing’s increased demand for energy production. In order to offset the carbon emissions caused by the increase in energy consumption, the development of clean energy technologies (such as wind energy, solar energy, biomass energy, etc.) should be encouraged. Second, the PBE of CO in the sample period was 16.42, 11.71, 5.08, and 3.74 Mt, respectively, which were much higher than its DCE. The reason was that the construction process consumed a large number of carbon-enriched products, resulting in more carbon emissions from the production process of the CO sector. The results also showed that the PBE of CO was significantly reduced due to the government’s control of carbon-enriched products. Third, the PBE of the manufacturing sector declined rapidly during the 4 years. For example, from 2002 to 2017, the PBE of CI, MP, and EE decreased by 2.64, 6.52, and 3.36 Mt, respectively. This was related to the recession of manufacturing caused by Beijing’s industrial transformation. Forth, the PBE of the tertiary industry continued to increase from 2002 to 2017. The proportion of PBE in TS increased rapidly from 7.15% (2002) to 27.27% (2017), and emissions increased by 13.69 Mt. The result indicated that the logistics industry played an important role in the urban function of Beijing. For TS sector, the government should continue to promote the transformation of electric vehicles by improving charging infrastructure and subsidizing new energy vehicle companies. OS was the key sector of the service industry, with PBE of 18.00 Mt (2002), 33.53 Mt (2007), 15.84 Mt (2012), and 14.58 Mt (2017), respectively. Public services, infrastructure, scientific research, information services consumed many carbon-intensive products such as electricity, oil, and coal throughout the life cycle of OS. Therefore, despite the low number of DCE, the potential for carbon mitigation in OS was significant from the production perspective. For OS sector, the government should promote the development of low-carbon service industries, introduce policies to support high-tech industries, and strictly limit the use of high-carbon products. Production-based accounting method can help policymakers assess the carbon responsibility and mitigation potential on the production side.
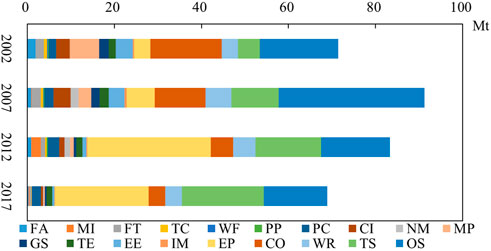
FIGURE 6. Proportion of PBE among different sectors from 2002 to 2017.
3.2.4 Characteristic analysis of sectoral CBE
Large quantities of goods and services were imported to meet the final demand of local residents. According to Figure 7, the following conclusions can be drawn: first, the total amount of CBE in Beijing varied greatly, ranging from 65.22 Mt (2002), 79.10 Mt (2007), 810.61 Mt (2012), and 584.01 Mt (2017), respectively. The largest increase in CBE occurred in 2012, which was a ten-fold increase compared to 2007. The results showed that the external dependence of Beijing increased significantly from 2007 to 2012, reflecting the growth of consumer capacity of residents and government. Second, the CBE of CO continued to decline over the four sample years, from 16.59 Mt (2002) to 4.35 Mt (2017), which was mainly because of Beijing’s strict regulation for carbon emissions in CO. Third, MP replaced OS as the largest source of CBE emissions since 2012. In 2017, the upstream carbon emissions caused by imports in NM were 195.03 Mt, accounting for 33.39% of the total emissions. However, the PBE of NM in 2017 was only 0.18 Mt. Similar to the NM sector, some manufacturing sectors began to import a large number of products from other regions and reduced local production after Beijing’s industrial transformation. Interprovincial carbon transfers from commodity trade can be curbed by spreading low-carbon technologies, taxing carbon-rich products, and restricting imports. In addition, the central government should also consider the key role of consumption behavior and comprehensively assess the responsibility of carbon emissions to improve the efficiency of carbon emission reduction. In this case, the development of new carbon emission strategy based on the consumption accounting method is necessary for overall carbon mitigation.
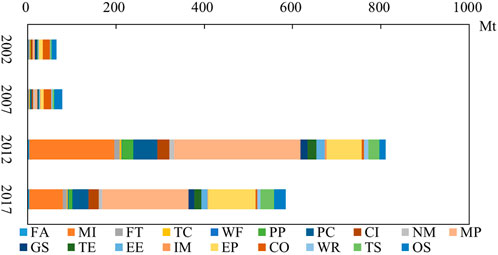
FIGURE 7. Proportion of CBE among different sectors from 2002 to 2017.
In addition, there is one notable result worth discussing. Beijing’s total CBE was 810.6 Mt in 2012, much higher than the total CBE in 2007 (79.1 Mt), and nine times of the total PBE in 2012 (83.29 Mt). There was an order of magnitude gap between CBE and PBE of Beijing during the same period. According to the results, there were two major reasons for this phenomenon.
First, Beijing transformed into a consumption-oriented city, and the frequent activities of import led to a rapid increase in consumption-based carbon emissions. Beijing was a microcosm of China’s urban transformation. In the past 2 decades, Beijing experienced a continuous process of deindustrialization due to the macro policies and urban planning. Beijing expelled energy-intensive and high-polluting sectors (such as steel and chemical industries) and developed innovative industries and service sectors. The capability of self-sufficiency of Beijing gradually declined during the process. At the same time, the growth of population and per capita consumption resulted in a rapid increase in the total demand of residents for fundamental products. According to the IO table, the final demand in Beijing (i.e., urban and rural consumption, government consumption and capital formation) increased from RMB 429 billion in 2002 to RMB 2,779 billion in 2017. The capacity of local production cannot meet the growing demand for commodities. Therefore, Beijing began to expand the import volume from 2012, which eventually brought about a rapid rise in CBE.
Second, the headquarters effect of enterprises in Beijing was significant, which increased the CBE in Beijing. Enterprise products required by regions outside the city boundary were uniformly distributed and sold by the headquarters, and most of the income was attributed to the location of headquarters. Headquarters effect existed in many sectors of Beijing, especially in energy-related sectors (such as MI and EP). For example, China National Petroleum Corporation (CNPC), headquartered in Beijing, controlled the allocation and sale of oil and gas through the group’s online trading platform. In the past, the sales channels and funds for most products were managed by regional subsidiaries, but now they were in the hands of the headquarters. The separation of upstream and downstream manufacturers caused by the headquarters effect led to a substantial increase in Beijing’s domestic and foreign imports. According to the I-O table, from 2002 to 2017, imports from domestic and foreign increased from RMB 422 billion to RMB 8,445 billion, much larger than the increase in final demand. If the consumption-based accounting method is adopted by the policymaker, Beijing will be recorded a large amount of carbon emissions caused by headquarters effect, which is unfair to Beijing. Therefore, the establishment of a multi-dimension assessment mechanism for carbon emissions responsibility is necessary for both cities and decision-makers.
3.2.5 Characteristic analysis of sectoral IBE
The sectoral carbon emissions calculated by the income-based accounting method were different from the previous two methods. Figure 8 shows CO2 emissions among sectors from the income perspective, and three conclusions can be obtained: first, the primary input of MI, EP, TS and OS enabled a large amount of carbon emissions. The total IBE of these sectors in 2017 was 53.74 Mt, accounting for 77.95% of total emissions. Most IBE were emitted by a few key sectors, which reflected the strong influence of upstream industries on the carbon emissions of downstream industries. Second, sectors related to resource extraction or energy supply such as MI and EP were the major contributors of IBE. In 2012, the carbon emissions caused by the primary input of MI and EP were 8.41 and 18.33 Mt, respectively, accounting for 10.1% and 22.01% of the total IBE. Coal, oil or electricity supplied by these sectors would cause many carbon emissions when used by downstream sectors. This result indicates that more attention should be paid to energy-related sectors when formulating carbon mitigation policies on the supply side. Third, the sectors of the tertiary industry, which were generally regarded as low-carbon industries, were the major contributors to the IBE in Beijing. In 2017, the IBE caused by the primary input of OS and TS were 17.87 and 11.78 Mt. This result reflected that Beijing’s tertiary industry was closely linked to carbon-intensive sectors. One possible reason was that the tertiary industry provided a lot of services to carbon-intensive sectors. Generally, the government should introduce more supply-side policies to reduce IBE, such as reducing the use of fossil energy, promoting the development of renewable energy technologies, and limiting the expansion of high-polluting industries, etc. Income-based accounting method can discover key sectors on the supply side and provide detailed suggestions for carbon emission reduction at the source of the industrial chain.
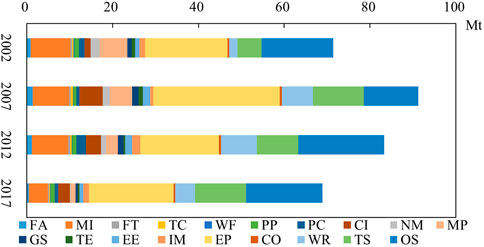
FIGURE 8. Proportion of IBE among different sectors from 2002 to 2017.
3.3 Socioeconomic factors of changes in CBE
As the above results show, it is confirmed that Beijing is a consumption-oriented city and CBE dominated Beijing’s carbon emissions after 2012. Therefore, the research on the influencing factors of urban CBE is of great help to the allocation of carbon responsibility and the formulation of related policies. Based on the analysis of five socio-economic factors (e.g., population, per capita consumption, production structure, consumption structure and carbon emission intensity), the impact of macro changes on CBE can be revealed. For example, the carbon emission intensity of manufacturing processes can be reduced through technological advances, thereby reducing CBE. Policy reforms can affect CBE by managing and adjusting the structure of production and consumption. Besides, the growth of the population and spending power can promote the expansion of residents’ demand, which will inevitably lead to the growth of CBE. In addition, this paper innovatively distinguishes between local and imported products in SDA, and the difference of their change mechanism can be further studied.
Figure 9 shows the contributions of different socioeconomic factors to Beijing’s CBE and decomposed into two parts: local and imported products. It reveals the reason for the variation of CBE from 2002 to 2017. According to Figure 9A, the carbon emission intensity was the main driver of the reduction in CBE over the three periods (period one is from 2002 to 2007, period two is from 2007 to 2012, period three is from 2012 to 2017). Specifically, the decrease of carbon emission intensity offset the growth of CBE with the amount of 103.48 Mt (−159%) in period 1, 87.74 Mt (−111%) in period 2 and 38.57 Mt (−5%) in period 3, which suggested that technological progress was an effective way to reduce CBE. On the other hand, the consumption and production structures were the main influencing factors of CBE, which increased CBE by 196.25 Mt (+248%) and 347.45 Mt (439%) in period 2, and decreased CBE by 106.86 Mt (−13%) and 72.03 Mt (−9%) in period 3, respectively. These two factors could be significantly influenced by Beijing’s environmental protection and industrial policies (e.g., Suppress The Second Industry and Develop The Third Industry and The Administration of Highly Polluting Fuel Forbidden Zones). This result showed that Beijing’s urban policies had a significant impact on CBE. In addition, growth in population and per capita consumption cumulatively contributed 339.97 Mt of CBE in three periods. This is an inevitable problem in the process of urban development, and policymakers need to develop a series of measures to deal with the above problem. For example, the government can reasonably plan for population growth, guide residents to use carbon-cleaning products, advocate green and low-carbon consumption in daily life.
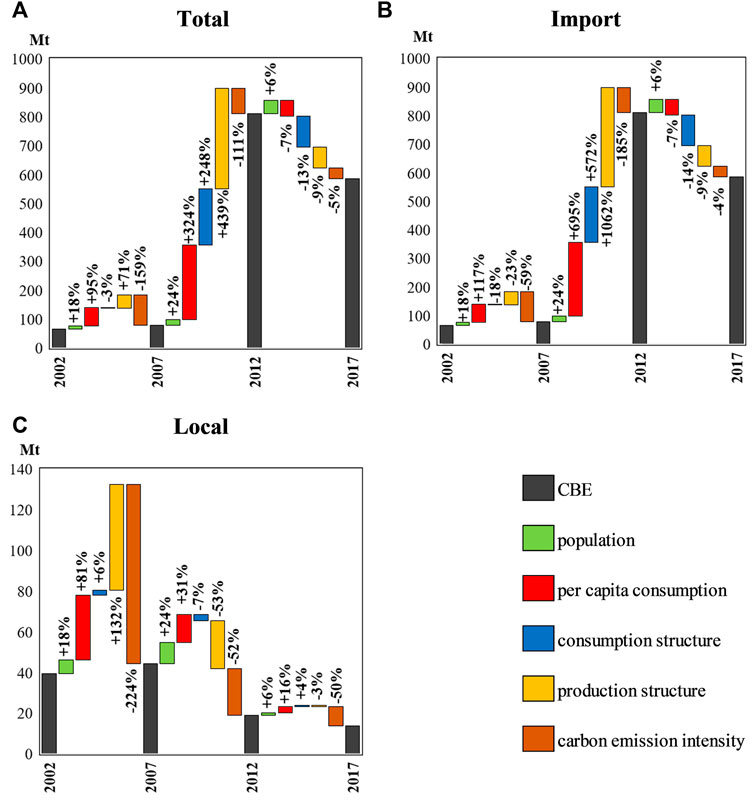
FIGURE 9. Contribution of socioeconomic factors to the change in (A) total consumption-based carbon emissions, and decomposed into (B) import and (C) local components.
Figure 9B is the structural decomposition of the local CBE, and the following conclusions can be drawn: first, the carbon emission intensity was the major contributor to the reduction of local CBE, with the carbon emission reduction of 88.06 Mt (−224%) in period 1, 22.99 Mt (−52%) in period 2, and 9.52 Mt (−50%) in period 3, respectively. Second, the local CBE peaked in 2007 with the emission of 44.19 Mt, and it has been on a downward trend since then. In period 1, the local CBE was markedly increased by the production structure (52.02 Mt). But the situation reversed after 2007, the production structure became an inhibition factor of carbon emissions. This was because the exit of high-carbon industries reduced the carbon emissions of the production chain. Therefore, the government should continue to promote the low-carbon technologies and reduce the carbon emission intensity of construction, transportation and industrial sectors. Third, the local CBE increased by the factors of population, per capita consumption and consumption structure in most cases, with a cumulative increase of 66.92 Mt. However, the local CBE was reduced by 3.28 MT by consumption structure in period 2. This is because Beijing’s high carbon industry is restricted by the industrial transformation policy, thus reducing the consumption of carbon rich products. According to Figure 9C, the most important factor contributing to the reduction of imported CBE was also carbon emission intensity. However, the impact of carbon emission intensity for imported CBE was weaker than that of local CBE. The major reason was that Beijing was a consumption-oriented city, which had rapidly lowered local CBE by restricting high-carbon sectors. But for production regions, high-carbon sectors were the backbone of the social economy. Restrictions on these sectors might lead to mass unemployment and economic recession. This also showed that carbon mitigation in production-oriented areas mainly relied on technological progress, rather than industrial transformation. In addition, after 2007, CBE induced by imported goods became the largest component of urban carbon emission. This result explained why the trend and influencing factors of imported CBE were similar to that of total CBE. In period 2, the two main drivers of imported CBE were consumption structure and production structure, which contributed 199.53 Mt (+572%) and 370.80 Mt (+1062%) of emissions, respectively. It was worth noting that the production structure increased more carbon emissions than the consumption structure, indicating that the import demand in Beijing was dominated by high-carbon products, which increased the environmental pressure on other regions. In addition, this result was also reflected in the growth of import and export trade in period 2. According to the National Bureau of Statistics of China, the total value of Beijing’s import and export trade of goods (by location of business units) increased from US$ 192.9 billion to US$ 408.1 billion during this period. In summary, the reduction of Beijing’s CBE requires an entire optimization of the production and consumption structure of the transaction network, and the improvement of the supply structure of production factors and the utilization rate of clean energy.
3.4 The evolutionary path of the sector
Tracking the evolution path of sectors is helpful to study the changing mechanism of carbon emissions in urban sectors, which is a supplement to the urban multi-dimensional carbon emission analysis model. BLE represents the driving force of a sector in the industrial chain, which is used to reflect the impact of the sector’s final demand on other sectors in the carbon emissions system. FLE represents the pulling force of a sector in the industrial chain, which is used to reflect the impact of the final demand from other sectors on this sector’s carbon emissions.
According to the results of BLE and FLE, all sectors were divided into four categories, as shown in Figure 10. Different zones played different roles in industrial emissions systems. The area within the second quadrant of Figure 10A can be defined as a critical area on the supply side. The MI sector was a typical supplier of raw materials, providing coal, oil, minerals and natural gas to downstream industries. The primary input of MI drove the production of goods and increased carbon emissions of the industrial systems substantially. Carbon mitigation in MI needs to be coordinated with the policies of the supply side.
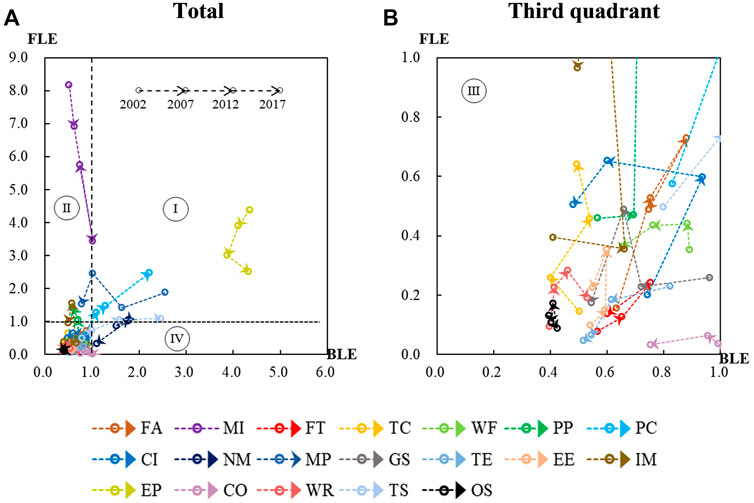
FIGURE 10. Evolutionary trajectories of various sectors during 2002–2017. (A) Total (B) The third quadrant.
In contrast, sectors within the fourth quadrant such as TS and NM were considered as the key sectors for consumption, and their demand caused a large amount of emissions from other sectors. Guiding these sectors to use low-carbon products was an important direction of carbon mitigation policies on the consumption side. In addition, there were some “high-weight” sectors (e.g., EP, PC, and MP) in the first quadrant, with high FLE and high BLE. These sectors were integral to both the production and consumption sides. Policymakers need to focus on these “high-weight” sectors and adopt the necessary policies to systematically manage their supply and demand processes.
Notably, the roles of some sectors in the carbon emissions system have changed over time. Take MP as an example, which had high FLE and high BLE in 2002 and was one of the dominators in the industry’s emissions system. However, in 2012 and 2017, MP fell into the second quadrant and became a supplier as the sector’s driving force weakened. This result was related to Beijing’s restrictive policies of the second industry. The production capacity of Beijing’s metal products industry was greatly reduced, which was manifested in the reduction of demand for metal products in other industries. This phenomenon was reflected in the decline of the sector’s FBL. The results showed that the emission feature of the sector was affected by changes in the policies on the supply and demand side. The analysis of FLE and BLE can help policymakers scientifically evaluate the roles of various sectors, observe the effect of policy implementation, and provide a basis for assigning the responsibility of carbon mitigation.
3.5 Discussion on the calculation method of CBE
The consumption-based accounting method can calculate the embodied carbon emission associated with consumption, target and analyze the key consumption sectors in the industrial chain. The carbon emissions caused by local products and imported products can be calculated separately by consumption-based accounting method. However, the standards of the calculation process of CBE are ambiguous and inaccurate, and different definitions of parameters will lead to different results. According to previous research, there are three calculation methods for CBE, which are numbered as M1, M2, and M3 (Chen et al., 2019; Mi et al., 2019; Zhai et al., 2020a). The differences in parameter definitions are detailed in Table 2. The main differences are the selection of carbon emission intensity and the statistical scope of final demand. In Table 2, “Local consumption” includes urban and rural residents’ consumption, government consumption and capital formation. The CBE calculated by three methods from 2002 to 2007 is shown in Figure 11.
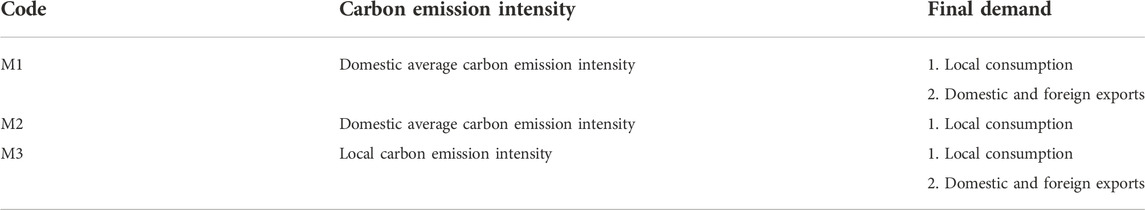
TABLE 2. Comparison of different parameter definitions, consumption-based accounting method.
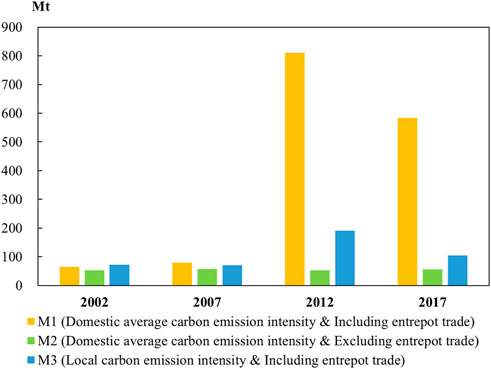
FIGURE 11. Comparison of CBE results of three calculation methods in 2002–2017.
M1 is the calculation method used in this study. The theoretical premise of M1 is that the carbon structure of imported products is different from that of domestic products, which need to be processed separately. When calculating the carbon emission of imported products, the domestic average carbon emission intensity is selected to replace the carbon emission intensity of unknown imported products (Mi et al., 2016; Mi et al., 2019). M1 is characterized by emphasizing the differences between imported and local products, and calculating the carbon emissions of all imported products. Compared to M1, M2 excludes export items from the final demand of the imported portion (Chen and Zhu, 2019). Only local consumption is considered when calculating the final demand of the imported portion. M2 argues that Beijing should not be assigned the responsibility for carbon emissions in the part of “importing products for export”. As shown in Figure 11, the CBE for M2 maintained between 50 and 60 Mt. M2 may ignore the actual situation of entrepot trade and underestimates Beijing’s carbon emission responsibility on the consumption, so M2 is not adopted in this study. M3 has also been widely used in previous studies (Zhai et al., 2020a; Zhai et al., 2020b; Xu et al., 2020), and the carbon intensity of imported products in this method is considered to be the same as that of local products. However, Beijing is a consumption-oriented city dominated by the service industry, and its carbon intensity is lower than the national average. Therefore, M3 will underestimate the carbon emissions of imported products, as shown in Figure 11. Considering that the technology and process of imported products are different from local products, it is more reasonable to use the national average carbon intensity to estimate the carbon emissions of imported products.
In summary, the main difference between the results of this paper and other scholars’ studies is the choice of carbon emission intensity and the range of imported goods. Based on M1, the entrepot trade component (i.e., importing products for export) is found to be the main contributor to CBE in Beijing. Li et al. (2020) studied energy consumption in Beijing between 2002 and 2012 and obtained similar results. The paper points out that the headquarters effect in Beijing is the main cause of energy flows, which is consistent with the findings above. In addition, this paper also verifies the findings using M2 and M3, which are generally consistent with the studies of other scholars (Chen et al., 2019; Chen and Zhu, 2019; Zhai et al., 2020a; Xu et al., 2020).
4 Conclusion
In this study, a multi-dimension long-term carbon emission analysis model was established to explore the characteristics and evolution mechanism of carbon emissions from multiple perspectives. In the proposed model, the production-based, consumption-based and income-based carbon emissions of Beijing in 2002, 2007, 2012, and 2017 were calculated, and the roles of various sectors in Beijing’s carbon emissions system were identified. Then, SDA was adopted to quantify the contribution of five socioeconomic factors in local and imported carbon emissions. In addition, the transition trajectories of various sectors were further described by ELA, and revealed the interaction between urban economic sectors from the perspectives of consumption and supply. The proposed model has the potential to be applied to more areas or cities, which can provide scientific decision support for policymakers to reasonably formulate carbon mitigation policies and allocate carbon mitigation responsibilities from multiple perspectives.
The results show that there are significant differences in the characteristics of carbon emissions in Beijing from 2002 to 2017, and the choice of accounting methods has a greater impact on the allocation of carbon emissions responsibilities. Based on the above research, the main findings and policy recommendations are summarized as follows:
1) Beijing’s PBE and IBE decreased by 3.53% (2.52 Mt) from 2002 to 2017, which is generally stable. During the same period, the CBE increased rapidly by 795.45% (518.79 MT). Along with the process of importing goods from other cities, a large amount of embodied carbon emissions is transferred into Beijing. Therefore, Beijing should change its original production-based management mode and try to reduce CBE by introducing more demand-side policies, such as subsidizing low-carbon products and taxing the consumption of carbon-intensive products.
2) Among the urban sectors, EP is one of the main contributors and has a stable share from production, consumption and supply perspectives. It has a multi-dimension potential for carbon mitigation. Therefore, more carbon emission reduction responsibilities should be undertaken by EP sector, and targeted multiple-dimensional carbon emission governance should be promoted. After Beijing completed its coal-free transformation, the government should try to reduce the proportion of traditional fossil energy in the energy system. In addition, the government should also promote the development of emerging energy technologies (e.g., hydrogen energy, wind power, photovoltaic power, biomass energy, etc.), and help establish a modern energy system dominated by renewable energy and clean electricity.
3) There are significant differences in sector-level’s carbon emissions from different perspectives. In terms of PBE, the share of traditional manufacturing has gradually declined since 2002, and its share has been replaced by TS and OS sectors. In terms of CBE, the emissions of IM, MP, and EP sectors caused by imports all increased by more than 10 times. In terms of IBE, EP, MI, TS, and OS sectors that provide products and services to downstream industries are the main sources of supply-side emissions. The results imply that the industrial transformation in Beijing has a significant impact on the trend of carbon emission changes in the sector. Therefore, the government should reasonably formulate carbon mitigation and industrial transformation policies, allocate carbon mitigation responsibilities from multiple perspectives, and prudently plan the future carbon mitigation paths of sectors.
4) Per capita consumption and production structure are important drivers of the increase in total CBE, and carbon emission intensity is the most important factor to offset the increase in total CBE. In addition, carbon emissions caused by the production structure should also be concerned. In local CBE, the effect of carbon emission intensity is more pronounced, while in imported CBE, the effect of per capita consumption and production structure covers the effect of carbon intensity. From an overall perspective, imported CBE maintains a strong growth trend and will continue to dominate in CBE. The government should promote the development of low-carbon technologies in exporting regions and improve energy efficiency in sectors such as buildings, transportation, and industry.
5) According to the results of ELA, industrial transformation has a significant impact on the position of sectors in the industrial structure and changes the development trend of the industry. The government should pay attention to industrial sectors in key positions from a multi-dimensional perspective, anticipate the impact of policies on the sectors, and formulate targeted industrial policies.
6) Beijing’s entrepot trade is a major contributor to the city’s CBE. Many conglomerates are headquartered in Beijing, which leads to the city becoming a transit point for commodities. For policymakers, the attribution of various types of carbon emission flows should be clarified. This illustrates the necessity of a scientific and reasonable carbon emission accounting method.
In summary, different research tools focus on different priorities, and it is necessary for policymakers to combine multi-dimensional analysis to plan carbon mitigation policies. In addition, the proposed model is expected to help policymakers scientifically allocate carbon emission responsibilities from multiple perspectives.
In future research, some limitations need to be addressed. First, considering the availability of data, carbon emission inventories are used in this study. The effects of other greenhouse gases such as N₂O, CH₄, and HFCs are not considered. This can be calculated from energy consumption and Intergovernmental Panel on Climate Change (IPCC) emission factors. Second, since the preparation of Beijing’s IO table takes 5 years as a cycle, this model has a lag in the observation and decomposition of changes in sectors. Gaps between cycles can be filled by using biproportional scaling method. Third, the loss of information caused by the unification of currency prices and the consolidation of 42 sectors will create some uncertainty. In future work, stochastic analysis could be used to deal with the uncertainty caused by information integration. Fourth, the carbon emissions of imported products are calculated without distinguishing the source of imports (i.e., imported from other provinces or abroad). In future studies, the world MRIO table could be tried to calculate carbon emissions of products from different import sources separately.
Data availability statement
The original contributions presented in the study are included in the article/Supplementary Material, further inquiries can be directed to the corresponding author.
Author contributions
QL: data curation, methodology, writing, visualization. CC: conceptualization, methodology, writing—review and editing, validation, supervision.
Funding
This research was supported by the national natural science fund projects (No. 41701621); Beijing Municipal Social Science Foundation (No. 18LJC006); Beijing Natural Science Foundation (No. 9222021).
Conflict of interest
The authors declare that the research was conducted in the absence of any commercial or financial relationships that could be construed as a potential conflict of interest.
Publisher’s note
All claims expressed in this article are solely those of the authors and do not necessarily represent those of their affiliated organizations, or those of the publisher, the editors and the reviewers. Any product that may be evaluated in this article, or claim that may be made by its manufacturer, is not guaranteed or endorsed by the publisher.
Supplementary material
The Supplementary Material for this article can be found online at: https://www.frontiersin.org/articles/10.3389/feart.2022.1073167/full#supplementary-material
References
Atkinson, G., Hamilton, K., Ruta, G., and Van der Mensbrugghe, D. (2011). Trade in 'virtual carbon': Empirical results and implications for policy. Glob. Environ. Change 21 (2), 563–574. doi:10.1016/j.gloenvcha.2010.11.009
Beijing Municipal Bureau of Statistics (2022). Beijing input-output table: 2022; 2007; 2012; 2017. Available at: http://tjj.beijing.gov.cn/ztzl/trccdc/dcsj/index.html (Accessed March 15, 2022).
Beijing Municipal Bureau of Statistics (2003). Beijing statistical Yearbook: 2003; 2008; 2013; 2018. Beijing: China Statistics Press.
Beijing Municipal Bureau of Statistics (2008). Beijing statistical Yearbook: 2003; 2008; 2013; 2018. Beijing: China Statistics Press.
Beijing Municipal Bureau of Statistics (2013). Beijing statistical Yearbook: 2003; 2008; 2013; 2018. Beijing: China Statistics Press.
Beijing Municipal Bureau of Statistics (2018). Beijing statistical Yearbook: 2003; 2008; 2013; 2018. Beijing: China Statistics Press.
Chen, S. Q., Long, H. H., Fath, B. D., and Chen, B. (2020). Global urban carbon networks: Linking inventory to modeling. Environ. Sci. Technol. 54 (9), 5790–5801. doi:10.1021/acs.est.0c00965
Chen, S. Q., and Zhu, F. Y. (2019). Unveiling key drivers of urban embodied and controlled carbon footprints. Appl. Energy 235, 835–845. doi:10.1016/j.apenergy.2018.11.018
Chen, W. M., Lei, Y. L., Feng, K. S., Wu, S. M., and Li, L. (2019). Provincial emission accounting for CO 2 mitigation in China: Insights from production, consumption and income perspectives. Appl. Energy 255, 113754. doi:10.1016/j.apenergy.2019.113754
China Emission Accounts and Datasets (2022). Emission inventories for 30 provinces in 1997–2019. Available at: https://www.ceads.net/(Accessed March 15, 2022).
Dong B, B. Y., Xu, Y. Z., and Li, Q. N. (2022). Carbon transfer under China's inter-provincial trade: Evaluation and driving factors. Sustain. Prod. Consum. 32, 378–392. doi:10.1016/j.spc.2022.04.031
Dong J, J., Li, S., Xing, J., Sun, Y., Yang, J., Ren, L., et al. (2022). Air pollution control benefits in reducing inter-provincial trade-associated environmental inequality on PM2.5-related premature deaths in China. J. Clean. Prod. 350, 131435. doi:10.1016/j.jclepro.2022.131435
Du, H., Liu, H., and Zhang, Z. (2022). The unequal exchange of air pollution and economic benefits embodied in Beijing-Tianjin-Hebei's consumption. Ecol. Econ. 195, 107394. doi:10.1016/j.ecolecon.2022.107394
Fan, J. L., Shuo, M., Wang, J. D., and Zhang, X. (2018). Coordinated emission mitigation mechanism of beijing-tianjin-hebei region in China: A perspective from CO2 emissions embodied in domestic trade. Energy Procedia 158, 3893–3900. doi:10.1016/j.egypro.2019.01.855
Feng, K. S., Hubacek, K., Sun, L. X., and Liu, Z. (2014). Consumption-based CO2 accounting of China's megacities: The case of beijing, tianjin, shanghai and chongqing. Ecol. Indic. 47, 26–31. doi:10.1016/j.ecolind.2014.04.045
Ghosh, A. (1958). Input-output approach in an allocation system. Economica 25 (97), 58–64. doi:10.2307/2550694
Giannakis, E., Kushta, J., Giannadaki, D., Georgiou, G. K., Bruggeman, A., and Lelieveld, J. (2019). Exploring the economy-wide effects of agriculture on air quality and health: Evidence from Europe. Sci. Total Environ. 663, 889–900. doi:10.1016/j.scitotenv.2019.01.410
Guilhot, L. (2022). An analysis of China's energy policy from 1981 to 2020: Transitioning towards to a diversified and low-carbon energy system. Energy Policy 162, 112806. doi:10.1016/j.enpol.2022.112806
Harris, S., Weinzettel, J., Bigano, A., and Kallmen, A. (2020). Low carbon cities in 2050? GHG emissions of European cities using production-based and consumption-based emission accounting methods. J. Clean. Prod. 248, 119206. doi:10.1016/j.jclepro.2019.119206
Hoekstra, R., and Bergh, J. (2002). Structural decomposition analysis of physical flows in the economy. Environ. Resour. Econ. 23 (3), 357–378. doi:10.1023/a:1021234216845
Hubacek, K., Baiocchi, G., Feng, K. S., and Patwardhan, A. (2017). Poverty eradication in a carbon constrained world. Nat. Commun. 8 (1), 912. doi:10.1038/s41467-017-00919-4
Jiang, M. H., and Hao, X. Q. (2022). Adjusting the intermediate input sources for global carbon emission reduction: An input–output optimization model. Sci. Total Environ. 835, 155582. doi:10.1016/j.scitotenv.2022.155582
Jiang, T. Y., Yu, Y., Jahanger, A., and Balsalobre-Lorente, D. (2022). Structural emissions reduction of China's power and heating industry under the goal of "double carbon": A perspective from input-output analysis. Sustain. Prod. Consum. 31, 346–356. doi:10.1016/j.spc.2022.03.003
Kim, T. J., and Tromp, N. (2021). Analysis of carbon emissions embodied in South Korea's international trade: Production-based and consumption-based perspectives. J. Clean. Prod. 320, 128839. doi:10.1016/j.jclepro.2021.128839
Lenzen, M. (2003). Environmentally important paths, linkages and key sectors in the Australian economy. Struct. Chang. Econ. Dyn. 14 (1), 1–34. doi:10.1016/s0954-349x(02)00025-5
Leontief, W. W. (1936). Quantitative input and output relations in the economic systems of the United States. Rev. Econ. Stat. 18 (3), 105–125. doi:10.2307/1927837
Li, J. S., Zhou, H. W., Meng, J., Yang, Q., Chen, B., and Zhang, Y. Y. (2018). Carbon emissions and their drivers for a typical urban economy from multiple perspectives: A case analysis for beijing city. Appl. Energy 226, 1076–1086. doi:10.1016/j.apenergy.2018.06.004
Li, W., Zhang, S. h., and Lu, C. (2022). Research on the driving factors and carbon emission reduction pathways of China's iron and steel industry under the vision of carbon neutrality. J. Clean. Prod. 357, 132237. doi:10.1016/j.jclepro.2022.132237
Li, Y. L., Chen, B., Chen, G. Q., Meng, J., and Hayat, T. (2020). An embodied energy perspective of urban economy: A three-scale analysis for beijing 2002-2012 with headquarter effect. Sci. Total Environ. 732, 139097. doi:10.1016/j.scitotenv.2020.139097
Liang, S., Qu, S., Zhu, Z. Q., Guan, D. B., and Xu, M. (2017). Income-based greenhouse gas emissions of Nations. Environ. Sci. Technol. 51 (1), 346–355. doi:10.1021/acs.est.6b02510
Liang, S., Wang, H. X., Qu, S., Feng, T. T., Guan, D. B., Fang, H., et al. (2016). Socioeconomic drivers of greenhouse gas emissions in the United States. Environ. Sci. Technol. 50 (14), 7535–7545. doi:10.1021/acs.est.6b00872
Liu, L. R., Huang, G., Baetz, B., Cheng, G. H., Pittendrigh, S. M., and Pan, S. Y. (2020). Input-output modeling analysis with a detailed disaggregation of energy sectors for climate change policy-making: A case study of saskatchewan, Canada. Renew. Energy 151, 1307–1317. doi:10.1016/j.renene.2019.11.136
Luo, F., Guo, Y., Yao, M. T., Cai, W. Q., Wang, M., and Wei, W. D. (2020). Carbon emissions and driving forces of China's power sector: Input-output model based on the disaggregated power sector. J. Clean. Prod. 268, 121925. doi:10.1016/j.jclepro.2020.121925
Ma, R. F. Z., Zheng, X. Q., Zhang, C. X., Li, J. Y., and Ma, Y. (2022). Distribution of CO2 emissions in China's supply chains: A sub-national MRIO analysis. J. Clean. Prod. 345, 130986. doi:10.1016/j.jclepro.2022.130986
Mi, Z. F., Zhang, Y. K., Guan, D. B., Shan, Y. L., Liu, Z., Cong, R. G., et al. (2016). Consumption-based emission accounting for Chinese cities. Appl. Energy 184, 1073–1081. doi:10.1016/j.apenergy.2016.06.094
Mi, Z. F., Zheng, J. L., Meng, J., Ou, J. M., Hubacek, K., Liu, Z., et al. (2020). Economic development and converging household carbon footprints in China. Nat. Sustain. 3 (7), 529–537. doi:10.1038/s41893-020-0504-y
Mi, Z. F., Zheng, J. L., Meng, J., Zheng, H. R., Li, X., Coffman, D., et al. (2019). Carbon emissions of cities from a consumption-based perspective. Appl. Energy 235, 509–518. doi:10.1016/j.apenergy.2018.10.137
National Bureau of Statistics (2019). China statistical Yearbook: 2019. Beijing: China Statistics Press.
Peters, G. P. (2008). From production-based to consumption-based national emission inventories. Ecol. Econ. 65 (1), 13–23. doi:10.1016/j.ecolecon.2007.10.014
Peters, G. P., and Hertwich, E. G. (2008). Post-kyoto greenhouse gas inventories: Production versus consumption. Clim. Change 86 (1-2), 51–66. doi:10.1007/s10584-007-9280-1
Roca, J., and Serrano, M. (2007). Income growth and atmospheric pollution in Spain: An input-output approach. Ecol. Econ. 63 (1), 230–242. doi:10.1016/j.ecolecon.2006.11.012
Rocco, M. V., Golinucci, N., Ronco, S. M., and Colombo, E. (2020). Fighting carbon leakage through consumption-based carbon emissions policies: Empirical analysis based on the World Trade Model with Bilateral Trades. Appl. Energy 274, 115301. doi:10.1016/j.apenergy.2020.115301
Shao, L., Geng, Z. H., Wu, X. F., Xu, P. Q., Pan, T., Yu, H., et al. (2020). Changes and driving forces of urban consumption-based carbon emissions: A case study of shanghai. J. Clean. Prod. 245, 118774. doi:10.1016/j.jclepro.2019.118774
Shi, X. Q., Wang, X., and Chen, P. (2021). A network-based approach for analyzing industrial green transformation: A case study of beijing, China. J. Clean. Prod. 317, 128281. doi:10.1016/j.jclepro.2021.128281
Steininger, K., Lininger, C., Droege, S., Roser, D., Tomlinson, L., and Meyer, L. (2014). Justice and cost effectiveness of consumption-based versus production-based approaches in the case of unilateral climate policies. Glob. Environ. Change 24, 75–87. doi:10.1016/j.gloenvcha.2013.10.005
Steininger, K. W., Lininger, C., Meyer, L. H., Munoz, P., and Schinko, T. (2016). Multiple carbon accounting to support just and effective climate policies. Nat. Clim. Chang. 6 (1), 35–41. doi:10.1038/nclimate2867
Sun, Y., Wang, Y., and Zhang, Z. K. (2022). Economic environmental imbalance in China - inter-city air pollutant emission linkage in Beijing-Tianjin-Hebei (BTH) urban agglomeration. J. Environ. Manag. 308, 114601. doi:10.1016/j.jenvman.2022.114601
Wang G, G. Y., Li, Y. P., Liu, J., Huang, G. H., Chen, L. R., Yang, Y. J., et al. (2022). A two-phase factorial input-output model for analyzing CO2-emission reduction pathway and strategy from multiple perspectives – a case study of Fujian province. Energy 248, 123615. doi:10.1016/j.energy.2022.123615
Wang, H., Ang, B. W., and Su, B. (2017). Assessing drivers of economy-wide energy use and emissions: IDA versus SDA. Energy Policy 107, 585–599. doi:10.1016/j.enpol.2017.05.034
Wang P, P. P., Li, Y. P., Huang, G. H., and Wang, S. G. (2022). A multivariate statistical input–output model for analyzing water-carbon nexus system from multiple perspectives - jing-Jin-Ji region. Appl. Energy 310, 118560. doi:10.1016/j.apenergy.2022.118560
Wang Q, Q., Jiang, F., and Li, R. R. (2022). Assessing supply chain greenness from the perspective of embodied renewable energy – a data envelopment analysis using multi-regional input-output analysis. Renew. Energy 189, 1292–1305. doi:10.1016/j.renene.2022.02.128
Wang, Q., and Yang, X. (2021). New insight into aggressive Intended Nationally Determined Contributions in China - what lessons China should learn from Germany to reduce production-based carbon emission. J. Clean. Prod. 279, 123522. doi:10.1016/j.jclepro.2020.123522
Wang, Y., Wang, W. Q., Mao, G. Z., Cai, H., Zuo, J., Wang, L. L., et al. (2013). Industrial CO2 emissions in China based on the hypothetical extraction method: Linkage analysis. Energy Policy 62, 1238–1244. doi:10.1016/j.enpol.2013.06.045
Wen, H. X., Chen, Z. M., Yang, Q., Liu, J. Y., and Nie, P. Y. (2022). Driving forces and mitigating strategies of CO2 emissions in China: A decomposition analysis based on 38 industrial sub-sectors. Energy 245, 123262. doi:10.1016/j.energy.2022.123262
Wen, W., and Wang, Q. (2020). Re-examining the realization of provincial carbon dioxide emission intensity reduction targets in China from a consumption-based accounting. J. Clean. Prod. 244, 118488. doi:10.1016/j.jclepro.2019.118488
Wiedenhofer, D., Guan, D. B., Liu, Z., Meng, J., Zhang, N., and Wei, Y. M. (2017). Unequal household carbon footprints in China. Nat. Clim. Chang. 7 (1), 75–80. doi:10.1038/nclimate3165
Wiedmann, T. (2009). A review of recent multi-region input-output models used for consumption-based emission and resource accounting. Ecol. Econ. 69 (2), 211–222. doi:10.1016/j.ecolecon.2009.08.026
Wu, R., Ma, T., and Schröder, E. (2022). The contribution of trade to production-based carbon dioxide emissions. Struct. Change Econ. Dyn. 60, 391–406. doi:10.1016/j.strueco.2021.12.005
Wu, Y., Tam, V. W. Y., Shuai, C. Y., Shen, L. Y., Zhang, Y., and Liao, S. J. (2019). Decoupling China's economic growth from carbon emissions: Empirical studies from 30 Chinese provinces (2001-2015). Sci. Total Environ. 656, 576–588. doi:10.1016/j.scitotenv.2018.11.384
Xie, R., Hu, G. X., Zhang, Y. G., and Liu, Y. (2017). Provincial transfers of enabled carbon emissions in China: A supply-side perspective. Energy Policy 107, 688–697. doi:10.1016/j.enpol.2017.04.021
Xinhua News Agency (2020). Xi jinping president of the people’s republic of China at the general debate of the 75th session of the united Nations general assembly. Available at: http://www.xinhuanet.com//mrdx/2020-09/23/c_1393 (Accessed March 15, 2022).
Xu, L. X., Chen, G. W., Wiedmann, T., Wang, Y. F., Geschke, A., and Shi, L. (2019). Supply-side carbon accounting and mitigation analysis for Beijing-Tianjin-Hebei urban agglomeration in China. J. Environ. Manag. 248, 109243. doi:10.1016/j.jenvman.2019.07.014
Xu, W. H., Xie, Y. L., Xia, D. H., Ji, L., and Huang, G. H. (2021). A multi-sectoral decomposition and decoupling analysis of carbon emissions in Guangdong province, China. J. Environ. Manag. 298, 113485. doi:10.1016/j.jenvman.2021.113485
Xu, X. L., Huang, G. H., Liu, L. R., Guan, Y. R., Zhai, M. Y., and Li, Y. P. (2020). Revealing dynamic impacts of socioeconomic factors on air pollution changes in Guangdong Province, China. Sci. Total Environ. 699, 134178. doi:10.1016/j.scitotenv.2019.134178
Yan, J., Su, B., and Liu, Y. (2018). Multiplicative structural decomposition and attribution analysis of carbon emission intensity in China, 2002-2012. J. Clean. Prod. 198, 195–207. doi:10.1016/j.jclepro.2018.07.003
Yang, Y. Y., Liu, Y. S., Li, Y. R., and Li, J. T. (2018). Measure of urban-rural transformation in Beijing-Tianjin-Hebei region in the new millennium: Population-land-industry perspective. Land Use Policy 79, 595–608. doi:10.1016/j.landusepol.2018.08.005
Zha, D. L., Chen, Q., and Wang, L. J. (2022). Exploring carbon rebound effects in Chinese households’ consumption: A simulation analysis based on a multi-regional input–output framework. Appl. Energy 313, 118847. doi:10.1016/j.apenergy.2022.118847
Zhai, M. Y., Huang, G. H., Liu, H. Z., Liu, L. R., He, C. Y., and Liu, Z. P. (2020a). Three-perspective energy-carbon nexus analysis for developing China's policies of CO2-emission mitigation. Sci. Total Environ. 705, 135857. doi:10.1016/j.scitotenv.2019.135857
Zhai, M. Y., Huang, G. H., Liu, L. R., Xu, X. L., Guan, Y. R., and Fu, Y. P. (2020b). Revealing environmental inequalities embedded within regional trades. J. Clean. Prod. 264, 121719. doi:10.1016/j.jclepro.2020.121719
Zhang, B., Qiao, H., Chen, Z. M., and Chen, B. (2016). Growth in embodied energy transfers via China's domestic trade: Evidence from multi-regional input-output analysis. Appl. Energy 184, 1093–1105. doi:10.1016/j.apenergy.2015.09.076
Zhang, H. R., Chen, L., Tong, Y. D., Zhang, W., Yang, W., Liu, M. D., et al. (2018). Impacts of supply and consumption structure on the mercury emission in China: An input-output analysis based assessment. J. Clean. Prod. 170, 96–107. doi:10.1016/j.jclepro.2017.09.139
Zhang, K., and Liang, Q. M. (2022). Quantifying trade-related carbon emission in China's provinces: Insight from sectoral production technology heterogeneity. J. Clean. Prod. 344, 131141. doi:10.1016/j.jclepro.2022.131141
Zhang, P., and Wang, H. (2022). Do provincial energy policies and energy intensity targets help reduce CO2 emissions? Evidence from China. Energy 245, 123275. doi:10.1016/j.energy.2022.123275
Zhang, X. M., Su, B., Yang, J., and Cong, J. H. (2022). Analysis of Shanxi Province's energy consumption and intensity using input-output framework (2002–2017). Energy 250, 123786. doi:10.1016/j.energy.2022.123786
Zhang, Y. G. (2015). Provincial responsibility for carbon emissions in China under different principles. Energy Policy 86, 142–153. doi:10.1016/j.enpol.2015.07.002
Keywords: carbon emissions analysis, consumption-based accounting, production-based accounting, income-based accounting, structural decomposition analysis, emission linage analysis
Citation: Li Q and Chen C (2023) A characteristics analysis of carbon emission based on multi-dimensional carbon emission accounting methods and structural decomposition analysis: A case study of Beijing, China. Front. Earth Sci. 10:1073167. doi: 10.3389/feart.2022.1073167
Received: 18 October 2022; Accepted: 18 November 2022;
Published: 13 January 2023.
Edited by:
Chuanbao Wu, Shandong University of Science and Technology, ChinaCopyright © 2023 Li and Chen. This is an open-access article distributed under the terms of the Creative Commons Attribution License (CC BY). The use, distribution or reproduction in other forums is permitted, provided the original author(s) and the copyright owner(s) are credited and that the original publication in this journal is cited, in accordance with accepted academic practice. No use, distribution or reproduction is permitted which does not comply with these terms.
*Correspondence: Cong Chen, Y2hlbmNvbmdAdXN0Yi5lZHUuY24=