 Yi Fan
 Xiaona Yao
 Botao Zhou
 Huixin Li
 Mei Liu4
- 1Collaborative Innovation Center on Forecast and Evaluation of Meteorological Disasters, Key Laboratory of Meteorological Disaster, Ministry of Education, Joint International Research Laboratory of Climate and Environment Change, School of Atmospheric Sciences, Nanjing University of Information Science and Technology, Nanjing, China
- 2Nansen-Zhu International Research Centre, Institute of Atmospheric Physics, Chinese Academy of Sciences, Beijing, China
- 3School of Earth Sciences, Yunnan University, Kunming, China
- 4Jiangsu Meteorological Observatory, Nanjing, China
Unprecedented heat waves have been demonstrated sweeping across much of the Northern Hemisphere in recent summers. However, this study reveals that for northern Eurasia (30°–70°N, 10°–130°E), significant increases in summer extreme high temperature days (EHTDs) have already commenced since the mid-1990s, with the peaks centered on the surrounding areas of the Caspian Sea and Lake Baikal. Results indicate that compared with the period of 1960–1994 (P1), during 1995–2018 (P2) high-pressure and anticyclonic anomalies occupy the areas around the Caspian Sea and Lake Baikal, thus suppressing local cloud cover and precipitation, enhancing the solar radiation and high-temperature anomalies. The anticyclonic anomaly over Lake Baikal shows a close relationship with the increasing trend of global temperature, and the anomalous anticyclone over the Caspian Sea is under the influence of the warm North Atlantic and anomalous upper-troposphere jet stream during P2. The warmer than normal North Atlantic leads to the high-pressure anomaly over the Caspian Sea by modulating the Rossby wave activity. In addition, during P2, the temperatures in the middle North Atlantic and Western Europe show greater increments than those over higher latitudes, and thus the temperature gradient enhances the westerly thermal wind, which therefore leads to an anomalous upper-level jet stream to the North of the Caspian Sea. Under this circumstance, the Caspian Sea is located to the right side of the anomalous jet exit, inducing the suppressed upward motion over there and favoring the occurrence of more EHTDs after the mid-1990s.
1 Introduction
The northern part of the Eurasian continent is located deep inland to the east of the Atlantic and south of the Arctic with a temperate continental climate over most of the area. Due to the year-round control of continental air masses, this area is characterized by large annual temperature differences, being fragile and sensitive to background climate variations (e.g., Li et al., 2016; Ji and Fan, 2019). Moreover, the northern part of the Eurasian continent constitutes the “heartland” of the world and has become a necessary place for cultural and economic exchanges between Asia and western countries. Therefore, it is important to study the characteristics of extreme temperature variations in this region.
Extreme high temperature day (EHTD) is usually defined as a day with the maximum temperature exceeds a threshold indicator, which is generally considered to be the 90th percentile (Tx90p) if a cumulative distribution function is used to represent the daily maximum temperature (e.g., Zhang et al., 2005; Cornes and Jones, 2013). As global warming intensifies in recent decades, EHTDs occur more frequently in many regions of the world, with serious impacts on electricity, water supply, and public health, constraining the stable development of society (e.g., Greenough et al., 2001; Meehl and Tebaldi, 2004; Alexander et al., 2006; Coumou and Rahmstorf, 2012; Lesk et al., 2016; Ge et al., 2019; Allan et al., 2021).
For many years, studies have indicated that the frequency and intensity of various extreme events are exhibiting significant decadal changes, which could often be attributed to the influences from external forcing caused by increasing greenhouse gas concentrations due to anthropogenic emissions (e.g., Wang et al., 2012; Fischer and Knutti, 2015; Dong et al., 2017; Chen and Dong, 2019; Vautard et al., 2019; Hu et al., 2020; Ge et al., 2021). However, changes in oceanic and atmospheric circulation from internal variability of the climate system and their teleconnections are also important in determining the occurrence of regional climate extremes, especially EHTDs (e.g., Fan and Wang, 2004; Zhou and Wu, 2016; Hong et al., 2017; Sun et al., 2019; Jiang et al., 2020; Zhang et al., 2020; Fan et al., 2022; Li et al., 2022). It is indicated that under the modulation of teleconnections such as the Eurasian teleconnection pattern, Silk Road pattern, and East Asia–Pacific pattern, the frequency of EHTDs in Northeast China increased after the mid-1990s (Liu et al., 2021). Li et al. (2018) pointed out that the anomalous wave activity caused by the warming tropical Atlantic is the main reason for the increased variability of high-temperature extremes in Mongolia. Besides, the heat wave events in the Korean Peninsula and China have been strongly affected by the Scandinavian and the circumglobal teleconnection patterns and show decadal changes in the interannual variability (Choi et al., 2020).
Previous studies have shown that due to the polar amplification effect, the climate architecture in polar areas undergoes a more dramatic change than in lower latitudes, leading to changes in jet and North Atlantic sea surface temperature (SST) (e.g., Screen and Simmonds, 2010; Francis and Vavrus, 2015; Ma et al., 2021). The anomalous summer jet and the teleconnection patterns are significant in modulating the atmospheric background, which in turn affect Eurasian surface temperatures through cloud-radiation feedback and temperature advection processes (e.g., Smith et al., 2010; Zhu et al., 2011; Hanlon et al., 2013; Chen and Wu, 2017). Considering the above factors, characteristics of the interdecadal variability of local climate extremes in northern Eurasia and possible reasons caused by the background changes in circulation and SSTs are to be investigated in this study.
The main contents of this paper are as follows: Data and methods are introduced in Section 2. Spatial and temporal characteristics of the EHTD in northern Eurasia, decadal variability, and the corresponding changes in the climatic background, as well as the possible reasons, are analyzed in Section 3. A summary and discussion of this study are provided in Section 4.
2 Data and methods
The Tx90p index is calculated as the percentage of days when the maximum daily temperature exceeds the 90th percentile during a certain time interval to present the EHTD (Zhang et al., 2005). The extreme indices are provided by the Met Office Hadley Centre observations datasets: HadEX3 (Dunn et al., 2020), on a 1.25° × 1.875° grid from 1960 to 2018 (https://www.metoffice.gov.uk/hadobs/hadex3/index.html). The number of EHTDs is calculated as the sum of the Tx90p indices in summer: June, July, and August. The monthly reanalysis datasets for circulation, sea level pressure, geopotential height, total cloud cover, rate of precipitation, downward solar radiation flux, and air temperature with resolutions of 2.5° × 2.5° are derived from the National Centers for Environmental Prediction-National Center for Atmospheric Research (NCEP-NCAR) Reanalysis 1 (http://www.psl.noaa.gov/data/gridded/data.ncep.reanalysis.derived.html) from 1960 to 2018. The SST is obtained from the National Oceanic and Atmospheric Administration (NOAA) Extended Reconstructed SST V5 (https://www.ncei.noaa.gov). The Atlantic Multidecadal Oscillation (AMO) index is calculated as the detrended area-weighted average summer SST over the North Atlantic from the website of https://psl.noaa.gov/data/timeseries/AMO/.
In this paper, the climate mean is calculated using the average values during 1960–2018. The empirical orthogonal function (EOF) method is used to decompose the number of EHTDs in northern Eurasia into spatial and temporal components to reflect the main spatial characteristics. North-test is employed to verify that the EOFs are reasonably distinct from each other (North et al., 1982). The sliding t-test is used to test the significance of interdecadal changes in the time series of the number of EHTDs. Simple linear regression and Pearson’s correlation are used to investigate the relationship between different fields (Wilks, 2011).
To investigate the wave-activity flux for large-scale stationary waves during different periods, the horizontal component at pressure level p of wave-activity flux (Takaya and Nakamura, 2001) is:
where the overbars and primes denote mean states and deviations from the mean states, respectively; the subscripts x and y represent zonal and meridional gradients; u = (u, v) denotes horizontal wind velocity; and
3 Results
3.1 Decadal variation of the EHTD
EOF analysis on the EHTDs in summer northern Eurasia (30°–70°N, 10°–130°E) during 1960–2018 shows that the first eigenvector explains 37.2% of the total variance (Figure 1A). The first eigenvector is well separated from the second according to the criterion developed by North et al. (1982), with consistent values across the region. Therefore, a regional average of the EHTDs in summer in this region could be carried out to obtain the EHTD index. As shown in Figure 1B, during 1960–1994, the EHTD index fluctuates slightly and the average value is relatively small, while the mean EHTD index increased during 1995–2018 with a relatively large mean value. Moreover, statistical analysis of the decadal variation characteristic of the EHTD index with sliding t-test (Figure 1C) reveals that the average value of the index changes significantly around 1994/1995. According to the variation in the number of EHTDs in summer in northern Eurasia, the total period is divided into two phases, i.e., fewer EHTDs during the period of 1960–1994 (P1), and more EHTDs during the period of 1995–2018 (P2).
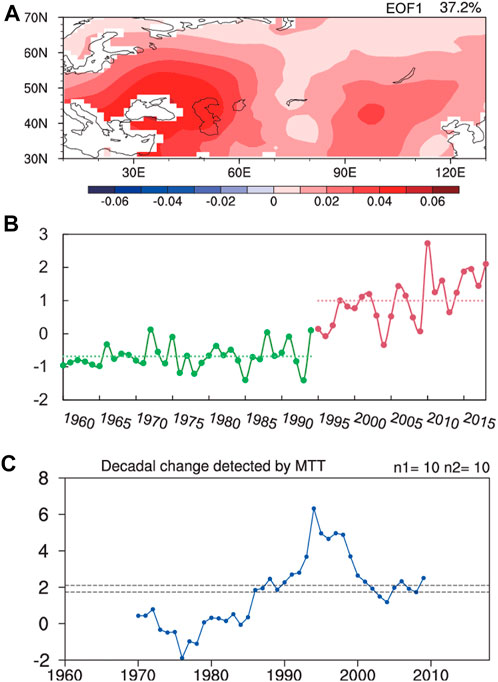
FIGURE 1. (A) The first eigenvector of the EOF analysis on the EHTDs. (B) Year-by-year series (scatter) of the summer EHTD indices in northern Eurasia (10°–130°E, 30°–70°N) from 1960 to 2018, and the averaged values (dashed lines) of the index on time for 1960–1994 (P1) and 1995–2018 (P2), respectively. (C) Decadal change of EHTDs in northern Eurasia according to the sliding t-test (blue: sliding t-test statistic, two dotted lines for low and high indicate significance at 90% and 95% confidence levels, respectively).
Figures 2A, B show the anomalies of EHTDs during P1 and P2, respectively. Negative anomalies are mainly distributed over most areas in northern Eurasia during P1 (Figure 2A), while positive anomalies of EHTD occupy almost all the regions with the large values located around the Caspian Sea and Lake Baikal during P2 (Figure 2B). The difference in the EHTDs between P2 and P1 shows a similar pattern as that between P2 and the climatology, showing more EHTDs during P2 than P1 (Figure 2C). Concerning the significant decadal increase in the EHTDs, how the associated atmospheric circulation and sea surface temperature background change during the two periods and the possible causes responsible for these anomalies are to be investigated in the next subsection.
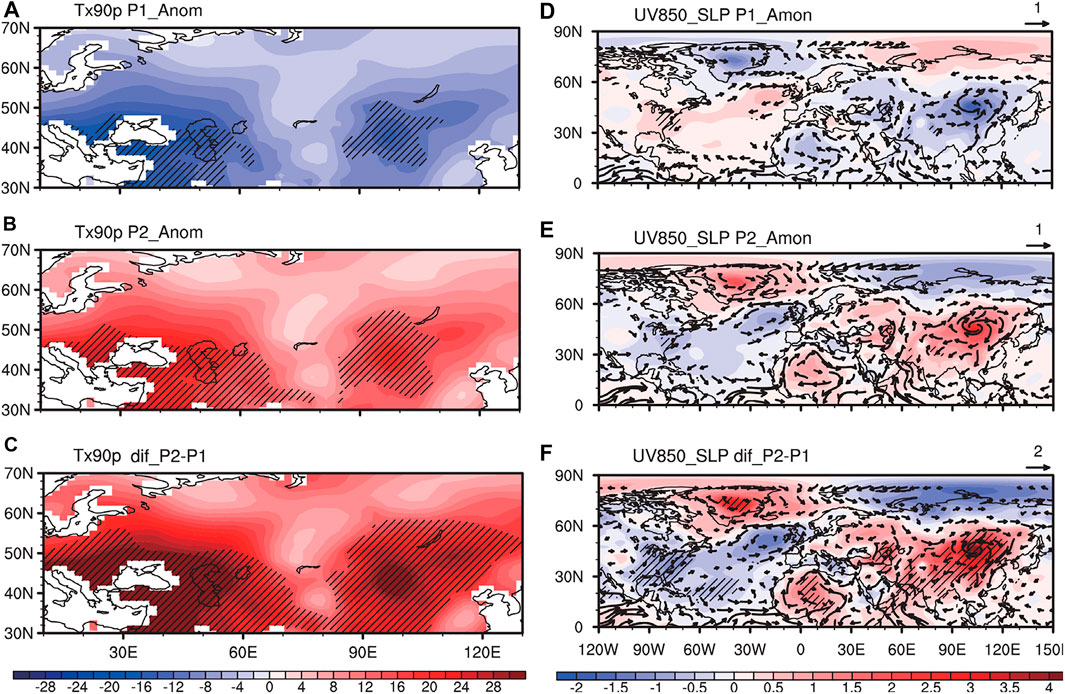
FIGURE 2. Differences in terms of the EHTDs between (A) P1 and the climatology, (B) P2 and the climatology, and (C) P2 and P1 (unit: %); the second column [(D–F)] for the sea level pressure (shading, unit: hPa) and wind field at 850 hPa (vector, unit: m/s). Dashed areas indicate significance at 99% confidence level according to the Student’s t-test.
3.2 Decadal variations of associated atmospheric circulations
The lower-troposphere circulation anomalies for P1 and P2 show generally contrary characteristics (Figures 2D–F). During the P1 period, low pressure and cyclonic circulation anomalies are observed over Greenland, eastern Europe, and Mongolia, whereas high pressure and anticyclonic circulation anomalies occupy the North Atlantic (Figure 2D). The cyclonic circulation over northern Eurasia is favorable for the formation of clouds and precipitation (Figures 3A, D), which suppresses the solar radiation reaching the surface (Figure 3G) and the formation of anomalous EHTDs during P1 (Figure 2A). In contrast, during the P2 period, high pressure and anticyclonic circulation anomalies are detected over the northern Eurasia region (Figure 2E), leading to a clearer sky with less cloud cover (Figure 3B), less precipitation (Figure 3E), more solar radiation (Figure 3H), and finally benefiting the occurrence of EHTDs (Figure 2B). As shown in Figures 3C, F, I, the differences in terms of cloud cover, precipitation and solar radiation between P2 and P1 exert similar patterns as shown in Figures 3B, E, H: Less cloud cover and precipitation are accompanied by more solar radiation reaching the surface as well as more EHTDs during P2 than P1.
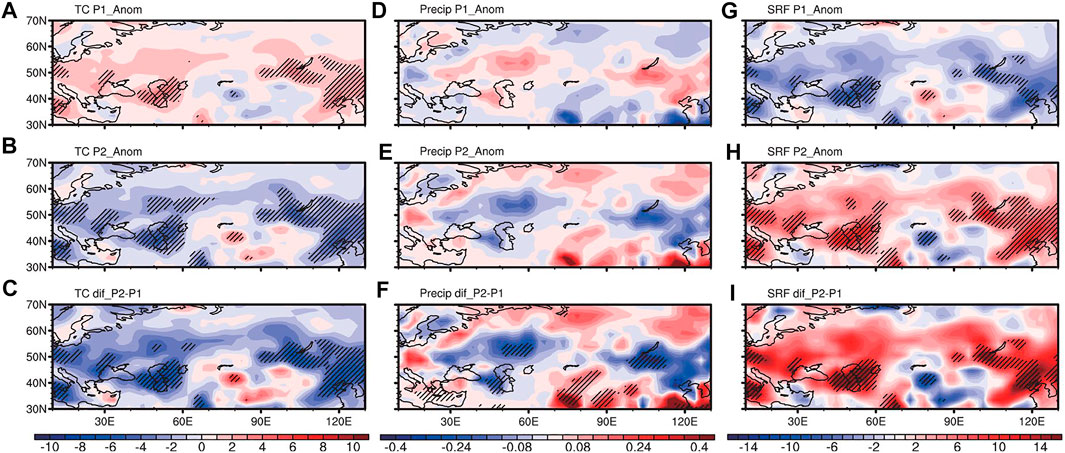
FIGURE 3. Differences in terms of the total cloud cover between (A) P1 and the climatology, (B) P2 and the climatology, and (C) P2 and P1 (unit: %); the second column [(D–F)] for the rate of precipitation (unit: mm/day); the third column [(G–I)] for the downward solar radiation flux at surface (unit: W/m2). Dashed areas indicate significance at 95% confidence level according to the Student’s t-test.
3.3 Possible physical mechanisms
The ocean and atmosphere compose a complex coupled system. Ocean provides heat, water vapor, and energy to the atmosphere, influencing the temperature, humidity, and atmospheric circulations (e.g., Gill and Adrian, 1982; Webster, 1994; Trenberth et al., 2001; Si and Ding, 2016; Chen and Wu, 2017; Fan et al., 2019). To further investigate the causes of the circulation anomalies, the following parts focus on the relationship between the circulation anomaly over northern Eurasia and the surrounding SST.
A composite analysis of SST at different periods reveals that the key areas with significant decadal changes in SST are mainly located in the North Atlantic. The North Atlantic SST is colder than normal during P1 (Figure 4A) while warmer than normal during P2 (Figures 4B, C), playing important roles in the decadal variation of EHTDs in northern Eurasia. In addition, the correlation coefficient between the AMO indices and the EHTD index is 0.69, which is significant at the 99% confidence level according to the Student’s t-test, indicating the influence of AMO on the interdecadal timescale. That is, the positive correlation between the changes in North Atlantic SST and the EHTDs in northern Eurasia indicates that the warmer (colder) than normal North Atlantic is consistent with more (less) EHTDs in northern Eurasia. Furthermore, the AMO index is standardized for P1 and P2, respectively (Supplementary Figure S1), to obtain the warm cases with AMO indices greater than 1.5 standard deviation (1960 and 1989 for P1, and 2010 for P2). The anomalous wave activity flux and geopotential height at 200 hPa for warm cases during P1 and P2 are shown in Figure 5. A propagation route of the anomalous wave activity flux with alternating high- and low-pressure anomalies from the northern Atlantic to the Caspian Sea could be figured out for both P1 and P2 (Figure 5), indicating that a warmer than normal North Atlantic favors the high-pressure anomaly over the Caspian Sea. During P2, the North Atlantic is warmer than P1 (Figure 4), and the wave activity flux and pressure anomalies over the Caspian Sea are stronger (Figure 5). Meanwhile, the sinking motion accompanied by high pressure would bring more clear sky and solar radiation (Figures 3C, F, I), increasing EHTDs in northern Eurasia (Figure 2C).
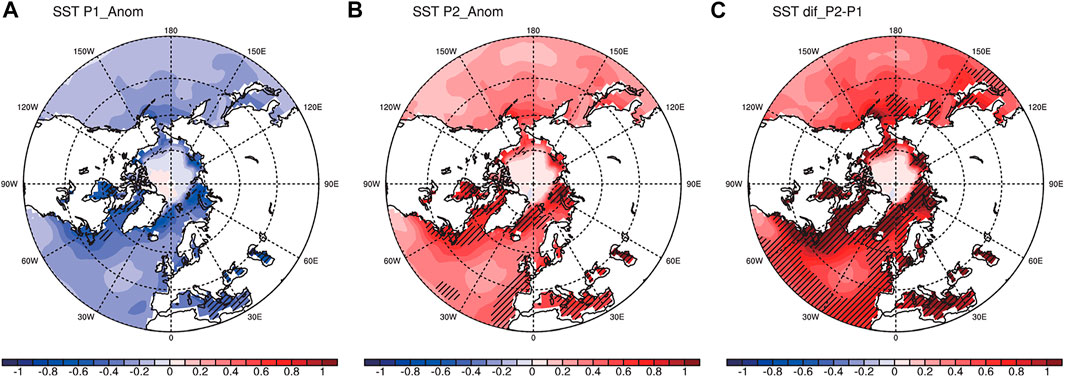
FIGURE 4. Differences in terms of the SST between (A) P1 and the climatology, (B) P2 and the climatology, and (C) P2 and P1 (unit: K). Dashed areas indicate significance at 95% confidence level according to the Student’s t-test.
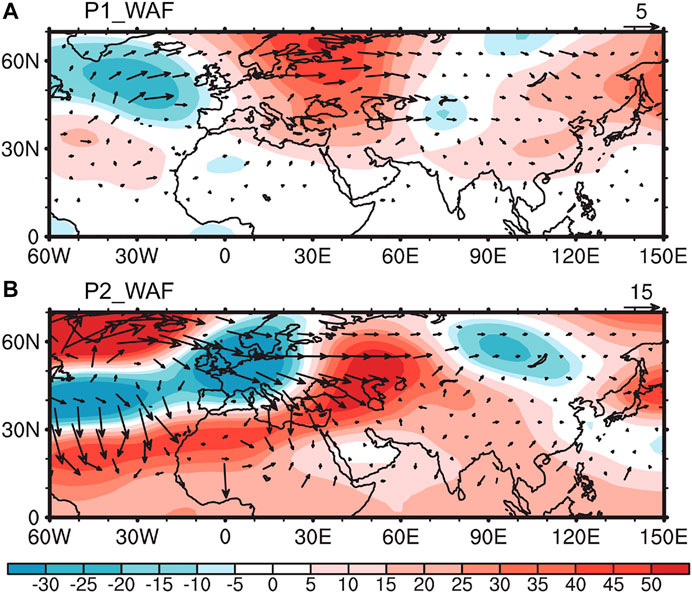
FIGURE 5. The 200 hPa geopotential height (unit: gpm) and wave activity flux (vector, unit: m2 s−2) anomalies for warm North Atlantic years during (A) P1 and (B) P2.
Another important factor affecting the summer climate in northern Eurasia is the position of the upper-level jet stream (e.g., Smith et al., 2019; Ma et al., 2021; Streffing et al., 2021). As shown in Figure 6, during P2 (P1), the temperatures in the middle North Atlantic and Europe show significant increments (decreases) than those over higher latitudes, and thus the temperature gradient is larger (smaller) than normal along these areas along 50°N. Moreover, according to the thermal wind principle, the westerly jet stream over there would be accelerated. As shown in Figure 7, the climatology of the 200 hPa horizontal wind speed over Europe shows that the average position of the jet stream is located at around 45°N, while the anomalous westerly jet stream is southward (northward) at around 30°N (50°N) during P1 (P2). Therefore, during P2, the Caspian Sea is located on the right side of the anomalous upper-level jet stream exit. Due to that the wind speed decreases rapidly in the jet exit area and the wind speed along the jet axis is larger than that on both sides, there is a negative vorticity advection resulting in the anticyclonic anomaly on the right side of the jet exit area at 200 hPa. Furthermore, under the Coriolis forcing effect, convergence anomaly exits at the upper-level troposphere, leading to high pressure and divergence anomalies at the lower troposphere as well as the abnormal sinking motion between the two layers. With the joint impacts of the northwards-than-normal jet stream, negative vorticity advection, and strengthening sinking movement, the summer EHTDs are inclined to increase in the Caspian Sea during P2.
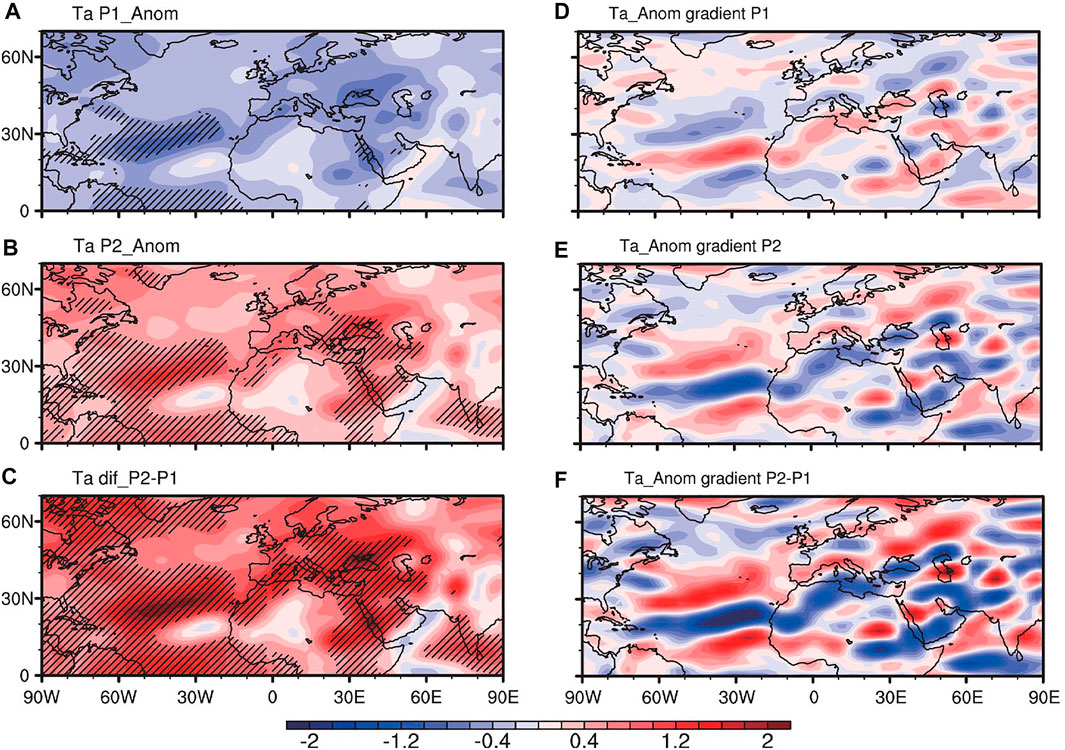
FIGURE 6. Differences in terms of the 850 hPa air temperature between (A) P1 and the climatology, (B) P2 and the climatology, and (C) P2 and P1 (unit: K). Dashed areas indicate significance at 99% confidence level according to the Student’s t-test. [(D–F)] The meridional gradient of air temperature in [(A–C)], respectively (unit: K kkm−1).
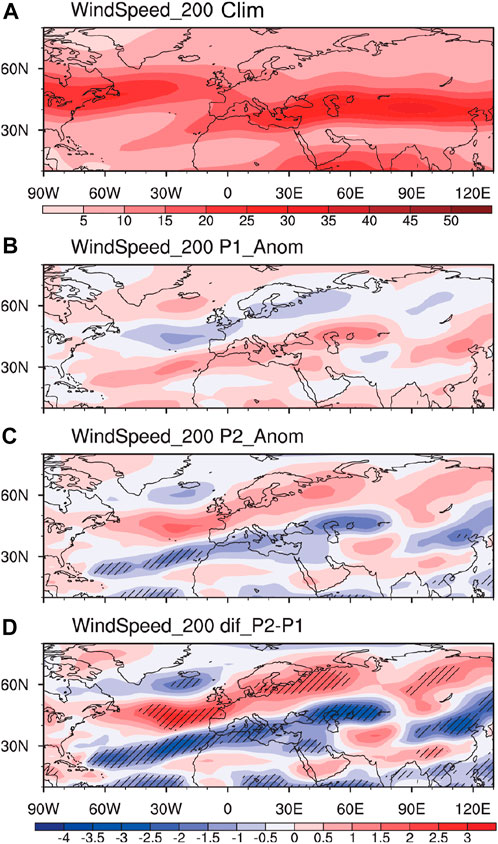
FIGURE 7. Horizontal wind speed at 200 hPa for (A) climatology, (B) difference between P1 and climatology, (C) difference between P2 and climatology, and (D) difference between P2 and P1 (unit: m/s, shading indicates significance at 90% confidence level according to the Student’s t-test).
The AMO phase changes twice during 1960–2018, which appear around 1965 and 1995, respectively. The decadal change in EHTDs is consistent with the phase of the AMO from the cold phase to the warm phase. During the positive AMO phase, more frequent occurrences of negative NAO may contribute to the increased EHTDS over the Caspian Sea and Lake Baikal by modulating the eastward propagated wave trains such as the Silk Road pattern and inducing the high-pressure anomalies (Hong et al., 2022). Besides, regression analysis shows that the global warming trend shows a significant influence on the positive pressure anomalies over the areas to the South of Lake Baikal (Supplementary Figure S2). It indicates the contribution of global warming on the increasing EHTDs over areas around Lake Baikal.
4 Summary and discussion
In recent decades, the summer extreme high temperature days (EHTDs) in the Northern Hemisphere has been frequently detected, posing a serious threat to the safety of human life, agricultural production, and the ecological environment of many countries. This study investigates the decadal variation of summer EHTDs in northern Eurasia during 1960–2018, using the EHTD index provided by Hadley Center and the atmospheric circulation and sea surface temperature (SST) data provided by NOAA. The corresponding climate factors are also analyzed with statistical and dynamic diagnosis methods. The obtained conclusion are summarized as follows.
The number of summer EHTDs in northern Eurasia undergoes a significant decadal variation around the mid-1990s, especially over the areas around Lake Baikal and the Caspian Sea, with fewer EHTDs during 1960–1994 and more EHTDs during 1995–2018. The circulation background also shows a corresponding decadal variation at that time. During 1960–1994 (1995–2018), low pressure and cyclonic (high pressure and anticyclonic) anomalies control Lake Baikal and the Caspian Sea, favoring more (less) cloud cover and precipitation, absent (sufficient) solar radiation and decreased (increased) EHTDs over there.
During 1995–2018, the anomalous Rossby wave activities induced by warmer than normal North Atlantic leads to high-pressure anomalies over the Caspian Sea, resulting in the significant anticyclonic anomaly over the area, which favors the more frequent occurrence of EHTDs than those during 1960–1994. Meanwhile, the Atlantic jet is located northward. The area around the Caspian Sea is to the right side of the jet stream exit. On such a background, the negative vorticity advection at the upper-level troposphere would lead to the divergence anomaly and strengthen the sinking motion between lower- and higher-levels. Thus, the summer EHTD tends to be maintained over the Caspian Sea. As for the increasing EHTD over areas around Lake Baikal, the influence of global warming and the modulation of AMO on the NAO-Silk Road teleconnection relationship might play important roles, and corresponding mechanisms still need further exploration. Besides, previous study has also pointed out that the variations in summer Arctic contribute to the heatwaves in Eurasia (Wu and Francis, 2019). Therefore, the impacts of the sea surface temperature and sea ice cover in Arctic on decadal change in EHTDs over Northern Eurasia are also to be further investigated.
In this paper, the causes of decadal variation of the summer EHTD in northern Eurasia are investigated primarily from the perspective of changes in circulation backgrounds. However, it is also important to further detect whether the contributions are mainly attributed to the internal variability of the climate system or the external forcing signals such as human-induced greenhouse gas emissions and anthropogenic aerosols. Therefore, future studies will make further investigations with numerical model experiments and state-of-the-art methods of attribution analysis.
Data availability statement
The datasets presented in this study can be found in online repositories. The names of the repository/repositories and accession number(s) can be found below: http://www.psl.noaa.gov/data/gridded/data.ncep.reanalysis.derived.html.
Author contributions
All authors equally collaborated in the research presented in this publication by making the following contributions. Conceptualization, YF and BZ; data curation, BZ; formal analysis, YF and XY; investigation, YF, XY, and ML; methodology, YF, BZ, and HL; writing—original draft, YF; Writing—review and editing, YF, BZ, HL, XY, and ML.
Funding
This work is jointly supported by Grants from the National Natural Science Foundation of China (Grants 41991285; 42105030; 42005015), the Natural Science Foundation of the Jiangsu Higher Education Institutions of China (21KJB170005), and the Natural Science Foundation of Jiangsu Province (BK20200814).
Acknowledgments
We thank the editor and reviewers, who helped a lot in improving the manuscript. We also thank the support from the Startup Foundation for Introducing Talent of NUIST.
Conflict of interest
The authors declare that the research was conducted in the absence of any commercial or financial relationships that could be construed as a potential conflict of interest.
The reviewer JM declared a shared affiliation with the authors YF, BZ, and HL to the handling editor at time of review.
Publisher’s note
All claims expressed in this article are solely those of the authors and do not necessarily represent those of their affiliated organizations, or those of the publisher, the editors and the reviewers. Any product that may be evaluated in this article, or claim that may be made by its manufacturer, is not guaranteed or endorsed by the publisher.
Supplementary material
The Supplementary Material for this article can be found online at: https://www.frontiersin.org/articles/10.3389/feart.2022.1076396/full#supplementary-material
SUPPLEMENTARY FIGURE S1 | Standardized AMO index during (A) P1 and (B) P2, respectively.
SUPPLEMENTARY FIGURE S2 | Regression coefficients of global temperature (index derived from https://climate.nasa.gov/vital-signs/global-temperature/) onto sea level pressure (shading, dots indicate significance at 90% confidence level according to the Student’s t-test).
References
Alexander, L. V., Zhang, X., Peterson, T. C., Caesar, J., Gleason, B., Klein Tank, A. M. G., et al. (2006). Global observed changes in daily climate extremes of temperature and precipitation. J. Geophys. Res. Atmos. 111 (D5), D05109. doi:10.1029/2005jd006290
Allan, R. P., Hawkins, E., Bellouin, N., and Collins, B. (2021). “IPCC, 2021: Summary for policymakers,” in Climate change 2021: The physical science basis. Contribution of working group I to the sixth assessment report of the intergovernmental panel on climate change. Editors V. Masson-Delmotte, P. Zhai, and A. Pirani, Cambridge, UK: Cambridge University Press.
Chen, S., and Wu, R. (2017). Interdecadal changes in the relationship between interannual variations of spring North Atlantic SST and eurasian surface air temperature. J. Clim. 30, 3771–3787. doi:10.1175/jcli-d-16-0477.1
Chen, W., and Dong, B. (2019). Anthropogenic impacts on recent decadal change in temperature extremes over China: Relative roles of greenhouse gases and anthropogenic aerosols. Clim. Dyn. 52, 3643–3660. doi:10.1007/s00382-018-4342-9
Choi, N., Lee, M., Cha, D., Lim, Y. K., and Kim, K. M. (2020). Decadal changes in the interannual variability of heat waves in East Asia caused by atmospheric teleconnection changes. J. Clim. 33, 1505–1522. doi:10.1175/jcli-d-19-0222.1
Cornes, R. C., and Jones, P. D. (2013). How well does the ERA-Interim reanalysis replicate trends in extremes of surface temperature across Europe? J. Geophys. Res. Atmos. 118, 10262–10276. doi:10.1002/jgrd.50799
Coumou, D., and Rahmstorf, S. (2012). A decade of weather extremes. Nat. Clim. Change 2, 491–496. doi:10.1038/nclimate1452
Dong, B., Sutton, R. T., and Shaffrey, L. (2017). Understanding the rapid summer warming and changes in temperature extremes since the mid-1990s over Western Europe. Clim. Dyn. 48, 1537–1554. doi:10.1007/s00382-016-3158-8
Dunn, R. J. H., Alexander, L. V., Donat, M. G., Zhang, X., Bador, M., Herold, N., et al. (2020). Development of an updated global land in situ-based data set of temperature and precipitation extremes: HadEX3. J. Geophys. Res. Atmos. 125, e2019JD032263. doi:10.1029/2019jd032263
Fan, K., and Wang, H. J. (2004). Antarctic oscillation and the dust weather frequency in North China. Geophys. Res. Lett. 31, L10201. doi:10.1029/2004gl019465
Fan, Y., Fan, K., Zhu, X., and Fraedrich, K. (2019). El niño–related summer precipitation anomalies in southeast asia modulated by the atlantic multidecadal oscillation. J. Clim. 32, 7971–7987. doi:10.1175/jcli-d-19-0049.1
Fan, Y., Li, J., Zhu, S., Li, H., and Zhou, B. (2022). Trends and variabilities of precipitation and temperature extremes over Southeast Asia during 1981–2017. Meteorology Atmos. Phys. 134, 78. doi:10.1007/s00703-022-00913-6
Fischer, E. M., and Knutti, R. (2015). Anthropogenic contribution to global occurrence of heavy-precipitation and high-temperature extremes. Nat. Clim. Change 5, 560–564. doi:10.1038/nclimate2617
Francis, J. A., and Vavrus, S. J. (2015). Evidence for a wavier jet stream in response to rapid Arctic warming. Environ. Res. Lett. 10, 014005. doi:10.1088/1748-9326/10/1/014005
Ge, F., Zhu, S., Luo, H., Zhi, X., and Wang, H. (2021). Future changes in precipitation extremes over southeast asia: Insights from CMIP6 multi-model ensemble. Environ. Res. Lett. 16, 024013. doi:10.1088/1748-9326/abd7ad
Ge, F., Zhu, S., Peng, T., Zhao, Y., Sielmann, F., Fraedrich, K., et al. (2019). Risks of precipitation extremes over southeast asia: Does 1.5° C or 2° C global warming make a difference?[J]. Environ. Res. Lett. 14, 044015. doi:10.1088/1748-9326/aaff7e
Greenough, G., McGeehin, M., Bernard, S. M., Trtanj, J., Riad, J., and Engelberg, D. (2001). The potential impacts of climate variability and change on health impacts of extreme weather events in the United States. Environ. Health Perspect. 109, 191–198. doi:10.2307/3435009
Hanlon, H. M., Hegerl, G. C., Tett, S. F. B., and Smith, D. M. (2013). Can a decadal forecasting system predict temperature extreme indices?[J]. J. Clim. 26, 3728–3744. doi:10.1175/jcli-d-12-00512.1
Hong, X., Lu, R., Chen, S., and Li, S. (2022). The relationship between the North atlantic oscillation and the Silk Road pattern in summer. J. Clim. 35 (20), 3091–3102. doi:10.1175/jcli-d-21-0833.1
Hong, X., Lu, R., and Li, S. (2017). Amplified summer warming in europe–west asia and Northeast asia after the mid-1990s. Environ. Res. Lett. 12, 094007. doi:10.1088/1748-9326/aa7909
Hu, T., Sun, Y., Zhang, X., Min, S. K., and Kim, Y. H. (2020). Human influence on frequency of temperature extremes. Environ. Res. Lett. 15 (6), 064014. doi:10.1088/1748-9326/ab8497
Ji, L., and Fan, K. (2019). Climate prediction of satellite-based spring eurasian vegetation index (NDVI) using coupled singular value decomposition (SVD) patterns. Remote Sens. 11, 2123. doi:10.3390/rs11182123
Jiang, D., Si, D., and Lang, X. (2020). Evaluation of east asian summer climate prediction from the CESM large-ensemble initialized decadal prediction project. J. Meteorological Res. 34, 252–263. doi:10.1007/s13351-020-9151-5
Lesk, C., Rowhani, P., and Ramankutty, N. (2016). Influence of extreme weather disasters on global crop production. Nature 529, 84–87. doi:10.1038/nature16467
Li, D., Zhou, T., Zou, L., Zhang, W., and Zhang, L. (2018). Extreme high-temperature events over East Asia in 1.5°c and 2°c warmer futures: Analysis of ncar cesm low-warming experiments. Geophys. Res. Lett. 45, 1541–1550. doi:10.1002/2017gl076753
Li, J., Fan, K., and Xu, Z. (2016). Links between the late wintertime North Atlantic Oscillation and springtime vegetation growth over Eurasia. Clim. Dyn. 46, 987–1000. doi:10.1007/s00382-015-2627-9
Li, J., Hao, X., Liao, H., Wang, Y., Cai, W., Li, K., et al. (2022). Winter particulate pollution severity in North China driven by atmospheric teleconnections. Nat. Geosci. 15, 349–355. doi:10.1038/s41561-022-00933-2
Liu, W., Chen, R., and Wen, Z. (2021). An interdecadal decrease in extreme heat days in August over Northeast China around the early 1990s. Atmos. Ocean. Sci. Lett. 14, 100001. doi:10.1016/j.aosl.2020.100001
Ma, W., Chen, G., Peings, Y., and Alviz, N. (2021). Atmospheric River response to arctic sea ice loss in the polar amplification model intercomparison project. Geophys. Res. Lett. 48, e2021GL094883. doi:10.1029/2021gl094883
Meehl, G. A., and Tebaldi, C. (2004). More intense, more frequent, and longer lasting heat waves in the 21st century. Science 305, 994–997. doi:10.1126/science.1098704
North, G. R., Bell, T. L., Cahalan, R. F., and Moeng, F. J. (1982). Sampling errors in the estimation of empirical orthogonal functions. Mon. Weather Rev. 110, 699–706. doi:10.1175/1520-0493(1982)110<0699:seiteo>2.0.co;2
Screen, J. A., and Simmonds, I. (2010). The central role of diminishing sea ice in recent Arctic temperature amplification. Nature 464, 1334–1337. doi:10.1038/nature09051
Si, D., and Ding, Y. (2016). Oceanic forcings of the interdecadal variability in east asian summer rainfall. J. Clim. 29, 7633–7649. doi:10.1175/jcli-d-15-0792.1
Smith, D. M., Screen, J. A., Deser, C., Cohen, J., Fyfe, J. C., Garcia-Serrano, J., et al. (2019). The polar amplification model intercomparison project (PAMIP) contribution to CMIP6: Investigating the causes and consequences of polar amplification. Geosci. Model. Dev. 12, 1139–1164. doi:10.5194/gmd-12-1139-2019
Smith, D. R., Eade, N. J., Dunstone, D., Fereday, D., Murphy, J. M., Pohlmann, H., et al. (2010). Skilful multi-year predictions of Atlantic hurricane frequency. Nat. Geosci. 3, 846–849. doi:10.1038/ngeo1004
Streffing, J., Semmler, T., Zampieri, L., and Jung, T. (2021). Response of northern Hemisphere weather and climate to arctic sea ice decline: Resolution independence in polar amplification model intercomparison project (PAMIP) simulations. J. Clim. 34, 8445–8457.
Sun, X., Li, S., Hong, X., and Lu, R. (2019). Simulated influence of the atlantic multidecadal oscillation on summer eurasian nonuniform warming since the mid-1990s. Adv. Atmos. Sci. 36, 811–822. doi:10.1007/s00376-019-8169-z
Takaya, K., and Nakamura, H. (2001). A formulation of a phase-independent wave-activity flux for stationary and migratory quasigeostrophic eddies on a zonally varying basic flow. J. Atmos. Sci. 58, 608–627. doi:10.1175/1520-0469(2001)058<0608:afoapi>2.0.co;2
Trenberth, K. E., Caron, J. M., and Stepaniak, D. P. (2001). The atmospheric energy budget and implications for surface fluxes and ocean heat transports. Clim. Dyn. 17, 259–276. doi:10.1007/pl00007927
Vautard, R., Christidis, N., Ciavarella, A., Alvarez-Castro, C., Bellprat, O., Christiansen, B., et al. (2019). Evaluation of the HadGEM3-A simulations in view of detection and attribution of human influence on extreme events in Europe. Clim. Dyn. 52, 1187–1210. doi:10.1007/s00382-018-4183-6
Wang, H. J., Sun, J. Q., Chen, H. P., Zhu, Y. L., Zhang, Y., Jiang, D. B., et al. (2012). Extreme climate in China: Facts, simulation and projection. Meteorol. Z. 21, 279–304. doi:10.1127/0941-2948/2012/0330
Webster, P. J. (1994). The role of hydrological processes in ocean-atmosphere interactions. Rev. Geophys. 32, 427–476. doi:10.1029/94rg01873
Wilks, D. S. (2011). Statistical methods in the atmospheric sciences. Cambridge, MA, USA: Academic Press.
Wu, B., and Francis, J. A. (2019). Summer arctic cold anomaly dynamically linked to east asian heat waves. J. Clim. 32 (4), 1137–1150. doi:10.1175/jcli-d-18-0370.1
Zhang, G., Zeng, G., Li, C., and Yang, X. (2020). Impact of PDO and AMO on interdecadal variability in extreme high temperatures in North China over the most recent 40-year period. Clim. Dyn. 54, 3003–3020. doi:10.1007/s00382-020-05155-z
Zhang, X., Hegerl, G., Zwiers, F. W., and Kenyon, J. (2005). Avoiding inhomogeneity in percentile-based indices of temperature extremes. J. Clim. 18, 1641–1651. doi:10.1175/jcli3366.1
Zhou, Y., and Wu, Z. (2016). Possible impacts of mega-el niño/southern oscillation and atlantic multidecadal oscillation on eurasian heatwave frequency variability. Q. J. R. Meteorological Soc. 142, 1647–1661. doi:10.1002/qj.2759
Keywords: northern Eurasia, extreme high temperature, decadal variation, North Atlantic, jet stream
Citation: Fan Y, Yao X, Zhou B, Li H and Liu M (2023) Decadal variation of the summer extreme high temperature days in northern Eurasia during 1960–2018. Front. Earth Sci. 10:1076396. doi: 10.3389/feart.2022.1076396
Received: 21 October 2022; Accepted: 08 December 2022;
Published: 09 January 2023.
Edited by:
Shangfeng Chen, Institute of Atmospheric Physics (CAS), ChinaReviewed by:
Shuoyi Ding, Fudan University, ChinaJing Ma, Nanjing University of Information Science and Technology, China
Jinling Piao, Chinese Academy of Sciences (CAS), China
Copyright © 2023 Fan, Yao, Zhou, Li and Liu. This is an open-access article distributed under the terms of the Creative Commons Attribution License (CC BY). The use, distribution or reproduction in other forums is permitted, provided the original author(s) and the copyright owner(s) are credited and that the original publication in this journal is cited, in accordance with accepted academic practice. No use, distribution or reproduction is permitted which does not comply with these terms.
*Correspondence: Botao Zhou, emhvdWJ0QG51aXN0LmVkdS5jbg==