 Xuejie Li
 Ruren Li1†
 Zongyao Sha
- 1School of Transportation and Geomatics Engineering, Shenyang Jianzhu University, Shenyang, China
- 2School of Remote Sensing Engineering, Wuhan University, Wuhan, China
In order to reveal the spatial variation characteristics and influencing factors of grassland net primary productivity (NPP) in China, this paper uses remote sensing data, land use data and meteorological data to simulate and estimate China’s grassland net primary productivity from 2001 to 2019 using the Carnegie-Ames-Stanford Approach (CASA). The trend analysis and complex correlation analysis were used to analyze the relationship with the temporal and spatial changes of grassland NPP from the perspectives of climate factors, topography, longitude and latitude. The results show that: 1) In the past 19 years, the China’s grassland NPP has generally shown a fluctuating upward trend, the spatial distribution of NPP variation shows a characteristic of low in the west and high in the east, with the increased area accounting for 70.39% of the total grassland area, and the low NPP values are mainly distributed in the northwestern part of Tibet and Qinghai and the central part of Inner Mongolia, the average annual NPP is 257.13 g C·m−2·a−1. 2) The change of mean NPP value of grassland in China is more dependent on precipitation (p) than air temperature (T). 3) Grassland NPP showed a decreasing trend with the increase of altitude, and the NPP on the gradient with DEM between 200 m and 500 m was the highest (483.86 g·C·m−2·a−1); The maximum annual mean value (448.42 g C·m−2·a−1) is fallen over the sharp slope of 35°–45°; the NPP of grassland increases with the slope (from shade to sunny), and the NPP of grassland on the semi-sunny slope increases. The annual average NPP is the highest (270.87 g C·m−2·a−1). 4) The mean value of grassland NPP was negatively correlated with the change of latitude, and showed a “wave-like” downward trend from south to north; the mean value of grassland NPP was positively related to the change of longitude. The correlation relationship shows a “stepped” upward trend from west to east.
1 Introduction
In the context of global climate change, studying the carbon sequestration potential of terrestrial ecosystems is not only an important indicator for estimating the Earth’s supporting capacity, but also helps to understand the global carbon balance and evaluate the sustainable development of terrestrial ecosystems (Christopher et al., 1998; Carraro and Massetti, 2011; Shen et al., 2016; Chen et al., 2017; Li et al., 2020).Grassland ecosystem is one of the most important and widely distributed ecosystem types in terrestrial ecosystems, and it is also one of the most important carbon stocks and carbon sources/sinks on land. China’s grasslands cover almost 41.17% of national territorial area, it accounts for 6%–8% of the total grassland area in the world, and plays a pivotal role in the global carbon cycle and climate regulation, and plays an important role in developing animal husbandry, maintaining biodiversity, conserving soil and water, and maintaining ecosystem balance (Xie et al., 2001; Yang et al., 2012; Li et al., 2014; Tang et al., 2014; Xu et al., 2020). Therefore, estimating the carbon sequestration potential of the net primary productivity of grassland ecosystems correctly in China is of great significance for studying the carbon cycle of terrestrial ecosystems and regulating global climate change (Piao et al., 2004). However, current research on carbon storage and sequestration in grassland ecosystems is relatively one-sided in terms of its influencing factors, while studies on topography, latitude and longitude are still relatively weak. Therefore, it is quite essential to carry out in-depth research on the carbon sequestration potential of grassland ecosystems, so as to enhance the scientific understanding of the carbon sequestration potential of grasslands in global climate change and ecosystem management.
NPP is the amount of organic matter accumulated by green plants in unit area and unit time through photosynthesis (Fang et al., 2001; Xu et al., 2020), That is, the NPP of grassland is the most direct indicator to reflect the growth characteristics and health status of grassland ecosystems, and it is also an important ecological indicator for the sustainable development of ecosystems (Zhao et al., 2014; Du et al., 2021). Accurate estimation of NPP and analysis of its spatial distribution and influencing factors are helpful to understand the response state of ecosystems in the context of global climate change (Chen et al., 2022), It is of great significance to further clarify the carbon sequestration potential of grassland ecosystems in China, and also to provide a scientific reference for the carbon cycle characteristics of terrestrial ecosystems in the context of global climate change. Mastering the interannual variation rule of grassland NPP, analyzing and researching the relationship between index NPP, water and heat factors, and geographical elements has important theoretical and practical value for evaluating the environmental quality of terrestrial ecosystems, regulating ecological processes, and estimating terrestrial carbon sinks (Niu, 2000; Hou et al., 2007; Wang et al., 2016; Liu et al., 2019).
This paper depends on the grassland distribution data in China, combined with the remote sensing data and meteorological data of the same period, and calculates various grassland NPPs based on the CASA model, and uses trend analysis, correlation analysis and other methods to explore the change trend of grassland NPP in China from 2001 to 2019. Its spatial distribution characteristics and influencing factors aim to provide a scientific reference for the research on dynamic changes of grassland ecosystem functions, ecological environmental protection, soil and water conservation, and climate regulation in China.
2 Materials and methods
2.1 Study area
The study area covers only 22 provinces, 5 autonomous regions and four municipalities directly under the Central Government in China. Which are: Beijing (BJ), tianjin (TJ), hebei (HB) , shanxi (SX), Inner Mongolia (IML), liaoning (LN), jilin (JL), heilongjiang (HLJ), Shanghai (SH), jiangsu (JS), zhejiang (ZJ), anhui (AH), fujian (FJ), jiangxi (JX), shandong (SD), henan (HN), hubei (HB), hunan (HN), guangdong (GD), guangxi (GX), hainan (HN), sichuan (SC), guizhou (GZ), yunnan (YN), chongqing (CQ) , Tibet (TB), shaanxi (SAX), gansu (GS), qinghai (QH), ningxia (NX), xinjiang (XJ) (Figure 1A). China is located in the east of Asia and on the west coast of the Pacific Ocean (Wang et al., 2022) Most parts temperate, a few tropical, no cold zone. The terrain of China is high in the west and low in the east, with a stepped distribution. The terrain is diverse, mainly dominated by plateaus and mountains, crisscrossed by mountains.There are the Qinghai-Tibet Plateau with an average altitude of more than 4 km, basins and plateau regions with an average altitude of 1-2 km, and hills with an altitude of less than 500 m. Due to China’s vast territory, wide latitude, quite different distance from the sea, various terrain types and mountain trends, the combination of temperature and precipitation is diverse, forming a complex and diverse climate. There are all kinds of monsoon climate, temperate continental climate, alpine climate. Winter is cold and dry, summer is warm and rainy. Grassland resources in China are of large area, wide distribution, various types and miscellaneous, and of low quality. Grassland resources are distributed in all provinces, regions and cities, and the concentrated contiguous grassland is mainly distributed in the Qinghai-Tibet Plateau, the arid and semi-arid areas in the north and the grassy hills and slopes in the south. It is precisely under such complex and changeable natural resource conditions that China’s vegetation is rich in species, its distribution is intricate, and the stability of the ecological environment is affected by many factors.
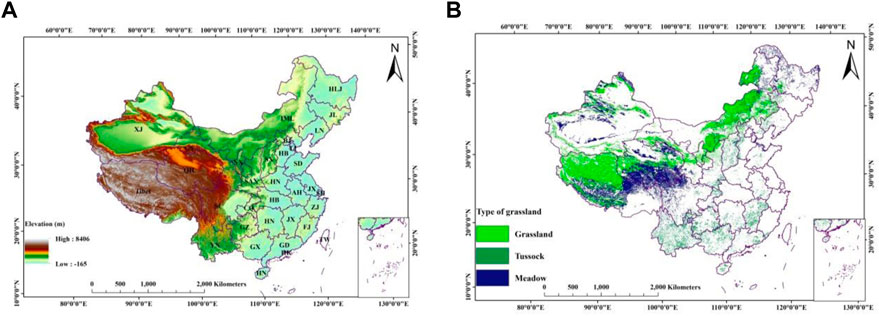
FIGURE 1. (A) Elevation chart of China (excluding Hong Kong, Macao and Taiwan). (B) Spatial distribution characteristics of grassland types in China.
2.2 Data source
The remote sensing data comes from the MODIS data of the National Aeronautics and Space Administration (NASA) (Li et al., 2021). The time series is from 2001 to 2019, and the remote sensing data used include MOD13A2 data (NDVI), MOD17A3HFG data (NPP), and elevation data (DEM) from the Geospatial Data Cloud (Table 1). The meteorological data (contains latitude and longitude) of total solar radiation, monthly average temperature, and monthly precipitation are derived from the monthly data set of China’s surface climate data provided by the China Meteorological Science Data Sharing Service Network (http://cdc.cma.gov.cn). The vegetation type data comes from the 1:1,000,000 Chinese Vegetation Type Atlas by the Data Center of Resource and Environmental Sciences (https://www.resdc.cn/), Chinese Academy of Sciences. The vegetation classification atlas contains 11 vegetation type groups, the distribution status of 796 vegetation units in 54 vegetation types, and the horizontal regional and vertical regional distribution rules. According to this vegetation atlas, grassland includes three vegetation types: meadow, tussock and grassland (Figure 1B). These three vegetation types account for 30.82% of the vegetation area in China.
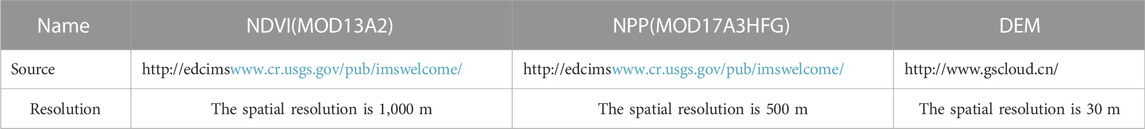
TABLE 1. Data source statistical table.
The 2001–2012 the field measurement data of a small part of grassland were obtained from A Global Database of Soil Respiration Data, Version 5.0 (https://daac.ornl.gov/cgi-bin/dsviewer.pl?ds_id=1827). These data will be uniformly processed into raster data with a resolution of 1,000 m through ArcGIS 10.2.
2.3 NPP simulation and results validation
In this study, the improved CASA model of Zhu Wenquan et al. was used to simulate the grassland NPP in China (Zhu et al., 2007). The NPP in this model is mainly determined by the photosynthetically active radiation (APAR) absorbed by the vegetation and the actual light energy utilization rate (ε). The specific calculation formula is as follows:
where NPP(
Where: SOL (
Light utilization efficiency (ε) refers to the efficiency with which vegetation converts its absorbed photosynthetically active radiation (PAR) into organic carbon, which is mainly affected by temperature and moisture, and is calculated as follows:
Where: T1 (x, t) and T2 (x, t) represent the effect of temperature on the utilization of light energy. For the detail calculation method, see the literature (Zhu et al., 2005; Wang et al., 2022); W (
Since the actual measurement of NPP is difficult to achieve, this paper uses the MOD17A3HFG data (NPP) and field measured data obtained by other research scholars to compare and verify the NPP estimation results. The statistical results are as follows: MODIS-Measured has a strong correlation with an adjusted R2 of 0.638 (Figure 2A); CASA-Measured has a strong correlation with an adjusted R2 of 0.812 (Figure 2B). The above verification results show that the CASA model is suitable for the estimation and simulation of grassland NPP in China.
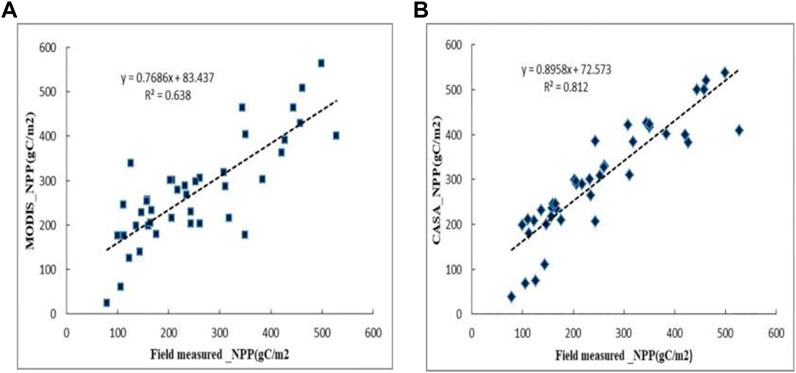
FIGURE 2. Simulation verification results of MODIS-Measured (A), CASA-Measured (B).
2.4 Trend analysis of NPP
In this paper, the univariate linear regression method is used to analyze the trend changes of the annual average NPP, annual precipitation and annual average temperature of each pixel of grassland in China from 2001 to 2019. The calculation principles are as follows (Li et al., 2011; Jin et al., 2020):
Where
Where
2.5 Correlation analysis
Correlation analysis is used to reflect the direction and degree of correlation between elements. In this paper, the Pearson correlation coefficient, partial correlation coefficient, and complex correlation coefficient method are used to analyze the correlation and significance level of annual vegetation NPP with temperature and precipitation. The calculation principles are as follows (Murakami et al., 2004; Dowding and Haufe, 2018; Li et al., 2019; Xie et al., 2020):
where:
Partial correlation coefficient calculation formula:
Where
where
The formula for calculating the complex correlation coefficient:
where
2.6 Quantitative evaluation of the contribution of precipitation and temperature to NPP
Traditionally, an increase in NPP has been used as an indicator of vegetation restoration, whereas a decrease in NPP represents vegetation degradation (Yan et al., 2019). Based on Eq. 4, a positive
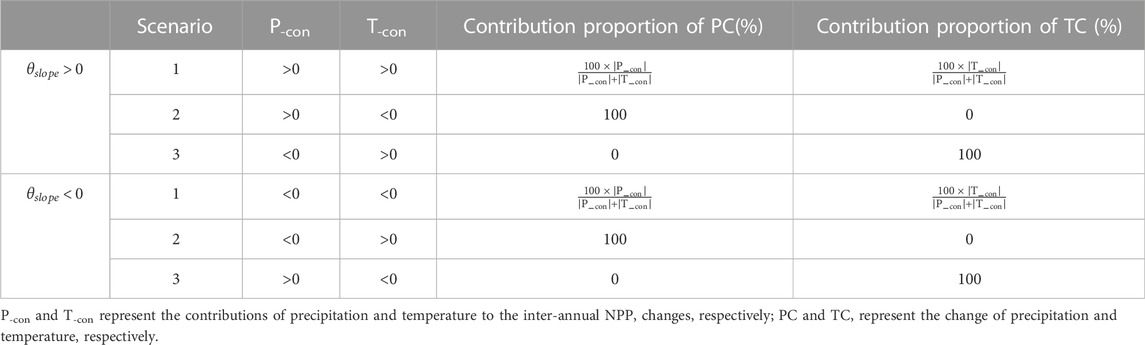
TABLE 2. Six scenarios for quantifying the contribution proportions of p and T to grassland restoration and degradation.
In this study, when the contribution proportion of PC to grassland restoration or degradation was larger than that of TC, it was defined as “climate-dominated restoration or degradation”. Similarly, when the contribution proportion of TC to grassland restoration or degradation was greater than that of PC, it was defined as “human-dominated restoration or degradation”.
3 Results and analysis
3.1 Spatial and temporal distribution characteristics of grassland NPP in China
3.1.1 Time-varying characteristics
The average NPP value of grassland in China from 2001 to 2019 was 257.13 g·C·m−2·a−1. Based on the literature, the results of this study are similar to those obtained by many scholars, but there are also some differences, which may be caused by different grassland classification standards, data sources and research periods. Overall, the interannual change of grassland NPP showed a fluctuating upward trend, and the linear growth trend reached a significant level (p < 0.01), with an average change rate of 2.69. g·C·m−2·a−1 (Figure 3).
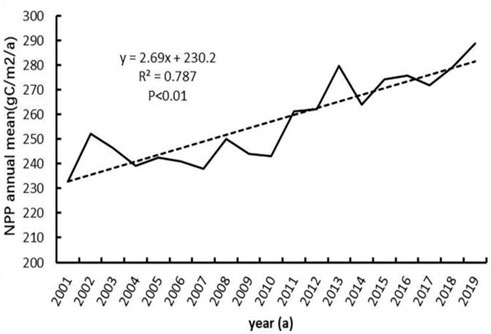
FIGURE 3. Interannual variation of grassland NPP in China (excluding Hong Kong, Macao and Taiwan) from 2001 to 2019.
Statistics on the NPP values of grassland types (meadow, tussock and grassland) in China (excluding Hong Kong, Macao and Taiwan regions) in the past 20 years show that the results (Figure 4) show that the interannual variation trends of average NPP of different grassland types are also quite different: In the 19 years , the NPP values of grassland and tussock all showed an increasing trend, and the change rates were 2.32 and 10.35 g·C·m−2·a−1 respectively , accounting for 52.45% and 10.89% of the total grassland area respectively. THowever, the overall increase trend of meadow from 2001 to 2019 was not obvious, with a change rate of 0.999 g·C·m−2·a−1, accounting for 36.66% of the total grassland area. The causes of this phenomenon may be closely related to overgrazing, precipitation, total solar radiation, temperature and human activities.
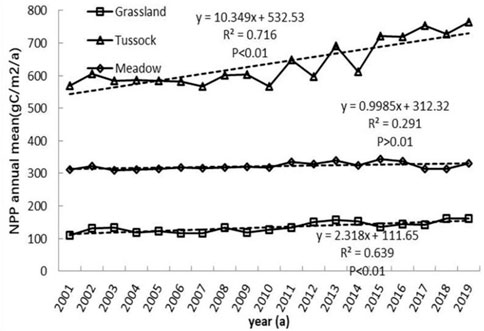
FIGURE 4. Interannual variation trend of NPP of different grassland types from 2001 to 2019.
3.1.2 Spatial distribution characteristics
From 2001 to 2019, the distribution of grassland NPP in China had obvious spatial heterogeneity, and the overall trend showed a downward trend from the southeast to the northwest (Figure 5). Among them, the areas with NPP greater than 600 g·C·m−2·a−1 are concentrated in the border areas of QH and SC as well as YN and GX. The grassland types of the region are mainly tussock and meadow, accounting for 11% of the total grassland area. The areas with NPP concentrations of 400–600 g·C·m−2·a−1 are mainly distributed in the east of QH Province, the northeastern of IML and HLJ and southern region. In some areas, meadows are widely distributed, accounting for 18.51% of the total grassland area, and the average NPP value is relatively high. The areas with NPP concentrations of 400–600 g·C·m−2·a−1 are mainly distributed in the IML, NX, QH and the southeastern of Tibet, and a small part is also distributed in the northern part of SAX and SX accounts for 19.05% of the total grassland area. The grassland NPP values below 100 g·C·m−2·a−1 are mainly concentrated in the northern part of Tibet, the northwestern GS Province, central IML. In the region, the grassland vegetation type is mainly grassland, accounting for 36.23% of the total grassland area, and the vegetation NPP value is relatively low. The NPP values of other grasslands were mainly distributed in 100–200 g·C·m−2·a−1, the distribution is scattered and mainly distributed in the northwest of China , accounting for 15.21% of the total grassland area. All in all, the average NPP values of tussock and meadow were higher, up to 636.02 and 322.3 g·C·m−2·a−1 respectively, and the area proportions were 10.89% and 36.66% respectively. The lowest average NPP value of grassland was only 134.83 g·C·m−2·a−1, accounting for 52.45% of the area.
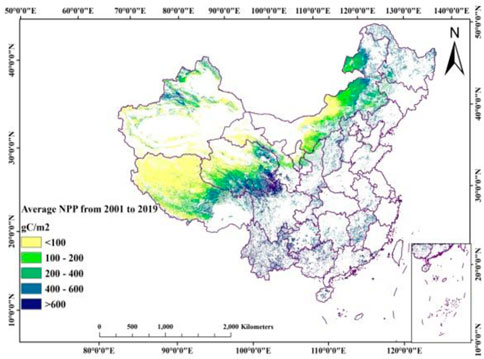
FIGURE 5. Spatial distribution characteristics of mean NPP of grassland in China (excluding Hong Kong, Macao and Taiwan) from 2001 to 2019.
In order to study the variation trend of grassland NPP in China quantitatively, the spatial variation of grassland NPP from 2001 to 2019 was divided into six levels (Figure 6). On the whole, the spatial variation characteristics show a low west-east distribution, with the increased area accounting for 70.39% of the total grassland area, the grassland NPP in most areas is increasing, and the change value of the increase area is about 0∼50 g·C·m−2·a−1, and the change value of the decrease area is 0∼49 g·C·m−2·a−1 or so. It can be seen from statistical calculations that the areas with extremely significant increase and significant increase account for 27.85% and 9.64% of the total grassland area respectively, and they are mainly distributed in Inner Mongolia, Ningxia, Gansu, Shaanxi, Shanxi, northern Hebei and central Qinghai in China. The significantly reduced and non-significantly reduced areas accounted for 7.14% and 22.47% of the total grassland area, mainly in Tibet, Qinghai, Sichuan and Xinjiang.
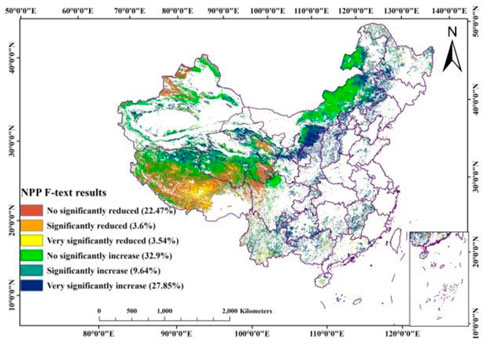
FIGURE 6. Variation trend and significance test of grassland NPP in China.
3.2 The relationship between the spatiotemporal distribution of NPP and climate parameters
On the whole, the precipitation and air temperature in the grassland area in China from 2001 to 2019 showed an increasing trend, and the trend change rates were 2.7 and 0.02 g·C·m−2·a−1 respectively (Figure 7). According to the relationship between the annual average temperature and annual precipitation and NPP in the corresponding period of statistics, the inter-annual fluctuation of grassland NPP in China from 2001 to 2019 was mainly affected by precipitation, and the change of NPP was roughly consistent with the trend of precipitation. It is 5,694.74 mm, and the corresponding NPP value is reaching 275.677 g·C·m−2, which is related to the extremely abnormal precipitation in 2016, compared with other in 2016 and 2014, the precipitation was significantly higher, and the increase in precipitation accumulation led to an increase in NPP, on a relative basis, the NPP was high, second only to 2019, which made the NPP value in 2016 and 2014 increase compared with other years. The variation trend of NPP is opposite to that of temperature, but the influence of temperature on NPP is smaller than that of annual precipitation, and the regularity of the relationship between temperature and NPP is obviously weaker than that of precipitation and NPP.
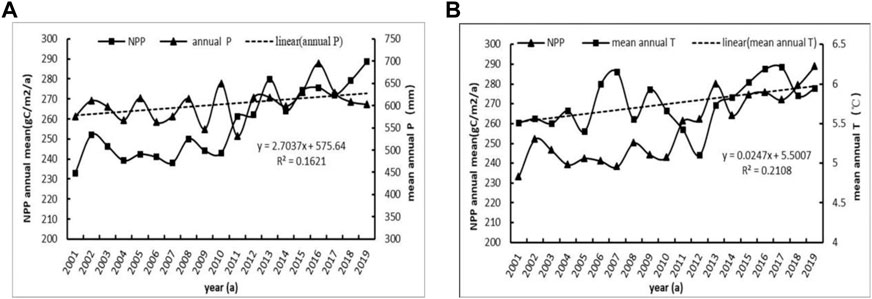
FIGURE 7. The relationship between NPP and annual precipitation (A), annual mean temperature (B) of grassland in China from 2001 to 2019.
It can be seen from Figures 8A–D that the correlation coefficient between NPP and the average annual precipitation is between −0.891 and 0.964, and the average correlation coefficient is 0.073. Among them, the negatively correlated areas accounted for 18.04% of the total grassland area, mainly distributed in southern QH Province, northwestern SC Province and YN. The reason may be that the area belongs to the cold and wet environment, which inhibits the growth of vegetation. The positively correlated areas were mainly distributed in the northern part of Northeast China, the southern part of Qinghai-Tibet region and the northern part of Xinjiang, and the positively correlated areas accounted for 81.96% of the total grassland area. Overall, grassland NPP was positively correlated with annual precipitation, that is, precipitation would promote the increase of grassland NPP to a certain extent. There was a positive correlation between NPP and annual mean temperature as a whole. The correlation coefficient was between −0.864 and 0.894, and the average correlation coefficient was 0.03. The areas with no significant correlation between the two accounted for 32.13% of the total grassland area. The 0.83% of the regional NPP was significantly positively correlated with temperature, the distribution is wide, not concentrated, and the spatial heterogeneity is obvious.
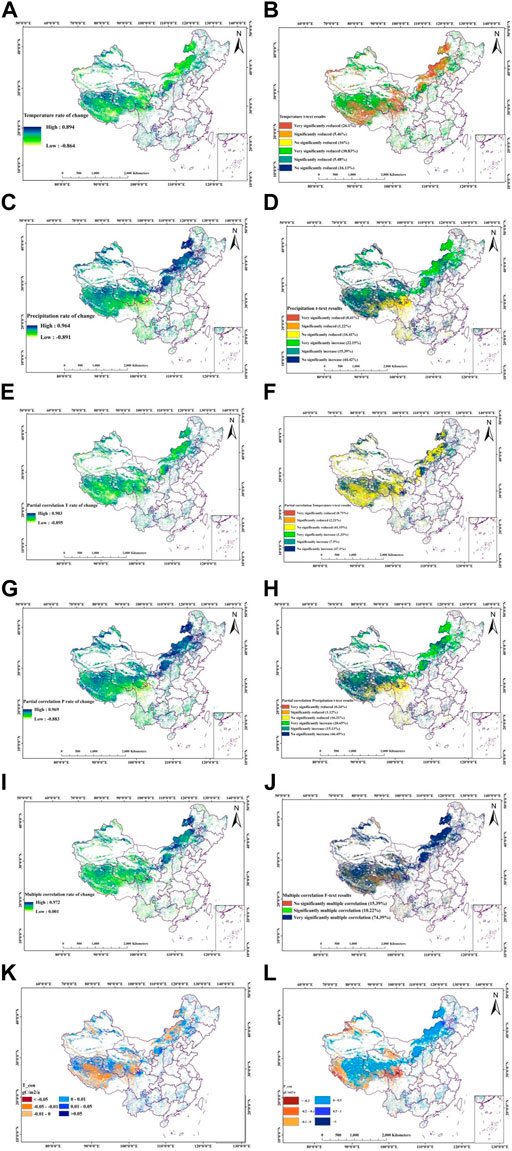
FIGURE 8. Spatial changes of annual temperature (A), average annual precipitation (C), partial annual temperature (E), partial annual precipitation (G), and multiple correlation (I) and Spatial variation trends in annual temperature (B), annual mean precipitation (D), partial annual temperature (F), partial annual precipitation (H), multiple correlation (J) of grasslands in China during 2001–2019. Spatial distributions of the contributions of (K) temperature (T_con) and (L) precipitation (P_con) to grassland NPP changes.
It can be seen from Figures 8E–H that the mean partial correlation coefficients between NPP and precipitation and temperature are 0.086 and 0.008 respectively, and the positive correlation areas passing the significance test are 35.78% and 8.83% respectively. It shows that when only considering the influence of temperature on NPP, compared with the correlation between temperature and NPP under the influence of precipitation, the change of NPP has a weaker correlation with temperature. There is still a strong correlation between NPP and precipitation. The main reason is that the increase in precipitation improves soil water supply conditions, enhances the photosynthetic rate, and thus improves productivity. At the same time, the lower temperature in the plateau and mountainous areas can reduce evapotranspiration, thereby reducing the possibility of evapotranspiration.
The use of water loss is conducive to vegetation growth. It can be seen from Figures 8I,J that the composite correlation coefficient between grassland NPP and temperature-precipitation in China is between 0.001 and 0.972, showing a spatial pattern of higher in the north and lower in the middle. The areas with multiple correlation coefficients higher than 0.5 are distributed mainly in the northeastern and central northern Inner Mongolia, central and northern Ningxia, and northwestern Tibet in China. The regional distribution of the multiple correlation coefficients between 0.45 and 0.5 is mainly in the northeastern Inner Mongolia, the northwestern and central Qinghai-Tibet regions, and the northwestern Xinjiang. The multiple correlation coefficients of the remaining areas are relatively small, probably because these areas have lower relative altitudes, more abundant water content, and higher temperatures, so they are less affected by the comprehensive regulation of temperature and precipitation.The partial correlation coefficient can describe the degree of correlation between grassland NPP and climatic factors, whereas the contributions of climatic factors to grassland NPP changes cannot be quantified. Therefore, to quantitatively evaluate the contributions of climatic factors to NPP changes, the results of Tem_con, Pre_con, and Rad_con are shown in Figures 8K,L. It is clear from the contribution distribution map that precipitation has a greater impact than temperature, so it can be concluded that precipitation has a more obvious interaction on grassland productivity. This paper only considers precipitation and temperature, and there are many other factors that need to be explored more comprehensively.
3.3 The relationship between the spatiotemporal distribution of NPP and terrain
According to statistics, the annual average NPP value of grassland in China from 2001 to 2019 showed different characteristics with the increase of altitude (Figure 9A): the overall trend showed a downward trend, and the grassland was mainly distributed in the plateau area. Among them, the maximum annual mean value of grassland NPP (483.86 g·C·m−2·a−1) was concentrated in the hilly area with an altitude of 200–500 m, accounting for 5.12% of the total grassland area. With the increase of altitude, the average NPP value of grassland is in a trend of first increasing and then decreasing. In the plain area below 200 m, the annual average NPP value of grassland has a gentle downward trend, and its value is 464 g·C·m−2· a−1, when the altitude is in the range of 500–2000 m, the annual mean value of grassland NPP (316.49 g·C·m−2·a−1) has an obvious downward trend. When the altitude downward again to the plateau area above 2000 m, the change is that the average annual NPP value of grassland was 204.29 g·C·m−2·a−1. The hills and plains with an altitude of less than 500 m accounted for the least proportion of grassland, but with the increase of altitude, the proportion to the total grassland increased gradually. Therefore, it can be concluded that different levels of elevation also have a certain impact on the carbon sequestration potential of grassland in China. The annual average NPP value of grassland in China shows the characteristics with different slope aspects (Figure 9B): from shady to sunny, the overall trend is increasing, and the annual average value of grassland NPP on the semi-sunny slope is the highest at 270.87 g·C·m−2·a−1, followed by semi-shady slopes (265.68 g·C·m−2·a−1), sunny slopes (245.36 g·C·m−2·a−1), shady slopes (244.63 g·C·m−2·a−1), the lowest is the flat area with no slope aspect (223.38 g·C·m−2·a−1), while the semi-shady slope covers the largest area, accounting for 38.09% of the total grassland area, and The region of flat area without slope aspect has the smallest proportion (0.44%). Shady slopes have a larger proportion than sunny slopes, but the NPP values are opposite, indicating that grasslands prefer to grow on the sunny side. Therefore, different slope aspects also have an impact on the carbon sequestration potential of grassland. The research conclusion shows that the NPP of the grassland on the flat areas is the last but one, its area is the largest, accounting for 75.6868% of the total area of grassland, tens of thousands of times of the area of steep slope, but the NPP value is only about half of the steep slope, its carbon sequestration effect is not good enough, there is still a lot of room for improvement, need to strengthen the protection.The annual mean NPP value of grassland in China shows the characteristics with the increase of slope (Figure 9C): the overall trend is decreasing, mainly distributed in flat and gentle slopes, and a small part in slopes, steep slopes, sharp slopes and dangerous slopes. Among them, the maximum value of grassland NPP (448.42 g·C·m−2·a−1) is in the sharp slope of 35°–45°, the second is the steep slope (417.33 g·C·m-2·A-1). From the flat to the slope, the NPP value is in a state of continuous increase, with good carbon sequestration effect, but there is a lot of room for improvement, and the minimum value (87.65 g·C·m−2·a−1) is greater than 45° on the dangerous slope. With the increase of the slope, the change of NPP is in the trend of increase first and then decrease, and the slope below 45° has been in the trend of gradual increase, and then with the increase of the slope, the NPP begins to decrease obviously. These changes are due to different soil and water conservation at different slopes, resulting in different soil fertility and drainage performance, so there are certain differences in the carbon sequestration capacity of grasslands at different slopes.
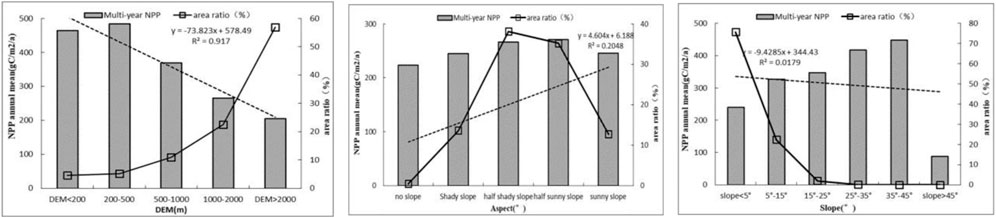
FIGURE 9. Relationship between topographic factors and grassland NPP. (A) Changes in the relationship between annual NPP and DEM. (B) Changes in the relationship between annual NPP and Aspect. (C) Changes in the relationship between annual NPP and Slope.
3.4 The relationship between NPP spatiotemporal distribution in latitude and longitude
From the perspective of zonal variation (Figure 10A), the average NPP value of grassland in China from 2001 to 2019 was 374.58 g·C·m−2·a−1. In general, the average NPP value of grassland in China within 19 years was negatively correlated with the latitude change. The distribution of the average NPP value in China showed obvious latitude zonality, and it showed a “wave-like” downward trend from south to north, and the change rate was 11.14 g·C/(m2·a·10°), and through the p > 0.05 significance level test, the downward trend is obvious. Among them, the maximum average NPP value is 1,057.79 g·C·m−2·a−1, which is distributed in the southern region with a latitude of 16° or so, which may be due to the abundant precipitation, suitable climate, and relatively good soil water and soil conservation in this region, which is more conducive to the growth of vegetation, thereby enhancing the carbon sequestration capacity of grassland. The lowest NPP is 5.69 g·C·m−2·a−1, which is distributed in the central area between 31–32° latitude. The NPP value in this area is generally low, which may be due to the relatively aridity in this area, which affects vegetation growth, further leading to grassland carbon sequestration potential.
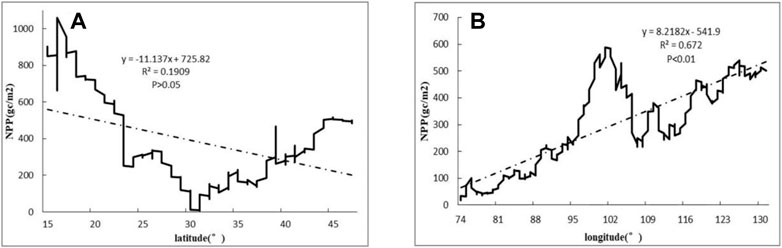
FIGURE 10. (A) Changes in the relationship between annual NPP and lattitude. (B) Changes in the relationship between annual NPP and longtitude.
From the perspective of the meridional variation rule (Figure 10B), the average NPP value of grassland in China from 2001 to 2019 was 296.56 g·C·m−2·a−1. In 2019, the mean NPP value of grassland in China was positively correlated with the change of longitude. The distribution of mean NPP value showed obvious longitude zonality, rising in a “stepped” manner from west to east, and the change rate was 8.22 g·C/(m2·a·10°), and through the p < 0.01 significance level test, the upward trend is obvious. Among them, the maximum average NPP value is 588.09 g·C·m−2·a−1, which is mainly distributed in the central region with longitude of 101–102°. It may be due to the abundant precipitation and suitable climate in this region, which is more conducive to the growth of vegetation, thus enhancing the carbon sequestration capacity of grassland. The lowest NPP is 17.02 g·C·m−2·a−1, which is distributed in the western desert area with a longitude of about 74°. The NPP value in this area is generally low, which may be due to the relatively low precipitation and high temperature in this area. It is difficult for vegetation to grow in arid and high temperature areas, which reduces the carbon sequestration potential of grassland. These changes are caused by the differences in the geographical environment and soil and water conservation at different latitudes and longitudes. Different environments will cause different growth conditions of vegetation, and different soil and water conservation will lead to different soil fertility and drainage performance. Therefore, there are also certain differences in the carbon sequestration capacity of grassland with different latitudes and longitudes.
4 Discussion
In this study, the NPP of grassland in China was simulated and estimated based on the CASA model, and the spatial and temporal distribution characteristics and influencing factors of grassland NPP in China were comprehensively analyzed using trend analysis and complex correlation analysis, and the impact of climate change and influencing factors on vegetation NPP was discussed. The results show that from 2001 to 2019, China’s grassland NPP showed a decreasing trend from southeast to northwest. The vegetation coverage is also different, and the ecological structure stability of each region is also different. The results in this paper are similar to those obtained by Shen et al. (2016) based on the literature data that the NPP of natural grassland in China is 89–320 g·C·m−2·a−1. Zhou Wei et al., Zhu Wenquan, Gao et al. (2012) used the CASA model to estimate the annual average of grassland NPP per unit area in China to be 282.0, 231, and 217.90 g·C·m−2·a−1 respectively. The estimated results are similar, indicating that the results of this study have reference value.
From the impact of climate change on grassland NPP, this study shows that precipitation and temperature in the past 19 years have played an important role in promoting grassland NPP, but there are certain differences in the dominant factors in different sub-regions. Among them, grassland NPP is more dependent on precipitation than air temperature. This study reveals that precipitation plays an important role in promoting vegetation growth, which is consistent with the findings of most researchers (Liu et al., 2019). In addition, while precipitation and air temperature promote vegetation growth, they also increase the dark respiration rate of vegetation, resulting in a decrease in NPP. Therefore, precipitation and air temperature can promote grassland NPP at a certain threshold, but may have opposite effects when exceeding a certain limit (He, 2008).
From the impact of terrain factors on grassland NPP, altitude, slope and slope aspect have obvious differentiation effects on temperature and precipitation, which will lead to large differences in regional illumination, soil moisture and nutrients, thus affecting regional vegetation spatial pattern. In addition, the flow and conversion of surface materials and energy at different altitude gradients, slopes and slopes are also the main influencing factors that limit the spatial distribution of vegetation (Pan et al., 2009; You et al., 2011). This study found that grassland NPP generally decreased with the increase of altitude, and there were great differences in the fluctuation trend of grassland NPP in each altitude gradient. In terms of slope, the NPP of the grass on the steep slope is the highest, while that on the dangerous slope is the lowest. The reason for the analysis is that the steep slope has better soil and water conservation, resulting in fertile soil and good drainage, which are beneficial to the growth of plants; on the contrary, the steep slope is opposite and the vegetation coverage is low, resulting in a low carbon sequestration potential. In terms of slope aspect, there is no obvious regularity in the response characteristics of grassland NPP changes to temperature and precipitation on different slope aspect gradients. The solar radiation received by the surface and the potential evapotranspiration are different (Soltani et al., 2016). The sunny slope is full of sunlight, but the high temperature will lead to accelerated soil water evapotranspiration, which will inhibit the growth of vegetation; the shady slope is full of moisture, but the temperature and light are relatively weak, which will also inhibit the photosynthesis of vegetation, so the growth of vegetation on different slopes tends to be different from that of vegetation. The biological uniqueness of each vegetation type has a great relationship (Wang et al., 2016).
From the perspective of the influence of latitude and longitude on grassland NPP, latitude/longitude not only reflects water/heat differentiation across the globe but also indicates lots of other influential factors. It argues that many other factors, including Sun shine hours, atmospheric circulation, soil nutrition are closely related to latitude/longitude belts. Although this study cannot cover all the influnce factors but analyzed the changes of NPP along latitude/longitude belts. And the changes in different latitude and longitude will also lead to the changes in environmental temperature, humidity, topography, soil and many other environmental factors, which will affect the growth of vegetation, and then affect the carbon sequestration potential of vegetation. This study found that, in terms of latitude, grassland NPP showed a “wave-like” decline trend from south to north. The grassland NPP is higher in the southern regions of low latitudes. It is due to sufficient precipitation, suitable climate, relatively good soil water and soil conservation, which is more conducive to the growth of vegetation, thus enhancing the carbon sequestration capacity of grassland. In terms of longitude, grassland NPP showed a “step-like” upward trend from west to east (Wang et al., 2022). Grasslands in the central region have higher NPP. The reason analysis shows that the area has excellent water and heat conditions, flat terrain, sufficient sunlight, high vegetation coverage, good soil and water conservation, which promotes vegetation growth and enhances the ability of vegetation to sequester carbon.
China’s grassland covers nearly 40% of its total area, which is larger than the forest area, but its productivity is lower than the global average. Research on temporal and spatial changes and influencing factors can better understand the occurrence and development trend of vegetation productivity, which is helpful for the assessment of future climate change and national two-carbon strategy. In terms of grassland management, it can be seen from the conclusions of this paper that grassland productivity increases or decreases rapidly in some areas. Therefore, it can be started from this perspective to protect the basic area of grassland industry and improve the grassland quality and growth environment. In areas where there has been a decrease or no significant increase, it is important to strengthen conservation efforts and promote a grassland culture to further contribute to grassland carbon sequestration potential. By studying the influence of potential factors, it is possible, on the one hand, to gain a more comprehensive understanding of the measures that are conducive to adjusting the growth and development of vegetation and enhancing its carbon sequestration capacity. On the other hand, it can also help to improve the intensity of overgrazing and the implementation of policies such as the return of cropland to grass, adding to the improvement of urban sprawl and the enhancement of carbon sequestration potential. In addition, it is an important guide for the development of policies and management of grassland resources by grassland management departments.
Although this study provided a comprehensive analysis of NPP changes and climate effects in grasslands of China, there may still be some limitations. First, owing to the uncertainty of satellite remote sensing data, NPP data could contain some inaccuracies which may affect the results of this study. Second, the interpolation method of meteorological data in this study may lead to some inaccuracy in meteorological results, which could have an impact on the analysis of the results of this study. In addition, many factors influence vegetation growth in China’s grassland.This study only considered three influence factors, geographic location, terrain and climate, and the relationships of grassland NPP with other environmental factors need to be further explored. Finally, changes in NPP are affected by multiple factors, such as terrain, climate change and human activities. Although this study extracted unchanged grassland, the influences of human activities on grassland vegetation could not be completely excluded. In addition, the results of this study are not verified by field measured data (Ma et al., 2022). In terms of grassland management, corresponding suggestions can be put forward according to the rate of increase or decrease of grassland productivity in some areas. For example, in areas with rapid increase of NPP, the management and protection efforts should be improved. In areas with low slope or no significant increase of NPP, the protection efforts should be strengthened to improve grassland quality and growth environment, protect the basic area of grassland industry and promote grassland culture. This further contributes to grassland carbon sequestration potential. Therefore, in future studies, the effects of human activities on grasslands and the inaccuracies caused by the measurement of satellite remote sensing data should be further studied.
5 Conclusion
In the past 19 years, China’s grassland NPP has generally shown a fluctuating upward trend, and its spatial distribution has gradually decreased from southeast to northwest. The relationship between the spatiotemporal distribution of grassland NPP and climate change in China from 2001 to 2019: The spatial distribution of the first-order partial correlation and general correlation between grassland NPP and precipitation and temperature are: the area ratio of partial correlation with precipitation is greater than the area proportion with partial correlation with temperature. The relationship between temporal and spatial distribution of grassland NPP and terrain in China from 2001 to 2019: With the increase of altitude, there is a general downward trend, and grassland is distributed mainly in the plateau area. The variation of NPP at different altitudes (DEM) presents: hill>plain>mountain>basin>plateau. The variation of NPP with different slope aspects is as follows: semi-sunny slope>semi-shady slope>sunny slope>shady slope>no slope aspect. With the increase of the slope, the overall trend is decreasing, the variation of NPP with different slopes showed: sharp slope>steep slope>slope> gentle slope>flat>dangerous slope. The relationship between temporal and spatial distribution of grassland NPP in China from 2001 to 2019 and latitude and longitude: From the perspective of zonal variation, the mean value of NPP showed a “wave-like” downward trend from south to north. From the perspective of the meridional variation rule, the mean NPP shows a “step-like” rising trend from west to east.
Data availability statement
The original contributions presented in the study are included in the article/supplementary material, further inquiries can be directed to the corresponding author.
Author contributions
ZS conceptualized this study. XL and RL carried out the data analysis and composed the manuscript. All authors have read and agreed to the published version of this manuscript.
Funding
This work was supported in part by the National Natural Science Foundation of China (Nos. 41871296 and 42171447) and the Key Laboratory of Natural Resources Monitoring in Tropical and Subtropical Area of South China, Ministry of Natural Resources (No. 2022NRM006).
Acknowledgments
We acknowledge the support of all co-authors for their constructive and helpful comments and the organization of this study.
Conflict of interest
The authors declare that the research was conducted in the absence of any commercial or financial relationships that could be construed as a potential conflict of interest.
Publisher’s note
All claims expressed in this article are solely those of the authors and do not necessarily represent those of their affiliated organizations, or those of the publisher, the editors and the reviewers. Any product that may be evaluated in this article, or claim that may be made by its manufacturer, is not guaranteed or endorsed by the publisher.
References
Carraro, C., and Massetti, E. (2012). Energy and climate change in China. Environment and Development Economics 17 (6), 689–713. doi:10.22004/ag.econ.101294
Chen, X. J., Zhang, C. C., Zhang, J. T., and Wang, J., (2022). Analysis of the spatiotemporal evolution patterns of vegetation net primary productivity and its influencing factors based on CASA model. Res. Soil Water Conservation (03), 253–261. doi:10.13869/j.cnki.rswc.2022.03.033
Chen, Y. Z., Ju, W. M., Groisman, P., Li, J., Propastin, P., and Xu, X., (2017). Quantitative assessment of carbon sequestration reduction induced by disturbances in temperate Eurasian steppe. Environ. Res. Lett 11, 115005. doi:10.1088/1748-9326/aa849b
Christopher, B., Field, Michael, J., BehrenfeldJames, T., and Falkowski, P. (1998). Primary production of the biosphere: Integrating terrestrial and oceanic components. Science 5374, 237–240. doi:10.1126/science.281.5374.237
Dowding, I., and Haufe, S. (2018). Powerful statistical inference for nested data using sufficient summary statistics. Front. Hum. Neurosci. 12, 103. doi:10.3389/fnhum.2018.00103
Du, B. B., Alateng, T. Y., Bao, G., Wang, N., and Ling, K. J., (2021). Simulation of net primary productivity of xilingol grassland based on CASA model. Res. Soil Water Conservation (05), 293–300. doi:10.13869/j.cnki.rswc.2021.05.034
Fang, J. Y., Ke, J. H., Tang, Z. Y., and Chen, A. P., (2001). Implications and estimations of four terrestrial productivity parameters. Acta Phytoecol. Sin (04), 414–419.
Gao, Y. N., Yu, G. R., Zhang, L., Liu, M., Huang, M., and Wang, Q. F., (2012). The changes of net primary productivity in Chinese terrestrial ecosystem: Based on process and parameter model. Prog. Geogr. (01), 109–117. doi:10.11820/dlkxjz.2012.01.014
He, H. Y. (2008). Modeling forest NPP patterns on the Tibetan Plateau and its responses to climate change. China Acad. For. Sci. doi:10.7666/d.D602776
Hou, Y. Y., Liu, Q. H., Yan, H., and Tian, G. L. (2007). Variation trends of China terrestrial vegetation net primary productivity and its responses to climate factors in 1982-2000. Chin. Acad. Agric. Sci 18 (07), 1546–1553. doi:10.13287/j.1001-9332.2007.0259
Jin, K., Wang, F., Han, J. Q., Shi, S. Y., and Ding, W. B., (2020). Contribution of climatic change and hunan activities to vegetation NDVI change over China during 1982-2015. Acta Geogr. Sin (05), 961–974. doi:10.11821/dlxb202005006
Li, H. X., Liu, G. H., and Fu, B. J. (2011). Response of vegetation to climate change and human activity based on NDVI in the Three-River Headwaters region. Acta Ecol. Sin 31 (19), 5495–5504.
Li, J. K., Yang, Y. T., Zhang, H. R., Huang, L., and Gao, Y. M., (2019).Spatio-temporal variations of net primary productivity and its natural and human factors analysis in Qinling-Daba Mountains in the past 15 years. Acta Ecologica Sinica. 39 (22), 8504–8515. doi:10.5846/stxb201807231575
Li, M., Wu, J., Feng, Y., Niu, B., He, Y., and Zhang, X. (2021). Climate variability rather than livestock grazing dominates changes in alpine grassland productivity across Tibet. Front. Ecol. Evol 9, 631024. doi:10.3389/fevo.2021.631024
Li, M. D., Cui, Y. P., Fu, Y. M., Li, N., Tang, X. Y., and Liu, X. Y., (2020). Simulating the potential sequestration of three major greenhouse gases in China’s natural ecosystems. Forests 11 (2), 128 doi:10.3390/f11020128
Li, X. B., Fan, R. X., and Liu, X. D. (2014). Advance in studies on carbon storage and carbon process in grassland ecosystem of China. Ecol. Environ. Sci 23 (11), 1845–1851. doi:10.16258/j.cnki.1674-5906.2014.11.023
Liu, X. J., Dong, L., Zhao, J., Du, Z. Q., and Zhang, H., (2019). Dynamic state of desert vegetation productivity and its relationship with water-heat factors in China. Arid Zone Res 36 (2), 459–466. doi:10.13866/j.azr.2019.02.23
Liu, Y. Y., Yue, Y. Q., Wang, Q., Du, X., Li, J., and Gang, C., (2019). Evaluating the responses of net primary productivity and carbon use efficiency of global grassland to climate variability along an aridity gradient. Sci. Total Environ 652, 671–682. doi:10.1016/j.scitotenv.2018.10.295
Ma, R., Xia, C., Liu, Y., Wang, Y., Zhang, J., and Shen, X., (2022). Spatiotemporal change of net primary productivity and its response to climate change in temperate grasslands of China. Front. Plant Sci 13, 899800. doi:10.3389/fpls.2022.899800
Murakami, K., Kojima, T., and Sakaki, Y. (2004). Assessment of clusters of transcription factor binding sites in relationship to human promoter, CpG islands and gene expression. BMC Genomics 5, 16. doi:10.1186/1471-2164-5-16
Niu, J. M. (2000). Relationship between main vegetation types and climatic factors in inner Mongolia Chinese Academy of agricultural Sciences, 47–52. doi:10.13287/j.1001-9332.2000.0013
Pan, H. L., Li, M. H., Cai, X. H., Wu, J., Du, Z., and Liu, X. L., (2009). Responses of growth and ecophsiology of plants to altitude. Ecol. Environ. Sci (02), 722–730. doi:10.16258/j.cnki.1674-5906.2009.02.036
Piao, S. L., Fang, J. Y., He, J. S., and Yu, X. (2004). Spatial distribution of grassland biomass in China. Chin. J. Plant Ecol 28 (04), 491–498. doi:10.17521/cjpe.2004.0067
Shen, H. H., Zhu, Y. K., Zhao, X., and Gao, S. (2016). Analysis of current grassland resources in China(in Chinese). Chin. Sci. Bull 61, 139–154. doi:10.1360/N972015-00732
Soltani, M., Laux, P., Kunstmann, H., Stan, K., Sohrabi, M. M., and Molanejad, M., (2016). Assessment of climate variations in temperature and precipitation extreme events over Iran. Theor. Appl. Climatol 126, 775–795. doi:10.1007/s00704-015-1609-5
Tang, C. J., Fu, X. Y., Jiang, D., Zhang, X., and Zhou, S. (2014). Simulating spatiotemporal dynamics of sichuan grassland net primary productivity using the CASA model and in situ observations. Sci. World J 2014, 1–2. doi:10.1155/2014/956963
Wang, H., Liu, G. H., Li, Z. S., Ye, X., Wang, M., and Gong, L. (2016). Impacts of climate change on net primary productivity in arid and semiarid regions of China. Chin. Geogr. Sci 26 (1), 35–47. doi:10.1007/s11769-015-0762-1
Wang, J., and Feng, Q. (2016). Extreme temperatures indexes in northern shaanxi during 1960-2013. J. Desert Res (04), 1097–1105. doi:10.7522/j.issn.1000-694X.2016.00080
Wang, S., Ping, C., Wang, N., Wen, J., Zhang, K., and Yuan, K., (2022). Quantitatively determine the dominant driving factors of the spatial-temporal changes of vegetation-impacts of global change and human activity. Open Geosci 14 (1), 568–589. doi:10.1515/geo-2022-0374
Xie, G. D., Zhang, Y. L., Lu, C. X., Zheng, D., and Cheng, S. K., (2001). Study on valuation of rangeland ecosystem services of China. J. Nat. Resour (01), 47–53. doi:10.3321/j.issn:1000-3037.2001.01.009
Xie, S. J., Liu, Y. H., and Yao, F. X. (2020). Spatio-temporal characterisitics of NDVI and its relationship with climate change in Beijing from 1998 to 2015. Res. Soil Water Conservation (03), 190–196+202+2. doi:10.13869/j.cnki.rswc.2020.03.028
Xu, Y., Hu, X., Liu, Z., and Zhang, H. (2020). Research advances in net primary productivity of terrestrial ecosystem. J. Geoscience Environ. Prot 8, 48–54. doi:10.4236/gep.2020.88005
Yan, Y. C., Liu, X. P., Wen, Y. Y., and Ou, J. (2019). Quantitative analysis of the contributions of climatic and human factors to grassland productivity in northern China. Ecol. Indic 103, 542–553. doi:10.1016/j.ecolind.2019.04.020
Yang, T. T., Wu, X. H., Wang, J, T., Li, P., and Shi, H. X., (2012). Estimation of carbon storage in grassland ecosystem in China. J. Arid Land Resour. Environ (03), 127–130. doi:10.13448/j.cnki.jalre.2012.03.015
You, Q. L., Kang, S. C., Aguilar, E., Pepin, N., Flugel, W. A., and Yan, Y., (2011). Changes in daily climate extremes in China and their connection to the large scale atmospheric circulation during 1961–2003. Clim. Dyn 36, 2399–2417. doi:10.1007/s00382-009-0735-0
Zhao, F., Xu, B., Yang, X. C., Jin, Y., Li, J., and Xia, L., (2014). Remote sensing estimates of grassland aboveground biomass based on MODIS net primary productivity (NPP)A case study in the xilingol grassland of northern China. Remote Sens 6 (6), 5368–5386. doi:10.3390/rs6065368
Zhou, W., Mu, F. Y., Gang, C. C., Guan, D. J., He, J. F., and Li, J. L., (2017). Spatio-temporal dynamics of grassland net primary productivity and their relationship with climatic factors from 1982 to 2010 in. ChinaActa Ecol. Sin 37 (13), 4335–4345doi. doi:10.5846/stxb201408291724
Zhu, W. Q. (2005). Estimation of net primary productivity of Chinese terrestrial vegetation based on remote sensing and its relationship with global climate change. Doctoral dissertation. China: Beijing Normal University.
Zhu, W. Q., Pan, Y. Z., Long, Z. H., Chen, Y. Z., Li, J., and Hu, H. B., (2005). Estimating net primary productivity of terrestrial vegetation based on GIS and RS:A Case study in Inner Mongolia, China. J. Remote Sens (03), 300–307.
Keywords: carnegie-ames-stanford approach, remote sensing, grassland ecosystem, carbon sequestration, China
Citation: Li X, Li R and Sha Z (2023) Modeling carbon uptake by vegetation of grassland ecosystems and its associated factors in China based on remote sensing. Front. Earth Sci. 10:1077885. doi: 10.3389/feart.2022.1077885
Received: 23 October 2022; Accepted: 02 December 2022;
Published: 25 January 2023.
Edited by:
Yonghao Xu, Institute of Advanced Research in Artificial Intelligence (IARAI), AustriaReviewed by:
Laxmikant Sharma, Central University of Rajasthan, IndiaQiang Yu, Beijing Forestry University, China
Copyright © 2023 Li, Li and Sha. This is an open-access article distributed under the terms of the Creative Commons Attribution License (CC BY). The use, distribution or reproduction in other forums is permitted, provided the original author(s) and the copyright owner(s) are credited and that the original publication in this journal is cited, in accordance with accepted academic practice. No use, distribution or reproduction is permitted which does not comply with these terms.
*Correspondence: Zongyao Sha, em9uZ3lhb3NoYUAxNjMuY29t
†These authors have contributed equally to this work and share first authorship