 Chang Lu
 Lei Chen1,2*
 Xin Chen
- 1School of Geoscience and Technology, Southwest Petroleum University, Chengdu, China
- 2Division of Key Laboratory of Carbonate Reservoirs, CNPC, Southwest Petroleum University, Chengdu, China
- 3Shenzhen Branch of CNOOC LTD., Shenzhen, China
- 4Sichuan Changning Natural Gas Development Co., LTD., Chengdu, China
The Changning area, located in the south of the Sichuan Basin, has obtained commercial shale gas from the Silurian Longmaxi Formation, which is characterized by rich organic matter, large hydrocarbon generation, and high gas content. A series of studies have been carried out on the shale of the Wufeng Longmaxi Formation in the Changning area, including mineral petrological characteristics, shale reservoir characteristics, and accumulation characteristics. Although there are studies on the gas-bearing characteristics of the Wufeng Formation-Longmaxi Formation shale in the Changning area, the research is not systematic. In this work, based on isothermal adsorption experiments, field desorption experiments, and well log interpretation, the gas-bearing characteristics of the Longmaxi Formation shale in the Changning area were studied in detail. The results showed that the average of saturated-adsorbed methane gas volume of the Longmaxi Formation is 1 m3/t, which demonstrated that the Longmaxi shale reservoirs had strong adsorption capacity. The total gas content of section Long11-1, Long11-2, Long11-3, and Long11-4 is greater than 2 m3/t, which were the prolific shale gas layers. The Long12 sub-member has the lowest total gas content, ranging from 0.34 m3/t to 3.84 m3/t, with an average of 1.59 m3/t. The free gas content of the Longmaxi Formation in the Changning area was slightly smaller than the adsorbed gas content and it shows increasing trend from the bottom to top, while the adsorbed gas content shows an opposite trend. With the top of Long11-3 as the circumscription, the adsorbed gas accounts for the main part of shale gas in the lower part and the free gas shale in the upper part.
Introduction
There are rich shale gas resources in China, of which the Sichuan Basin is the leading edge of shale gas exploration and development (Zou et al., 2016). The Changning area, located in the south Sichuan Basin, has obtained commercial shale gas in the Silurian Longmaxi Formation. Gas bearing is an important parameter for the evaluation of shale reservoirs, and it is also the ultimate indicator for determining whether shale gas has commercial exploitation potential (Zou et al., 2016). The empirical data from the North American commercial shale gas production show that the lower limit of shale gas content in favorable shale gas-producing areas is 2 m3/t, and the gas content is affected by factors such as organic carbon content, maturity, and mineral composition (Bowker, 2007; Hicky and Henk, 2007; Mastalerz et al., 2010; Li et al., 2020). The total shale gas content, mostly measured by field desorption experiment, consists of three parts: desorption gas, loss gas, and residual gas. Desorption gas and residual gas are measured, and loss gas is calculated by the regression of desorption rate. At present, the USBM (United States Bureau of Mine) method, polynomial method, Smith–Williams method, descending curve method, Amoco method, and other desorption data processing methods have been developed (Wei et al., 2015). In this study, the widely used the USBM method is adopted. The total gas content of shale is composed of free gas content and adsorbed gas content (Hill et al., 2000). The free gas content is the shale gas content are in the shale microcracks and macropores in the free state, and the adsorbed gas content is the shale gas content exists on the surface of mineral particles or organic matter (Xiong et al., 2012). However, the specific content of the free gas and adsorbed gas cannot be directly measured through experiments. There are three methods to quantify the free gas and adsorbed gas content in the shale reservoir, which include logging interpretation (Tang et al., 2014), nuclear magnetic resonance technology (Li et al., 2018), and isothermal adsorption (Zhang et al., 2017). Log interpretation and isothermal adsorption can obtain continuous free gas and adsorbed gas results, which are widely used in production. In order to avoid the influence of other factors on the results in this calculation, the original calculation equation is corrected according to the previous research results (Tang et al., 2014; Gou et al., 2019).
A series of studies have been carried out on the reservoir characteristics of the Longmaxi Formation shale in the Changning area (Wang et al., 2012). However, few systematic researches on the gas-bearing characteristics of shale in the Changning area has been carried out. The studies on gas content of the Longmaxi shale of Changning mainly focused on the characteristics of isothermal adsorption and field desorption of the total gas content and its influencing factors but few studies on the characteristics of free gas and adsorbed gas and their influencing factors (Yan et al., 2013; Luo et al., 2019). Therefore, this study analyzes the isothermal adsorption characteristics, total gas content characteristics, free and adsorbed gas characteristics, and control factors of the Longmaxi Formation shale in the Changning area.
Geologic Setting
The Changning area is located in the southern Sichuan Basin, which is located at the junction of the three provinces of Yunnan, Guizhou, and Sichuan (Figure 1). The Changning area is one of the most favorable exploration areas of shale gas in the Sichuan Basin.
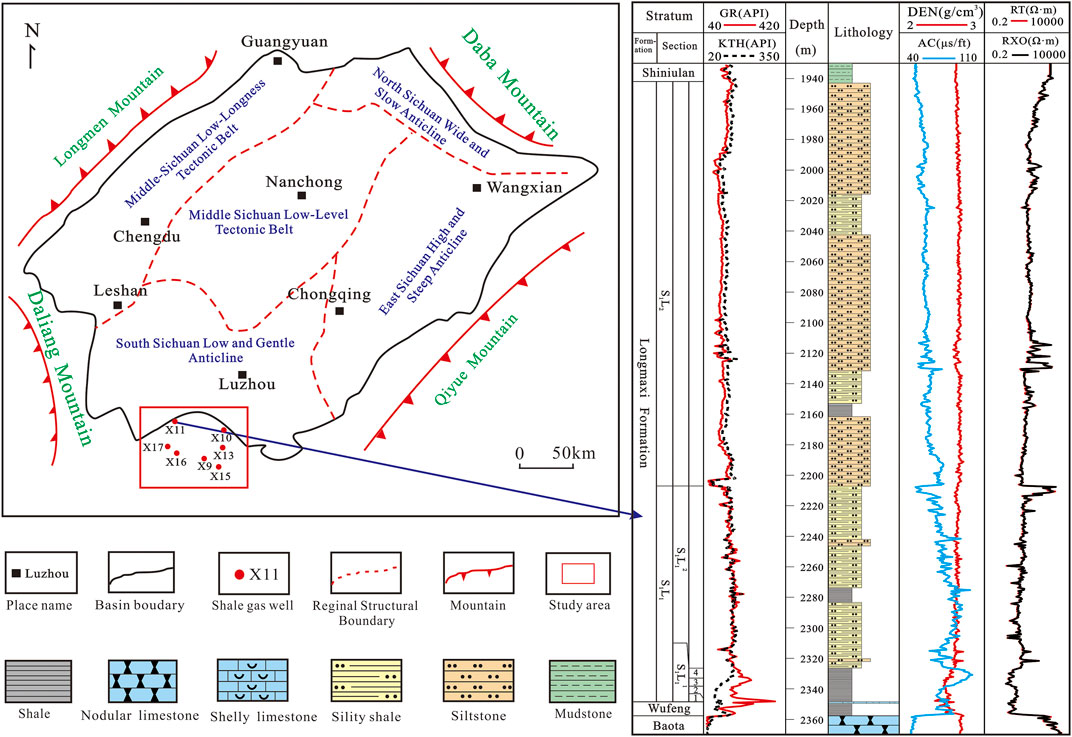
FIGURE 1. The location of the study area and stratigraphic column of the Longmaxi Formation of the X11 Well (Chen et al., 2019).
The Sichuan Basin is a superimposed basin formed through a long process of geological evolution (Cheng et al., 2021). The late Ordovician to early Silurian was an important transition period for deposition and tectonic evolution of the Yangtze Block. As an important part of the Upper Yangtze Platform, the Sichuan Basin has undergone huge changes in its sedimentary environment (Chen et al., 2019). The southeastern edge of the Sichuan Basin was uplifted by tectonic activity, which changed the sedimentary environment in the southeast to make it transforming, from open to restricted, forming a set of thick organic-rich shale (Wang et al., 2012). During the Wufeng and the early Longmaxi period, the study area was in a stable sea basin with high sea level. Due to the large areas of the ocean floor deprived of oxygen, organic matter and biogenic silica were effectively preserved, which resulted in a set of organic-rich shale with abundant graptolites sedimented in the area (Wang et al., 2017). The Longmaxi shale in the Changning area has a great hydrocarbon generation ability and high TOC(Wang et al., 2012). The type of organic matter is mainly type I kerogen and the maturity (Ro) of organic matter is over 2%, which shows that the shale is over-mature.
The Longmaxi Formation is a conformable contact with the underlying Guanyinqiao section and the overlying Shiniulan Formation. The lithology of Longmaxi Formation is generally a combination of carbonaceous shale and silty shale. The Longmaxi Formation (S1L) is divided into two sections, namely the Long 1 Member (S1L1) and the Long 2 Member (S1L2). The lithology of the Long 1 Member is carbonaceous shale, which is rich in organic matter and the Long 2 Member is mainly silty shale. The Long 1 Member can be further subdivided into the Long 11 submember (S1L11) and the Long 12 submember (S1L12). In between, the Long 11 submember with the more organic matter can be divided into 4 small layers: section Long11-1(S1L11-1), Long11-2 (S1L11-2), Long11-3 (S1L11-3), and Long11-4 (S1L11-4) (Figure 1).
Materials and Methods
Isothermal Adsorption Experiment
The shale isothermal adsorption curve could describe the ability of shale to adsorb gas. The amount of shale adsorbed gas under constant temperature is a function of pressure. The adsorption law and capacity of shale follow the isothermal adsorption relationship of Langmuir (1916):
where VE represents the volume of adsorbed gas per unit volume of the reservoir under pressure p, in m3/t; VL is the Langmuir volume, which represents the maximum amount of adsorbed gas in the reservoir, in m3/t; p is the gas pressure in MPa; pL is the Langmuir pressure in MPa. Langmuir pressure and Langmuir volume indicate the maximum adsorption capacity and difficulty of shale adsorption gas, respectively (Zhang, et al., 2014). The maximum adsorption gas volume tested in the experiment is taken as VL, and the pressure corresponding to the maximum adsorption gas volume of the 1/2 is taken as pL (Chen et al., 2015).
The experimental samples for this study were taken from well X9 in the south of the Changning area. The strata are Shiniulan Formation and Longmaxi Formation, with a total of 8 samples (Table 1). Before the experiments, the samples need to be dried and pulverized to 180–425 μm particles for the isothermal adsorption experiments. The experimental steps are as follows: 1) Put the shale particles of 180–425 µm into the sample tank, check the air tightness and measure the free space volume of the experimental system, and measure continuously until the error is less than 5%; 2) Close the sample tank after vacuuming, fill the reference cylinder with methane gas at a certain pressure. After the pressure is stabilized, open the valve of the sample cylinder to allow the two cylinders to connect. After the pressure is balanced, record the equilibrium pressure; 3) Close the sample cylinder and continue to fill the reference cylinder with gas. The abovementioned equilibrium process is repeated until the test of all pressure points is completed. According to the measured equilibrium pressure p at each pressure point and the corresponding adsorption amount V0, a shale isothermal adsorption curve can be drawn.
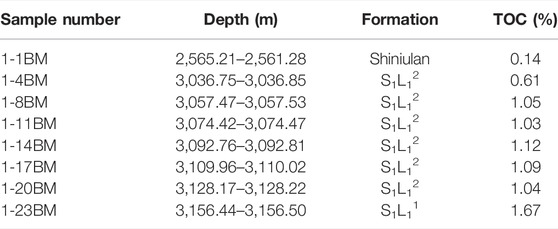
TABLE 1. The samples of isothermal adsorption in well X9.
Field Desorption Experiments
The field desorption experiment is a direct method for measuring the shale gas content (Jarvie et al., 2007). A total of 163 samples were obtained from 4 shale gas wells in X13, X15, X16, and X17 in the Changning area (Table 2). The four wells are drilled in different locations of the Changning area. Sampling from these wells for the field desorption experiments could provide more comprehensive analysis of the gas content characteristics in the Changning area. After the cores were out of the wellbore, 30 cm shale was selected to remove mud and debris, weighed and placed in a closed metal analysis tank, and the time of drilling formations, time of starting drilling, time of reaching the wellhead, and time of tank closure were recorded. The desorption temperature of the first 3 h is mud circulation temperature. After 3 h, the desorption is performed under the formation temperature conditions. The ambient temperature and atmospheric pressure data are recorded, and the data of the gas content with time is collected. The desorption is continuously stopped until the analysis rate is less than 5 cm3/day.
TABLE 2. The samples of field desorption experiments in the Changning area.
According to the gas state equation, the volume was converted to a temperature of 0°C and a pressure of 101.325 kPa to obtain the desorbed gas content. Residual gas is the volume of gas released by pulverization after the natural desorption of shale is terminated. The loss gas volume was calculated using the USBM (United States Bureau of Mine) method. The initial desorption gas volume is proportional to the square root of time (Bertard et al., 1970). The cumulative desorption gas volume under standard conditions is taken as the ordinate, and the square root of time is plotted on the abscissa. In the square root diagram of the desorbed gas, volume and time, the absolute value of the intercept between the inverse extension line and the ordinate axis is the loss gas volume. Therefore, the total desorption gas content is
where Qd is the total desorption gas content, m3/t; Q0 is the loss gas content, m3/t; t is the loss time, min; t0 is measured loss time, min; and b is the slope obtained by linear regression of some initial desorption data.
Free Gas and Adsorbed Gas Calculation
Processing and analyzing the logging data of 7 wells (X9, X11, X12, X13, X15, X16, and X17) in the study area were carried out to accurately obtain shale porosity and oil saturation, gas saturation, and other parameters. These parameters are used to calculate the free gas content, adsorbed gas, and total gas content. Langmuir pressure and Langmuir volume of the shale were obtained through isothermal adsorption experiments. For shale samples with different temperatures, pressures, and TOC, it is necessary to conduct logging correction for each parameter (Tang et al., 2014). Langmuir volume and Langmuir pressure for correction are
where Vlt is the Langmuir volume adjusted for reservoir temperature, m3/t; Plt is the temperature corrected Langmuir pressure of reservoir, MPa; T is the reservoir temperature, °C; Ti is the test temperature of isothermal adsorption, °C; Vl is the Langmuir volume of the test sample, m3/t; and Pl is the Langmuir pressure of the tested sample, MPa. The reservoir temperature can be obtained through the depth and geothermal gradient, the geothermal gradient is 2°C/100 m.
TOC for correction is
where Vlc——the Langmuir volume adjusted for reservoir temperature and TOC,m3/t; TOCiso—— the TOC of the isothermal adsorption experiment sample; TOClg—— the TOC calculated by logging.
After correction and combined with Eq. 1, the adsorption gas volume of shale is
where p is the reservoir pressure, MPa.
Free gas is the gas in the pore of shale, which can be calculated by the volume model and then subtracted the volume occupied by the adsorbed gas (Ambrose et al., 2012; Li et al., 2012). Therefore, the actual volume of free gas is
where Gf is the free gas content, cm3/g; ϕ is the porosity of rock, expressed as percentage; Sw is the saturation of water, expressed as percentage; SO is the saturation of oil, expressed as percentage; ρb is the visual density of rock, g/cm3; Bg is the gas formation volume factor;
Results
Characteristics of Isothermal Adsorption
Adsorption is one of the important mechanisms of shale gas occurrence. In Barnett shale, Lewis shale, and Antrim shale, the volume of adsorbed gas accounts for 20–85% of the total shale gas reserves (Curtis, 2002).
The isothermal adsorption curve of well X9 samples shows that the saturated adsorption gas volume of the Shiniulan Formation is about 0.45 m3/t, and the saturated adsorption gas volume of the Longmaxi Formation is between 0.75 m3/t and 1.2 m3/t, with an average value of 1 m3/t (Figure 2). The volume of the saturated adsorbed gas in the Longmaxi Formation was significantly higher than that in the Shiniulan Formation. The saturated adsorption gas volume of sample 1-4BM, 1-11BM, and 1-23BM is about 0.75 m3/t, 0.92 m3/t, and 1.2 m3/t (Figure 2), respectively. Evidently, the overall volume of the saturated adsorbed gas in the Longmaxi Formation gradually increased from shallow to deep. The overall volume of the saturated adsorbed gas in the Longmaxi Formation shale is relatively high, and the shale reservoir has a strong adsorption capacity. The saturated adsorbed gas of S1L12 is smaller than the saturated adsorbed gas of S1L11.
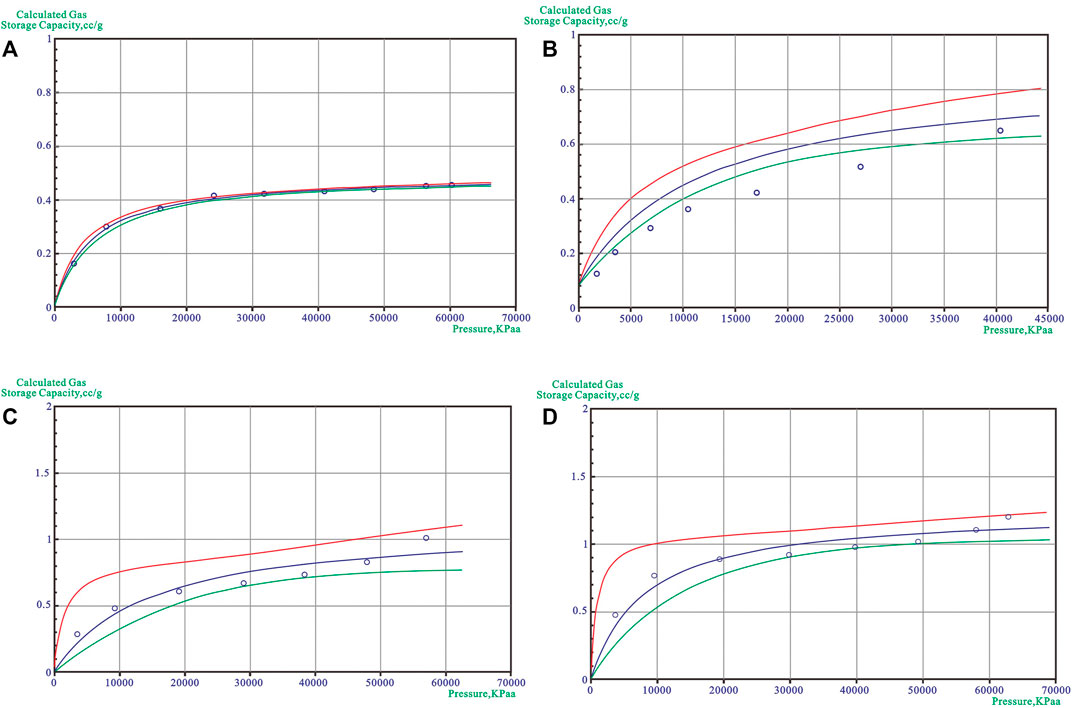
FIGURE 2. The isothermal adsorption curve. (A) 1-1BM, 2,565.21 m–2,561.28 m, well X9; (B) 1-4BM, 3,036.75 m–3,036.85 m, well X9; (C) 1-8BM, 3,057.47 m–3,057.53 m, well X9; (D) 1-23BM, 3,156.44 m–3,156.5 m, well X9. The curve showing the data (circle), Langmuir fit (blue line), Upper 95% Conf. Interval (red line) and Lower 95% Conf. Interval (green line).
Characteristics of Total Gas Content
The total gas content of the Longmaxi Formation is between 0.34 m3/t and 10.31 m3/t, with an average of 2.64 m3/t (Table 3). The total gas content of S1L11-2 is the highest, with an average value of 3.61 m3/t, while the average total gas content of S1L12 is the lowest, which is 1.59 m3/t. The total gas content of S1L11-1, S1L11-2, S1L11-3, and S1L11-4 is greater than 2 m3/t. The total gas content of S1L11-1 is collectively more than 2 m3/t, which is the dominant layer of commercial mining. The total gas content of S1L12 is greater than 2 m3/t, accounting for only 25%. Accordingly, the portion of the Longmaxi Formation with a total gas content of more than 2 m3/t tends to decrease from the bottom to the top. The total gas content has a consistent change trend with the loss gas, desorbed gas, and residual gas, and generally shows a gradual decrease from the bottom to the top (Figure 3).
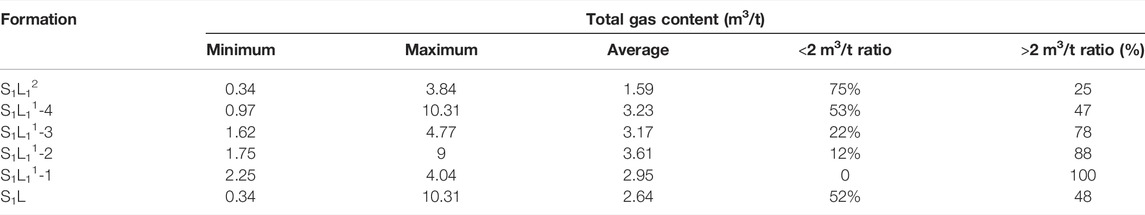
TABLE 3. The total gas content of field desorption in the Longmaxi Formation.
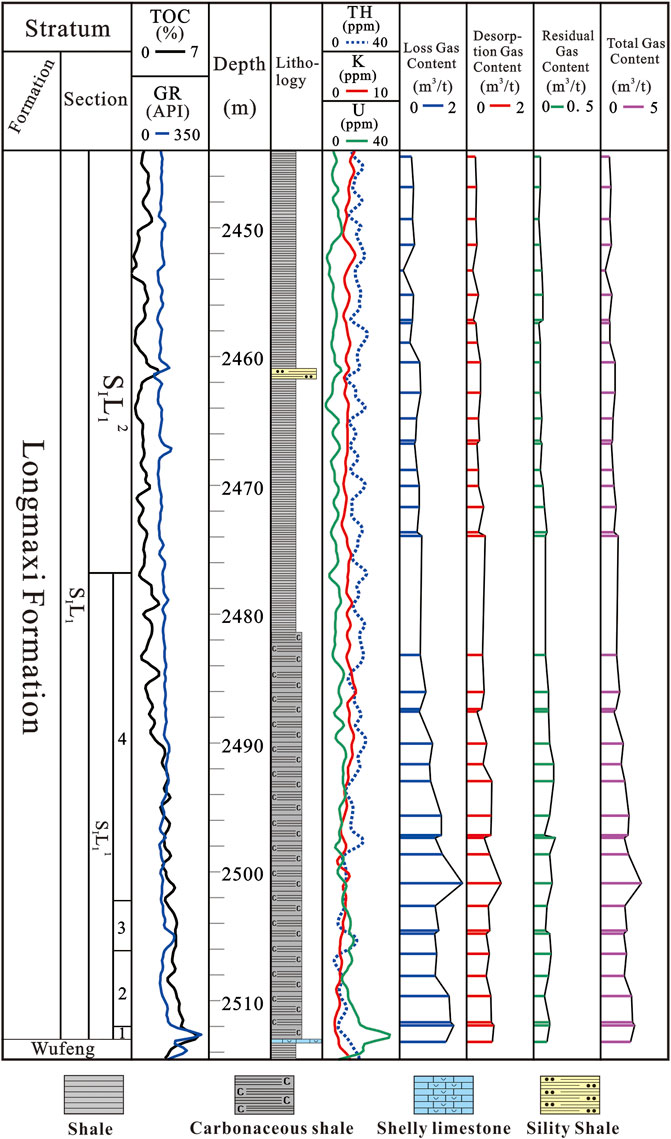
FIGURE 3. The total gas content, residual gas content, desorbed gas content, and lost gas content of the Longmaxi Formation in X15 well, see Figure 1 for the well location.
Characteristics of Free Gas and Adsorbed Gas
Methane is produced by organic matter through biological or thermal genesis, and is stored in the matrix pores, natural fractures, and some organic nanopores of shale as free gas; or gets adsorbed on mineral particles, organic matter surfaces, and some smaller pores surfaces (Yan et al., 2013). The characteristics of free gas and adsorbed gas have a significant impact on the shale gas production that affects the implementation of fracturing and acidification.
The free gas content of the Longmaxi Formation shale in the Changning area is generally slightly less than the adsorbed gas content. The free gas contents range from 0 to 8 m3/t, with an average value of 1.46 m3/t. The adsorbed gas contents are between 0 and 4.92 m3/t, with an average value of 1.52 m3/t (Table 4).
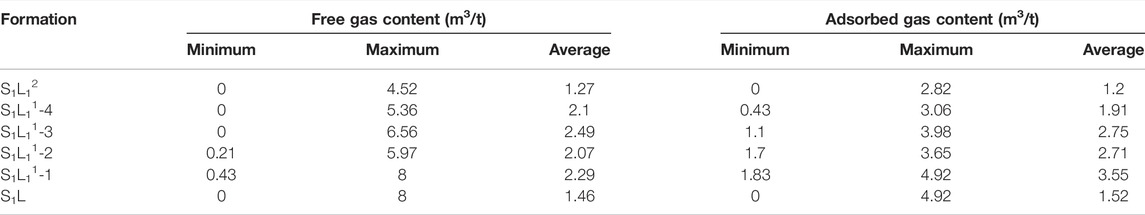
TABLE 4. The free gas and adsorbed gas content in the Longmaxi Formation shale in the Changning area.
There are differences in the free gas and adsorbed gas content in each layer of the Longmaxi Formation. Among them, the free gas in S1L11-1 accounted for 39% of the total gas content, and the adsorbed gas accounted for 61%. At the top of S1L12, the free gas accounts for 51% of the total gas content, and the adsorption gas accounts for 49% of the total gas content. The free gas content in the total gas content in the vertical direction increased from bottom to top, while the adsorbed gas content showed a decreasing trend. It is remarkable that with the top of S1L11-3 as the circumscription, the adsorbed gas accounts for the main part of the shale gas in the lower part, and the free gas shale gas in the upper part. (Figure 4). This phenomenon may be related to the increase in the silty sandy content from the bottom to the top of the Longmaxi Formation. The silty sandy content at the top is higher, and it results in a looser rock structure and a larger pore diameter, which provides more space for free gas. The organic matter content and the degree of thermal evolution at the bottom of the Longmaxi Formation are higher. The organic matter pores and organic matter formed during thermal evolution both provide a specific surface area for the adsorbed gas.
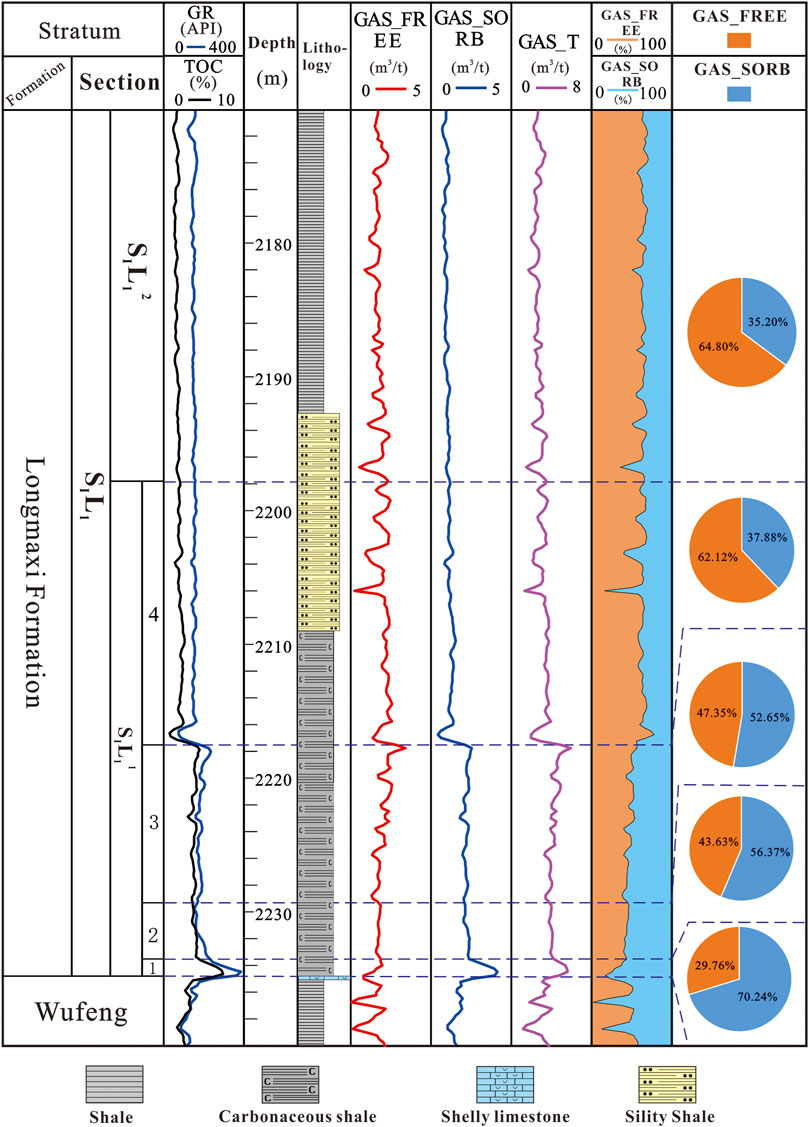
FIGURE 4. The free gas and adsorbed gas content of the Longmaxi Formation in X10 well.
Discussions
Relationship Between Lithofacies and Gas Content
Affected by the data limitations and characterization methods, there are many types of shale lithofacies classifications criteria in sedimentology (Loucks and Ruppel, 2007; Hickey and Henk, 2007; Hammes et al., 2011; Abouelresh and Slatt, 2012; Hemmesch et al., 2014; Wang, et al., 2016). This study classified the lithofacies of the Longmaxi Formation shale in the Changning area based on the mineral composition. Projecting the sample points on the lithofacies ternary diagram, there are 8 types of lithofacies which include mixed siliceous shale (S-1), calcareous siliceous shale (S-2), argillaceous siliceous shale (S-3), mixed shale (M-2), siliceous-argillaceous mixed shale (M-3), siliceous-calcareous mixed shale (M-4), calcareous argillaceous shale (CM-2), and siliceous argillaceous shale (CM-3) in the Longmaxi Formation (Figure 5).
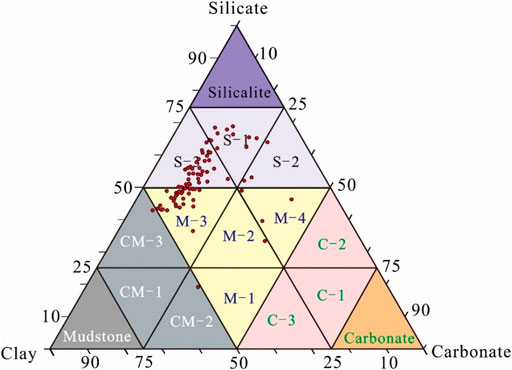
FIGURE 5. Lithofacies ternary diagram of the Longmaxi shale in the Changning area. S-1 is mixed siliceous shale, S-2 is calcareous siliceous shale, S-3 is argillaceous siliceous shale; M-1 is argillaceous-calcarous mixed shale, M-2 is mixed shale, M-3 is siliceous-argillaceous mixed shale, M-4 is siliceous-calcareous mixed shale; CM-1 is mixed argillaceous shale, CM-2 is calcareous argillaceous shale, CM-3 is siliceous argillaceous shale; C-1 is mixed calcareous shale, C-2 is siliceous calcareous shale, and C-3 is argillaceous calcareous shale.
The total gas content of each lithofacies is counted to study the control effect of the relative gas content of the rocks. Since the siliceous argillaceous shale, calcareous argillaceous shale, and mixed shale all have only one sample point, the maximum, minimum, and average values of the total gas content are not enough to reflect the true total gas content, and consequently, the geological significance of the data has not been counted.
In the other five lithofacies, the total gas content of the mixed siliceous shale (S-1) and argillaceous siliceous shale (S-3) is larger. The total gas content of the mixed siliceous shale ranges from 1.37 m3/t to 7.75 m3/t, with an average total gas content of 3.8 m3/t; the total gas content of the argillaceous siliceous shale is between 0.68 m3/t and 10.31 m3/t, the average is 2.89 m3/t (Figure 6). The superiority of these two types of lithofacies is mainly related to the mineral composition of the shale. The mixed siliceous shale and argillaceous siliceous shale are rich in quartz, and a large number of scholars have confirmed that the quartz in the lower part of the Longmaxi Formation mainly comes from siliceous radiolarians, which is a biological cause (Zhang et al., 2016; Guo et al., 2020). Research on the genesis of quartz in the shale gas reservoirs in Canada found that the higher the content of biological quartz, the higher the content of TOC, and the higher corresponding gas content (Ross and Bustin, 2007) (Figure 8). In addition, during the diagenesis of shale, the underground pressure acts on the rock, and quartz, as a brittle mineral in the rock, will be broken by the compaction to form microfractures, which provides more storage space for the free shale gas.
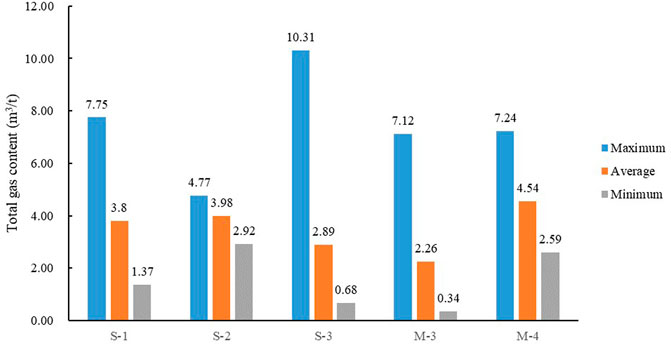
FIGURE 6. The total gas content of different shale lithofacies of the Longmaxi Formation in the Changning area.
Relationship Between TOC and Gas Content
The organic matter in shale is the material source of shale gas, and the organic matter content greatly affects the gas content (Hicky and Henk, 2007; Bowker, 2007 (Mastalerz et al., 2010). Early research has proved that the total gas content increases with the increase of organic carbon. The study of the Devonian-Mississippi of New Albany shale gas reservoirs in the Illinois Basin shows that the total gas content of shales increases with the increase of TOC content (Bowker, 2007; Mastalerz et al., 2010).
The Longmaxi Formation shale in the Changning area has good hydrocarbon generation ability, high organic carbon content (TOC), and the type of organic matter is mainly type I kerogen. The organic carbon content of the Longmaxi Formation has a tendency to decrease from the bottom to the top (Figure 3). By linearly fitting the Longmaxi Formation organic carbon content and the total gas content data in the Changning area, it was found that the total gas content has a positive correlation with the organic carbon content. The square of correlation coefficient (R2) is 0.8216, and the correlation is extremely strong, which proves that the organic carbon content is an important factor for controlling the total gas content (Figure 7).
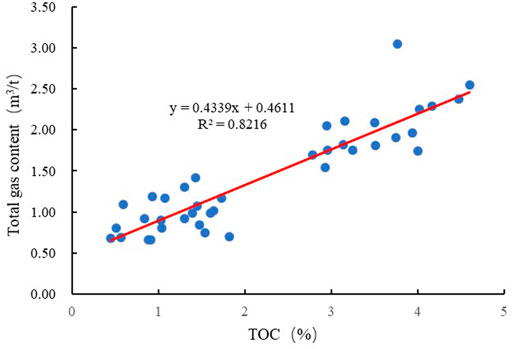
FIGURE 7. Relationship between the TOC and the total gas contents of the Longmaxi Formation shale in the Changning area.
The organic matter content influences both the free gas and adsorbed gas content. There is usually high porosity and gas saturation in the high TOC shale, which increases the storage space of the free gas (Wang et al., 2013). Siliceous organisms have a great contribution to the paleoproductivity of shale, and are an important source of siliceous minerals in the Longmaxi shale (Liu et al., 2019). The prosperity of siliceous organisms makes the paleoproductivity favorable for the enrichment of organic matter. Therefore, TOC and siliceous minerals are often positively correlated. The fracture of siliceous minerals could provide a large amount of free gas storage space, thereby increasing the free gas content. In addition, TOC also has a direct effect on the adsorbed gas content. In shale with high TOC, the organic matter pores in organic matter are well developed, which provide adsorption space and larger specific surface area for the shale gas (Jarvie et al., 2007; Ross and Bustin, 2008). Organic matter can also be used as an adsorbent to adsorb gas, so it is conducive to the enrichment of the adsorbed gas. Some research results show that type I organic matter in the Longmaxi Formation shale has stronger adsorption capacity than clay minerals (Yan et al., 2013). In addition, the surface of the organic matter is lipophilic, so it has strong adsorption for gaseous hydrocarbons, and the content of the adsorbed gas also increases.
Relationship Between Mineral Composition and Gas Content
Previous studies have shown that mineral composition has a certain effect on the total gas content (Nie and Zhang, 2012; Luo et al., 2019). The Longmaxi Formation shale in the Changning area is mainly composed of quartz, feldspar, clay minerals, carbonate minerals, and pyrite. The composition and structure of minerals affect the structural characteristics of pores, which affects the shale adsorption capacity, and then its gas content will change. The Longmaxi shale in the Changning area is rich in quartz, and the total gas content of the shale increases with the increase of the quartz content (Figure 8A). Quartz is mostly biogenic in the Longmaxi shale, which has a positive correlation with the TOC, and at the same time, the organic carbon controls the total shale gas content to a large extent. Therefore, a positive correlation has been established between the quartz and total gas content (Zhang et al., 2016). In addition, when the overlying pressure on the formation is greater than the compressive strength of the rock, the brittle mineral such as quartz will break up and form microcracks which provide space for the free gas. Some scholars believe that quartz has a strong pressure resistance and can form a rigid grid, which is conducive to pore preservation (Luo et al., 2019).
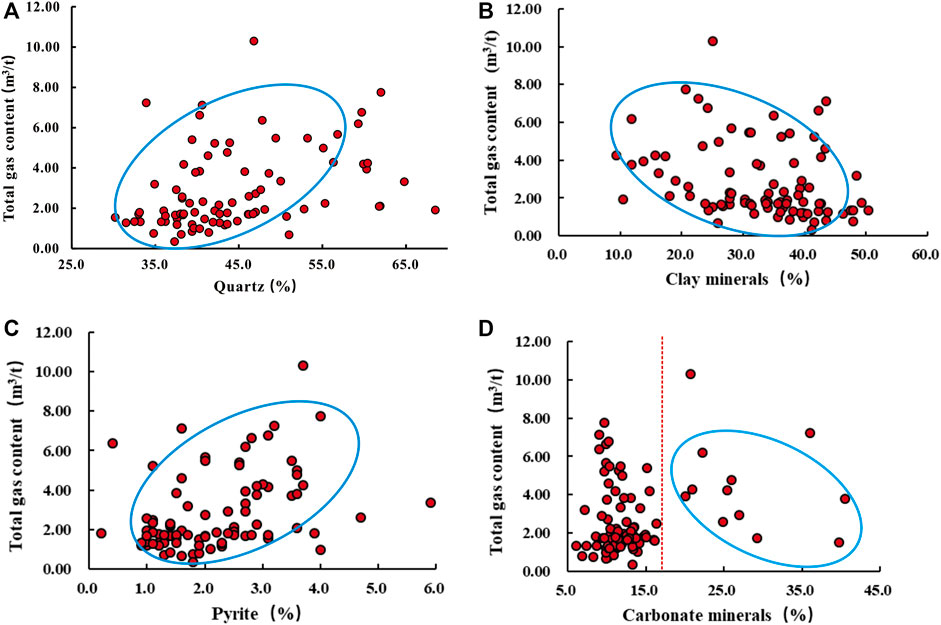
FIGURE 8. Relationship between the minerals and the total gas contents of the Longmaxi Formation shale in the Changning area. (A) Relationship between the quartz and the total gas contents; (B) Relationship between the clay minerals and the total gas contents; (C) Relationship between the pyrite and the total gas contents; (D) Relationship between the carbonate minerals and the total gas contents.
Unlike quartz, the total gas content decreases with increasing clay mineral content (Figure 8B). Clay minerals have a layered structure, and the interlayers provide space for the adsorption of shale gas. In theory, the total gas content should increase with the increase of clay mineral content, but in fact the opposite is true. Some scholars believe that the reason for this is that the presence of water occupies the surface adsorption sites of the hydrophilic clay minerals, which greatly reduces the amount of adsorbed methane gas (Ross and Bustin, 2008). And studies have proven that the water content reduces methane adsorption in the Midland Valley oil shale (Merkel et al., 2015; Merkel et al., 2016). On the other hand, clay minerals will increase in volume after absorbing and expanding, which will block the existing pores in the rock and reduce the free gas content.
Pyrite is common in the Longmaxi shale in the Changning area, and the total shale gas content increases with the increase of pyrite content (Figure 8C). Some scholars have shown that iron in pyrite plays an important role in organic matter deposition, and a high iron content is conducive to organic matter enrichment (Nie and Zhang, 2012). In the deep-water environment where shale was originally deposited, marine life is highly productive, which enables a large amount of organic carbon to be transported and produces a high-intensity sulfate-reducing environment. S2- in pore water combines with iron to form pyrite and is buried accompanied by organic matter, the development of this type of primary pyrite represents that the reducing environment is conducive to the enrichment and preservation of organic matter (Luo et al., 2019).
The carbonate content of the Longmaxi shale in the Changning area is relatively low, the dolomite content is between 0.7 and 11.5%, with an average content of 10.8%; the calcite content ranges from 4.4 to 38.8%, with an average content of 3%. The carbonate mineral content in the shale sample is mostly concentrated at 5–17%. At this time, the carbonate mineral content is relatively low and the total gas content has no significant correlation with the carbonate mineral content. When the carbonate mineral content is between 17 and 45%, there is a weak negative correlation between the total gas content and carbonate minerals (Figure 8D). This indicates that when the carbonate mineral content is higher, the total gas content will decrease, which may be due to the calcite cementation that will block some pores and microfractures, and then reduce the free space of the shale gas.
Conclusion
This work performed the gas-bearing characteristics of the Longmaxi shale in the Changning area by means of the isothermal adsorption experiments, field desorption experiments, and well log interpretation. Afterward, the effect of factors such as lithofacies, TOC, and mineral composition on the gas content is discussed. The following conclusions could be drawn:
1) In the Changning area, the Longmaxi shale has good adsorption capacity, and the adsorption capacity decreases from the bottom to the top in the vertical direction.
2) Vertically, the total gas content decreases from the bottom to the top, which is a consistent trend with the loss gas, desorbed gas, and residual gas. In terms of the gas content indicator, S1L11-1, S1L11-2, and S1L11-3 of S1L11 are the most economically beneficial layers in the Longmaxi Formation, as the total gas contents of them are much higher than the commercial mining standard of 2 m3/t.
3) The free gas content in the vertical direction increased from the bottom to the top, while the adsorbed gas content decreased, as the adsorption capacity of the Longmaxi shale decreases from the bottom to the top. With the top of S1L11-3 as the circumscription, the adsorbed gas accounts for the main part of the shale gas in the lower part, and the free gas shale gas in the upper part.
4) There is a strong positive correlation between the total gas content and organic carbon content, the gas content of the Longmaxi Formation shale in the Changning area is dominated by TOC, which have a positive effect on the enrichment of free gas and adsorbed gas.
5) The lithofacies of shale is also an important influencing factor in the gas content of the Longmaxi shale in the Changning area. The mixed siliceous shale and argillaceous siliceous shale of which quartz is a major mineral of shale have higher gas content, and are dominant gas-bearing shale lithofacies.
6) In addition, mineral composition also has a certain effect on the total gas content of shale. Quartz and pyrite have a positive effect on higher gas content, while clay minerals and more carbonate minerals have a negative effect on it (Li et al., 2012).
Data Availability Statement
The raw data supporting the conclusion of this article will be made available by the authors, without undue reservation.
Author Contributions
CL contributed as the major author of the article. LC and XT determined the context of the article and modified the details of the article. CJ, ZN and DH conducted isothermal adsorption experiments and some logging interpretations. XC modified some of the figures.
Funding
This study was supported by the National Natural Science Foundation of China (NSFC) (No. 41602147) and Science and Technology Cooperation Project of the CNPC-SWPU Innovation Alliance (Grant No. 2020CX020000).
Conflict of Interest
CL was employed by Shenzhen Branch of CNOOC LTD. CJ, ZN, and DH were employed by Sichuan Changning Natural Gas Development Co., LTD.
The remaining authors declare that the research was conducted in the absence of any commercial or financial relationships that could be construed as a potential conflict of interest.
Publisher’s Note
All claims expressed in this article are solely those of the authors and do not necessarily represent those of their affiliated organizations, or those of the publisher, the editors, and the reviewers. Any product that may be evaluated in this article, or claim that may be made by its manufacturer, is not guaranteed or endorsed by the publisher.
References
Abouelresh, M. O., and Slatt, R. M. (2012). Lithofacies and Sequence Stratigraphy of Barnett Shale in East-central Fort Worth Basin, Texas. AAPG Bull. 96 (1), 1643–1666. doi:10.1306/04261110116
Ambrose, R. J., Hartman, R. C., Diazc, M., Akkutlu, I. Y., and Sondergeld, C. H. (2012). Shale Gas-In-Place Calculations Part I: New Pore-Scale Considerations. SPE J. 17 (1), 219–229. doi:10.2118/131772-pa
Bertard, C., Bruyet, B., and Gunther, J. (1970). Determination of Desorbable Gas Concentration of Coal (Direct Method). Int. J. Rock Mech. Mining Sci. Geomechanics Abstr. 7 (1), 43–65. doi:10.1016/0148-9062(70)90027-6
Bowker, K. A. (2007). Barnett Shale Gas Production, Fort Worth Basin: Issues and Discussion. Bulletin 91 (4), 523–533. doi:10.1306/06190606018
Chen, L., Wang, G., Yang, Y., Jing, C., Chen, M., and Tan, X. (2019). Geochemical Characteristics of Bentonite and its Influence on Shale Reservoir Quality in Wufeng-Longmaxi Formation, South Sichuan Basin, China. Energy Fuels and Fuels 33, 12366–12373. doi:10.1021/acs.energyfuels.9b03510
Chen, Y. Q., Guo, E. P., and Qi, Y. D. (2015). A Method for Determining Langmuir′s Volume and Langmuir′s Pressure. Fault-Block Oil and Gas Field 22 (1), 67–69. (in Chinese with English abstract). doi:10.6056/dkyqt201501014
Cheng, G., Jiang, B., Li, M., Li, F., and Zhu, M. (2021). Structural Evolution of Southern Sichuan Basin (South China) and its Control Effects on Tectonic Fracture Distribution in Longmaxi Shale. J. Struct. Geology. 153, 104465. doi:10.1016/j.jsg.2021.104465
Curtis, J. B. (2002). Fractured Shale-Gas Systems. AAPG Bull. 86 (11), 1921–1938. doi:10.1306/61eeddbe-173e-11d7-8645000102c1865d
Gou, Q., and Xu, S. (2019). Quantitative Evaluation of Free Gas and Adsorbed Gas Content of Wufeng-Longmaxi Shales in the Jiaoshiba Area, Sichuan Basin, China. Adv. Geo-energ. Res. 3 (3), 258–267. doi:10.26804/ager.2019.03.04
Guo, X. S., Li, Y. P., Borjigen, T., Wang, Q., Yuan, T., Shen, B. J., et al. (2020). Hydrocarbon Generation and Storage Mechanism of Deep-Water Shelf Shales of Ordovician Wufeng Formation - Silurian Longmaxi Formation in Sichuan Basin, China. Pet. Exploration Dev. 47 (1), 204–213. doi:10.1016/s1876-3804(20)60019-2
Hammes, U., Hamlin, H. S., and Ewing, T. E. (2011). Geologic Analysis of the Upper Jurassic Haynesville Shale in East Texas and West Louisiana. AAPG Bull. 95 (10), 1643–1666. doi:10.1306/02141110128
Hemmesch, N. T., Harris, N. B., Mnich, C. A., and Selby, D. (2014). A Sequence-Stratigraphic Framework for the Upper Devonian Woodford Shale, Permian Basin, West Texas. Bulletin 98 (1), 23–47. doi:10.1306/05221312077
Hicky, J. H., and Henk, B. (2007). Lithofacies Summary of the Mississppian Barnett Shale, Mitchell 2 T. P. Sims Well, Wise County, Texas. AAPG Bull. 91 (4), 437–443. doi:10.1306/12040606053
Hill, D. G., and Nelson, C. R. (2000). Reservoir Properties of the Upper Cretaceous Lewis Shale, a New Natural Gas Play in the San Juan Basin. AAPG Bulletin 84, 1240. doi:10.1306/a9673d60-1738-11d7-8645000102c1865d
Jarvie, D. M., Hill, R. J., Ruble, T. E., and Pollastro, R. M. (2007). Unconventional Shale-Gas Systems: The Mississippian Barnett Shale of north-central Texas as One Model for Thermogenic Shale-Gas Assessment. Bulletin 91 (4), 475–499. doi:10.1306/12190606068
Li, W. G., Yang, S. L., Xu, J., and Dong, Q. (2012). A New Model for Shale Adsorptive Gas Amount under a Certain Geological Conditions of Temperature and Pressure. Nat. Gas Geosci. 23 (4), 791–796.
Li, J., Wu, Q. Z., Lu, J., and Jin, W. J. (2018). To Quantitatively Determine the Adsorption and Free Methane Volume Content in Shale Gas Core Based on NRM Technique. Well Logging Tech. 42 (3), 315–320. (in Chinese with English abstract). doi:10.16489/j.issn.1004-1338.2018.03.012
Li, A., Han, W., Fang, Q., Memon, A., and Ma, M. (2020). Experimental Investigation of Methane Adsorption and Desorption in Water-Bearing Shale. Capillarity 3 (3), 45–55. doi:10.46690/capi.2020.03.02
Liu, Y., Wu, B., Gong, Q. S., and Cao, H. A. (2019). Geochemical Characteristics of the Lower Silurian Longmaxi Formation on the Yangtze Platform, South China: Implications for Depositional Environment and Accumulation of Organic Matters. J. Asian Earth Sci. 184, 1–11. doi:10.1016/j.jseaes.2019.104003
Loucks, R. G., and Ruppel, S. C. (2007). Mississippian Barnett Shale: Lithofacies and Depositional Setting of a Deep-Water Shale-Gas Succession in the Fort Worth Basin, Texas. Bulletin 91 (4), 579–601. doi:10.1306/11020606059
Luo, S. Y., Liu, A., Li, H., Chen, X. H., and Zhang, M. (2019). Gas-bearing Characteristics and Controls of Cambrian Shuijingtuo Formation in Yichang Area, Middle Yangtze Region. Pet. Geology. Exp. 41 (1), 60–63. (in Chinese with English abstract). doi:10.11781/sysydz201901056
Mastalerz, M., Strapoc, D., and Schimmelmann, A. (2010). Geochemical Constraints on the Origin and Volume of Gas in the New Albany Shale (Devonian Mississippian), Eastern Illinois Basin. Am. AAPG Bull. 94, 1713–1740. doi:10.1306/06301009197
Merkel, A., Fink, R., and Littke, R. (2015). The Role of Pre-adsorbed Water on Methane Sorption Capacity of Bossier and Haynesville Shales. Int. J. Coal Geology. 147-148 (1), 1–8. doi:10.1016/j.coal.2015.06.003
Merkel, A., Fink, R., and Littke, R. (2016). High Pressure Methane Sorption Characteristics of Lacustrine Shales from the Midland Valley Basin, Scotland. Fuel 182 (1), 361–372. doi:10.1016/j.fuel.2016.05.118
Nie, H. K., and Zhang, H. K. (2012). Shale Gas Accumulation and Gas Content Calculation: A Case Study of Sichuan Basin and its Periphery in the Lower Paleozoic. Acta Geologica Sinica 86 (2), 349–361.
Ross, D. J. K., and Bustin, R. M. (2007). Shale Gas Potential of the Lower Jurassic Gordondale Member, Northeastern British Columbia, Canada, Northeastern British Columbia, Canada. Bull. Can. Pet. Geology. 55 (1), 51–75. doi:10.2113/gscpgbull.55.1.51
Ross, D. J. K., and Bustin, R. M. (2008). Characterizing the Shale Gas Resource Potential of Devonian-Mississippian Strata in the Western Canada Sedimentary basin: Application of an Integrated Formation Evaluation. Bulletin 92 (1), 87–125. doi:10.1306/09040707048
Tang, Y., Li, L. Z., and Jiang, S. X. (2014). A Logging Interpretation Methodology of Gas Content in Shale Reservoirs and its Application. Nat. Gas Industry 34 (12), 46–54. doi:10.3787/j.issn.1000-0976.2014.12.006
Wang, Y. M., Dong, D. Z., Li, J. Z., Wang, S. J., Li, X. J., Wang, L., et al. (2012). Reservoir Characteristics of Shale Gas in Longmaxi Formation of the Lower Silurian, Southern Sichuan. Acta Acta Petrolei Sinica 33 (4), 551–561. doi:10.7623/syxb201204003
Wang, F., Guan, J., Feng, W., and Bao, L. (2013). Evolution of Overmature marine Shale Porosity and Implication to the Free Gas Volume. Pet. Exploration Dev. 40 (6), 819–824. doi:10.1016/s1876-3804(13)60111-1
Wang, Y. M., Wang, S. F., Dong, D. Z., Li, X. J., Huang, J. L., Zhang, C. C., et al. (2016). Lithofacies Characterization of Longmaxi Formation of the Lower Silurian, Southern Sichuan. Earth Sci. Front. 23 (1), 119–133. doi:10.13745/j.esf.2016.01.011
Wang, Y., Wang, H., Zhang, C., Li, X., and Dong, D. (2017). Fracture Pore Evaluation of the Upper Ordovician Wufeng to Lower Silurian Longmaxi Formations in Southern Sichuan Basin, SW China. Pet. Exploration Dev. 44 (4), 563–572. doi:10.1016/s1876-3804(17)30065-4
Wei, Q., Yan, B., and Xiao, X. (2015). Research Progress on the Desorption Methods of Shale Gas. Nat. Gas Geosci. 26 (9), 1657–1665. doi:10.11764/j.issn.1672-1926.2015.09.1657
Xiong, W., Guo, W., Liu, H. L., Gao, S. S., Hu, Z. M., and Yang, F. R. (2012). Shale Reservoir Characteristics and Isothermal Adsorption Properties. Nat. Gas Industry 32 (1), 113–116. doi:10.3787/j.issn.1000-0976.2012.01.025
Yan, J. P., Zhang, T. W., Li, Y. F., Lv, H. G., and Zhang, X. L. (2013). Effect of Organic Matter Characteristics on Methane Adsorption in Shale. J. China Coal Soc. 38 (5), 805–811. doi:10.1002/pca.1212
Zhang, L. H., Tang, H. M., Chen, G., Li, Q. R., and He, J. Y. (2014). Adsorption Capacity and Controlling Factors of the Lower Silurian Longmaxi Shale Play in Southern Sichuan Basin. Nat. Gas Industry 34 (2), 65–67. doi:10.3787/j.issn.1000-0976.2014.12.008
Zhang, C. C., Wang, Y. M., Dong, D. Z., and Guan, Q. Z. (2016). Brittleness Characteristics of Wufeng - Longmaxi Shale in Changning Region, Southern Sichuan, China[J]. Nat. Gas Geosci. 27 (9), 1629–1639. doi:10.11764/j.issn.1672-1926.2016.09.1629
Zhang, X. M., Shi, W. Z., Shu, Z. G., Xu, Z., Wang, C., Yuan, Q., et al. (2017). Calculation Model of Shale Gas Content and its Application in Fuling Area. Earth Sci. 42 (7), 1157–1168. doi:10.3799/dqkx.2017.094
Keywords: gas-bearing, Longmaxi Formation, shale gas, Changning area, Southern Sichuan Basin
Citation: Lu C, Chen L, Jing C, Tan X, Nie Z, Chen X and Heng D (2022) Gas-Bearing Characteristics of the Longmaxi Formation Shale in the Changning Area, Southern Sichuan Basin, SW China. Front. Earth Sci. 10:755690. doi: 10.3389/feart.2022.755690
Received: 09 August 2021; Accepted: 04 April 2022;
Published: 10 May 2022.
Edited by:
Yiwen Ju, University of Chinese Academy of Sciences, ChinaReviewed by:
Peng Cheng, Guangzhou Institute of Geochemistry (CAS), ChinaWei Wu, Henan Polytechnic University, China
Copyright © 2022 Lu, Chen, Jing, Tan, Nie, Chen and Heng. This is an open-access article distributed under the terms of the Creative Commons Attribution License (CC BY). The use, distribution or reproduction in other forums is permitted, provided the original author(s) and the copyright owner(s) are credited and that the original publication in this journal is cited, in accordance with accepted academic practice. No use, distribution or reproduction is permitted which does not comply with these terms.
*Correspondence: Lei Chen, Y2wyMTFAMTI2LmNvbQ==