Abstract
Progressively, more dredged sediments are being reused for engineering projects. For example, the Marker Wadden is a new wetland constructed in lake Markermeer, the Netherlands, with dredged cohesive sediments originating from the bed of the lake. Such dredged sediments are often dominated by cohesive sediment particles with varying amounts of sand and organic matter. In addition, during and after the construction process, the material consolidates and is often compressed from a very loose state into a significantly denser condition. To assess the mechanical behavior of this material, the compressibility of the Markermeer dredged sediment samples with various sand and organic matter contents was analyzed with incremental loading oedometer tests, whereas the undrained shear strength was studied using the fall cone test. The behavior was theoretically analyzed assuming a fractal structure of the sediment and applying power law constitutive equations for effective stress, hydraulic conductivity, and undrained shear strength. These constitutive equations, usually used at low initial sediment densities, worked well at the relatively high initial densities studied and proved to be a useful tool to identify the transition fines content TFC. The constitutive equations were put in context with indicators traditionally used in soil mechanics. Samples, each with an identical composition of the fines fraction (particles< 63 μm), but with a sand content varying from 9 to 40%, showed the same compressibility and undrained shear strength behavior when considering the sand a filler material. For a natural sand content of 70%, the behavior was dominated by sand. The organic matter oxidation was observed to drastically decrease the compressibility and the shear strength, and even to decrease the amount of sand needed to exhibit sand-dominated behavior, showing the importance of the reactivity or state of organic matter on the TFC.
Introduction
Large amounts of sand are used in infrastructure projects and industries. Sandy sediments are becoming scarce (Vörösmarty et al., 2003), while billions of cubic meters of fine cohesive sediments are dredged worldwide to maintain navigation channels. It is likely that significantly more of these fines will be used in infrastructure development (Barciela-Rial et al., 2021). An example is the Marker Wadden pilot, a new wetland constructed in lake Markermeer, the Netherlands, using dredged cohesive sediment from the bed of the lake itself. However, dredged sediments are more complex to use because they consist of a heterogeneous mixture of water, fines, sand, and organic matter. Furthermore, the composition of the dredged sediment varies largely within the same natural system, which presents a challenge when using these sediments in building projects. This large variation of sediment composition occurs also at lake Markermeer, as shown by Barciela–Rial et al. (2020).
A key aspect in building with dredged sediment projects is to understand how the heterogeneity in sediment composition will affect the consolidation and strength behavior and how, based on a limited number of laboratory tests, the behavior of a wide range of compositions can be characterized. The sand content can largely vary locally at the dredging site, and sand segregation can occur during dredging, transportation, and deposition. The effect of the sand content on the mechanical properties of clayey sediments has been substantially studied over the last decades. For example, Cabalar and Mustafa (2015) showed a decrease in the liquid limit and undrained shear strength with an increasing percentage of sand in a clay matrix. Al-Shayea (2001) found a large decrease in permeability with decreasing sand content from 100 to 60% sand, below which the reduction was less significant. Other authors (e.g., Thevanayagam, 1998; Monkul and Ozden, 2007; Peters and Iv, 2010; Jacobs, 2011) studied the effect of the sand content on the behavior of clay–sand mixtures and determined a transitional fines content (TFC) threshold. This threshold characterizes the amount of fines at which a sand-dominated sediment changes from a granular behavior to a cohesive fines-dominated behavior. Simpson and Evans (2016) found that the TFC depended on the mechanical property studied, that is, they found a threshold of 20% fines for consistency, while 40–60% fines for conductivity. At lower fines content, hydraulic conductivity increases because pores become more interconnected, creating pore water flow paths. Miftah et al. (2020) found a transitional fines content of 10% for shear strength, that is, additional fines increased the shear strength until reaching the TFC of 10% fines, after which shear strength decreased. The effect of organic matter (OM) has also been studied. For example, Santagata et al. (2008) related an increase of 8–10% in OM with a three- to fivefold increase in permeability of a normally consolidated soil, and Zentar et al. (2009) found an increase in the consistency limits with increasing OM content. In a study linked to the work presented here, Barciela–Rial et al. (2020) found a correlation between the lability (reactivity) of the OM and the drying behavior of the sediment: labile OM decreased the unsaturated hydraulic conductivity and increased the water retention capacity at low matric suctions. They found that the effect on water retention was even larger for coarse-textured than for fine-textured samples. Moreover, in building projects using dredged sediments containing OM, the OM may oxidize over time during the dredging and filling processes and specially during drying as the material is more in contact with the atmosphere and which can further change properties (e.g., Oliveira et al., 2017). The TFC seems to be both soil- and process-dependent, which makes the comparison of findings challenging.
The initial densities of the dredged sediment are at the interface between those traditionally studied in fluid and soil mechanics, which have not been studied widely. The indicators used in these two disciplines are different, and there is a knowledge gap between the fields. The sediments investigated in this work have a density between those typically used by the two disciplines, offering an opportunity to compare the relationships and coefficients traditionally used in fluid and soil mechanics. Traditionally, the mechanical behavior of dense soils at large stresses is modeled with exponential relations. From the perspective of low-density virgin soils, derived from soil particles settling in water, Merckelbach and Kranenburg (2004a) presented a model that assumes scale invariance or fractal structure of the sediment. From this model, constitutive equations for effective stress and permeability are derived. These equations can be used in a large strain model such as the Gibson model (Gibson et al., 1967). The Merckelbach and Kranenburg model yields power relationships between the volumetric concentration of solids (defined as the ratio between the volume of solids and the total volume) and hydraulic conductivity and effective stress in normally consolidated sediments. Winterwerp and van Kesteren (2004) promoted the use of such power law relationships for these soft dredged sediments, instead of exponential relationships traditionally used with denser soils (e.g., Wichman, 1999; Bartholomeeusen et al., 2002; Van Kessel and de Boer, 2009). Various studies have shown that the density can be modeled with a fractal coefficient based on the constitutive relations found by Merckelbach and Kranenburg (Chassagne, 2019). Barciela–Rial (2019) showed that the Merckelbach and Kranenburg model works well with soft dredged sediments.
In this study, the consistency (Atterberg limits), undrained shear strength, and compressibility of natural as well as sieved, and treated (dried–rewet and oxidized) Markermeer dredged sediment samples with varying sand and organic matter contents are analyzed. The differences in undrained shear strength upon fall cone tests and compressibility upon incremental loading (IL) oedometer testing and the TFC are quantified using the Merckelbach and Kranenburg constitutive equations. The results put these equations in context with indicators traditionally used in soil mechanics and provide insights useful for building with dredged sediment projects, in particular regarding varying sand contents and the effect of oxidation of organic matter.
Methods
In this section, the sampling sites and the sample collection and preparation method are presented, including the composition of the different samples. The tests performed for determining the sample composition as well as the compressibility and shear strength are described.
Sediment Collection and Preparation
Different sediment samples were collected with a Van Veen grab at two locations in lake Markermeer: the southwest (SW) and the northeast (NE) sites (see Figure 1). The upper layer of the lake bed consists of a thin (circa 0.1 m) layer of soft sediment, of which only the few upper millimeters are oxic (Van Duin, 1992). The sediment composition of this soft sediment layer is detailed in Table 1, labeled as sample NE2B-70%. Underneath this soft sediment layer, a thick layer of Holocene deposits (clay/silt mixtures, peat, or sand) is present (Rijkswaterstaat, 1995). The material from this layer tested in this study is referred to as clayey silt and was sampled at the southwest sampling site (Table 1). Markermeer sediment mineralogy is dominated by illite and smectite at all sampling sites, while kaolinite (<11%) and chlorite (<6%) are present in small amounts (see Barciela–Rial, 2019). After sampling, all samples were transported to the laboratory and stored in dark conditions at 4°C.
FIGURE 1

Location of lake Markermeer (left) and sampling sites (right). Source image: Publieke Dienstverlening Op de Kaart (PDOK) 2016.
TABLE 1
| Site | Depth | Type | ID | Sand | Silt | Clay | D50 | TOM | TOC | ρs | LL | PL | PI |
|---|---|---|---|---|---|---|---|---|---|---|---|---|---|
| [m] | [%mass] | [μm] | [%] | [%] | [kg/m3] | [%] | [%] | [%] | [%] | [%] | |||
| Southwest | 0.1–0.5 | Bulk clayey silt | SW1B | 8 | 63 | 29 | 10 | 8.6 | 3.3 | 2,530 | 104 | 46 | 58 |
| Bulk treated | SW1T | 8a | 63a | 29a | 10a | 6.7 | 2.0 | 2,620 | 60 | 31 | 29 | ||
| Northeast | 0.0–0.1 | Bulk silty sandb | NE2B-70% | 69 | 21 | 10 | 87 | 2.1 | 0.7 | 2,640 | 41 | 25 | 16 |
| Laboratory prepared | NE2B-0% | 0 | 68 | 32 | 17 | 5.1 | 2.2 | 2,540 | 89 | 34 | 55 | ||
| Laboratory prepared | NE2B-10% | 10 | 61 | 29 | 13 | 4.8 | 1.9 | 2,550 | 80 | 30 | 50 | ||
| Laboratory prepared | NE2B-20% | 20 | 54 | 26 | 25 | 3.8 | 1.5 | 2,570 | 69 | 27 | 42 | ||
| Laboratory prepared | NE2B-40% | 40 | 41 | 19 | 51 | 3.4 | 1.2 | 2,600 | 52 | 23 | 29 | ||
| Treated | NE2B-40%-T | 40a | 41a | 19a | 51a | 2.1 | 0.5 | 2,700 | 33 | 23 | 10 |
Sediment properties of all samples studied.
Not measured. Assumed to not vary with the oxidation treatment.
Mother sample from the sampling site NE.
For the incremental loading (IL) oedometer test and the fall cone test, sample NE2B-70% (NE site) was used as the “mother” sample (where the suffix indicates the percentage sand content). From this material, subsamples were prepared in the laboratory with 0, 10, 20, and 40% sand content with respect to the total dry mass (Msand/Mdry;total): samples NE2B-0%, NE2B-10%, NE2B-20, and NE2B-40%, respectively. These subsamples were obtained by separating the fines and sand fractions by sieving and recombining afterward. The value of the % sand contents in mass is almost identical to their correspondent % sand in volume because of the similar particle densities measured for the sand and fine fractions. The water content with respect to the fine fraction was kept constant for all subsamples. For the fall cone test, a sample from the deeper clayey silt material SW1B was also tested.
Additionally, a subsample from the 40% sand sample from the NE (sample NE2B-40%), tested with IL and fall cone tests, and sample SW1B, tested with the fall cone test, were oxidized to mimic the behavior of the Markermeer sediment after being in contact with atmospheric conditions for a long time. As natural oxidation is slow, the oxidation process was accelerated in the laboratory. This was done by treatment with hydrogen peroxide (H2O2), following an adapted procedure from the British Standards (British Standards Institute, 1990a) including two drying–rewetting cycles. First, the samples were dried in an oven at a constant temperature of 50°C until there was no further mass loss. Then, subsamples of 100 g were rewet by adding demineralized water and oxidized according to the standard. After centrifuging to remove the oxidant, the material was dried again at 50°C and rewet with filtered Markermeer water. pH was measured before and after oxidation by immersing a pH electrode in the samples, which showed that the treatment did not change the pH of the sediment. The labels of the treated samples are identified with the identifier T: samples SW1BT and NE2B-40%-T. The origin and composition of all the samples for the IL and fall cone tests are described in Table 1.
Sample Characterization
Atterberg limits and undrained shear strength were determined according to ISO (2016) and ISO/TS (2004b), respectively. For the liquid limit (LL), 80 g/30° tip angle fall cone tests were performed. The plastic limit (PL) was determined using the rolling thread test. The total organic matter (TOM) content was obtained by loss on ignition (LOI), according to the European Standard (EN, 2012), and the amount of total organic carbon (TOC) and its reactivity were determined using the Rock Eval machine (Behar et al., 2001). The particle density was measured using a gas pycnometer (ISO/TS, 2004c), and the particle size was determined using a hydrometer and by dry sieving according to the British Standards Institute (1990b). Sample characteristics are presented in Table 1. In this table, sand particles are defined as those with size >63 μm, silt as the particles between 2 and 63 μm, and clay particles as those smaller than 2 μm.
Undrained Shear Strength
The undrained shear strength cu was obtained with the fall cone test following the ISO/TS (2004b) standard for each sample prepared with a range of different water contents.
Incremental Loading Oedometer Test
IL tests were undertaken according to ISO/TS (2004a) to determine the compression and consolidation properties. With an IL test, a cylindrical soil sample is enclosed in a stiff steel ring in between two porous stones and incrementally loaded through the upper porous stone. The typical test interpretation is based on the Terzaghi consolidation theory (Terzaghi, 1923), which assumes small deformations. For a comparison with the more general large strain consolidation theory (Gibson et al., 1967), check the supplementary materials. As the initial water contents of the thick dredged sediment samples studied were higher than soil samples traditionally studied with this device, the loading protocol was adapted according to the initial water content of the sample to ensure small deformations to enable typical test interpretation to be undertaken. For most of the samples, the initial load was 0.6 kPa (Table 3). The IL experiments were performed in a climate-controlled room with a constant temperature of 10°C. The bulk and dry densities of the test specimens were determined by weighing before the test and after drying for 24 h in an oven at 105°C.
The samples tested had 0, 10, 20, 40, and 70% sand, and the tests are thus referred to as I-NE2B-0, I-NE2B-10, I-NE2B-20, I-NE2B-40, and III-NE2B-70%, where the first identifier (I, II, or III) indicates differences in the initial ratio of the water content and LL. Two additional IL tests were performed to investigate the different compression behaviors of the treated (oxidized) samples with 40% sand content with different initial water contents: test II-NE2B-40%-T and test III-NE2B-40%-T. Test II-NE2B-40%-T was started at a water content of 1.6 times the LL, and test III-NE2B-40%-T at 1.2 LL. This corresponds with a water content of the fines fraction of 0.9 and 0.7 [Mw/Ms,fines], where Ms,fines is the dry mass of the fraction <63 μm (Table 2). The 1.6 LL water content test was selected because it was the maximum water content of the sample below which no self-weight consolidation occurred (Barciela–Rial, 2019). The reduction in the water content until 1.6 LL (sample II-NE2B-40%-T) or below (sample III-NE2B-40%-T) was done by atmospheric drying.
TABLE 2
| Sample ID | Fines content | Initial | Final | ||||||
|---|---|---|---|---|---|---|---|---|---|
| [−] | w [−][Mw/Ms] | w/LL [−] | w fines [−][Mw/Ms,fines] | [−] | w [−] [Mw/Ms] | w/LL [−] | w fines [−][Mw/Ms,fines] | [−] | |
| I- NE2B-0% | 1.0 | 1.38 | 1.55 | 1.38 | 0.23 | 0.62 | 0.70 | 0.62 | 0.39 |
| I-NE2B-10% | 0.9 | 1.23 | 1.54 | 1.36 | 0.23 | 0.58 | 0.73 | 0.65 | 0.38 |
| I- NE2B-20% | 0.8 | 1.05 | 1.53 | 1.31 | 0.24 | 0.52 | 0.75 | 0.65 | 0.38 |
| I-NE2B-40% | 0.6 | 0.80 | 1.53 | 1.33 | 0.24 | 0.38 | 0.74 | 0.64 | 0.38 |
| III- NE2B-70% | 0.3 | 0.42 | 1.02 | 1.39 | 0.22 | 0.28 | 0.68 | 0.93 | 0.29 |
| II- NE2B-40%-T | 0.6 | 0.53 | 1.62 | 0.89 | 0.31 | 0.30 | 0.90 | 0.50 | 0.44 |
| III- NE2B-40%-T | 0.6 | 0.40 | 1.20 | 0.66 | 0.39 | 0.23 | 0.71 | 0.39 | 0.50 |
Initial and final water contents of the IL tests, including water content of the fine fraction and ratios between initial and final water contents and the liquid limit.
For the second additional test (III-NE2B-40%-T) and for the 70% sand content test (III-NE2B-70%), a different loading program with higher initial stresses was applied. This was necessary because of the higher stiffness of these samples. The three different loading plans (for the different initial fines water contents I, II, and III) are described in Table 3.
TABLE 3
| Series I | Series II | Series III | |
|---|---|---|---|
| Loading step 1 | 0.6 | 0.6 | 3.1 |
| Loading step 2 | 1.3 | 1.3 | 6.3 |
| Loading step 3 | 4.3 | 4.3 | 12.6 |
| Loading step 4 | 10.2 | 10.2 | 25.1 |
| Loading step 5 | 25.0 | 25.0 | 50.3 |
| Loading step 6 | — | 57.9 | 100.5 |
| Loading step 7 | — | 119.1 | — |
| Loading step 8 | — | 241.3 | — |
IL tests loading plan (kPa).
Interpretation Model
The power law constitutive equations for clays presented by Merckelbach and Kranenburg (2004a) are based on the volumetric concentration of sediment . When only fines (i.e., particles <63 µm) are present, where is the volumetric concentration of fines. However, if the sediment also contains some passive sand (i.e., there is not a sand skeleton), can be adapted to (Merckelbach and Kranenburg, 2004a). This is because sand particles in this situation merely act as space-filling material, and the behavior of the sediment is dominated by the fine fraction. can then be calculated according to Eq. 1:where is the volumetric concentration of sand. When sand is present, should be used instead of in the equations presented in this section.
In the constitutive equations from Merckelbach and Kranenburg, the relation theory between the vertical effective stress and the volumetric concentration is given as followswhere the coefficient is material-specific and nf [−] is the fractal dimension, representing the fractal structure of the sediment flocs.
The undrained strength cu can be approximated by the yield strength (e.g., Winterwerp and van Kesteren, 2004). Therefore, cu takes the mathematical form of the effective stress model of Merckelbach and Kranenburg. The empirical intrinsic parameter Ky [Pa], representing the effect of the sediment particles on the strength of the sediment, can then be obtained as follows (Winterwerp and van Kesteren, 2004):
On the other hand, for denser soils, often exponential laws and traditional soil mechanics indicators are used. The compression index Cc is often used as an indicator to quantify the compressibility behavior using the IL oedometer test. This Cc coefficient is defined in the ISO/TS 17892 (2004a) as follows:where is the change in void ratio along a linear section of the compression curve and is the change in logarithm of applied stress along that linear section of the compression curve (ISO/TS 17892-5, 2004a), which at the end of each loading steps equals to the effective stress. Next to this traditional compression index, the modified compression index can be calculated by using the modified void ratio in Eq. 4. This modified void ratio is defined as follows:
To allow a comparison between the power law relation (
Eq. 4) and the commonly calculated compression index,
Eq. 4can be written using volumetric concentration definitions as follows:
where instead of
,
can be used to modify for the sand content for fine contents above the TFC, thus obtaining
. In this article, the power-law plots between
cuand
against
were used to identify the TFC. This criterion is based on the following three assumptions:
1. Further to Winterwerp and van Kestern (2004), the transition between cohesive and non-cohesive behaviors occurs at a plasticity index of 7%, which yields a critical clay content in the activity plot.
2. Further to Kranenburg (1994), the mechanical properties of cohesive sediment follow power law relations.
3. Further to Merckelbach and Kranenburg (2004a), these power law relations are unaffected by the presence of some sand, as long as no sand skeleton is formed, that is, below the critical sand content.
Thus, the power law relations for samples at different sand content are expected to collapse or overlap on one single curve after correcting for this sand content, as long as this is below its critical value.
Results
Undrained Shear Strength
Figure 2 shows the undrained shear strength (cu) results. Herein, cu is plotted against the non-corrected (i.e., ) and . They follow a linear relationship on the log–log scale (i.e., power law). For each sample, a decrease in undrained shear strength with a larger water content (lower or ) is observed. Plotting against does not allow to identifying the TFC nor determining patterns of similar behavior. However, plotting against shows that the samples containing 0, 10, 20, and 40% sand overlap because they have the same OM composition (same mother sample). Thus, the TFC has not yet been reached at 40% sand. This is not the case for the sample with 70% sand content, implying that a TFC somewhere between 40 and 70% sand content. Therefore, the mechanical behavior of sample NE2B-70% is governed by a granular skeleton. Other authors found TFCs at similar sand content. For example, Thevanayagam (1998) found that the clay matrix governed the undrained shear strength behavior below 70% (mass) sand content, while Kumar and Wood (1999) found a TFC between 30 and 40% (mass) fines contents.
FIGURE 2
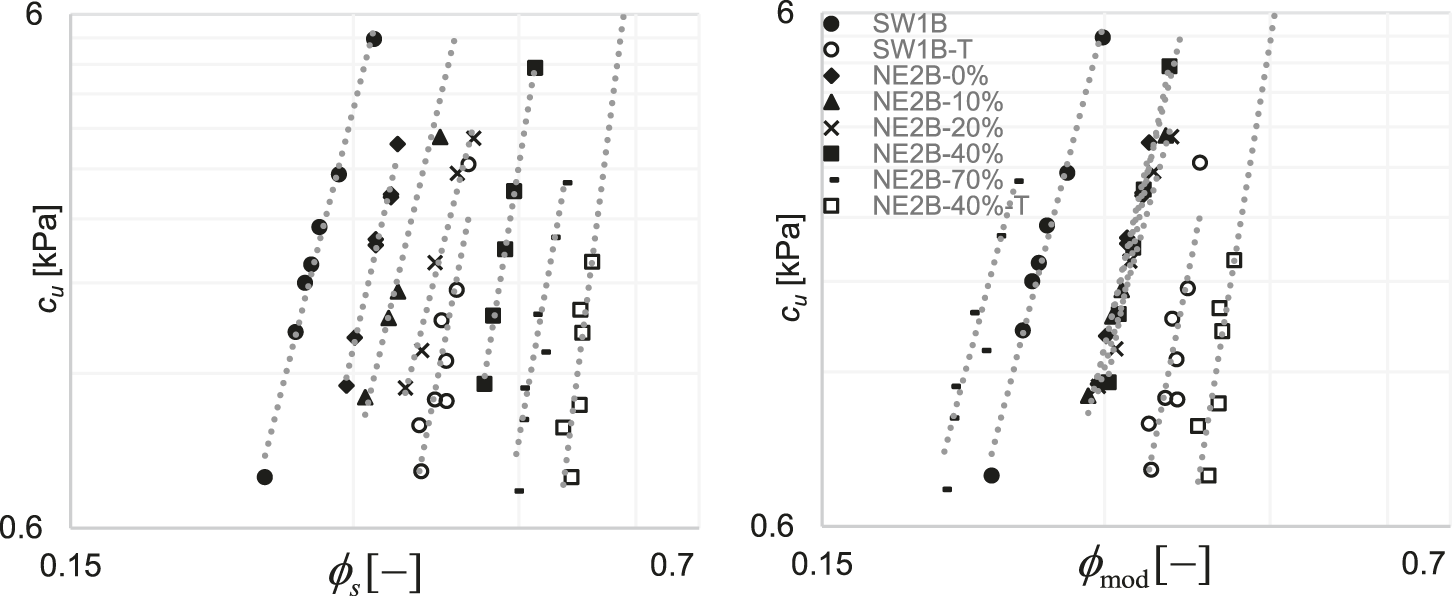
Undrained shear strength as a function (left) and (right).
Sample SW1B exhibits lower initial than the samples originating from the other sampling sites because of its larger amount of OM and subsequent larger ability to bind water (different sampling sites). This sample is therefore located at the left in Figure 2. On the other hand, treated samples SW1B-T and NEB-40%-T moved to the right because of their loss in ability to bind water given the lower lability (reactivity) of the remaining OM, reflected in a lower PI. It is remarkable that the slopes of the curves remain almost identical, suggesting a similar internal structure of the clay matrix.
Incremental Loading Oedometer Test
Figure 3 shows the traditional log(effective stress)—void ratio (e) space and shows the effective stress against the corrected volumetric concentration obtained from the IL tests. All the non-treated samples with sand contents up to 40% (i.e., tests I-NE2B-0%, I-NE2B-10%, I-NE2B-20%, and I-NE2B-40%) show virtually the same power law relation with overlapping lines in the log–log plot (right panel). This indicates that the TFC occurs for sand contents above 40% but below 70%. This agrees with the findings for the undrained shear strength.
FIGURE 3
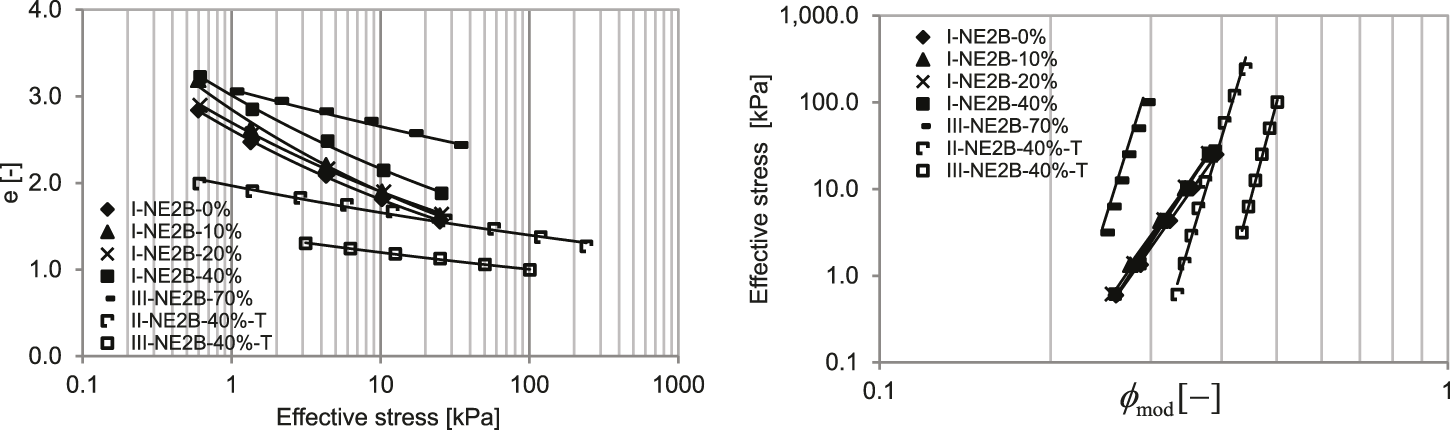
Left: log effective stress–void ratio (e) graph. Right: Effective stress as a function of for the IL tests.
The treated samples (tests II-NE2B-40%-T, III-NE2B-40%-T) also follow a power law relationship. The σeff–ϕmod correlations from these treated samples have a steeper slope, implying a larger increase in effective stress for an increase in with respect to the non-treated samples (i.e., larger nf, see Eq. 2 and the Supplementary Material). This indicates that the floc structure became denser as a result of the treatment, and primary particles may touch each other. This is in accordance with the findings of Barciela–Rial (2019), who found the same change of behavior after oxidation treatment for samples tested upon the constant rate of strain (CRS) consolidation tests for other Markermeer sediment samples.
The σeff–ϕmod correlation of sample of test III-NE2B-70% does not overlap with the other non-treated samples. This is because the fines content is below the TFC, and therefore, a granular skeleton is present. Remarkably, it still follows a power law, while, for instance, Schultze and Moussa (1961) presented exponential relationships for sand compressibility.
The compression index Cc calculated according to the geotechnical standard (i.e., applying Eq. 4 with e, instead of ) is presented in Figure 4A,C as a function of the effective stress and corrected solid content . Overall, Cc decreases with both increases in effective stress and solid contents but becomes nearly constant during the last phases of the tests. Cc appeared to be invariant with sand contents up to 10%. Possibly the sand particles are too diluted in the fines matrix to affect the compression, although an experimental error may have affected the results as well. For sand contents of 20% or more, Cc decreases with sand content. This is caused by the incompressibility of sand particles as has frequently been reported in the literature (e.g., Monkul and Ozden, 2007; Watabe et al., 2011; Simpson and Evans, 2016). However, when correcting Cc for the amount of sand (Cc,mod calculated by using in Eq. 4; Figure 4B,D), the Cc,mod for samples with 0–40% sand overlap, indicating that the TFC has not yet been reached with sand contents up to 40% (see Figure 4).
FIGURE 4
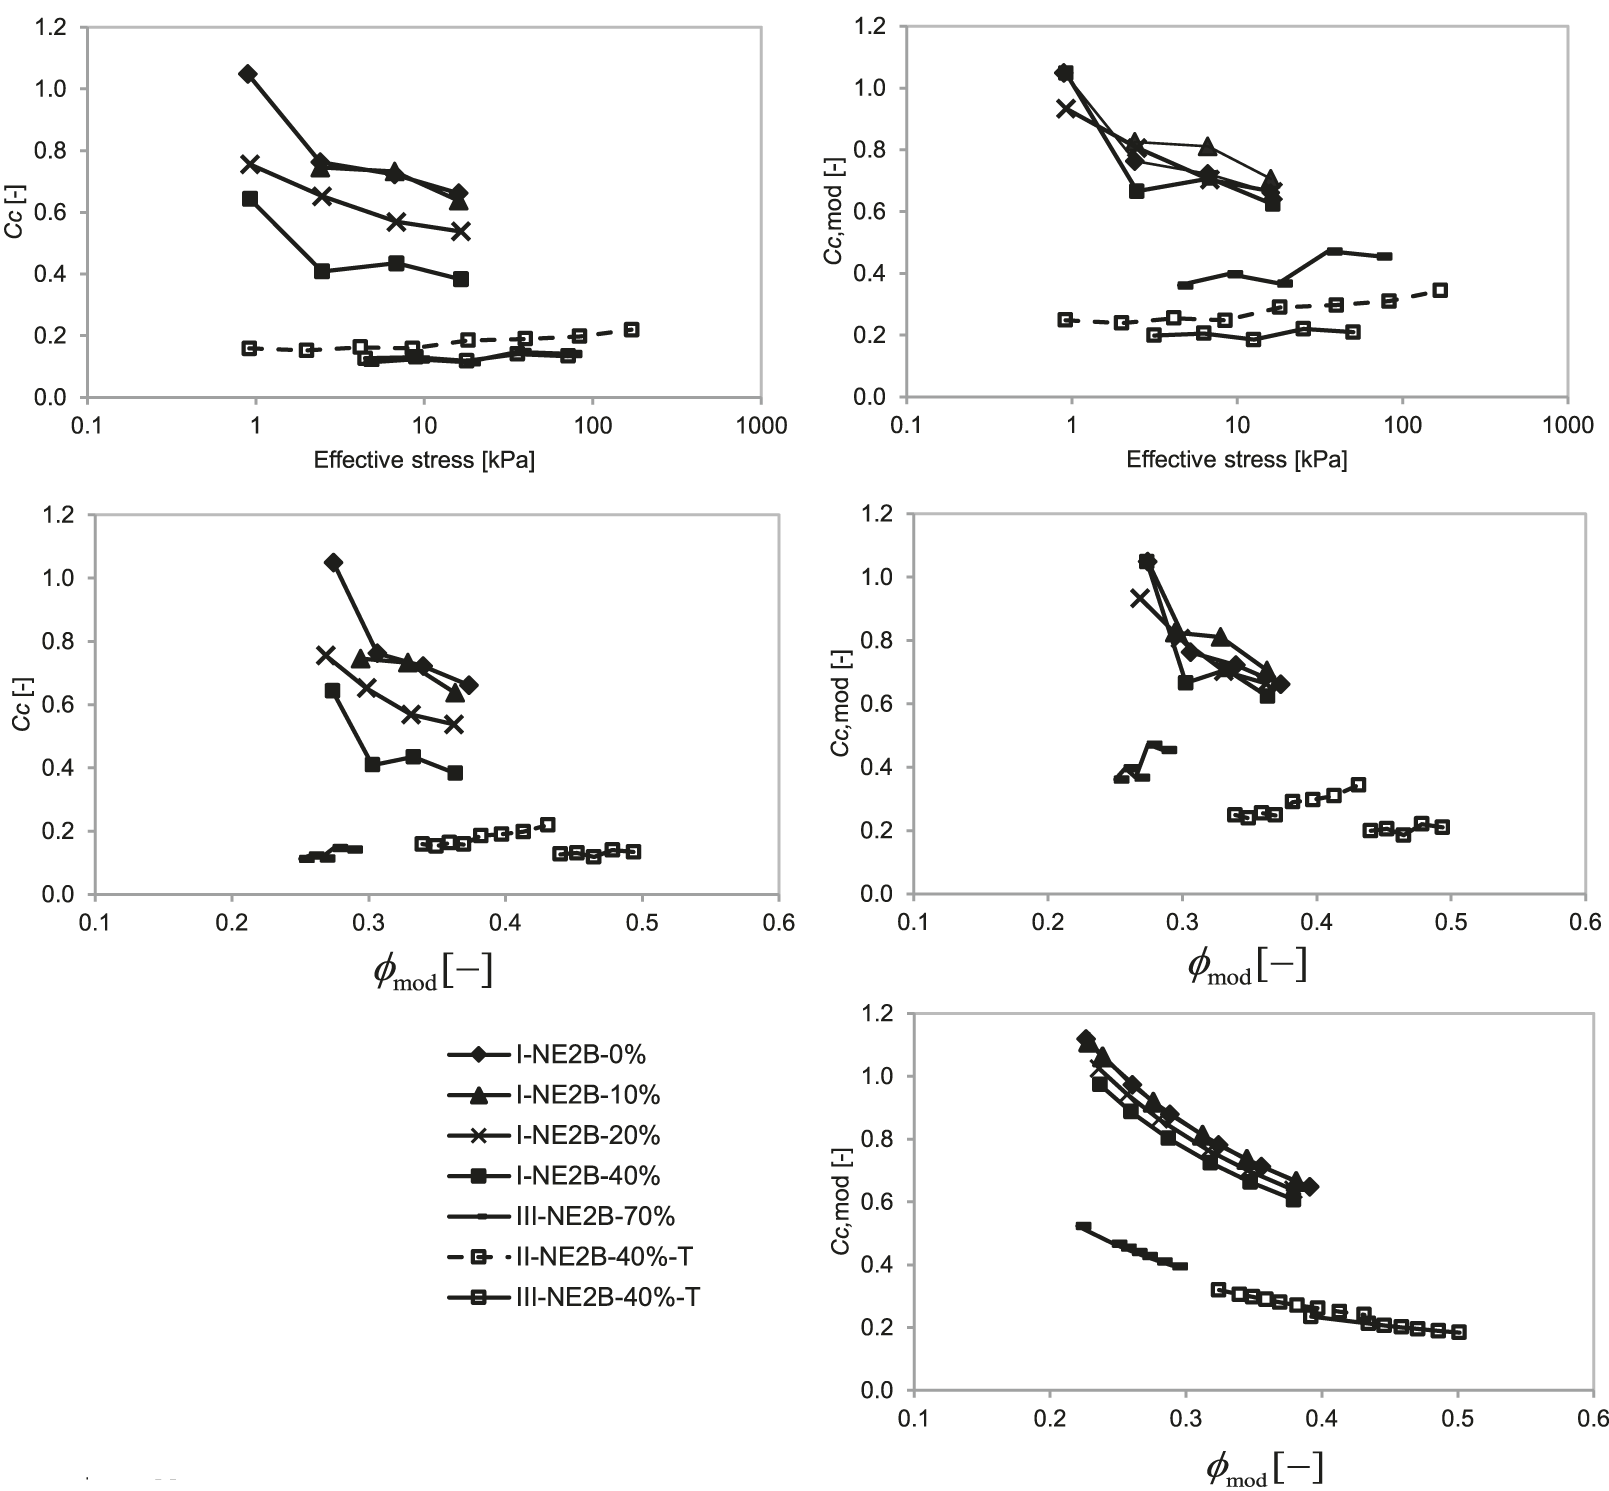
(A,C) Compressibility coefficient Cc without correcting for the presence of sand. (B,D)Cc,mod calculated with the corrected void ratio. (E)Cc,mod calculated following fractal theory using material parameters with proposed Eq. 6 as function of .
Regarding the effect of the oxidation treatment, the treated samples have smaller Cc values because of a lower ability to bind water (Barciela-Rial et al., 2020); thus, less pore water is expelled upon loading. The Cc–effective stress plot also shows that when using the void ratio e, instead of the corrected void ratio to calculate Cc (Figure 4A), the compressibility behavior of the treated sample with 40% sand (III-NE2B-40%-T) and the natural sample with 70% sand (III-NE2B-70%) is the same for loading scheme III (starting at higher initial stress). For the test with the treated sample at higher initial water contents (II-NE2B-40%T), the compressibility values were slightly larger.
The treated sample III-NE2B-40%-T and the sandy sample III-NE2B-70% exhibit a different tendency; the compression index increases with the effective stress. This is likely to be because both samples behave as silty sand. The increase in compressibility with effective stress for sandy sediment has been shown by multiple authors. For instance, Mesri and Vardhanabhuti (2009) showed an increase in Cc with effective stress for dense quartz sands with a maximum Cc value below 0.01 for stresses of 100 kPa. It is therefore concluded that the oxidation treatment for the material with 40% sand content changed the TFC.
Figure 4E shows Cc,mod as obtained from Eq. 6 with the fitting parameters determined from results presented in Figure 3. For sand contents of 40% or smaller, the Cc,mod curves overlap. The values obtained also agree with the ones calculated with and Eq. 4, that is, Figure 4D. This implies that Eq. 6 may be used to determine Cc,mod as a function of , directly with the material parameters determined from standard settling experiments (e.g., Merckelbach and Kranenburg, 2004b).
Discussion
Conceptual Model
Figure 5 presents a schematic of the mechanical behavior of the cohesive sediment with organic material. Herein, a possible collapse of flocs upon loading is not addressed. In this schematic, the different behavior found for Markermeer samples are classified into four (sub)categories: (1.1) fines dominated with OM (no sand), (1.2) fines dominated with OM and some sand (passive sand particles), 2) fines dominated with oxidized OM and some sand (passive sand particles), 3) sand dominated with OM and some fines (passive fines), and 4) sand dominated with oxidized OM and some fines (passive fines). The transition from case 1.2 to case 3 and that from case 2 to case 4 determine the TFC.
FIGURE 5
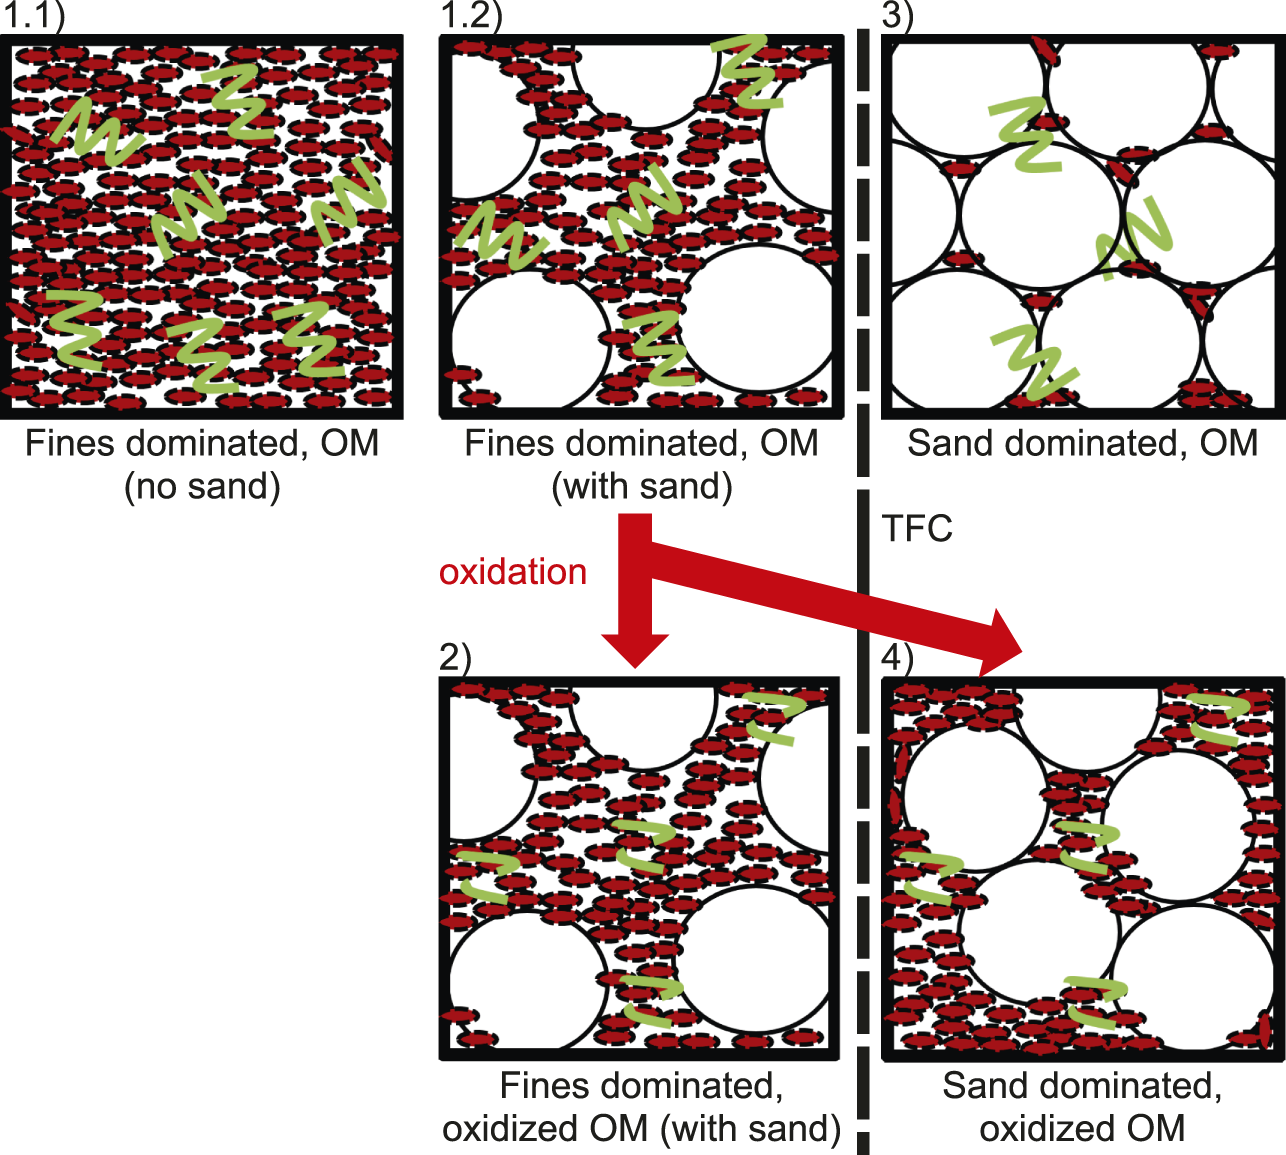
Schematic of mechanical behavior of the studied sediment as a function of its composition. Legend: curly lines represent OM, dashed curly lines represent oxidized OM, small oval particles represent fines, and big round particles represent sand.
For sand contents of 40% and lower, the behavior of the Markermeer sediment is dominated by the fines. However, for the sediment sample with 70% sand, the sand particles form a skeleton which dominates its behavior. The same sand-dominated behavior is observed for the treated samples. This means that the material parameters have changed. However, the constitutive model still appears to be applicable for these samples as the σeff – curves still follow the power law (e.g., Figure 3). The fact that oxidation of the OM changed the behavior of a sample with 40% sand from fines-dominated to sand-dominated suggests that the physical particle interactions are affected by the presence of OM and by the type of the organic matter present (fresh organic matter or oxidized organic matter). Thus, the type of OM is also relevant, as discussed by Barciela–Rial et al. (2020) who showed that the mechanical behavior upon drying of the Markermeer sediment is correlated stronger with the reactivity of OM than with the total organic matter content.
The activity plot (Skempton, 1953) reflects the relation between the plasticity index (PI) as a function of the clay content, yielding the sediment’s activity (the slope of the curve) and the critical clay content above which the sediment depicts cohesive behavior. Active sediments undergo considerable changes of volume when wetted (swelling) or dried (shrinkage), for example, Mitchell and Soga (2005). Figure 6 presents the activity plot for the samples used for the IL-tests with an activity A = 1.8 and critical clay content of 6%. The removal of the OM (treated sample) shifts the activity plot to the right, at the same slope (activity). However, the critical clay content increases substantially to 17%, which is in agreement with the aforementioned analyses on the impact of treatment on the mechanical behavior of the sediment.
FIGURE 6
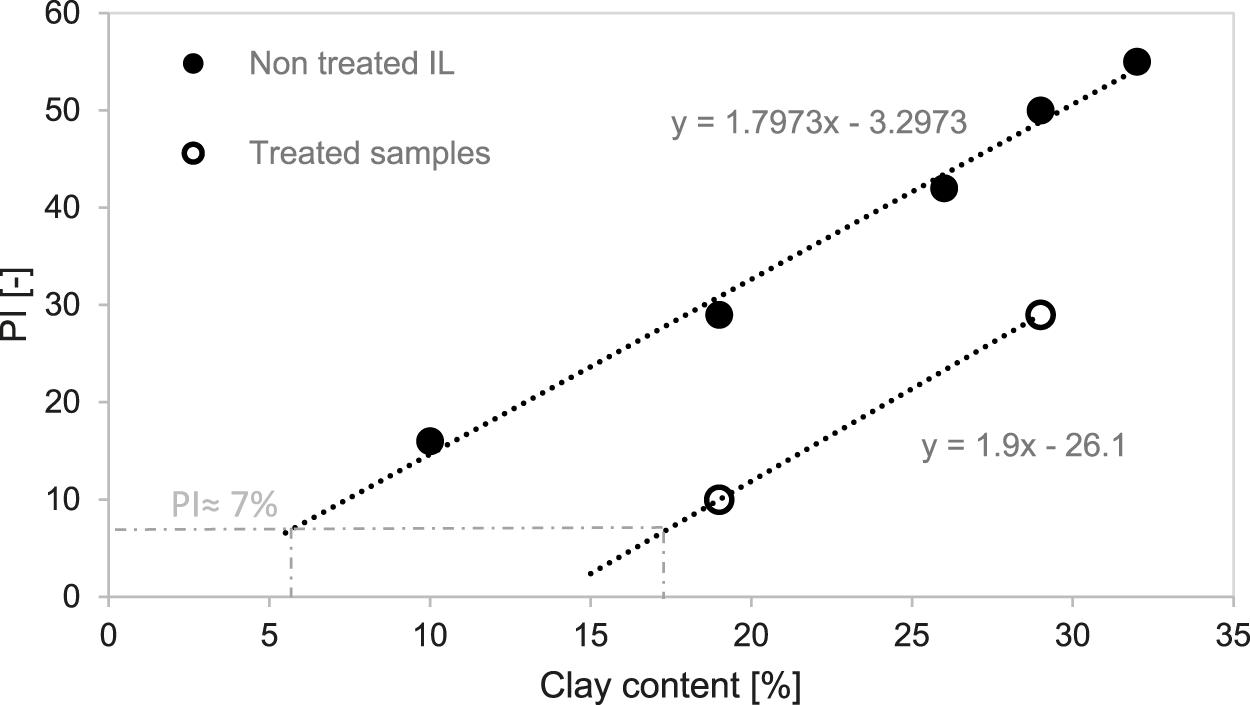
Activity plot for the natural samples tested upon IL and for the treated samples. The natural samples presented here have the same composition of the OM because they originate from the same mother sample.
Power Law Constitutive Equations
The sediment studied in the present work has much larger initial water content than usually studied in classical soil mechanics yet lower than those at which the Merckelbach and Kranenburg model has traditionally been applied. The results showed that at these relative low water contents, the constitutive equations of Merckelbach and Kranenburg work well. The mechanical response to external stresses can be described with these equations. This is in line with the findings of, for example, Chassagne (2019); Barciela–Rial (2019), who showed that the fractal theory could reproduce the evolution in time of consolidation for natural sediment mixtures also at large initial concentrations of sediment. A higher fractal dimension applies than traditionally available in the literature (between 1.8 and 2.2 for flocs, e.g., Merckelbach, 2000), which makes sense as a higher fractal dimension is an indication of a more compacted clay. However, the fact that the samples obey power law relationships does not prove that they are fractal, and further research would be needed to quantify this, which is out of the scope of this study.
When building with the dredged sediment, the initial water content and sand content may vary considerably, and which will also affect the consolidation behavior. The practical question is how to cover various sand or water contents with as few tests as possible. The present study shows that trends in behavior can be identified from σeff–ϕmod and cu–ϕmod relations. At sand contents below the TFC, the effect of sand can be accounted for through a correction of the sediment volumetric concentration, and all σeff–ϕmod and cu–ϕmod curves collapse (overlap). However, the behavior of the treated samples NE2B-40%-T and SW1B-T did not overlap with the natural samples and exhibited a steeper increase with the volumetric fraction. This is consistent with the increase in the critical clay content after treatment, as discussed before.
Conclusion
Progressively, more and more soft sediments are being used as construction materials. However, most studies refer either to fluid-like or very stiff sediment water mixtures, that is, sediment suspensions with a low initial concentration of solids or highly consolidated soil samples. This article shows how the Merckelbach and Kranenburg constitutive equations can be used for soft soils with an intermediate initial density, which is relevant for the dredged sediment that forms a bed while initially being in suspension. Based on their constitutive equations, a useful tool to identify the TFC is developed, correcting for relatively small sand contents in sediments with a fines-dominated behavior. A new formulation of Cc is presented as an inverse function of the volumetric concentration of solids. The results obtained from this equation are satisfactory when compared with the results obtained with standard procedures of the geotechnical norm.
Quantitatively small changes in the amount of organic matter, for example, oxidation, had a big impact on the compressibility and undrained shear strength of the material. The results suggest a large decrease in the ability of the Markermeer sediment to bind water, after long-term exposure to atmospheric conditions. The undrained shear strength after oxidation at the same solid content (density) decreases for the samples from both sampling sites. For the material with 8% sand (SW1B), a more pronounced change in behavior was observed upon oxidation, given the larger initial amount of OM present. Furthermore, the differences in behavior of the Markermeer sediment caused by the natural variability or segregation of sand were studied. This behavior is dominated by the fine fraction, except when the threshold of transitional fines content TFC was passed somewhere between 40 and 70% sand content. In the same way, treatment by oxidation reduced the amount of fines at which the transitional behavior to sand-dominated behavior occurred. The results show that the type of organic matter (oxidized or labile) may impact the TFC by changing the critical clay content. This is an important observation as OM reactivity is generally ignored in the literature and technical standards.
Statements
Data availability statement
The raw data supporting the conclusion of this article will be made available by the authors, without undue reservation.
Author contributions
MB-R designed and performed the experiments, analyzed the data, and wrote the manuscript; PV helped with the design of the experiments, data interpretation, and writing of the manuscript; TV assisted with data interpretation; JG assisted with the design of the geochemical analysis and experimental data interpretation; and JW assisted with the mathematical model, experimental data interpretation, and the writing of the manuscript.
Funding
This study was supported with funding from the Netherlands Organization for Scientific Research (NWO, project no. 850.13.031) and from Boskalis, Van Oord, Deltares, RHDHV, and Natuurmonumenten. Open access fee was paid by TU Delft.
Acknowledgments
The authors would like to thank Arno Mulder for his help with the performance of the IL oedometer tests.
Conflict of interest
The authors declare that the research was conducted in the absence of any commercial or financial relationships that could be construed as a potential conflict of interest.
Publisher’s note
All claims expressed in this article are solely those of the authors and do not necessarily represent those of their affiliated organizations, or those of the publisher, the editors, and the reviewers. Any product that may be evaluated in this article, or claim that may be made by its manufacturer, is not guaranteed or endorsed by the publisher.
Supplementary material
The Supplementary Material for this article can be found online at: https://www.frontiersin.org/articles/10.3389/feart.2022.786108/full#supplementary-material
References
1
Al-Shayea N. A. (2001). The Combined Effect of clay and Moisture Content on the Behavior of Remolded Unsaturated Soils. Eng. Geology.62 (4), 319–342. 10.1016/S0013-7952(01)00032-1
2
Barciela‐Rial M. van Paassen L. A. Griffioen J. van Kessel T. Winterwerp J. C. (2020). The Effect of Solid‐phase Composition on the Drying Behavior of Markermeer Sediment. Vadose Zone J.19 (1), e20028. 10.1002/vzj2.20028
3
Barciela-Rial M. van der Star W. Meshkati Shahmirzadi E. Haarman F. Besseling E. Sittoni L. et al (2021). “Desalination of dredged sediments for circular reuse: two Eems-Dollard cases,” in International SedNet conference, Lille, France, 28 June – 2 July 2021.
4
Barciela-Rial M. (2019). Consolidation and Drying of Slurries: A Building with Nature Study for the Marker Wadden. Doctoral dissertation. Delft (Netherlands): Delft University of Technology.
5
Bartholomeeusen G. Sills G. C. Znidarčić D. Van Kesteren W. Merckelbach L. M. (2002). Sidere: Numerical Prediction of Large-Strain Consolidation. Géotechnique52 (9), 639–648. 10.1680/geot.52.9.639.38842
6
Behar F. Beaumont V. De B. Penteado H. L. (2001). Rock-eval 6 Technology: Performances and Developments. Oil Gas Sci. Techn. - Rev. IFP56 (2), 111–134. 10.2516/ogst:2001013
7
British Standards Institute (1990b). Methods of Test for Soils for Civil Engineering Purposes. Classification tests. BS1377-2:1990.
8
British Standards Institute (1990a). Methods of Test for Soils for Civil Engineering Purposes. General Requirements and Sample Preparation. BS1377-1:1990.
9
Cabalar A. F. Mustafa W. S. (2015). Fall Cone Tests on Clay-Sand Mixtures. Eng. Geology.192, 154–165. 10.1016/j.enggeo.2015.04.009
10
Chassagne C. (2019). “Understanding the Natural Consolidation of Slurries Using Colloid Science,” in Proceedings of the European Conference on Soil Mechanics and Geotechnical Engineering, Reykjavik, Iceland, 1–6 September 2019.
11
EN (2012). Sludge, Treated Biowaste, Soil and Waste -determination of Loss on Ignition. Geneva, Switzerland: International Organization for Standardization. EN 15935:2012.
12
Gibson R. E. England G. L. Hussey M. J. L. (1967). The Theory of One-Dimensional Consolidation of Saturated Clays. Géotechnique17 (3), 261–273. 10.1680/geot.1967.17.3.261
13
ISO (2016). Geotechnical Investigation and Testing - Laboratory Testing of Soil - Part 12: Determination of Atterberg Limits. ISO 17892-12:2016.
14
ISO/TS (2004c). Geotechnical Investigation and Testing - Laboratory Testing of Soil - Part 3: Determination of Particle Density - Pycnometer. ISO/TS 17892-3:2004.
15
ISO/TS (2004a). Geotechnical Investigation and Testing - Laboratory Testing of Soil - Part 5: Incremental Loading Oedometer Test. ISO/TS 17892-5:2004.
16
ISO/TS (2004b). Geotechnical Investigation and Testing - Laboratory Testing of Soil - Part 6: Fall Cone Test. ISO/TS 17892-6:2004.
17
Jacobs W. (2011). Sand-mud Erosion from a Soil Mechanical Perspective. Doctoral dissertation. Delft (Netherlands): Delft University of Technology.
18
Kranenburg C. (1994). The Fractal Structure of Cohesive Sediment Aggregates. Estuarine, Coastal Shelf Sci.39 (6), 451–460. 10.1016/S0272-7714(06)80002-8
19
Kumar G. V. Wood D. M. (1999). Fall Cone and Compression Tests on Clay-Gravel Mixtures. Géotechnique49 (6), 727–739. 10.1680/geot.1999.49.6.727
20
Merckelbach L. M. (2000). Consolidation and Strength Evolution of Soft Mud Layers. Doctoral dissertation. Delft (Netherlands): Delft University of Technology.
21
Merckelbach L. M. Kranenburg C. (2004b). Determining Effective Stress and Permeability Equations for Soft Mud from Simple Laboratory Experiments. Géotechnique54 (9), 581–591. 10.1680/geot.2004.54.9.581
22
Merckelbach L. M. Kranenburg C. (2004a). Equations for Effective Stress and Permeability of Soft Mud-Sand Mixtures. Géotechnique54 (4), 235–243. 10.1680/geot.2004.54.4.235
23
Mesri G. Vardhanabhuti B. (2009). Compression of Granular Materials. Can. Geotech. J.46 (4), 369–392. 10.1139/T08-123
24
Miftah A. Garoushi A. H. B. Bilsel H. (2020). Effects of Fine Content on Undrained Shear Response of Sand-Clay Mixture. Int. J. Geosynth. Ground Eng.6 (2), 10. 10.1007/s40891-020-0193-7
25
Mitchell J. K. Soga K. (2005). Fundamentals of Soil Behavior. 3rd Edition. Hoboken: John Wiley & Sons.
26
Monkul M. M. Ozden G. (2007). Compressional Behavior of Clayey Sand and Transition Fines Content. Eng. Geology.89 (3-4), 195–205. 10.1016/j.enggeo.2006.10.001
27
Oliveira B. R. F. Smit M. P. J. van Paassen L. A. Grotenhuis T. C. Rijnaarts H. H. M. (2017). Functional Properties of Soils Formed from Biochemical Ripening of Dredged Sediments-Subsidence Mitigation in Delta Areas. J. Soils Sediments17 (1), 286–298. 10.1007/s11368-016-1570-7
28
Peters J. F. Berney E. S. (2010). Percolation Threshold of Sand-clay Binary Mixtures. J. Geotech. Geoenviron. Eng.136 (2), 310–318. 10.1061/(ASCE)GT.1943-5606.0000211
29
Rijkswaterstaat (1995). Geologische en bodemkundige atlas van het markermeer. Lelystad: Rijkswaterstaat, Directie IJsselmeergebied. Tech. rep.
30
Santagata M. Bobet A. Johnston C. T. Hwang J. (2008). One-dimensional Compression Behavior of a Soil with High Organic Matter Content. J. Geotech. Geoenviron. Eng.134 (1), 1–13. 10.1061/(asce)1090-0241(2008)134:1(1)
31
Schultze E. Moussa A. (1961). “Factors Affecting the Compressibility of Sand,” in 5th International Conference of Soil Mechanics and Foundation Engineering, 1, 335340.
32
Simpson D. C. Evans T. M. (2016). Behavioral Thresholds in Mixtures of Sand and Kaolinite clay. J. Geotechnical Geoenvironmental Eng.142 (2), 1–10. 10.1061/(ASCE)GT.1943-5606.0001391
33
Skempton A. W. (1953). The Colloidal “Activity” of Clays, 3rd International Conference of Soil Mechanics and Foundation Engineering, Vol. 1. Zurich: Organizing Committee, ICOSOMEF, 57–61. [1953-1954].
34
Terzaghi K. (1923). “Die Berechnung der Durchlassigkeitzifer des Tones aus dem Verlauf der hydrodynamischen Spannungserscheinungen,” in Mathematish-naturwissenschaftliche, Klasse. Part IIa (In German) (Vienna: Akademie der Wissenschaften), 132, 125–138.
35
Thevanayagam S. (1998). Effect of Fines and Confining Stress on Undrained Shear Strength of Silty Sands. J. Geotechnical Geoenvironmental Eng.124 (6), 479–491. 10.1061/(asce)1090-0241(1998)124:6(479)
36
Van Duin E. H. S. (1992). Sediment Transport, Light and Algal Growth in the Markermeer. Doctoral dissertation. Wageningen: Agricultural University.
37
Van Kessel T. de Boer G. (2009). Calibration Suspended Sediment Model Markermeer, Deltares Report 4612. Delft, The Netherlands.
38
Vörösmarty C. J. Meybeck M. Fekete B. Sharma K. Green P. Syvitski J. P. M. (2003). Anthropogenic Sediment Retention: Major Global Impact from Registered River Impoundments. Glob. Planet. Change39 (1–2), 169–190. 10.1016/S0921-8181(03)00023-7
39
Watabe Y. Yamada K. Saitoh K. (2011). Hydraulic Conductivity and Compressibility of Mixtures of Nagoya Clay with Sand or Bentonite. Géotechnique61 (3), 211–219. 10.1680/geot.8.p.087
40
Wichman B. (1999). Consolidation Behavior of Gassy Mud: Theory and Experimental Validation. Doctoral dissertation. Delft (Netherlands): Delft University of Technology.
41
Winterwerp J. C. van Kesteren W. G. (2004). Introduction to the Physics of Cohesive Sediment Dynamics in the Marine Environment, Vol. 56. Amsterdam: Elsevier Science. Developments in Sedimentology.
42
Zentar R. Abriak N.-E. Dubois V. (2009). Fall Cone Test to Characterize Shear Strength of Organic Sediments. J. Geotech. Geoenviron. Eng.135 (1), 153–157. 10.1061/(asce)1090-0241(2009)135:1(153)
Summary
Keywords
dredged sediment, organic matter, compressibility, cohesive, shear strength, fractal structure, composition
Citation
Barciela-Rial M, Vardon PJ, Van Kessel T, Griffioen J and Winterwerp JC (2022) Effect of Composition on the Compressibility and Shear Strength of Dredged Cohesive Sediment. Front. Earth Sci. 10:786108. doi: 10.3389/feart.2022.786108
Received
29 September 2021
Accepted
14 January 2022
Published
24 February 2022
Volume
10 - 2022
Edited by
Andrew James Manning, HR Wallingford, United Kingdom
Reviewed by
Chiara Deangeli, Politecnico di Torino, Italy
Lucas Merckelbach, Helmholtz Centre for Materials and Coastal Research (HZG), Germany
Updates
Copyright
© 2022 Barciela-Rial, Vardon, Van Kessel, Griffioen and Winterwerp.
This is an open-access article distributed under the terms of the Creative Commons Attribution License (CC BY). The use, distribution or reproduction in other forums is permitted, provided the original author(s) and the copyright owner(s) are credited and that the original publication in this journal is cited, in accordance with accepted academic practice. No use, distribution or reproduction is permitted which does not comply with these terms.
*Correspondence: Maria Barciela-Rial, m.barcielarial@tudelft.nl
This article was submitted to Sedimentology, Stratigraphy and Diagenesis, a section of the journal Frontiers in Earth Science
Disclaimer
All claims expressed in this article are solely those of the authors and do not necessarily represent those of their affiliated organizations, or those of the publisher, the editors and the reviewers. Any product that may be evaluated in this article or claim that may be made by its manufacturer is not guaranteed or endorsed by the publisher.