 R. Algon
 B. Medvedev2
- 1Neev Center for Geoinfomatics, Institute of Earth Sciences, the Hebrew University of Jerusalem, Jerusalem, Israel
- 2Schlumberger Petroleum Services, The Hague, Netherlands
Modern petroleum exploration extracts 3D volumes of seismic data where certain curves can be drawn delimiting stratigraphic horizons. Such curves hold a promise as piercings for identifying tectonic offsets in 3D. Pinchout points on vertical sections connect with adjacent sections to form contours in 3D. Such a contour, showing quasi-uniform depth, may be considered a paleo-isobath. Here we focus on pinchout paleo-isobaths in the western shores of the Levant that might record ∼120 m drop in sea level at the peak of late Quaternary glacials. We identified a pinchout isobath, ∼15 km offshore, ∼140 m below sea level. Water depth averages ∼90 m, and sediment cover averages ∼45 m. Allowing for isostatic adjustment, this is compatible with eustatic levels of the last two glacial maxima. We hypothesize that the contour mapped is closely related to the shoreline of one of the last glacial maxima. The pinchout pattern is continuous for ∼25 km in the southern reaches of the survey area, at depths of 137 ± 2.5 m, an isobath within the observational uncertainty. The isobath is lost for ∼10 km in the central portion of the survey, north of which a slightly deeper isobath reappears for 7 km, until it disappears approaching a bathymetric trough. The deeper pinchout isobath reappears in the northernmost section of the survey, where it deepens by an average of 5–6 m relative to the southern part (from 137 m to 142 m). The deepening of the pinchout contour is consistent with massive sliding underlying the trough. Sliding here has been attributed to sediment load or salt tectonics, and has been recently associated with a local tsunami dating 9.6 ± 0.3 ka. Recent work relocated the deepest earthquakes on the Levant southern shelf (depths circa 30 km) to the trough, with epicenters coinciding with the boundary faults. This may indicate an active deep-seated tectonic feature. Expressions of the contour outside the survey area will offer tests to our paleo-shoreline hypothesis. Additional pinchout isobaths and pinchout contours associated with earlier lowstands will help constrain tectonic rates as well as glacial eustatic levels and hydro-isostatic effects, with potential regional and global applications.
Introduction
Two global glaciations took place during the last 140 millennia, peaking at 140 Ka (MIS-6) and at 26 Ka (MIS-2) (e.g., Rohling et al., 2014). During these periods, cooler conditions caused the growth of high-latitude ice caps with an ensuing drop of eustatic sea level of about 120 m. In Israel, this global sea level drop caused westward migration of the shoreline. Sea level changed little for millennia, until de-glaciation produced an abrupt rising.
The hypothetical locus of the western paleo-shoreline of Israel during the last glacial periods has been based on fitting the global sea level curve to the Mediterranean bathymetry (Schattner et al., 2010). Thus, paleo-shorelines have been approximated at the eustatic depth of the peak of the last glacial periods, neglecting sediment transport and local isostatic adjustment. Several attempts have identified transgression unconformities following the last glacial maxima on seismic profiles (Neev et al., 1966; Schattner et al., 2015; Hübscher et al., 2016; Lazar et al., 2016). This is the first study of the along-strike aspect of lowstand shorelines.
An independent constraint on the locus of glacial paleo-shorelines can be obtained from seismic stratigraphy: a pinchout point for a stratigraphic datum can be interpreted as the intersection of a vertical section with a shoreline (Catuneanu, 2006). Undeformed shoreline segments should coincide with an isobath (depth contour), connecting pinchout points. Such an isobath might be interpreted as a paleo-shoreline representing a relative sea-level. This interpretation is supported by lithological data 500 m east of the pinchout contour at the northern part of the Isramco seismic volume at a water depth of about 90 m. The lithology consists of very soft clay at the corresponding subbottom depth (0–30 m) and layers of sandy clay to clayey sand with thin layers of calcarenite (“kurkar”) and shell fragments at 30–55 m (AMPHIBIO Ltd, 2016). In this study, high resolution 3D seismic data are interpreted both in time and depth. The interpretation results enable mapping of paleo-contours, stratigraphic horizons, faults and landslides.
Using Schlumberger’s Petrel™, we identify paleo-contours running through pinchout points within the “Isramco” 3D seismic volume (Figures 1, 2). We consider the interpretation of the paleo-contours as fossil shorelines from glacial maxima and trace the stratigraphically youngest one through a massive landslide.
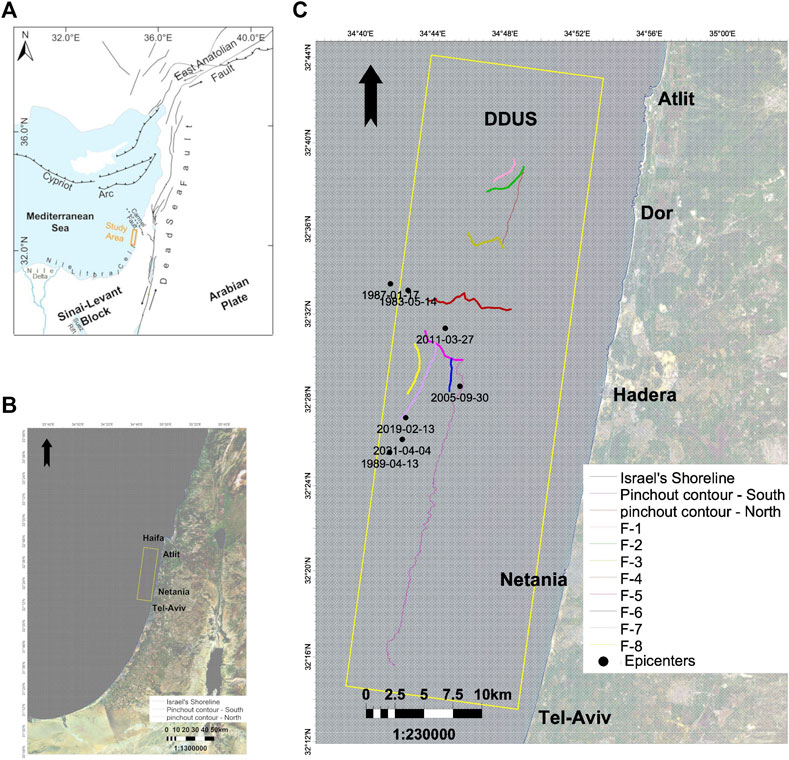
FIGURE 1. Location map: (A) Regional faults map—after (Barnea Cohen et al., 2022); (B) Regional map; (C) Slumps and scars—after (Gadol et al., 2020) and faults in study area.
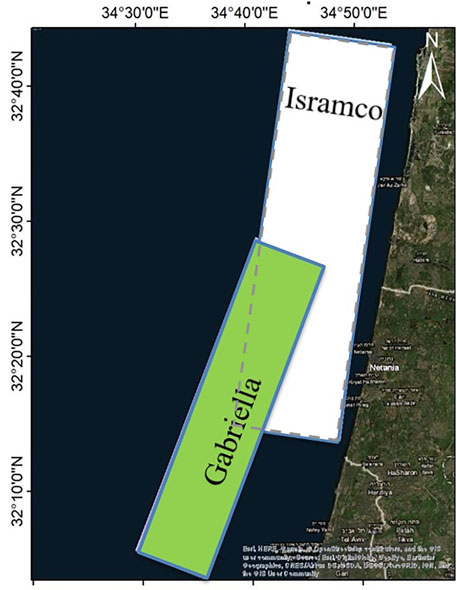
FIGURE 2. Overlap between Isramco (white) and Gabriella (green) seismic volumes, and their location.
Assigning glacial maxima ages to the presumed shoreline allows computation of the rates of sedimentation. These rates, and their offset fossil shorelines, allow tentative dating of a landslide. In particular cases, we may discern stability versus activity for these landslides. Finally, we address a possibility of connection between massive landsliding and subcrustal earthquakes.
Geological Setting
The stratigraphic units at the depths mapped in the study area feature sandstones with aeolian and marine carbonate concretions (locally known as “kurkar” lithology) alternating with reddish silty-clay sandstones (“hamra”), silts, clays, and unconsolidated sands and conglomerates (Gvirtzman and Buchbinder, 1969). The late Quaternary section, with its rhythmic glacial cycles, was studied by several authors (Gvirtzman, 1969; Neev et al., 1973; Gvirtzman et al., 1983). A prominent unconformity termed “Surface A” has been attributed to truncation by the transgressing shoreline, following the last glacial maximum (LGM) (Neev et al., 1966; Schattner et al., 2010).
The Nile is the main source of sediments for the eastern shelves of the Mediterranean which bound the littoral cell of the Nile that extends from the Nile Delta (Alexandria, Egypt) to the bay of Acre/Haifa, Israel. This cell is about 650 km long and one of the longest in the world (Inman and Jenkins, 1984) (Figure 1A).
Progradation of sediments atop an uplifted structure of 1.5–2 km created the shelf and slope of the present-day continent, (Fig. 14A in Ginzburg et al., 1975). The present-day characteristics of the basin were formed by Neogene-Quaternary events, such as the active faults reaching the sea floor at a water depth of c. 400 m (Garfunkel, 1984). The shallow marine strata in the south-eastern Mediterranean show little vertical movement during the last 120,000 years (Anzidei et al., 2011). Thus, relatively to the northern Levant, the area is considered tectonically stable despite the intersection of the coast at each end by the Carmel Fault and the Suez Rift (Figures 1A).
Materials and Methods
Materials
The data used in this study are from 3D seismic surveys conducted by Adira (Gabriella) and Modi’in Energy (Isramco) for the purpose of hydrocarbon exploration off the coast of Israel. The surveys focused on the deep strata and penetrated to the Jurassic.
The Isramco 3D volume (Figure 2) is a pre-stack time-migrated dataset. This survey covers about 825 square kilometers between Atlit and Ga’ash, with a 12.5 m sample spacing. We used the velocity model of the Gabriella volume to convert the Isramco volume from the time to the depth dimension off Netanya, which was possible given their overlap. In order to identify the formations and members observed the Gabriella data were tied to the Yam-Yaffo deep borehole.
The bathymetry of the study area (Hall et al., 2015) was compiled primarily from modern multibeam data collected within the framework of the Israel National Bathymetric Survey and hydrocarbon exploration activities.
In order to constrain the positions of the Quaternary glacial shorelines, we mapped horizons, contours and faults at relatively shallow depths in the 3D seismic data (Figures 3, 4). The 3D surveys provide excellent horizontal coverage of the study area, thus helping identify the principal stratigraphic relations of the shorelines. This is achieved via cross-sections of time and depth, along with seismic features that emphasize certain diagnostics at a smaller scale. The uniformity of depths of pinchout points provides an independent test on shoreline identification.
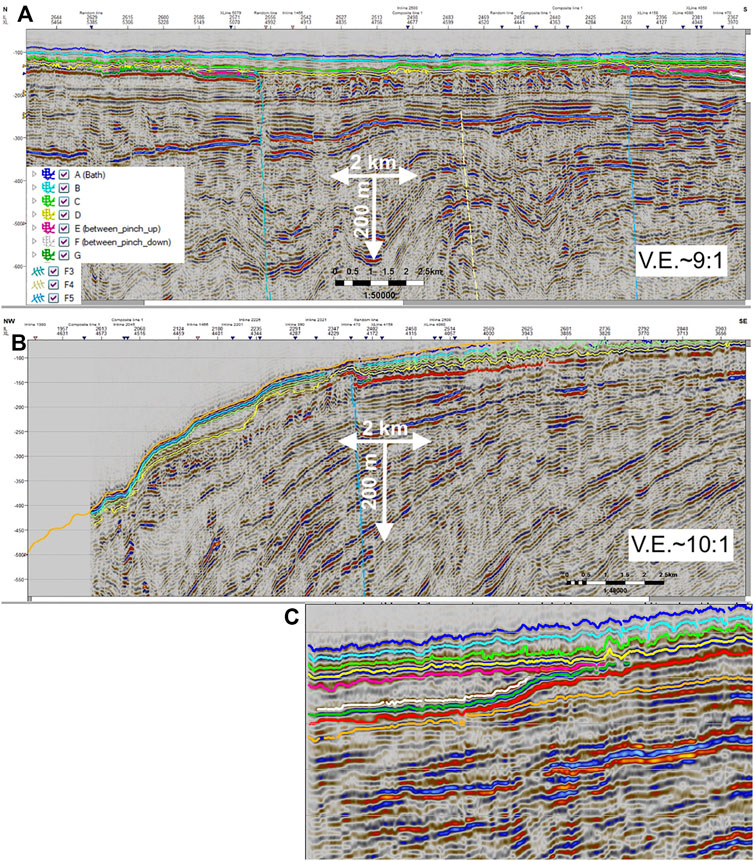
FIGURE 3. Cross sections (A) North-South Section Parallel to Shoreline; (B) NW-SE section at the southern edge of the inner slide; (C) Pinchout point, in NW-SE cross section.
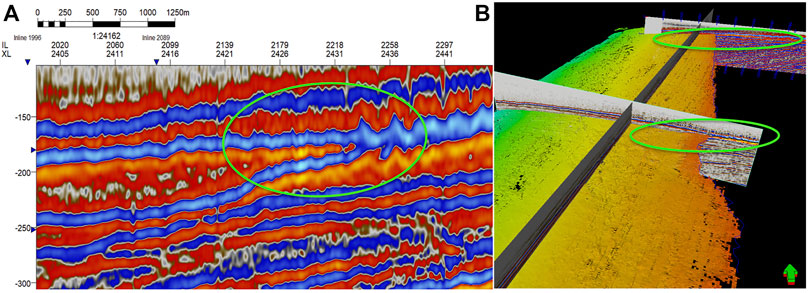
FIGURE 4. 3D view of pinchout point with contour in the horizon (A) focus on pinchout; (B) 3D connection of points to form pinchout and the horizon.
Stratigraphic Interpretation
The processed seismic data requires interpretation in order to identify the chrono-stratigraphic horizons and pinchout points and to thus map the contours. Interpretation includes spatial analysis and gridding for each mapped horizon. Pinchout points are then identified, where two horizons merge into one. In the final stage, the 3D locus is defined by the connection of pinchout points with similar depth.
We interpreted the seismic volumes using Schlumberger’s Petrel™. The Isramco volume was obtained in the time dimension, i.e., the data represented the return time of the reflections from each horizon, or the two-way travel time (TWTT). Therefore, in order to interpret in the depth domain, we converted the Isramco volume from the time to the depth dimension. Depth conversion uses a velocity model prepared for the survey area; multiplying the sound velocity of each horizon by the existing reflection time in the volume will give a model depth of that horizon. A velocity model for the Isramco volume was not available. Due to its relatively large overlap with the Gabriella volume, and due to the fact that the study deals with the shallow part of the volume, we assumed that the spatial change between the two volumes is negligible.
Following a spatial adjustment between the velocity model of the Gabriella volume and the TWTT Isramco volume, we derived an “ad-hoc volume” using Petrel’s “Depth conversion” tool: The Isramco volume in the depth dimension. The discrepancies between the horizons approaches 11 m (measured at several places in the volume). These inaccuracies are negligible given that the volume was converted from time to depth by another volume’s velocity model and that the two surveys differ due to differences in survey editors and survey times. In addition, we obtained a high correlation between the multibeam bathymetry and the bathymetry as picked in the Isramco volume after conversion to depth.
In this way, we accurately mapped the horizon and pinchout points in the Isramco volume. We compared these to the shape of the seismic wave: viz. peak point, trough point, the transition point between the positive and negative part of the wave (Z-crossing), and the negative to positive transition point (S-crossing).
Results
Following the conversion of the Isramco volume to depth, we examined the degree of matching between the horizon mapping and the depth dimension. Comparison of the seismic volume seafloor depth to the multibeam bathymetry (in the area above the pinchout contour only) yields an average difference of 2.0 m with a standard deviation of 1.2 m. For the purpose of this study, which focuses on the mapping of relatively shallow horizons, the degree of fit is very promising.
Our focus is on truncations and pinchout structures that could be related to glacial lowstands. This includes eight truncation surfaces and a prominent pinchout that maintained quasi-uniform depth throughout the survey.
We mapped eight horizons in the survey, avoiding chaotic zones belonging to the Israel slump complex (Martinez et al., 2005). Six horizons span the entire area, whereas two others disappear eastward:
1. Horizon A (Figure 5) coincides with the seafloor as mapped from the seismic volume. This horizon almost completely overlaps the bathymetry of the seafloor as shown in recent bathymetric mapping (Hall et al., 2015).
2. Horizon B (Figure 6) extends continuously from about 2 km east of the pinchout edge to the end of the volume. This horizon is rough at the northern end of the southern shoreline section. The depth of Horizon B ranges between 50 and 600 m in the study area
3. Horizon C (Figure 7) is marked by a landslide scar at the southern end of the northern section of the shoreline. This scar defines a channel, subsequently filled with sediments.
4. Horizon D (Figure 8)—a continuous horizon; this horizon is compatible with the truncation surface known in the literature as Surface A (Neev et al., 1966), also marked by landslides.
5. Horizons E, F (Figures 9, 10)—The pinch-out locus is the intersection of these two horizons that occupy a narrow bathymetric range as discussed below. The upper and younger horizon E truncated the lower horizon. The two horizons are interrupted in the landslide area and could not be mapped. They become chaotic in an area where the pinchout edge is absent, and the material becomes disturbed.
6. Horizons G, H (Figure 11)—the horizons below Horizon F; these horizons also exhibit relative continuity except where they become chaotic west of the pinchout contour.
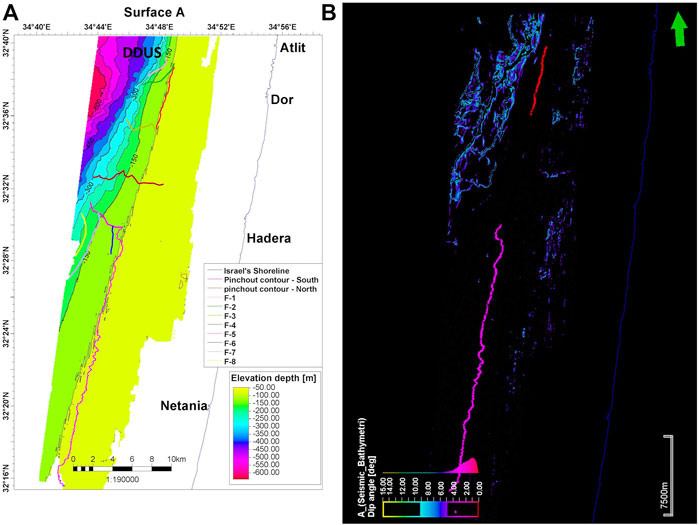
FIGURE 5. Seismic mapping of Horizon A: (A) Topographic map of Horizon A; (B) Dip angle map of Horizon A.
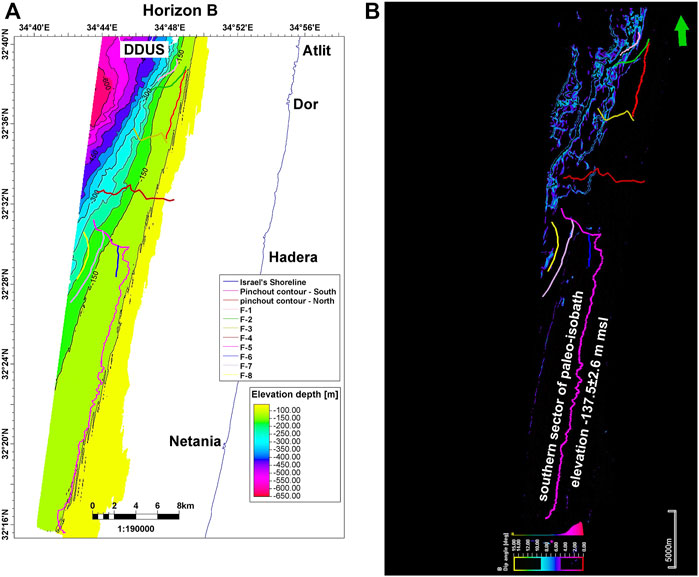
FIGURE 6. Seismic mapping of Horizon B, (A) Topographic map of Horizon B; (B) Dip angle map of Horizon B.

FIGURE 7. Seismic mapping of Horizon C.

FIGURE 8. Seismic mapping of Horizon D.
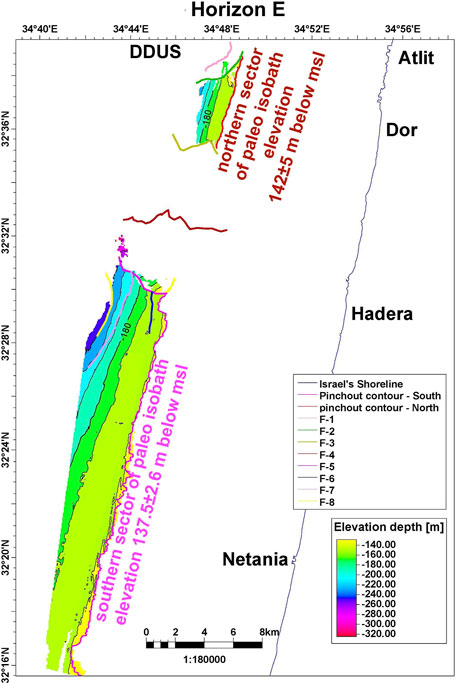
FIGURE 9. Seismic mapping of Horizon E.
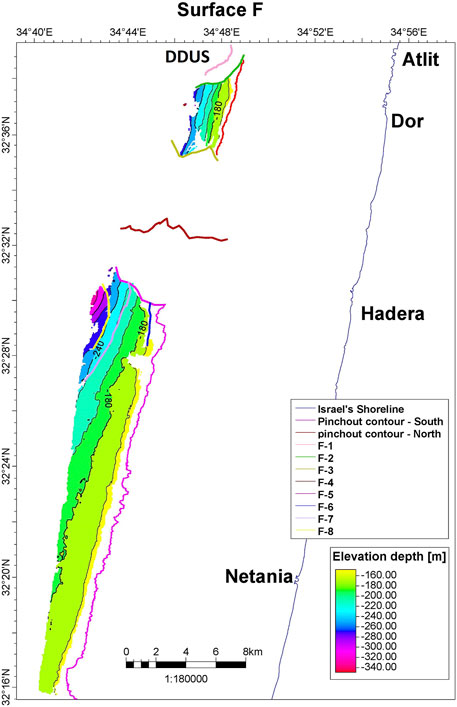
FIGURE 10. Seismic mapping of Horizon F.
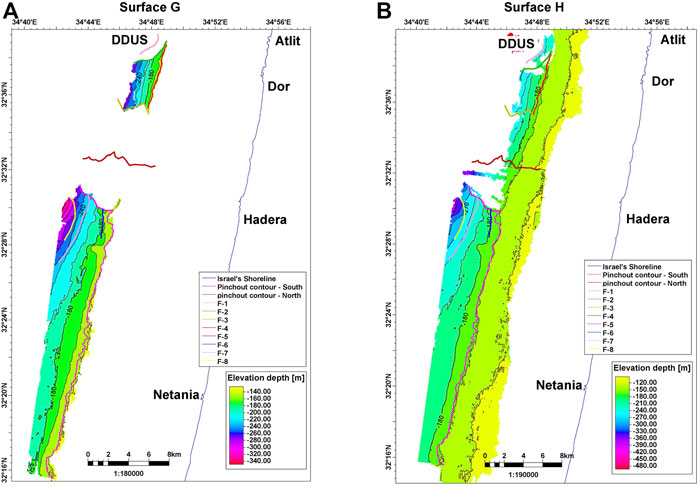
FIGURE 11. Seismic mapping of horizons: (A) Horizon G; (B) Horizon H.
Mapping out the distinct characteristics of a seismic horizon, pinching out from the Tel Aviv area in the south to the Atlit area in the north (Figure 1), showed two main sectors:
1. The southern sector begins slightly south of Tel Aviv and continues to offshore Hadera (Figures 1, 5–9, 12, 13). This paleo-contour is found at depths between 129 and 147 m with an average depth of 137.5 m and a standard deviation of 2.6 m, at water depths of 80–108 m, and beneath an average sediment thickness of 46 m (Figure 12) (Table 1). In the northern sector, the shoreline is interrupted by an underwater landslide probably associated with the Israel slump complex (Martinez et al., 2005) of the Dor disturbance (Almagor and Garfunkel, 1979). This sector is about 7–10 m lower than the southern sector.
2. The northern sector is separated from the southern one by roughly 10 km, in which the pinch-out points are not resolvable. Their pattern again returns for about 7 km, until disappearing completely in the area of the Dor disturbance off the coast of Atlit. The average depth of the northern section is 142 m with a standard deviation of about 5 m (Figure 13). This varies between 90 and 101 m of water-depth (average depth of 95 m), and an average sediment thickness of about 46 m, with a standard deviation of 3.1 m (Table 1).
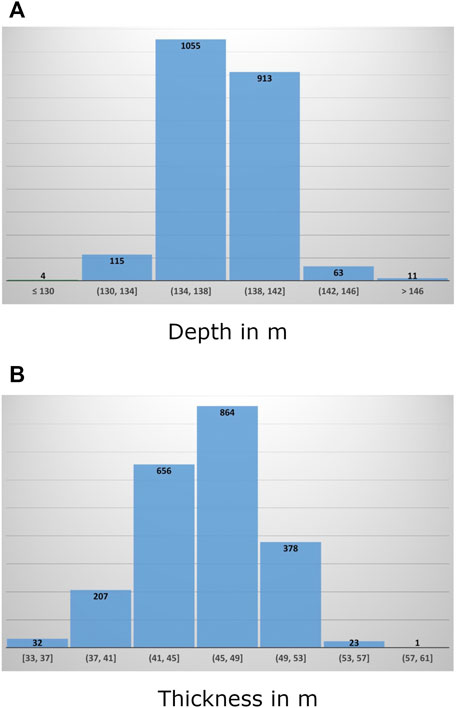
FIGURE 12. Southern contour histogram: (A) Depths of pinchout points; (B) Sediment thicknesses above the pinchout contour.
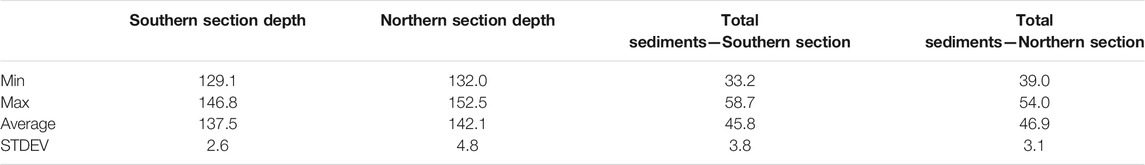
TABLE 1. Contour depth and sediment thickness.
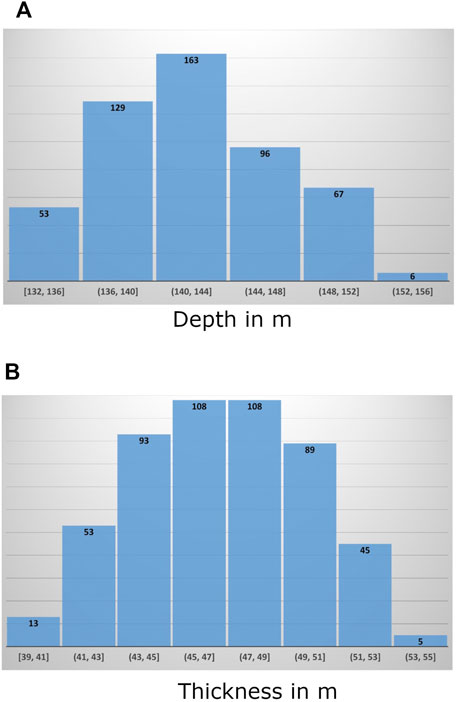
FIGURE 13. Northern contour depth histogram: (A) Depths of Pinchout points; (B) Sediment thicknesses above the pinchout contour.
Discussion and Conclusion
We mapped the landward termination of a stratigraphic horizon using 3D exploration seismic data. As the thickness of sediments above the pinchout corresponds to sedimentation since the last ice age, and the flexural rigidity is very small, this pinchout may be compatible with the shoreline during the last glacial maximum (LGM). If this is the case, the last activity of the Dor disturbance between the two sectors of the shoreline is necessarily younger than 26 ka.
The locus of pinch-outs we mapped maintains a near-uniform depth, with only exceptions in the disturbance locations. In these places, it initially deepens at the edge of the Dor disturbance, until it disappears completely. North of this point, it returns at an initial slightly greater depth and ascends as it advances north until it disappears completely. The locus of pinch-outs in this section also maintains a relatively uniform depth and is located between the same horizons mapped in this work. This supports our conclusion that it represents, in fact, an equivalent stratigraphic element (a paleo-isobath) with a break between the sectors.
A number of global melting events followed the LGM, resulting in a significant rise in sea level within a short time. One such event occurred following the Younger Dryas period between 12.5 and 9.5 ka (Melt-water pulse 1B), when sea levels rose roughly 28 m (Fairbanks, 1989; Lambeck et al., 2014; Rohling et al., 2014).
Such an event, with a rapid and significant sea level rise, caused a major loading on the column of young unconsolidated water saturated sediments. In this scenario, with the sediments more sensitive to liquefaction, ground shaking in the area during these periods could cause landslides (Braun et al., 2010).
(Shtienberg et al., 2020) dated a sedimentary event in an onshore sediment core at Dor, possibly from a mega-tsunami on the shores of the Mediterranean; this was dated to 9.91–9.29 ka. The interpreted tsunami was attributed to an underwater landslide in the Dor disturbance. The expression of these landslides is distinguished in the bathymetry of the seafloor (Katz et al., 2015; Katz and Hamiel, 2019; Ashkenazi et al., 2021); they corroborate our findings and their dating can be constrained by the mapping of the horizons in the shallow medium (Figures 3–10).
The correlation between the dating of ancient earthquakes and periods of fast environmental changes in the Mediterranean nearshore indicates a possible interconnection. Earthquakes often trigger soil liquefaction as well as relatively small faults that in turn cause landslides that could scar the shallow horizons we mapped. We compared traces of the near-surface faults that we mapped with epicenters of some seven microearthquakes located in the study area; four occurred in the last 15 years and an additional three earthquakes occurred between 1983 and 1989 (Schardong et al., 2021; Geological Survey of Israel, 2022). The epicenters correlate with fault traces, increasing the concern that these faults may be active and that additional landslides may occur in earthquake prone areas (Figure 1). The largest event (ML > 3) is also the deepest (> 30 km), raising a possible connection with subcrustal tectonic processes.
Multiple faults offset horizons within the survey area (Figures 3, 4). While some faults reach the current seafloor, others are truncated by the slump; these small faults are likely factors in causing slumping, or at least in destabilizing the gently sloping strata.
To conclude, seismic volumes produced by 3D surveys for the hydrocarbon industry contain considerable untapped information regarding the shallow strata. This area is generally less studied by petroleum geophysicists, as their main interest lies in the layers at depths of several kilometers. When the subsurface is imaged in 3D, it is possible to find shorelines, landslide scars, faults and other characteristics that make it possible to understand not only the geological past of the survey area but also its present activity.
Can we interpret pinchout points as paleo-shorelines? Are faults seen elsewhere in similar surveys still active? Could additional metastable landslides lie within surveyed areas? These are questions that can most likely be addressed with the help of 3D seismic surveys despite their focus on the deeper strata.
Data Availability Statement
The datasets presented in this article are not readily available because the Isramco and Gabriela 3D seismic volumes are available by request to the corresponding author, with the permission of the Ministry of Energy for academic use alone. Requests to access the datasets should be directed to Dr. Michael Gardosh, https://www.gov.il/en/departments/Units/natural_resources_administration.
Author Contributions
RA and AA contributed to the conception and design of the study. RA and BM contributed to organizing the data and performing the stratigraphic interpretation. RA wrote the first draft of the manuscript. All authors contributed to manuscript revision, read and approved the submitted version.
Conflict of Interest
The authors declare that the research was conducted in the absence of any commercial or financial relationships that could be construed as a potential conflict of interest.
Publisher’s Note
All claims expressed in this article are solely those of the authors and do not necessarily represent those of their affiliated organizations, or those of the publisher, the editors and the reviewers. Any product that may be evaluated in this article, or claim that may be made by its manufacturer, is not guaranteed or endorsed by the publisher.
Acknowledgments
Schlumberger is acknowledged for kindly providing PETREL software used for seismic interpretation. The Late Moshe Politi generously contributed his time, attention, advice and seismic data. We are grateful to Y. Makovsky for useful discussions. JK Hall kindly commented on early drafts.
References
Almagor, G., and Garfunkel, Z. (1979). Submarine Slumping in continental Margin of Israel and Northern Sinai. AAPG Bull. 63, 324–340. doi:10.1306/c1ea5607-16c9-11d7-8645000102c1865d
AMPHIBIO Ltd. (2016). Environmental Management and Monitoring Program, TNS-1. Noble Energy Mediterranean Ltd. For Planning Administration of Haifa Region. Available at: https://www.gov.il/BlobFolder/generalpage/tns_37/he/Water_Energy_Communication_tns_sea_1.pdf (Accessed January 3, 2022).
Anzidei, M., Antonioli, F., Benini, A., Lambeck, K., Sivan, D., Serpelloni, E., et al. (2011). Sea Level Change and Vertical Land Movements since the Last Two Millennia along the Coasts of Southwestern Turkey and Israel. Quat. Int. 232, 13–20. doi:10.1016/j.quaint.2010.05.005
Ashkenazi, L., Katz, O., Abramovich, S., Makovsky, Y., and Gadol, O. (2022). Benthic Foraminifera as Indicators of Recent Mixed Turbidite-Contourite Sediment Transport System in the Eastern Mediterranean Upper Continental Slope, Offshore Israel. Mar. Geol. 445, 106756. doi:10.1016/j.margeo.2022.106756
Barnea Cohen, O., Cesca, S., Dahm, T., Hofstetter, A., Agnon, A., and Hamiel, Y. (2022). Lateral Inducing of Earthquakes by Shallow Creep Involving a Salt Formation in the Northern Dead Sea Transform, Kinneret (Sea of Galilee) Basin. Tectonics. in Revision.
Braun, Y., Kagan, E., Bar-Matthews, M., Ayalon, A., and Agnon, A. (2010). Dating Speleoseismites Near the Dead Sea Transform and the Carmel Fault: Clues to Coupling of a Plate Boundary and its branch. Isr. J. Earth Sci. 58, 257–273.
Fairbanks, R. G. (1989). A 17,000-year Glacio-Eustatic Sea Level Record: Influence of Glacial Melting Rates on the Younger Dryas Event and Deep-Ocean Circulation. Nature 342, 637–642. doi:10.1038/342637a0
Frey Martinez, J., Cartwright, J., and Hall, B. (2005). 3D Seismic Interpretation of Slump Complexes: Examples from the continental Margin of Israel. Basin Res. 17, 83–108. doi:10.1111/j.1365-2117.2005.00255.x
Gadol, O., Tibor, G., ten Brink, U., Hall, J. K., Groves‐Gidney, G., Bar‐Am, G., et al. (2020). Semi‐automated Bathymetric Spectral Decomposition Delineates the Impact of Mass Wasting on the Morphological Evolution of the continental Slope, Offshore Israel. Basin Res. 32, 1166–1193. doi:10.1111/bre.12420
Garfunkel, Z. (1984). Large-scale Submarine Rotational Slumps and Growth Faults in the Eastern Mediterranean. Mar. Geology. 55, 305–324. doi:10.1016/0025-3227(84)90074-4
Geological Survey of Israel (2022) Earthquake Bulletins. Available at https://earthquake.co.il/en/earthquake/bulletins.php (Accessed January 27, 2022).
Ginzburg, A., Cohen, S. S., Hay-Roe, H., and Rosenzweig, A. (1975). Geology of Mediterranean Shelf of Israel. AAPG Bull. 59, 2142–2160. doi:10.1306/83d9220d-16c7-11d7-8645000102c1865d
Gvirtzman, G., and Buchbinder, B. (1969). Outcrops of Neogene Formation in the Central and Southern Coastal Plain. Hashephela and Be’er Sheva Regions, Jerusalem, Israel: Geological Survey of Israel, 50.
Gvirtzman, G., Shachnai, E., Bakler, N., and Ilani, S. (1983). Stratigraphy of the Kurkar Group (Quaternary) of the Coastal Plain of Israel. GSI, Curr. Res., 70–82.
Gvirtzman, G. (1969). The Saqiye Group (Late Eocene to Early Pleistocene) in the Coastal plain and Hashfela Regions, Israel 1: 100 000: Volume 2, Maps. Geological Survey of Israel & Institute for Petroleum research and Geophysics.
Hall, J. K., Lippman, S., Gardosh, M., Tibor, G., Sade, A. R., Sade, H., et al. (2015). “A New Bathymetric Map for the Israeli EEZ: Preliminary Results,” in Ministry of National Infrastructures, Energy and Water Resources and the Survey of Israel (Jerusalem, Israel), 11. Available at: http://energy.gov.il/Subjects/OilSearch/Pages/GxmsMniOSReportsBathymetricMap.aspx (Accessed December 20, 2021).
Hübscher, C., Betzler, C., and Reiche, S. (2016). Seismo-stratigraphic Evidences for Deep Base Level Control on Middle to Late Pleistocene Drift Evolution and Mass Wasting along Southern Levant continental Slope (Eastern Mediterranean). Mar. Pet. Geology. 77, 526–534. doi:10.1016/j.marpetgeo.2016.07.008
Inman, D., and Jenkins, S. A. (1984). “The Nile Littoral Cell and Man’s Impact on the Impact on the Coastal Zone of the Southeastern Mediterranean,” in Proceedings of the 19th International Coastal Engineering Conference, 1600–1617.
Katz, O., and Hamiel, Y. (2019). The Nature of Small to Medium Earthquakes along the Eastern Mediterranean Passive continental Margins, and Their Possible Relationships to Landslides and Submarine Salt-Tectonic-Related Shallow Faults. Geol. Soc. Lond. Spec. Publications 477, 15–22. doi:10.1144/sp477.5
Katz, O., Reuven, E., and Aharonov, E. (2015). Submarine Landslides and Fault Scarps along the Eastern Mediterranean Israeli continental-slope. Mar. Geology. 369, 100–115. doi:10.1016/j.margeo.2015.08.006
Lambeck, K., Rouby, H., Purcell, A., Sun, Y., and Sambridge, M. (2014). Sea Level and Global Ice Volumes from the Last Glacial Maximum to the Holocene. Proc. Natl. Acad. Sci. 111, 15296–15303. doi:10.1073/pnas.1411762111
Lazar, M., Lang, G., and Schattner, U. (2016). Coincidence or Not? Interconnected Gas/fluid Migration and Ocean-Atmosphere Oscillations in the Levant Basin. Geo-mar Lett. 36, 293–306. doi:10.1007/s00367-016-0447-5
Neev, D., Almagor, G., Arad, A., Ginzburg, A., and Hall, J. K. (1973). The Geology of the Southeastern Mediterranean Sea. Jerusalem: Geological Survey of Israel.
Neev, D., Edgerton, H. E., Almagor, G., and Bakler, N. (1966). Preliminary Results of Some Continuous Seismic Profiles in the Mediterranean Shelf of Israel. Isr. J. Earth Sci. 15, 170–178.
Rohling, E. J., Foster, G. L., Grant, K. M., Marino, G., Roberts, A. P., Tamisiea, M. E., et al. (2014). Sea-level and Deep-Sea-Temperature Variability over the Past 5.3 Million Years. Nature 508, 477–482. doi:10.1038/nature13230
Schardong, L., Horin, Y. B., Ziv, A., Myers, S. C., Wust‐Bloch, H., and Radzyner, Y. (2021). High‐Quality Revision of the Israeli Seismic Bulletin. Seismol. Res. Lett. 92, 2668–2678. doi:10.1785/0220200422
Schattner, U., Gurevich, M., Kanari, M., and Lazar, M. (2015). Levant Jet System-Effect of post LGM Seafloor Currents on Nile Sediment Transport in the Eastern Mediterranean. Sediment. Geology. 329, 28–39. doi:10.1016/j.sedgeo.2015.09.007
Schattner, U., Lazar, M., Tibor, G., Ben-Avraham, Z., and Makovsky, Y. (2010). Filling up the Shelf - A Sedimentary Response to the Last post-glacial Sea Rise. Mar. Geology. 278, 165–176. doi:10.1016/j.margeo.2010.10.006
Keywords: pinchout points, dor disturbance, 3D seismic data, landslide, paleo contour, shoreline
Citation: Algon R, Medvedev B and Agnon A (2022) Paleo Isobaths in 3D Seismic Exploration Data Uncover Submerged Shorelines From Glacial Lowstands: A Case Study From the Levant Basin. Front. Earth Sci. 10:805715. doi: 10.3389/feart.2022.805715
Received: 30 October 2021; Accepted: 28 January 2022;
Published: 10 March 2022.
Edited by:
Mimmo Palano, Istituto Nazionale di Geofisica e Vulcanologia (INGV), ItalyReviewed by:
Luigi Ferranti, University of Naples Federico II, ItalyAndrea Zanchi, University of Milano-Bicocca, Italy
Copyright © 2022 Algon, Medvedev and Agnon. This is an open-access article distributed under the terms of the Creative Commons Attribution License (CC BY). The use, distribution or reproduction in other forums is permitted, provided the original author(s) and the copyright owner(s) are credited and that the original publication in this journal is cited, in accordance with accepted academic practice. No use, distribution or reproduction is permitted which does not comply with these terms.
*Correspondence: R. Algon, cm9uLmFsZ29uQG1haWwuaHVqaS5hYy5pbA==