- 1Department of Earth Science and Engineering, Imperial College London, London, United Kingdom
- 2Department of Petroleum Engineering, Baze University, Abuja, Nigeria
This paper presents a detailed study investigating the effect of hydrocarbon presence on magnetic mineral diagenesis in sediments from the Catcher Area Development (CAD) region, UK North Sea, between 1,000 and 1,500 m (True Vertical Depth Sub-Sea). Magnetic analysis of core samples from hydrocarbon fields of the region and nearby dry-well sandstones (background) was carried out to determine if their signatures can serve as a proxy for understanding petroleum reservoir systems. From the background samples, nanometric and micron-sized magnetite, hematite and titano-iron oxides, were identified. Hydrocarbon presence in the reservoir sediments was found to diminish the iron-oxide signature and favour the precipitation of hexagonal pyrrhotite, siderite and potentially vivianite, lepidocrocite, greigite and paramagnetic iron sulphides. Hexagonal pyrrhotite was found at the oil-water transition zones. This relationship is possibly related to biodegradation at this interface. Siderite was found in increased abundance at shallower depths within the reservoir, which we attribute to hydrocarbon vertical migration and biodegradation. The interbedded shales also experienced significant magnetic mineral diagenesis that depended on its proximity to the hydrocarbon plume. These findings suggest that mineral magnetism can be applied to the identification of oil-water transition zones, reserve estimation, production planning and the determination of hydrocarbon migration pathways. It also suggests that mineral magnetic methods can be used to estimate the timing of hydrocarbon migration.
1 Introduction
Many studies have shown that hydrocarbon migration into sedimentary rocks results in magnetic mineral diagenesis (e.g., Elmore et al., 1987; Machel, 1995; Liu et al., 2006a; Badejo et al., 2021c; Gaikwad et al., 2021), however, the product of this process has revealed significant variability in minerology and susceptibility along this migration pathway. Enhancement and destruction of magnetic signature has been reported for different environments, e.g., the formation of magnetite resulting in over an order increase in magnetization in the hydrocarbon saturated sediments of the Ordovician Arbuckle Group in South Oklahoma (Elmore et al., 1987), the replacement of authigenic iron oxides by pyrite resulting in diminished magnetization in the Cenozoic sandstones of south west Texas (Reynolds et al., 1993), and the formation of hydrocarbon related authigenic maghemite in the Mawangmiao Oil Field, Jianghan Basin, China (Liu et al., 2006a). Variability in responses are generally supported by thermodynamic modelling (Machel, 1995), which predict a wide range of diagenetic behaviours of magnetic minerals in the presence of hydrocarbons depending on background rock mineralogy, depth, sulphur presence etc., however, recent experimental studies indicate that the responses are complex and are not yet fully understood (Emmerton et al., 2013; Abubakar et al., 2020; Badejo et al., 2021c). These thermodynamic models are reliable within a simplistic framework, yet, they fail to capture the complexity of biogenic related processes, which are known to be important to magnetic mineral diagenesis at shallow depths (Emmerton et al., 2013; Roberts, 2015).
Previous studies have shown that mineral magnetic methods can be used to help understand hydrocarbon migration patterns and trace its subsurface pathway on large scales, e.g., >50 km (Abubakar et al., 2020; Badejo et al., 2021a). In this study, we investigate for trends on a smaller scale, within a reservoir system. We also test the universality of the findings found previously (Emmerton et al., 2013; Abubakar et al., 2020; Badejo et al., 2021c). For this aim, in this study, we determine the effect of hydrocarbon presence on the magnetic signature of Cenozoic reservoir sediments of the Catcher Area Development (CAD) region, UK North Sea. The CAD fields are an especially good laboratory to understand hydrocarbon-induced magnetic diagenesis due to: 1) it being a well constrained spill-fill chain system of closely related hydrocarbon accumulations (Forsythe et al., 2017b), 2) the variability in properties of the hydrocarbon fluids (Table 1). There is an increase in density (or decrease in API gravity) and level of degradation of the oil as the reservoir shallows. In these fields, an inverse relationship exists between biodegradation and API gravity (Forsythe et al., 2017b; Gibson et al., 2020) which is typical of the North Sea hydrocarbons (Badejo et al., 2021c), and 3) the presence of “dry” sands from the same stratigraphic level from neighbouring wells that can serve as the background signal. These sands are reported as “dry” in well reports and represent sandstone that have not been infiltrated by migrating hydrocarbon. They also exist at least 6 km away from any well with hydrocarbon shows.
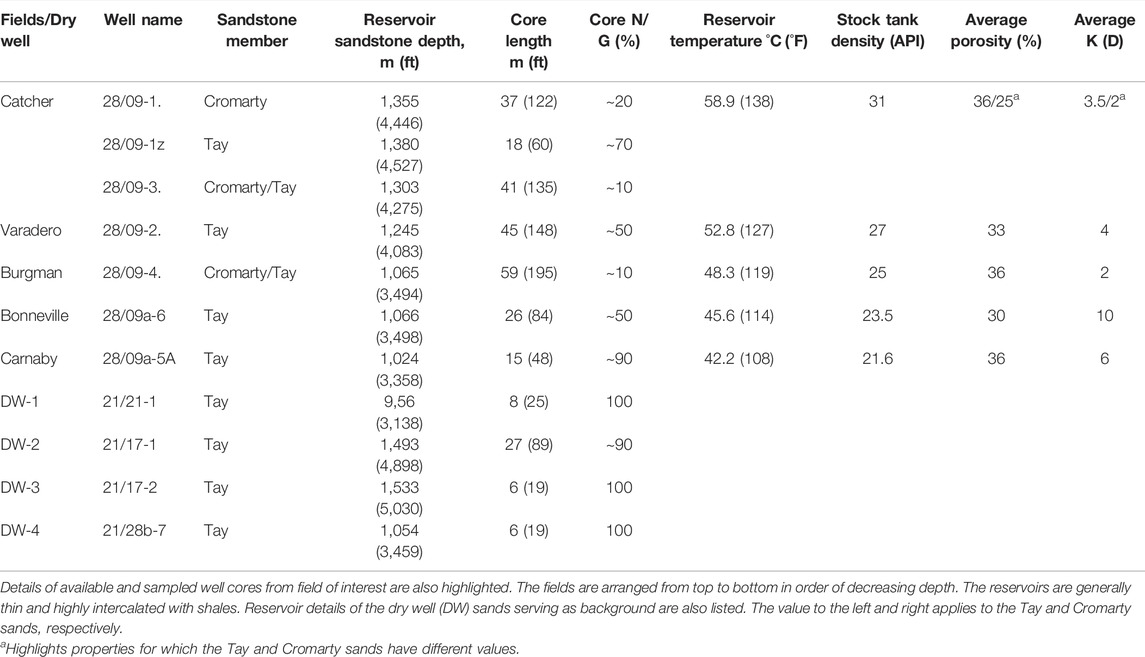
TABLE 1. Reservoir and fluid properties for Catcher Area Development (CAD) fields, compiled using details obtained from well reports (Available at https://ndr.ogauthority.co.uk).
This study focuses on magnetic mineral diagenesis with respect to the reservoir sandstones of the CAD hydrocarbon accumulations (Figures 1, 2). It investigates the potential of providing magnetic proxies useful for reservoir characterization and the improvement of production processes e.g. through the identification of oil-water contacts (OWC), determination of degradation levels of hydrocarbons etc. (Emmerton et al., 2013; Badejo et al., 2021c). The depth (or temperature) range under consideration is emphasized as this has been shown by thermodynamic models (Burton et al., 1993; Machel, 1995) and experimental studies (Kars et al., 2014; Abubakar et al., 2015) to affect the diagenetic processes and the generation of magnetic minerals.
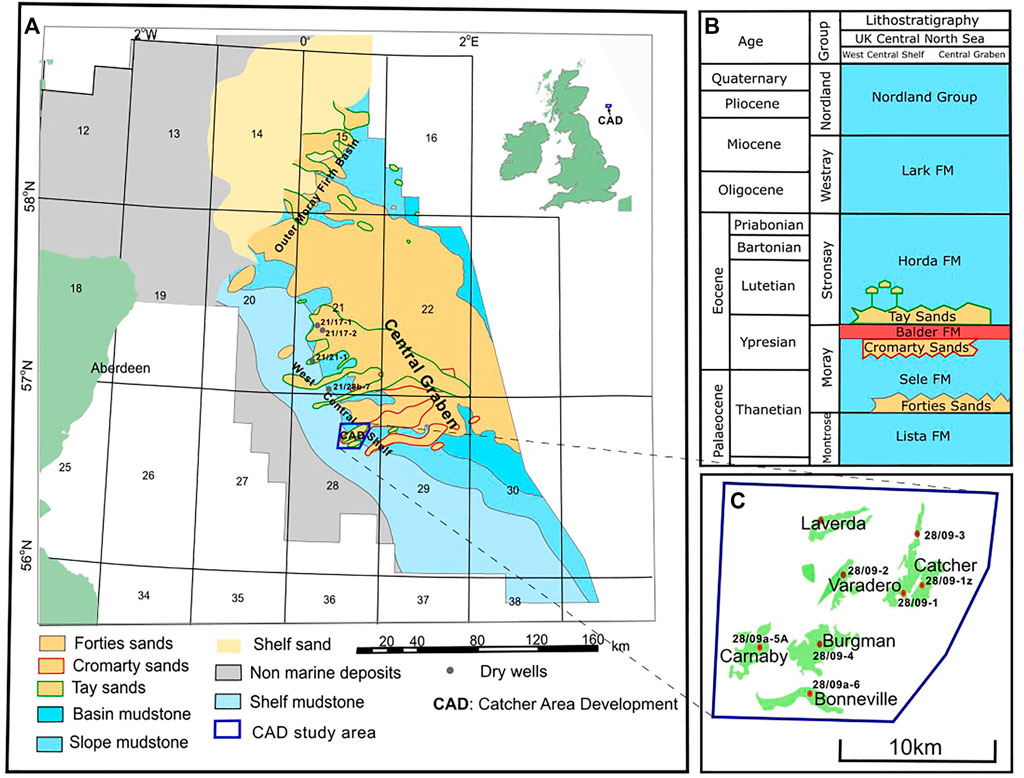
FIGURE 1. (A) Regional map and (B) stratigraphic column highlighting the distribution of Tay (depositional and injected), Cromarty and Forties sandstone members in the Central North Sea. The Catcher Area Development lies in the West Central Shelf of the UK Central North Sea and is highlighted in blue. (C) The distribution of hydrocarbon fields in the study area is highlighted. All fields in the CAD except Laverda have cored wells.
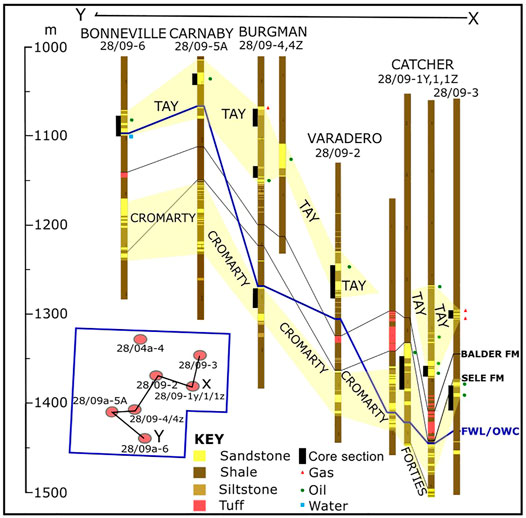
FIGURE 2. Well correlation diagram highlighting the depth relationship of the reservoir sands of the CAD region. The hydrocarbon filled sands (gas-saturated and oil-saturated) together with the oil-water-contacts/free-water-levels are shown. The core sections obtained during drilling are also highlighted.
2 Study Area
The Catcher Area Development (CAD) is located about 180 km ESE of Aberdeen, UK, and is a multiple field development consisting of six Cenozoic hydrocarbon fields in the West Central Shelf of the UK North Sea (Figures 1, 2) (Gibson et al., 2020). The closely spaced oilfields (distance between individual fields is 2–5 km) and associated gas attics present a complex fluid migration to trapping system that has been influenced significantly by prior Cenozoic faulting and sand injection events (Gibson et al., 2020). Although not apparent from the present-day structural interpretation of the region, geochemical analysis of the crude from these reservoirs strongly suggests a connectivity between these fields that resulted in a fill-spill chain mechanism of hydrocarbon filling (Forsythe et al., 2017a). The Tay sandstone is the main CAD reservoir sand with the Cromarty sands forming part of the reservoir of the deepest field (Figures 1B, 2). The Upper Tay sands also known as the ‘Orkney’ sands (Gibson et al., 2020) are the host to the isolated attic gas accumulations. The reservoirs are generally thin with a net thickness of between 10 and 30 m. The reservoir properties are very similar for the different fields, while the fluid properties exhibit a depth relationship (Gibson et al., 2020). The sandstones are intercalated with variable and significant amounts of shale. Cores were collected from seven wells in five of these fields during drilling (Table 1).
3 Experimental Methodology
3.1 Sample Collection
We collected 108 sandstone samples from the CAD cores archived at the British Geological Survey Core Store, Keyworth (UK). These cores were generally sampled every metre where sandstone was present. Smaller sampling spacing was used in areas of observed heterogeneity and around known hydrocarbon-fluid contacts. Fifteen samples were collected from the interbedded shales section of the CAD cores. A further 26 samples were collected from four dry wells to serve as background (Figure 1; Table 1); these dry-well cores were also Tay sandstones of the West Central Shelf and were collected from a similar depth range as the oilfield samples. These samples were classified as dry due to 1) an observed absence of hydrocarbon stains throughout the well section, 2) the core reports and resistivity readings on the well logs revealing the absence of hydrocarbons in these sands, and 3) the wells locations were at least 6 km away from any known hydrocarbon accumulation/show.
The CAD sandstones are generally thin (Figure 2) and friable as is typical of Cenozoic sand layers of the region. Their cores were generally obtained from the oil layer of the reservoirs with only the core from Bonneville field sampling reservoir sands below the oil-water contact (OWC); length of core collected below the contact is approximately 3 m. The degree of stain in the oil layer appears to increase as the reservoirs’ shallow, reflecting the increase in density (or decrease in API gravity).
3.2 Gas Chromatography-Mass Spectrometry
To confirm that the sandstone samples had not been in contact with migrating hydrocarbon in the subsurface, four randomly selected sandstone samples from the dry wells were tested for residual hydrocarbons using gas chromatography-mass spectrometry (GC-MS). ∼1 g of each sample was powdered and added to a clean test tube, with 10 μl of a prepared internal standard of squalene and p-terphenyl. Four milliliters of dichloromethane (DCM)/methanol 93:7 v/v were added to the test tubes. The samples underwent 5 min of sonication, followed by 3 min in a centrifuge at 1.5 rpm. The supernatant was moved into a new test tube and the process repeated four times per sample. Copper turnings were added to the supernatant to remove elemental sulphur. Once completed the DCM: methanol mixture was evaporated and replaced by DCM: n-hexane 1:1 v:v. The aliphatic and aromatic fractions were eluted by column chromatography using activated alumina powder using DCM: n-hexane 1:1 v:v. The fraction was further concentrated to <1 ml.
GC-MS analysis was conducted using an Agilent Technologies 7890A GC system coupled to a 5,975°C mass spectrometer, in the organic geochemistry laboratory of Earth Science and Engineering, Imperial College London. The GC injector was run in a splitless mode (1 μl) with the column flow rate set at 1.1 ml/min. A J&W Scientific DB-5MS capillary column was used for compound separation and He used as a carrier gas. The GC oven was started at 40°C for 2 min, this was raised at a rate of 5°C/min−1 to 310°C and held for 14 min. Mass spectra were acquired in electron impact mode in the scan range of 50–500 amu. The data was qualitatively checked using the Mass Hunter software package.
3.3 Rock Magnetic Methods
Rock magnetic experiments were carried out on the sampled sandstone and shales to determine their magnetic minerology and magnetic grain size. These experiments were carried out at Imperial College London (United Kingdom), the Institute for Rock Magnetism (I.R.M.) at the University of Minnesota (United States), and the Institut de Physique du Globe de Paris (France). At Imperial, magnetic susceptibility (χ) was measured for the samples using the MFK1-FA Kappabridge (field = 200 Am−1), and hysteresis loops and backfield demagnetization curves were measured at room temperature (RT) with a Princeton Measurements Corporation Vibrating Sample Magnetometer (VSM) to determine the saturation magnetisation Ms, isothermal remanent magnetization Mrs, coercivity Bc and coercivity of remanence Bcr. The Princeton VSM was also used to measure isothermal remanent magnetization (IRM) acquisition curves for a subset of these samples and was applied to determine parameters such as the IRM contributions (of the different magnetic mineral contributors based on coercivity classes) and the S-ratio (−IRM@−0.3T/IRM@1T).
To help identify the magnetic minerology, non-destructive low-temperature magnetometry, (LTM) and high-temperature susceptibility, (HT-χ) experiments were carried out on 36 and 98 CAD sandstone samples, 3 and 15 CAD shale samples, and 10 and 26 dry well samples respectively (Supplementary Table S1). LTM enables the identification of low-temperature phase transitions which are mostly unique to a magnetic mineral, e.g., the Verwey transition of magnetite at ∼120 K (Verwey, 1939). LTM was performed using Quantum Design Magnetic Properties Measurement System (MPMS) instruments located at the I.R.M., Institut de Physique du Globe de Paris and the SPIN-Lab at Imperial College, London. Measurements were carried out on powdered samples weighing between 0.2 and 0.4 g: 1) Field Cooling (FC)—the samples were cooled in a field of 2.5 T from room temperature to 10 K, followed by measurement of remanence on warming to 300 K in zero field, 2) Zero-Field Cooling (ZFC) – samples were cooled in zero field to 10 K, when a saturation isothermal remanent magnetization (SIRM) was induced with a field of 2.5 T and subsequently measured on warming to 300 K, and 3) at 300 K, a room temperature SIRM (RT-SIRM) was imparted in a field of 2.5 T followed by remanence measurement through a 300 K–10 K–300 K cycle.
HT-χ measurements involved measuring the magnetic susceptibility of the samples as they are heated in Ar from room temperature to 700°C and back. We did this using Agico Kappabridges located at Imperial and the I.R.M. This enables the identification of magnetic minerals through their phase transitions and/or the observed mineral alteration pattern. Multi-cycle HT-χ curves were also measured for some samples to help to distinguish between reversible and irreversible changes during heating.
3.4 Mössbauer Spectroscopy
Mössbauer spectroscopy was used as a complementary quasi-magnetic mineral identification technique due to its ability to distinguish amongst magnetic minerals (Dyar et al., 2006). Mössbauer spectra were measured for 10 CAD samples and two background samples using a cobalt source within a MS6 Mössbauer spectrometer, with Janis SVT-400 Nitrogen-shielded liquid Helium cryostat at the I.R.M. The CAD samples were selected to include the different behaviours observed via their χ, LTM and the HT-χ measurements. Due to the estimated low concentration of the magnetic minerals, magnetic extraction was carried out in some samples using an S. G. Frantz co. inc. Frantz magnetic separator (model LB-1) at Imperial to obtain a concentrated fraction for analysis.
3.5 Scanning Electron Microscopy
SEM analysis was used to characterise the magnetic grains via their size and morphology. Energy dispersive X-ray (EDX) analysis was used to perform elemental analysis with the aim of confirming the mineralogy of the magnetic grains. Samples were selected based on their magnetic signature and relative magnetic strength as determined through the various magnetic analysis. The selected samples were crushed to obtain a grain size of <50 μm, and then to increase the concentration of the magnetic minerals, magnetic extraction was carried out using the S. G. Frantz co. inc. Frantz magnetic separator (model LB-1). The magnetic extracts were mounted on SEM stubs and coated in 15 nm chromium, then subsequently analysed using the JEOL 6010LA and the Zeiss Auriga Cross Beam at the Department of Materials, Imperial.
4 Results
4.1 Gas Chromatography-Mass Spectrometry
Gas-Chromatography-Mass Spectrometry (GC-MS) was performed on small number of background samples to try to detect for the presence of hydrocarbons. The GC-MS responses of the background sandstone samples were indistinguishable from the control sample which contained just the Squalane standard (Figure 3); there were no peaks matching the expected mass spectra of common biomarker compounds as discussed in Peters et al. (2005). The few very minor peaks observed likely represent contaminants induced most likely during extraction and storage; for example, the peak labelled “ps” observed in all the samples had a mass spectrum characterised by a dominant ionic peak at 149 m/z, indicative of contamination by plasticiser, most likely from the Core Store. The similarity in signature between the control and the sandstone-samples’ chromatographs, and the general lack of biomarkers suggest that the dry core samples likely represent the true background signal. Badejo et al. (2021c) also used GC-MS analysis to provide support for wells being truly “dry.”
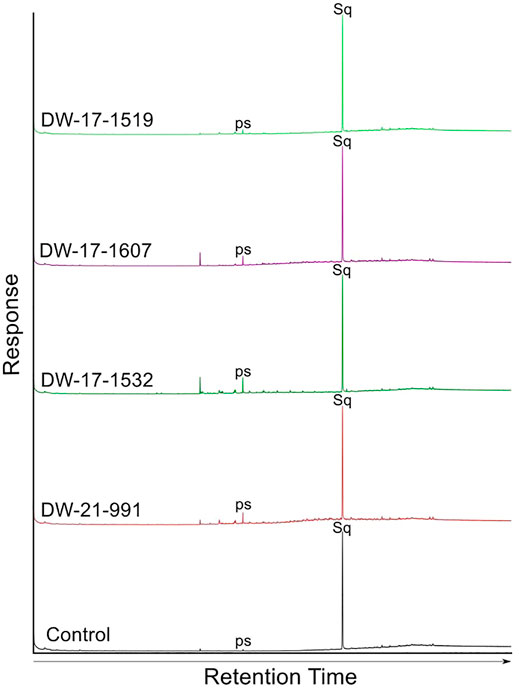
FIGURE 3. GC-MS results of hydrocarbon fractions from extract obtained for sandstone samples of the dry wells serving as background. The samples are from wells 21/17-1, 21/17-2 and 21/21-1. A control sample is also included to ensure accurate interpretation of results.
4.2 Hysteresis, Isothermal Remanent Magnetization Acquisition Curves and FORC Analysis
To characterise the magnetic mineralogy, abundance and grain-size distributions, mass normalized room-temperature susceptibility, (χ) and hysteresis parameters (Mrs, Ms, and Bc) were measured (Table 2).
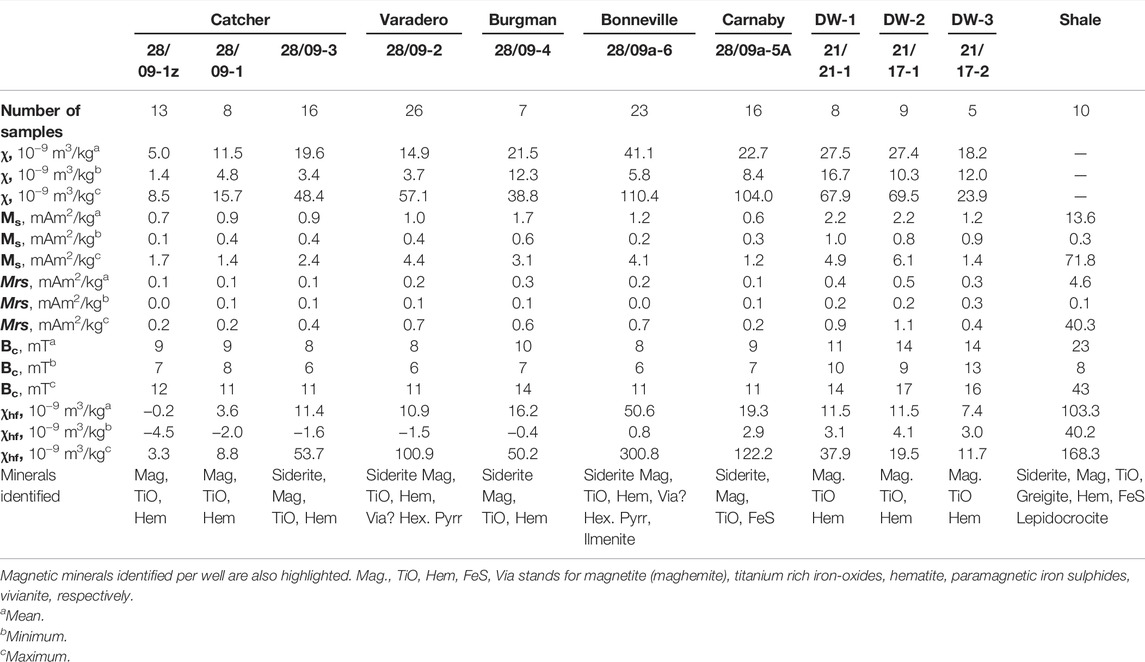
TABLE 2. Mean, minimum and maximum values obtained for magnetic susceptibility and hysteresis parameters of the hydrocarbon reservoir, background and the surrounding shales samples.
4.2.1 The Background Samples
To quantify the magnetic concentration of the samples, the Mrs and χ are considered. The unstained sandstones were magnetically weak with Mrs values between 0.13 and 1.13 mAm2/kg, and their magnetic susceptibility range between 7.6 × 10⁻⁹ and 69.5 × 10⁻⁹ m3/kg. A strong correlation is observed between Mrs and χ with R-squared value of ∼0.89; this correlation cannot be rejected at 95% confidence (Figure 4). The coercivity values range between 9 and 17 mT, values typical for many magnetic minerals including magnetite. Plotting the hysteresis data on a ‘Day’ plot (Day et al., 1977) (Figure 5), suggests that these samples consist of mainly magnetic grains of pseudo-single domain (PSD; for magnetite 0.1–10 µm in size) and potentially superparamagnetic (SP) behaviour (<30 nm for magnetite). Although some samples revealed significant undersaturation even at the maximum field of the VSM used (Figure 7I), and this may account for some of the SP signature observed. The trend of the data and the high Bcr/Bc ratio also suggest that pure magnetite is not the dominant minerology (Sprain et al., 2016).
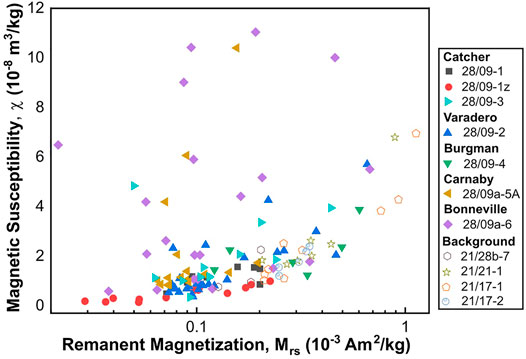
FIGURE 4. Relationship between remanent magnetization and magnetic susceptibility for CAD hydrocarbon reservoir sandstones (solid symbols) and the background sandstones (hollow symbols). For the background samples, there exists a strong correlation between Mrs and χ with R-squared value of 0.89. However, the correlation for these two parameters is weak for the CAD samples (R-squared value of ∼0.2). These R-squared values are statistically significant with p-values of <0.05.
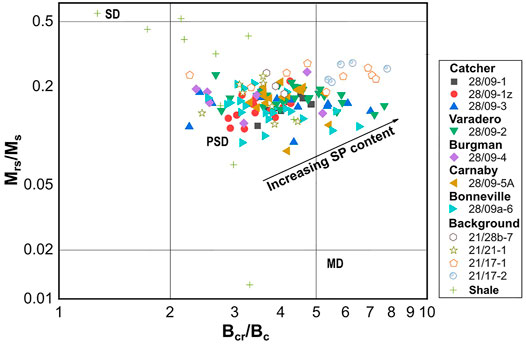
FIGURE 5. Day plot for all measured samples (CAD and background) of this study. The regions associated with the SP, SD, PSD, and MD behaviours for magnetite are shown for comparison purposes.
To further characterise the samples, FORC diagrams were measured. The FORC diagrams for these samples generally present a main coercivity peak between 0 and 5 mT, with the FORC distribution spreading in both vertical, bu axes directions up to 50 mT (Figures 6C, F, L). The maximum bc tail extends up to 80 mT giving the FORC distributions a triangular-like shape (Figures 6C, F). These features indicate a mix of grain sizes: single-domain (SD) to multi-domain (MD) (Muxworthy and Dunlop, 2002; Roberts et al., 2018). In some samples, subtle signs for the presence of SP nanoparticles (<30 nm) were observed i.e., contours along the vertical axis extending down to −100 mT (Figure 6L) (Pike et al., 2001). This observation supports the presence of SP ferromagnetic grains as suggested by the Day plot.
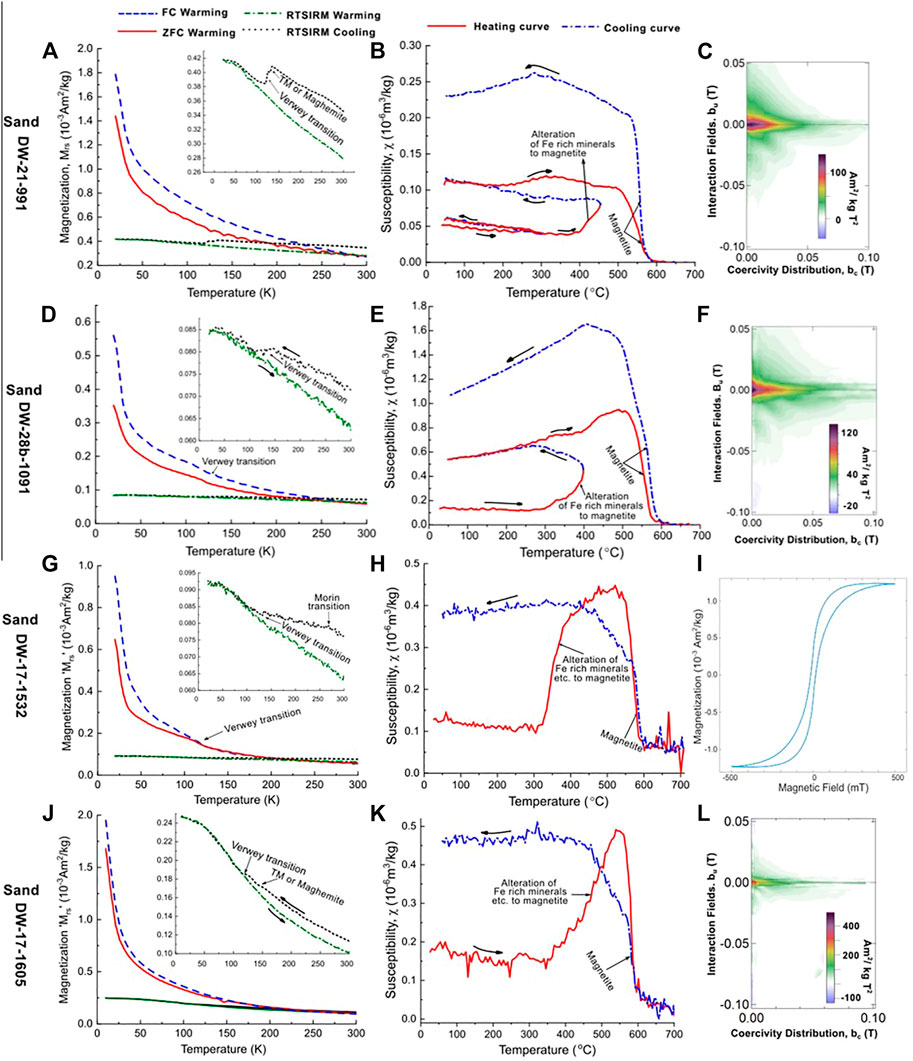
FIGURE 6. Example results from LTM, HT-χ and FORC measurements for the background samples; DW-21-991, DW-28b-1091, DW-17-1532 and DW-17-1605 are shown on (A–C), (D–F), (G–I) and (J–L), respectively. The background samples measurement curves suggest the presence of magnetite and titanomagnetite (or their oxidized versions), hematite and potentially titanohematite. Note that TM stands for titanomagnetites. The subsurface depth (in m) of the samples’ collected is highlighted in the sample name, i.e., the last segment of their names.
To further quantify the magnetic remanence carriers in the samples, the measured IRM curves were analysed using the cumulative log Gaussian (CLG) analysis method (Kruiver et al., 2001) (data are shown in the Supplementary Material). This method assumes that the IRM acquisition curve follows a CLG function. The field values of the acquisition curves are converted to their log values and plotted against the IRM as the linear acquisition plot (LAP) and on a probabilistic scale as the standardized acquisition plot (SAP) (Supplementary Figure S1A). The gradient of the IRM is also plotted on a gradient acquisition plot (GAP) (Supplementary Figure S1B). These curves can then be analysed for number of components, their IRM contributions and coercivity values via forward modelling. Analysis of the IRM acquisition curves of the background samples presented with S-ratios (−IRM@−0.3T/IRM@1T) ranging from 0.54 to 0.86. An example analysis representative of the trend observed is shown in Supplementary Figures S1A,B and Supplementary Table S1. Mean coercivities, B1/2 of 30, 40, and 250 mT were obtained for the three components resolved for this sample together with an S-ratio of 0.83. The IRM contribution of the lower coercivity minerals (B1/2 of 30 and 40 mT) is about 80% with the higher coercivity component contributing about 20% only. This aligns with the observed trend of the dominance of lower coercivity minerals in these samples as suggested by their Bc values e.g., magnetite, titanomagnetite (or their oxidized versions).
4.2.2 The Catcher Area Development Sandstone Samples
The CAD sandstone samples are ferromagnetically weaker, but paramagnetically stronger compared to the background sandstones with an Mrs values of between 0.02 and 0.68 mAm2/kg and χ of between 1.4 × 10⁻⁹ and 110.4 × 10⁻⁹ m3/kg. Unlike the background samples, these two parameters reveal a poor correlation with R-squared value of ∼0.2 (Figure 4). This correlation is statistically significant with p-value of <0.05. The samples also displayed a range of high-field susceptibility (χhf) responses (Table 2), and coercivities between 6 and 14 mT. Comparing the CAD sandstones’ magnetic signature to the background signals (Section 4.2.1), these results suggest significant magnetic diagenesis after oil accumulation.
The hysteresis data depicted on the Day diagram (Figure 5), are shifted towards the centre of the PSD region, compared to the background signals, suggesting a relatively higher ratio of PSD lower SP behaviour in the CAD sandstones. Given the increase in χ, but a drop in SP material as indicated by the lower Mrs/Ms ratio and the decrease in Mrs, this implies the increase in susceptibility is due to an increase in paramagnetic minerals, rather than ferromagnetic SP content.
A majority of the FORC diagrams for the CAD samples presented very similar behaviour to the background samples (Figures 7C, I); although there was an increase in the vertical spread along the bu axis in both the positive and negative directions (up to 100 mT) for a small number of samples (Figure 7L) suggesting the presence of significantly more MD particles (Roberts et al., 2000; Muxworthy and Dunlop, 2002; Roberts et al., 2018). Additionally, some of the CAD samples displayed a reduced spread in the bu-axis (max of ±20 mT), and a reduction in peak bc values, generally <50 mT (Figure 7F) indicating the presence of more SD/PSD sized grains; this could be due to a reduction in thermally relaxing SP particles together with the mean grain size as suggested above. Other subtle signatures observed in some samples were: 1) a steeply dipping negative region (Figures 7C, L) indicating multi-axial anisotropy (Valdez-Grijalva and Muxworthy, 2019), and 2) in some samples the presence of contours along the vertical axis extending down to −100 mT (Figure 7F), suggesting the presence of SP nanoparticles (<30 nm) (Pike et al., 2001).
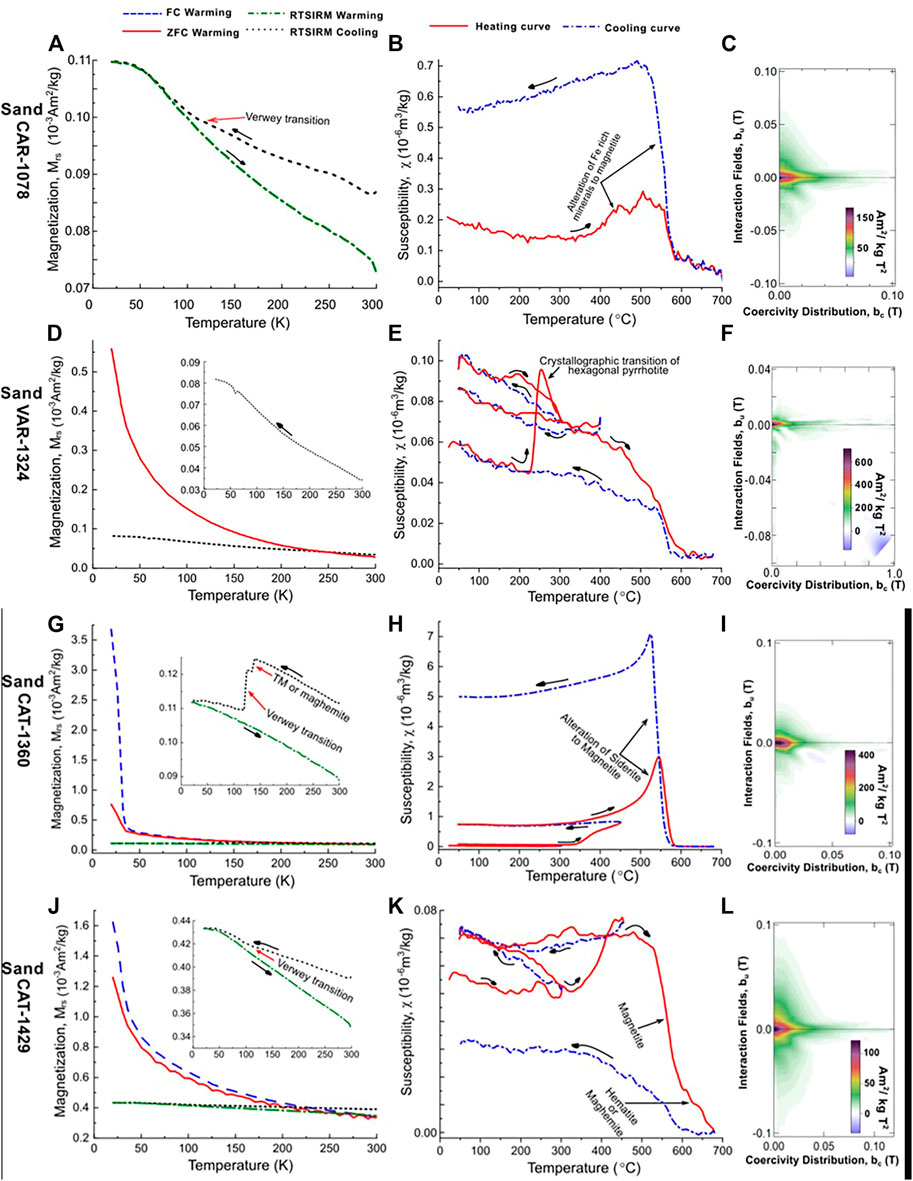
FIGURE 7. Example results from LTM, HT-χ and FORC measurements for the hydrocarbon reservoir sandstones samples; CAR-1078, VAR-1324, CAT-1360 and CAT-1429 are shown on (A–C), (D–F), (G–I) and (J–L), respectively. The oil reservoir sandstones results suggest the presence of magnetite and titanomagnetite (or their oxidized versions), hexagonal pyrrhotite, ilmenite, hematite and potentially titanohematite. Ti-rich iron oxides are labelled as FeTiO.
Similar to the background samples, the IRM acquisition curves presented with S-ratio of between 0.77 and 0.93. However, a greater IRM contribution of the lower coercivity minerals was observed. A representative example is shown in Supplementary Figures S1C,D and Supplementary Table S1. Mean coercivities, B1/2 of 20, 50, and 250 mT and IRM contributions of 30, 65 and 5%, respectively were obtained for the three components resolved for this sample together with an S-ratio of 0.91.
4.2.3 The Catcher Area Development Shale Samples
For the shale samples, Mrs and Bc values ranged between 0.11 and 40.33 mAm2/kg and 8 and 43 mT respectively. The hysteresis data on a Day plot (Figure 5) for these samples present a more varied domain state distribution, with, PSD and MD behaviour observed and more samples (as compared to the sandstones) plotting closer to and in the SD-region of the diagram. These samples also displayed varied FORC distribution behaviour, with some distinctly different behaviour when compared to the CAD sandstones (Figure 9). These FORC diagrams had bc peaks as high as 50 mT. Such FORC diagram behaviour is normally associated with iron sulphides, in particular SD greigite, e.g, S-1438 (Figure 9F), or interacting SP/SD particles of monoclinic pyrrhotite or acicular SD magnetite, e.g., S-1341 and S-1447 (Figures 10C, I) (Muxworthy et al., 2005; Roberts et al., 2018).
4.3 Low-Temperature Magnetometry
To identify magnetic mineralogies through low-temperature transitions, and to quantify the presence of nanometric particles (<30 nm), low-temperature magnetometry was conducted.
4.3.1 The Background Samples
All the background samples displayed very similar low-temperature behaviour (Figure 6). The RT-SIRM generally increased on cooling from 300 to 10 K, although some samples displayed a discontinuity in behaviour between 110 and 140 K (Figures 6A, D, G, J). The increase in magnetisation on cooling could be due to a range of different minerals including titanohematite, SD greigite (Chang et al., 2009; Sprain et al., 2016) or/and any magnetic mineral of SP domain behaviour (due to a small residual field in the MPMS). The discontinuity between 110 and 140 K is indicative of the presence of magnetite (at ∼120 K) (Verwey, 1939), with the temperature varying due to its oxidation product or the presence of impurities and/or stress (Moskowitz et al., 1998; Muxworthy and McClelland, 2000). In about 50% of the background samples, a subtle discontinuity in remanence was observed at about 260 K, e.g., DW-17-1532 (Figure 6G). This is most likely due to the presence of hematite (Morin, 1950). For the FC and ZFC warming curves, a near consistent decrease in SIRM and in the ratio of SIRMFC and SIRMZFC was observed on warming, with both curves exhibiting very similar trends. There is no evidence here, for siderite or other minerals with Curie/Néel temperatures between 10 and 50 K. The relaxation on warming is most likely due to thermal unblocking.
4.3.2 The Catcher Area Development Sandstone Samples
Unlike the background samples, the CAD sandstones samples exhibited very diverse behaviours. In terms of prevalence, two major behaviours; A and B were observed. Group A samples presented very similar behaviour to the background samples, with a general reduction in RT-SIRM on cooling from 300 to 10 K, an observed discontinuity on the RT-SIRM cooling curve between 140 and 110 K, and an FC and ZFC curve that presents very similar trend on warming from 10 to 300 K e.g., CAT-1429 (Figure 7J). In group B samples, a sharp drop in remanence on warming between 10 and 37 K was observed in the FC and ZFC curves. The FC-SIRM was observed to be several folds higher than the ZFC-SIRM at 10 K, with the difference decreasing with increase in temperature to about 37 K where it disappears e.g., CAT-1360 (Figure 7G). This is indicative of siderite’s Néel transition (Jacobs, 1963). These samples had the largest paramagnetic responses. A third group of samples displayed a sharp drop in remanence for both the FC and ZFC curves on warming between 30 and 50 K, e.g., BON 1196 (Figure 8). The FC-SIRM and ZFC-SIRM were the same at these temperatures, and below 30 K, these values deviated with a higher FC-SIRM compared to the ZFC-SIRM. This is likely indicative of the presence of ilmenite (Gehring et al., 2007; Engelmann et al., 2010). Note that this behaviour was observed only in samples from the Bonneville field.
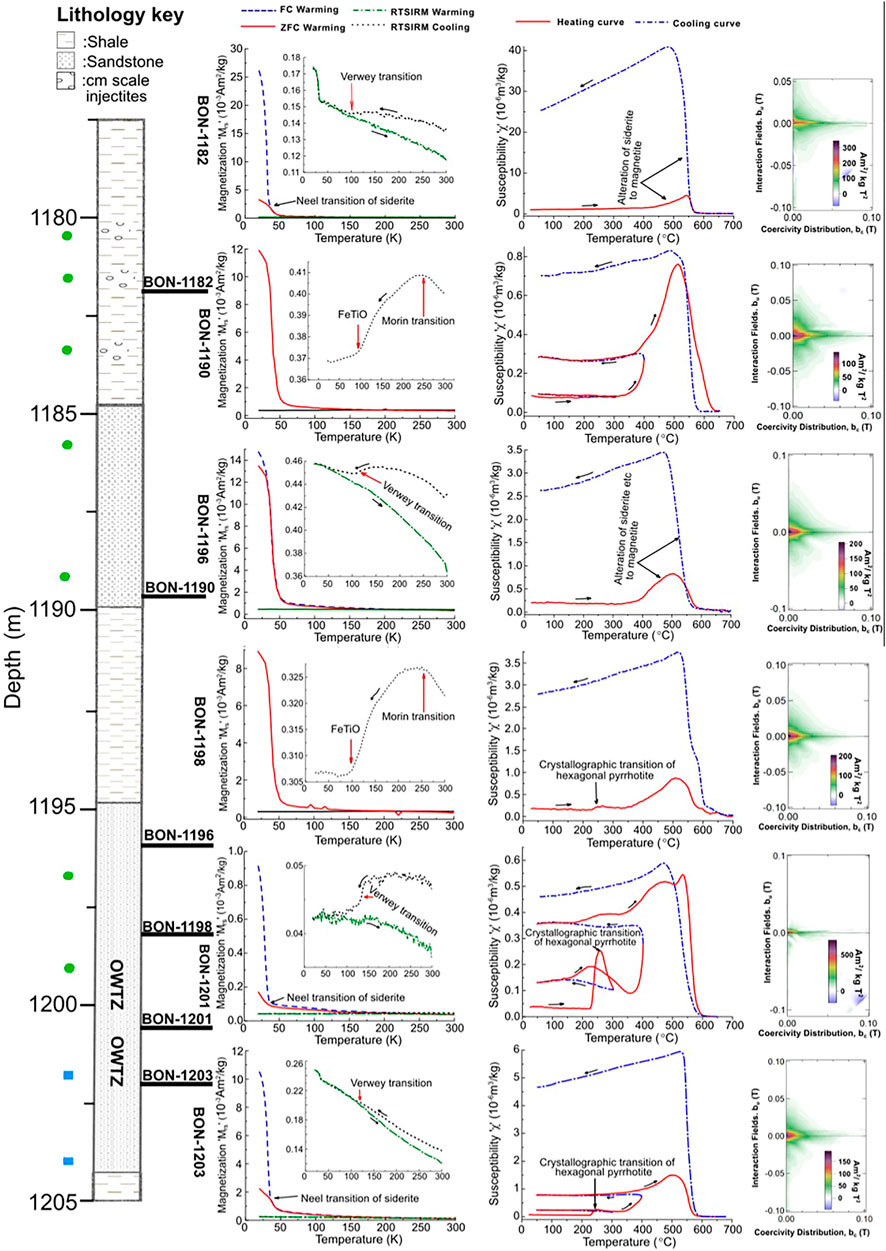
FIGURE 8. LTM, HT-χ and FORC measurements for the hydrocarbon reservoir sandstones samples from the Bonneville field. The magnetic minerology of the reservoir sands is dominated by siderite with hexagonal pyrrhotite present around the OWTZ. Ilmenite is also present in sections of the oil leg (BON-1190, B0N-1196, and BON-1198). Magnetite, titanomagnetite (or their oxidized versions), hematite and potentially other titanohematites are also generally present.
About 90% of all the CAD sandstone samples presented a discontinuity between 110 and 130 K, which is indicative of (titano)magnetite or their oxidized versions. About 80% of the CAD samples, displayed an increase in magnetisation from 300 to 10 K on the RT-SIRM cycling curves similar to the background samples. Also, a subtle discontinuity in remanence was observed at about 260 K in some samples indicative of the Morin transition of haematite (Morin, 1950).
4.3.3 The Catcher Area Development Shale Samples
The shale samples displayed diverse behaviour, very similar to the CAD sandstone. A few samples presented with group B behaviour, a sharp drop in FC and ZFC remanence on warming between 10 and 37 K indicating siderite e.g S-1341 (Figure 9A) (Jacobs, 1963). Another sample displayed a signature yet to be seen in the sandstone samples; a wide and increasing separation between the ZFC and FC curves on cooling (Figure 9D) which may indicate the presence of goethite (Liu et al., 2006b) or greigite (Chang et al., 2009) although the RT-SIRM cycling curves were consistent with SD greigite signature (Chang et al., 2009; Roberts et al., 2011). The sharp drop in FC and ZFC remanence between 10 and ∼30 K is likely due to an additional paramagnetic phase. A few samples also displayed the FC-ZFC-RTSIRM behaviour of the background samples e.g S-1447 (Figure 9G). The shale samples generally exhibited the common RTSIRM signature of the sandstone samples suggestive of the presence of magnetite/titanomagnetite or their oxidized versions.
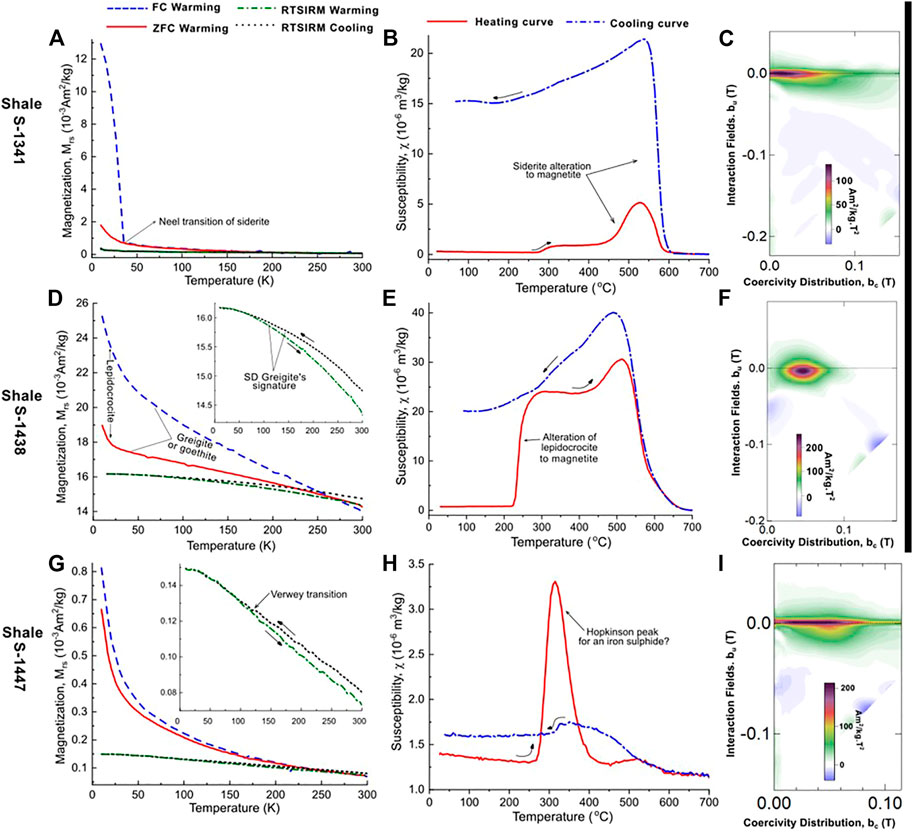
FIGURE 9. Example results from LTM and HT-χ and FORC measurements for the shale samples; S-1341, S-1438 and S-1447 are shown on (A–C), (D–F), and (G–I) respectively. The shale samples measurement curves suggest the presence of magnetite, titanomagnetite (or their oxidized versions), greigite, other paramagnetic iron-sulphides, lepidocrocite and potentially titanohematite and hematite.
4.4 High-Temperature Susceptibility (HT-χ) Measurements
We measured HT-χ on all the samples to help determine their magnetic mineralogy. HT-χ curves can be difficult to interpret, as they magnetic mineral commonly alter during heating, even when under Ar.
4.4.1 The Background Samples
The background samples displayed similar HT-χ curves (Figures 6B, E, H), i.e., χ reduced on heating to ∼300°C, followed by a rapid increase that peaks below the Curie temperature of magnetite; between 550 and 580°C after which it decreases rapidly. All the samples displayed non-reversible alteration resulting in increases in χ between one and fifteen folds on cooling.
4.4.2 The Catcher Area Development Sandstone Samples
For the CAD sandstone samples, the behaviour under temperature treatment was again variable and can be split into two main groups. Group A samples displayed very similar HT-χ behaviour to the background samples, with a decrease in susceptibility from room temperature to ∼300°C, and subsequent alteration resulting in a susceptibility increase, and Curie temperatures of between 560 and 580°C. Group B samples displayed a more rapid increase in χ above 300°C (up to over two orders of magnitude increase in susceptibility), e.g., CAT-1360 (Figure 7H). The dominant Curie temperature for this group was between 550 and 580°C. Within these two groups, several samples presented a rapid increase in susceptibility at about 200°C with a Curie temperature of ∼270°C, e.g., Var-1324 and Bon-1201 (Figures 7E, 8). This is an indicator of the presence of hexagonal pyrrhotite (Rochette et al., 1990). This signature was observed for samples located close to the oil-water contact, i.e, the oil water transition zone (OWTZ) (Figure 8). In some of these samples, Hopkinson like peaks were observed between 300 and 500°C, e.g., BON-1201 (Figure 8). This suggests the presence of other iron sulphides that alters or unblocks on heating.
4.4.3 The Catcher Area Development Shale Samples
The shale samples also displayed variable HT-χ behaviours. Group B behaviour described above was observed in some shale samples, e.g., S-1341 (Figure 9B). Another behaviour observed was a rapid to near-instantaneous and short-range alteration at temperatures between 220 and 280°C with a slight susceptibility drop or kink between 320 and 400°C suggesting the presence of lepidocrocite (Gendler et al., 2005) and iron sulphide(s) (Badejo et al., 2021c) e.g., S-1438 (Figure 9E). A few samples presented a Hopkinson like peak at temperatures between 240 and 400°C without significant increases in subsequent susceptibility, e.g., S-1447 (Figure 9H). We suggest that this is due to the presence of iron sulphide(s) (Kontny et al., 2000). Finally, few samples displayed little change in susceptibility apart from a Hopkinson peak around the Curie temperature of magnetite.
4.5 Mössbauer Results
Mössbauer spectra were measured for a select number of representative samples to help to determine the magnetic mineralogy. Samples from four groups defined by the source location and the magnetic hysteresis behaviour: the background samples (B), sandstone samples with low paramagnetic responses (OLP), sandstone samples with high paramagnetic responses (OHP) and sandstone samples around the oil-water transition zone (OWTZ). These Mössbauer spectra were obtained at room and low temperature (between 5 and 18 K) and analysed by a fitting procedure using Lorentzian curves (Dyar et al., 2006) (Supplementary Table S2). The OLP and the B samples displayed very similar Mössbauer spectra, with two doublets each at both low and room temperature. The isomer shift (IS) obtained for the central doublet (IS = 0.28 and 0.30 mm s−1 for the OLP and B samples respectively) is typical for high spin Fe3+ while that of the other doublet (IS = 1.39 and 1.31 mm s−1 for the OLP and B samples respectively) is characteristic of Fe2+ (Supplementary Table S2) (Muxworthy et al., 2002). This Fe2+ doublet with its large quadrupole splitting (QS) is most likely due to the presence of an iron rich silicate/clay minerals (Stevens et al., 1998; Dyar et al., 2006). The Fe3+ doublet is likely due to a silicate or pyrite. The spectra for the OHP sample displayed two doublets at room temperature, and a magnetic hyperfine split sextet and a doublet at low temperature (10–18 K) (Figure 10; Supplementary Table S2). The central doublet for the OHP sample (both at room and low temperature) was similar to the Fe3+ obtained for the OLP and B samples, while the other room-temperature doublet which ordered at low temperature matched the IS, QS and Bhf values for siderite (Stevens et al., 1998). For the OWTZ sample, a very distinct signature was obtained (Figures 10A, C; Supplementary Table S2). Firstly, siderite was identified, together with another mineral that displayed a doublet at both room temperature and 10 K. This doublet’s room temperature IS value of about 1.30 mm s−1 and a QS value of 3.50–3.60 mm s−1 is very similar to vivianite’s Fe2+ although the QS value is too high for the pure compound (Stevens et al., 1998; Dyar et al., 2006). The low-temperature doublet varied slightly but still some resembled the vivianite Fe3+ doublets.
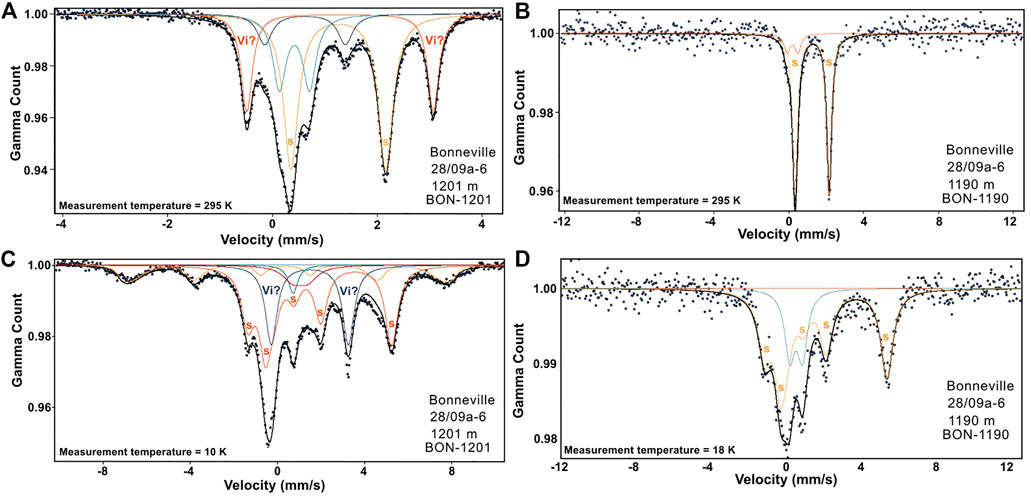
FIGURE 10. Mössbauer spectra measured for oil reservoir samples; BON-1201 (A,C) and BON-1190 (B,D) at room and low (between 10 and 18 K) temperatures respectively. Siderite (s) is present in both samples. Vivianite (Vi) is also likely present at the OWTZ as suggested by BON 1201.
4.6 Scanning Electron Microscopy
SEM analysis was conducted to complement the other measurements, and to help to distinguish between iron-sulphides thought to be present. Magnetic minerals between 50 nm and 10 µm were identified (Figure 11) via energy dispersive X-ray (EDX) analysis. The larger grain sizes appeared to be detrital in origin (Figure 11A) while the morphology of the smaller grains suggest an authigenic origin (Figures 11B,C) (Roberts 2015). Iron-oxide minerals were identified in both the background and CAD samples. Siderite was identified only in the CAD samples (Figure 11D). The observed structure was plate-like and similar to siderite nodules reported in the literature (Antoshkina et al., 2017). It dominated the extract from siderite rich samples due to its high concentration. Iron-sulphide grains (<1 µm) and framboids (between 2 and 8 µm) that have been interpreted via their morphology and elemental analysis to be either pyrite or greigite were found in the CAD sediments (Figures 11E,F). We suggest that these iron-sulphide grains are authigenic in origin and are at least partly related to hydrocarbon presence due to their morphology, and the variation in texture and size (Roberts 2015).
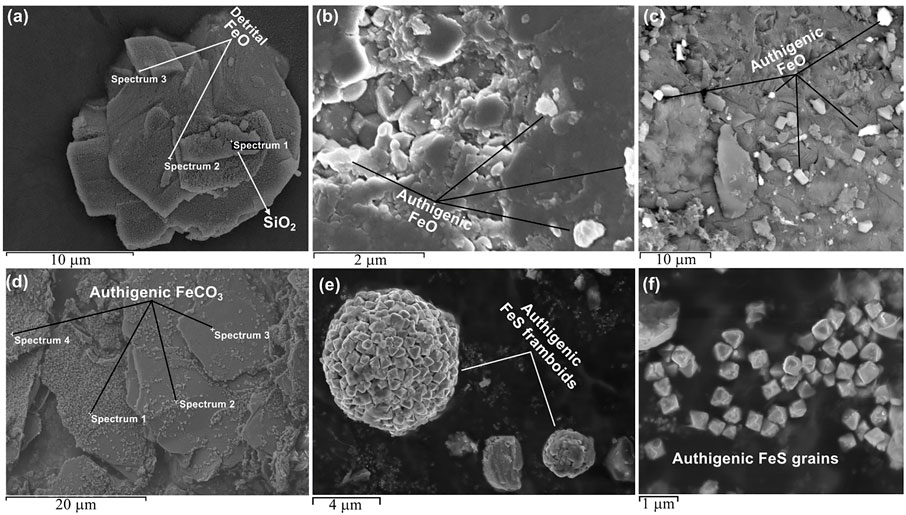
FIGURE 11. Microscopic characterization of magnetic minerals in magnetic extracts from different sample groups including corresponding points of EDX analysis if carried out: (A) an iron-oxide crystal likely detrital identified in a reservoir sandstone sample, (B) Fine grain iron-oxide crystals in a sample from the oil leg, (C) backscattered electron image showing contrast between the iron-oxides minerals and the iron-poor background, (D) through EDX analysis, the platy structures that dominates the extract from an oil leg sample with high paramagnetic responses are confirmed to be siderite cements, (E) Iron sulphide framboids obtained from the CAD sediments, and (F) Authigenic iron sulphide grains from the CAD sediments.
5 Discussion
Through rock magnetic experiments, we determined the magnetic signature of the oil-stained (CAD hydrocarbon reservoirs) and the background Cenozoic sands of the West Central Shelf, UK Central North Sea region. Magnetite, titanomagnetite (or their oxidized versions), titanohematite and hematite of varying grains sizes (SP to MD) have been identified in the background sands (Figure 6). The oil-stained sandstones of the region displayed a more diverse signature, some very similar to the background samples, others presenting with additional minerals such as siderite, hexagonal pyrrhotite, other iron sulphides, ilmenite and potentially vivianite (Figures 7, 8). The concentration of the ferromagnetic (sensu lato (s.l)) minerals was estimated to be between 20 and 400 ppm in the background samples (assuming magnetite is the dominant mineral), and 10–250 ppm in the oil-stained samples. Dissolution of the ferromagnetic minerals (s.l) in the hydrocarbon reservoirs appear to be more significant for the higher coercivity minerals as suggested by the IRM acquisition curves. The concentration of siderite was estimated via XRD analysis to be up to 5%. Shale samples that were in contact with oil filled reservoir sands displayed a similar magnetic signature to the oil-stained sandstone samples. Shale samples that were proximal to but not in direct contact with the reservoir sands generally displayed enhanced remanence values, higher coercivities and a dominance of SD particles. Magnetic minerals identified in these proximal shales include magnetite, siderite, greigite, pyrite and potentially lepidocrocite and other paramagnetic iron sulphides. It is also likely that titanohematite, hematite and titanomagnetite are present albeit contributing minimally ferromagnetically. The magnetic signature of the sediments are similar to those for the Cenozoic sediments from the UK Central Graben (Badejo et al., 2021c), Bridport reservoir sands of the Wessex basin, UK (Abubakar et al., 2020), and sandstones from the Llanos Foreland Basin, Colombia, Athabasca region, Alberta and Plover Lake, Saskatchewan, Canada and Kabungkan and Lawele region, Buton Island, Indonesia (Emmerton et al., 2013).
5.1 Provenance of the Magnetic Minerals
Magnetite, titanomagnetite or/and their oxidized versions have been interpreted as mainly background minerals due to their general presence in the dry well sandstones. The presence of hydrocarbons appears to diminish these minerals’ presence in the reservoir; however, they remain ubiquitous to these sands. Titanohematite and hematite have also been interpreted to be background minerals that underwent significant dissolution due to the presence of hydrocarbon. Burton et al. (1993) have shown through thermodynamic modelling that this is a likely pathway for these minerals.
The magnetic data obtained from this study supports several studies (Reynolds et al., 1990; Hounslow et al., 1995; Costanzo-Alvarez et al., 2000; Costanzo-Alvarez et al., 2006; Emmerton et al., 2013) that report both destruction and precipitation of magnetic minerals due to hydrocarbon accumulation in petroleum reservoirs, with a net reduction of ferromagnetic susceptibility generally observed. Thermodynamic modelling supports the instability of ferromagnetic minerals (s.l) at the depth range of these reservoirs (Burton et al., 1993). Also, microbial activity may cause this reduction. Emmerton et al. (2013) observed a similar reduction in susceptibility of oil impregnated sandstone from four petroleum basins: in Dorset, UK; Saskatchewan, Canada; Llanos, Colombia and Buton Island, Indonesia and suggested that it was due to biodegradation of hydrocarbon by anaerobic bacteria. It is therefore likely that between 1,000 and 1,500 m (40 and 60°C), the reduction in the ferromagnetic signature of the reservoir section is the general consequence of the accumulation and biodegradation of hydrocarbons.
At the oil water transition zone (OWTZ), distinctive magnetic minerals were found and in particular hexagonal pyrrhotite (Figure 8). This finding together with data from literature (Horng, 2018; Badejo, 2019; Badejo et al., 2021b) suggests that hexagonal pyrrhotite’s formation is related to ongoing or recent biodegradation. The OWTZ is usually the zone of active biodegradation due to the presence of free/movable water which supplies essential nutrients for the process (Larter et al., 2003; Head et al., 2014). During this process, anaerobic sulphate reduction may occur supplying sulphide ions (Head et al., 2003) which may then combine with available Fe2+ in the system to produce iron sulphides (Mann et al., 1990) such as hexagonal pyrrhotite. Another parameter that can be inferred is the optimum depth of formation for hexagonal pyrrhotite. For reservoirs at temperature of ∼80°C or greater, it is unlikely that hexagonal pyrrhotite will be found at the OWTZ as that condition is too hot for biodegradation to occur (Head et al., 2003). HT-χ data from Badejo (2019) and Badejo et al. (2021b), Badejo et al. (2021c) supports this. Magnetic measurements of samples from the OWTZ in these studies suggested the absence of hexagonal pyrrhotite at depths of below 1,800 m (geothermal gradient is ∼40°C/km) (Kubala et al., 2003).
There is some evidence for vivianite’s precipitation at the OWTZ (Figures 10A, C). This zone is likely to be suitable for its precipitation as it has been demonstrated to form during sulphate reduction in the presence of excess Fe2+ (Frederichs et al., 2003). Biodegradation utilizes phosphorus if present (Head et al., 2003) and may provide a pathway for the precipitation of vivianite.
Siderite presence in the CAD region has also been related to hydrocarbon migration (Abdulkarim et al., 2022). It has been identified in about 50% of the CAD samples and its presence is not randomly distributed; with siderite appearing to dominate reservoirs that had been filled via vertical migration e.g., Bonneville field (Figure 8). Similar observations have been made in previous studies of the UK Central North Sea (Badejo et al., 2021c; Abdulkarim et al., 2022). It is also present around the oil-water contact albeit in significantly smaller quantities. Although siderite is usually thought to form during shallow sedimentary diagenetic processes (Larrasoaña et al., 2007; Roberts, 2015), its absence from the background samples suggest that this is not the case for sandstones of the West Central Shelf. Here, it is more likely that the reducing environment created by hydrocarbon presence promotes the replacement of hematite and magnetite by siderite in the oil wells (Burton et al., 1993; Machel, 1995). Siderite is also likely to be formed by the reaction of the available Fe2+ and the excess CO2 introduced by the hydrocarbons during migration (Bello et al., 2021; Abdulkarim et al., 2022). It has also been identified in some shale samples, all located less than a metre from the reservoir sands and hence must have been influenced by hydrocarbon presence.
Our observations show that shales that has no direct contact with the reservoir sands and hydrocarbons have the potential for ferromagnetic enhancement when proximal to the hydrocarbon plume (Machel, 1995; Kao et al., 2004), with SD greigite or Ti-rich magnetite dominating the magnetic signature (Figures 9A, D). In contrast, when in direct contact with hydrocarbon, the magnetic signal of the shale is similar to that of the oil-rich sandstone. This observation is in agreement with available thermodynamic models (Machel, 1995), that suggest the preservation and/or precipitation of iron-oxides in sediments that are located around hydrocarbon accumulations, and the instability of these minerals in the reservoir itself. Also, the requirements for greigite’s preservation are high concentrations of reactive iron, “small” amounts of organic carbon present and low levels of sulphides relative to the amounts of reactive iron (Kao et al., 2004; Gaikwad et al., 2021) and these will more likely be met in the “proximal” shales. Lepidocrocite was found to co-exist with greigite (Figure 9E) reiterating what has been found in another study (Minyuk et al., 2013). For magnetite, it is possible that it is unrelated to hydrocarbon presence, as it was also observed in the background sediments. However, formation of magnetite after hydrocarbon accumulation in the region cannot be ruled out. Low concentrations of reactive sulphide are known to be thermodynamically favourable for both magnetite precipitation and preservation at the depth range under consideration (Machel, 1995; Roberts, 2015).
Ilmenite presence in the Bonneville field (Figure 8), and the lack of it in the background sandstones at first glance suggests that it is hydrocarbon related. However, ilmenite is generally interpreted as a detrital mineral when found in sedimentary environments (Force et al., 2001) as it is usually preserved even after pervasive dissolution of its iron-oxides (Nowaczyk, 2011). Due to the lack of literature relating ilmenite’s formation to oil presence, our current assumption is that its presence is detrital in origin. Alternatively, it could be a more recent dissolution product of other detrital titanohematites (Morad, 1988; Mohapatra et al., 2015).
Magnetic mineral diagenesis resulted in a slightly more multi-domain behaviour in some samples of the main oil pay zone, however, a major portion of these sands displayed similar magnetic hysteresis behaviour (∼grain size) as the background sands (Figure 5). For the sandstones close to the oil-water contact, we observed a reduction in grain size to a more SD/PSD signature e.g., VAR-1324 and BON-1201 (Figures 7F, 8). This is similar to the observations made by Badejo et al. (2021b) with the dominance of SD grains at the hydrocarbon contact and progressively larger grains observed away from this region. This shows that pervasive diagenesis of magnetic minerals related to biogenic processes occurring around the OWTZ results in this reduction of the mean grain size. Also, the nanometric SP particles observed in both the background and CAD sandstone (Figure 5) suggests that both hydrocarbon and non-hydrocarbon induced magnetic diagenetic processes are occurring at the depth range under consideration. This supports previous studies that propose nanometric magnetic particle precipitation and preservation in these environments (Abubakar et al., 2015; Roberts, 2015; Badejo et al., 2021b; Badejo et al., 2021c).
In the shale, there appears to be a dominance of SD grains where magnetic enhancement was observed (Figures 9C, F, I). The “unenhanced” sections have a similar grain size distribution as the sandstone. This suggests that hydrocarbon related diagenesis results in the precipitation and preservation of SD grains and that the lack of this contrast in the oil-stained sandstone versus background sandstone may be due to the minimal ferromagnetic contribution of the newly formed minerals.
5.1.1 Effect of Hydrocarbon Fluid Type and Properties
The hydrocarbon fluid type, i.e., gas or oil, appears to have little impact on magnetic mineral diagenesis, with similar diagenetic product and grain size ranges observed in the gas saturated and oil saturated sandstones. It must be noted that only ∼10% of the total samples collected were from gas saturated intervals (Figure 2).
Biodegradation of hydrocarbons is detrimental to its economic value (Head et al., 2003), and its degree is inversely proportional to the API gravity (Table 1) (Forsythe et al., 2017b). Biodegradation, identified via the API, does not appear to have a direct or major impact on the ferromagnetic (s.l.) signature (Table 1). The ferromagnetic minerology and domain state are still very similar throughout the degradation levels encountered in the CAD oils. This contradicts the findings of Emmerton et al. (2013) which suggest that a progressive reduction in magnetic remanence and an increase in grain size is a general consequence of increasing biodegradation levels. However, an increase in paramagnetic signature is observed with increasing biodegradation levels (Table 2). This is due to the precipitation of paramagnetic iron sulphides and/or siderite as a result of an increase in sulphide and bicarbonate ions due to biodegradation related anaerobic sulphate reduction and methanogenesis (Head et al., 2003).
Hexagonal pyrrhotite and siderite have been shown to co-exist at the OWTZ (Figure 8). This reveals that the available Fe2+ is in excess of the available sulphide ion, supporting the exploration data that suggests that the CAD region is a low sulphur environment (<0.05% as defined in well reports) (UK National Data Repository, 2020). Ongoing hydrocarbon biodegradation likely produces limited amount of hydrogen sulphide due to lack of reactants, resulting in the production of carbon dioxide via methanogenesis (Head et al., 2003; Jones et al., 2008). This enables siderite precipitation and preservation with hexagonal pyrrhotite (Larrasoaña et al., 2007). We emphasize that the dominant source of siderite precipitation in the CAD region is unlikely to be biodegradation as there is evidence which supports the formation of siderite inorganically via vertical migration (Badejo et al., 2021a; Badejo et al., 2021c; Abdulkarim et al., 2022). Abdulkarim et al. (2022) has shown that in the CAD the majority of siderite is likely formed via this inorganic process.
5.1.2 Effect of Depth Change
There appears to be an increase in the paramagnetic response with shallower depths in the CAD region marked by an increased quantity of siderite (Figure 12; Table 2). However, it is likely that this is just a local relationship; we do not think that this is universal effect. Studies of similar systems in the Central North Sea (CNS) have identified even higher siderite engendered paramagnetic responses in deeper hydrocarbon reservoirs (Badejo et al., 2021c; Abdulkarim et al., 2022). These studies attributed the increased siderite proportion to vertical migration of hydrocarbon during filling. Carbon dioxide in hydrocarbon becomes more available for chemical reactions with a decrease in pressure and temperature (Smith and Ehrenberg, 1989). This together with the buffering capacity of the aluminosilicates in clastic rocks tending towards maintaining an increase in pH with decreasing depth usually results in the precipitation of carbonates such as siderite. It is therefore likely that the depth relationship with paramagnetic response in the CAD fields may be a result of an increasing magnitude of continuous vertical migration experienced during hydrocarbon filling. Continuous here refers to a lack of intermittency/lag created by accumulation of hydrocarbons in potential traps along permeable migration pathway/fill spill chains.
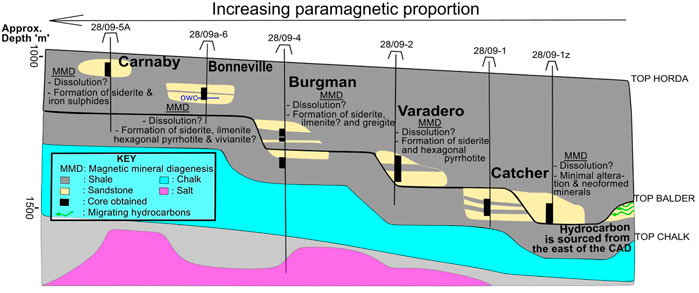
FIGURE 12. A schematic (approximately W-E) cross-section through the CAD fields showing the variation in paramagnetic proportion and the distribution of magnetic minerals. Approximate horizontal extent of section is 30 km. Dissolution of ferromagnetic minerals and formation of paramagnetic minerals is the general consequence of hydrocarbon accumulation. Hydrocarbon migration direction and oil saturation has the dominant influence on the present-day magnetic assemblage.
5.2 Understanding the Petroleum System Through Mineral Magnetism: What the Catcher Area Development Region Tells Us
The magnetic signature of the CAD sandstones reinforces the thermodynamic prediction (Burton et al., 1993; Machel, 1995) of instability of ferromagnetic minerals in hydrocarbon environments with low to medium amounts of dissolved sulphides, and temperatures of <60°C. It also links this instability to hydrocarbon reductant capability that promotes destruction and/or conversion of these ferromagnetic minerals to paramagnetic minerals by anaerobic bacteria during sulphate reduction, oxidation of methane etc. (Machel, 1995; Emmerton et al., 2013; Kars et al., 2018). We predict that the main oil leg of clastic hydrocarbon fields at similar conditions (temperature, hydrocarbon type and sulphur content) will have similar ferromagnetic minerology to the background samples. Common background minerals such as magnetite, titanomagnetite and/or titanohematite (Sprain et al., 2016; Kars et al., 2018) will likely dominate the ferromagnetic (s.l) assemblage. A reduction of remanence in these settings is expected together with the precipitation of additional paramagnetic minerals such as siderite and/or iron sulphides etc. (Gaikwad et al., 2021). Also, the amount of siderite identified in the oil leg sandstones with respect to the background sandstones can provide a pointer to the migration direction (Badejo et al., 2021c; Abdulkarim et al., 2022) and hence a better understanding of the petroleum systems history. We argue that siderite quantities significantly higher than other magnetic minerals in the reservoir sandstones together with its absence from the background sediments suggests a vertical migration component. Varadero, Burgman, Bonneville and Carnaby are good examples of CAD fields that satisfy these conditions (Figure 12).
The OWTZ presents a unique magnetic signature with the identification of hexagonal pyrrhotite along this section (Figure 8). For hydrocarbon reservoirs at <80°C, the OWTZ is usually a zone of significant biodegradation (Head et al., 2003; Larter et al., 2003; Larter et al., 2006; Head et al., 2010) and we have linked biodegradation related processes to the formation of this mineral. This suggests a potential application of mineral magnetism to the determination of the OWTZ. Accurate characterization of the OWTZ is essential for reserve estimation, well design and production planning (Fanchi et al., 2002; Bera and Belhaj, 2016), and has shown promise in application to CO2 enhanced oil recovery and sequestration (Ren and Duncan, 2019).
6 Conclusion
Through detailed rock magnetic experiments of Cenozoic oilfield sandstones and nearby dry-well sandstones (background) from a similar stratigraphic setting in the West Central Shelf region of the UK Central North Sea, we have determined the following:
• Hydrocarbon migration results in significant magnetic mineral diagenesis in hydrocarbon reservoir sandstone: destruction of the background magnetic particles and the formation of new minerals including siderite, hexagonal pyrrhotite, potentially vivianite, magnetite, and other iron sulphides. Siderite and potentially greigite, lepidocrocite and magnetite present in interbedded shales also formed as a result of hydrocarbon presence.
• The background magnetic minerals of this region are largely magnetite and titanomagnetite (or their oxidized versions). Titanohematite and hematite have also been identified as background minerals, both highly unstable in the presence of hydrocarbon. The grain sizes of these minerals range from SD to MD. The concentration of these minerals is highly variant and has been estimated to be between 20 and 400 ppm.
• The concentration of the ferromagnetic minerals (sensu lato) has been estimated to be between 10 and 250 ppm in the CAD sandstones and up to 5,000 ppm in the CAD shales. The distribution of the newly formed minerals appears to be sparse to moderate and sometimes specific to certain environments, e.g., hexagonal pyrrhotite around the oil water transition zone, greigite in the interbedded shales etc. The CAD sandstones generally are of very similar grain sizes to the background sandstones, i.e., a mix of SD to MD grains. However, in regions of significant magnetic mineral diagenesis e.g., the OWTZ and the proximal shales, a more SD like signature was observed.
The observations made in this study provide a means of improving our understanding of petroleum systems at both a regional and more specifically a field scale A relationship between the precipitation of hexagonal pyrrhotite and the OWTZ has been established and can be applied to hydrocarbon reserve estimation and hence production planning. It can also be applied to the determination of the optimum injection point(s) for injected fluids in improved oil recovery processes such as water injection, gas injection etc. The distribution of siderite which has been linked to migration mechanisms (vertical vs lateral) (Badejo et al., 2021c; Abdulkarim et al., 2022) also provides additional calibration data for detailed petroleum system modelling/analysis (Badejo et al., 2021a).
Data Availability Statement
The raw data supporting the conclusion of this article will be made available by the authors, without undue reservation.
Author Contributions
MA, AM and AF contributed to conception and design of the study. MA, MS and AC carried out the required experimentation. MA organized the database. MA wrote the first draft of the manuscript. MA and MS wrote sections of the manuscript. All authors contributed to manuscript revision, read, and approved the submitted version.
Funding
MA acknowledges receipt of a PhD scholarship from the Petroleum Technology Development Fund (PTDF), Nigeria, and Visiting Fellowships to the Institute for Rock Magnetism (I.R.M.), University of Minnesota. The IRM is a US National Multi-user Facility supported through the Instrumentation and Facilities program of the National Science Foundation, Earth Sciences Division, and by funding from the University of Minnesota. The Imperial Open Access Fund is also duly acknowledged. AM acknowledges funding for the SPIN-Lab facility from EPRSC (Grant EP/P030548/1).
Conflict of Interest
The authors declare that the research was conducted in the absence of any commercial or financial relationships that could be construed as a potential conflict of interest.
Publisher’s Note
All claims expressed in this article are solely those of the authors and do not necessarily represent those of their affiliated organizations, or those of the publisher, the editors and the reviewers. Any product that may be evaluated in this article, or claim that may be made by its manufacturer, is not guaranteed or endorsed by the publisher.
Acknowledgments
We also thank the British Geological Survey for the core samples.
Supplementary Material
The Supplementary Material for this article can be found online at: https://www.frontiersin.org/articles/10.3389/feart.2022.818624/full#supplementary-material
References
Abdulkarim, M. A., Muxworthy, A. R., Fraser, A., Neumaier, M., Hu, P., and Cowan, A. (2022). Siderite Occurrence in Petroleum Systems and its Potential as a Hydrocarbon-Migration Proxy: A Case Study of the Catcher Area Development and the Bittern Area, UK North Sea. J. Pet. Sci. Eng. 212, 110248. doi:10.1016/j.petrol.2022.110248
Abubakar, R., Muxworthy, A. R., Fraser, A., Sephton, M. A., Watson, J. S., Heslop, D., et al. (2020). Mapping Hydrocarbon Charge-Points in the Wessex Basin Using Seismic, Geochemistry and mineral Magnetics. Mar. Pet. Geol. 111, 510–528. doi:10.1016/j.marpetgeo.2019.08.042
Abubakar, R., Muxworthy, A. R., Sephton, M. A., Southern, P., Watson, J. S., Fraser, A. J., et al. (2015). Formation of Magnetic Minerals at Hydrocarbon-Generation Conditions. Mar. Pet. Geol. 68, 509–519. doi:10.1016/j.marpetgeo.2015.10.003
Antoshkina, A. I., Ryabinkina, N. N., and Valyaeva, O. V. (2017). Genesis of Siderite Nodules from the Lower Carboniferous Terrigenous Sequence in the Subpolar Urals. Lithol. Miner. Resour. 52, 111–124. doi:10.1134/S0024490217020031
Badejo, S. A., Fraser, A. J., Neumaier, M., Muxworthy, A. R., and Perkins, J. R. (2021a). 3D Petroleum Systems Modelling as an Exploration Tool in Mature Basins: A Study from the Central North Sea UK. Mar. Pet. Geol. 133, 105271. doi:10.1016/j.marpetgeo.2021.105271
Badejo, S. A., Muxworthy, A. R., Fraser, A., Neumaier, M., Perkins, J. R., Stevenson, G. R., et al. (2021c). Using Magnetic Techniques to Calibrate Hydrocarbon Migration in Petroleum Systems Modelling: A Case Study from the Lower Tertiary, UK Central North Sea. Geophys. J. Int. 227, 617–631. doi:10.1093/gji/ggab236
Badejo, S. A., Muxworthy, A. R., Fraser, A., Stevenson, G. R., Zhao, X., and Jackson, M. (2021b). Identification of Magnetic Enhancement at Hydrocarbon-Fluid Contacts. Bulletin 105, 1973–1991. doi:10.1306/07062019207
Badejo, S. A. (2019). Using Magnetic Techniques to Calibrate Lateral Hydrocarbon Migration in basin Modelling: A Case Study from the Lower Tertiary, UK Central North Sea. PhD thesis. London: Imperial College.
Bello, A. M., Jones, S., Gluyas, J., Acikalin, S., and Cartigny, M. (2021). Role Played by clay Content in Controlling Reservoir Quality of Submarine Fan System, Forties Sandstone Member, Central Graben, North Sea. Mar. Pet. Geology. 128, 105058. doi:10.1016/j.marpetgeo.2021.105058
Bera, A., and Belhaj, H. (2016). A Comprehensive Review on Characterization and Modeling of Thick Capillary Transition Zones in Carbonate Reservoirs. J. Unconventional Oil Gas Resour. 16, 76–89. doi:10.1016/j.juogr.2016.10.001
Burton, E. A., Machel, H. G., and Qi, J. (1993). “Thermodynamic Constraints on Anomalous Magnetization in Shallow and Deep Hydrocarbon Seepage Environments,” in SEPM Special Publication (SEPM Society for Sedimentary Geology), 193–207. doi:10.2110/pec.93.4910.2110/pec.93.49.0193
Chang, L., Roberts, A. P., Rowan, C. J., Tang, Y., Pruner, P., Chen, Q., et al. (2009). Low-temperature Magnetic Properties of Greigite (Fe3S4). Geochem. Geophys. Geosyst. 10, a–n. doi:10.1029/2008GC002276
Costanzo-Alvarez, V., Aldana, M., Aristeguieta, O., Marcano, M. C., and Aconcha, E. (2000). Study of Magnetic Contrasts in the Guafita Oil Field (South-western Venezuela). Phys. Chem. Earth, A: Solid Earth Geodesy 25, 437–445. doi:10.1016/S1464-1895(00)00068-5
Costanzo-Alvarez, V., Aldana, M., Díaz, M., Bayona, G., and Ayala, C. (2006). Hydrocarbon-induced Magnetic Contrasts in Some Venezuelan and Colombian Oil wells. Earth Planet. Sp 58, 1401–1410. doi:10.1186/BF03352636
Day, R., Fuller, M., and Schmidt, V. A. (1977). Hysteresis Properties of Titanomagnetites: Grain-Size and Compositional Dependence. Phys. Earth Planet. Interiors 13, 260–267. doi:10.1016/0031-9201(77)90108-X
Dyar, M. D., Agresti, D. G., Schaefer, M. W., Grant, C. A., and Sklute, E. C. (2006). Mössbauer Spectroscopy of Earth and Planetary Materials. Annu. Rev. Earth Planet. Sci. 34, 83–125. doi:10.1146/annurev.earth.34.031405.125049
Elmore, R. D., Engel, M. H., Crawford, L., Nick, K., Imbus, S., and Sofer, Z. (1987). Evidence for a Relationship between Hydrocarbons and Authigenic Magnetite. Nature 325, 428–430. doi:10.1038/325428a0
Emmerton, S., Muxworthy, A. R., Sephton, M. A., Aldana, M., Costanzo-Alvarez, V., Bayona, G., et al. (2013). Correlating Biodegradation to Magnetization in Oil Bearing Sedimentary Rocks. Geochim. Cosmochim. Acta 112, 146–165. doi:10.1016/j.gca.2013.03.008
Engelmann, R., Kontny, A., and Lattard, D. (2010). Low-temperature Magnetism of Synthetic Fe-Ti Oxide Assemblages. J. Geophys. Res. 115, B12107. doi:10.1029/2010JB000865
Fanchi, J. R., Christiansen, R. L., and Heymans, M. J. (2002). Estimating Oil Reserves of fields with Oil/water Transition Zones. SPE Reserv. Eval. Eng. 5, 311–316. doi:10.2118/79210-PA
Force, E. R., Butler, R. F., Reynolds, R. L., and Houston, R. S. (2001). Magnetic Ilmenite-Hematite Detritus in Mesozoic-Tertiary Placer and Sandstone-Hosted Uranium Deposits of the Rocky Mountains. Econ. Geology. 96, 1445–1453. doi:10.2113/gsecongeo.96.6.1445
Forsythe, J. C., De Santo, I., Martin, R., Tyndall, R., Arman, K., Pye, J., et al. (2017a). “Reservoir Implications of a Spill-Fill Sequence of Reservoir Charge Coupled with Viscosity and Asphaltene Gradients from a Combination of Water Washing and Biodegradation,” in SPE Annual Technical Conference and Exhibition (San Antonio, Texas: Society of Petroleum Engineers). doi:10.2118/187044-MS
Forsythe, J. C., Martin, R., De Santo, I., Tyndall, R., Arman, K., Pye, J., et al. (2017b). Integrating Comprehensive Two-Dimensional Gas Chromatography and Downhole Fluid Analysis to Validate a Spill-Fill Sequence of Reservoirs with Variations of Biodegradation, Water Washing and Thermal Maturity. Fuel 191, 538–554. doi:10.1016/j.fuel.2016.11.081
Frederichs, T., von Dobeneck, T., Bleil, U., and Dekkers, M. J. (2003). Towards the Identification of Siderite, Rhodochrosite, and Vivianite in Sediments by Their Low-Temperature Magnetic Properties. Phys. Chem. Earth, Parts A/B/C 28, 669–679. doi:10.1016/S1474-7065(03)00121-9
Gaikwad, V., Badesab, F., Dewangan, P., and Kotha, M. (2021). Diagenesis of Magnetic Minerals in Active/Relict Methane Seep: Constraints from Rock Magnetism and Mineralogical Records from Bay of Bengal. Front. Earth Sci. 9, 1–25. doi:10.3389/feart.2021.638594
Gehring, A. U., Fischer, H., Schill, E., Granwehr, J., and Luster, J. (2007). The Dynamics of Magnetic Ordering in a Natural Hemo-Ilmenite Solid Solution. Geophys. J. Int. 169, 917–925. doi:10.1111/j.1365-246X.2007.03326.x
Gendler, T. S., Shcherbakov, V. P., Dekkers, M. J., Gapeev, A. K., Gribov, S. K., and McClelland, E. (2005). The Lepidocrocite-Maghemite-Haematite Reaction Chain-I. Acquisition of Chemical Remanent Magnetization by Maghemite, its Magnetic Properties and thermal Stability. Geophys. J. Int. 160, 815–832. doi:10.1111/j.1365-246X.2005.02550.x
Gibson, M., Riley, D., Kenyon-Roberts, S., Opata, J., Beck, A., Nguyen, C., et al. (2020). The Catcher, Varadero and Burgman fields, Block 28/9a, UK North Sea. Geol. Soc. Lond. Mem. 52, 399–412. doi:10.1144/m52-2019-24
Head, I. M., Gray, N. D., and Larter, S. R. (2014). Life in the Slow Lane; Biogeochemistry of Biodegraded Petroleum Containing Reservoirs and Implications for Energy Recovery and Carbon Management. Front. Microbiol. 5, 1–23. doi:10.3389/fmicb.2014.00566
Head, I. M., Jones, D. M., and Larter, S. R. (2003). Biological Activity in the Deep Subsurface and the Origin of Heavy Oil. Nature 426, 344–352. doi:10.1038/nature02134
Head, I. M., Larter, S. R., Gray, N. D., Sherry, A., Adams, J. J., Aitken, C. M., et al. (2010). “Handbook of Hydrocarbon and Lipid Microbiology,” in Handbook of Hydrocarbon and Lipid Microbiology. Editor K. N. Timmis (Berlin, Heidelberg: Springer Berlin Heidelberg), 3098–3107. doi:10.1007/978-3-540-77587-4
Horng, C.-S. (2018). Unusual Magnetic Properties of Sedimentary Pyrrhotite in Methane Seepage Sediments: Comparison with Metamorphic Pyrrhotite and Sedimentary Greigite. J. Geophys. Res. Solid Earth 123, 4601–4617. doi:10.1002/2017JB015262
Hounslow, M. W., Maher, B. A., and Thistlewood, L. (1995). Magnetic Mineralogy of Sandstones from the Lunde Formation (Late Triassic), Northern North Sea, UK: Origin of the Palaeomagnetic Signal. Geol. Soc. Lond. Spec. Publ. 98, 119–147. doi:10.1144/GSL.SP.1995.098.01.07
Jacobs, I. S. (1963). Metamagnetism of Siderite (FeCO3). J. Appl. Phys. 34, 1106–1107. doi:10.1063/1.1729389
James, D., Bastow, M., Thompson, S., Scotchman, I., and Oygard, K. (2003). The Millennium Atlas: Petroleum Geology of the Central and Northern North Sea. Editors P. D. Evans, and C. Graham (The Geological Society of London), 487. doi:10.1017/S0016756803218124
Jones, D. M., Head, I. M., Gray, N. D., Adams, J. J., Rowan, A. K., Aitken, C. M., et al. (2008). Crude-Oil Biodegradation via Methanogenesis in Subsurface Petroleum Reservoirs. Nature 451, 176–180. doi:10.1038/nature06484
Kao, S.-J., Horng, C.-S., Roberts, A. P., and Liu, K.-K. (2004). Carbon-Sulfur-Iron Relationships in Sedimentary Rocks from Southwestern Taiwan: Influence of Geochemical Environment on Greigite and Pyrrhotite Formation. Chem. Geol. 203, 153–168. doi:10.1016/j.chemgeo.2003.09.007
Kars, M., Aubourg, C., Labaume, P., Berquó, T., and Cavailhes, T. (2014). Burial Diagenesis of Magnetic Minerals: New Insights from the Grès d’Annot Transect (SE France). Minerals 4, 667–689. doi:10.3390/min4030667
Kars, M., Musgrave, R. J., Hoshino, T., Jonas, A. S., Bauersachs, T., Inagaki, F., et al. (2018). Magnetic Mineral Diagenesis in a High Temperature and Deep Methanic Zone in Izu Rear Arc Marine Sediments, Northwest Pacific Ocean. J. Geophys. Res. Solid Earth 123, 8331–8348. doi:10.1029/2018JB015861
Kontny, A., De Wall, H., Sharp, T. G., and Pósfai, M. (2000). Mineralogy and Magnetic Behavior of Pyrrhotite from a 260°C Section at the KTB Drilling Site, Germany. Am. Mineral. 85, 1416–1427. doi:10.2138/am-2000-1010
Kruiver, P. P., Dekkers, M. J., and Heslop, D. (2001). Quantification of Magnetic Coercivity Components by the Analysis of Acquisition Curves of Isothermal Remanent Magnetisation. Earth Planet. Sci. Lett. 189, 269–276. doi:10.1016/S0012-821X(01)00367-3
Kubala, M., Bastow, M., Thompson, S., Scotchman, I., and Oygard, K. (2003). “Geothermal Regime, Petroleum Generation and Migration,” in The millennium atlas: petroleum geology of the central and northern north sea. Editors D. Evans, C. Graham, A. Armour, and P. Bathurst (London, UK: The Geological Society of London). doi:10.1017/S0016756803218124
Larrasoaña, J. C., Roberts, A. P., Musgrave, R. J., Gràcia, E., Piñero, E., Vega, M., et al. (2007). Diagenetic Formation of Greigite and Pyrrhotite in Gas Hydrate marine Sedimentary Systems. Earth Planet. Sci. Lett. 261, 350–366. doi:10.1016/j.epsl.2007.06.032
Larter, S., Huang, H., Adams, J., Bennett, B., Jokanola, O., Oldenburg, T., et al. (2006). The Controls on the Composition of Biodegraded Oils in the Deep Subsurface: Part II-Geological Controls on Subsurface Biodegradation Fluxes and Constraints on Reservoir-Fluid Property Prediction. Bulletin 90, 921–938. doi:10.1306/01270605130
Larter, S., Wilhelms, A., Head, I., Koopmans, M., Aplin, A., Di Primio, R., et al. (2003). The Controls on the Composition of Biodegraded Oils in the Deep Subsurface-Part 1: Biodegradation Rates in Petroleum Reservoirs. Org. Geochem. 34, 601–613. doi:10.1016/S0146-6380(02)00240-1
Liu, Q., Liu, Q., Chan, L., Yang, T., Xia, X., and Cheng, T. (2006a). Magnetic Enhancement Caused by Hydrocarbon Migration in the Mawangmiao Oil Field, Jianghan Basin, China. J. Pet. Sci. Eng. 53, 25–33. doi:10.1016/j.petrol.2006.01.010
Liu, Q., Yu, Y., Torrent, J., Roberts, A. P., Pan, Y., and Zhu, R. (2006b). Characteristic Low-Temperature Magnetic Properties of Aluminous Goethite [α-(Fe, Al)OOH] Explained. J. Geophys. Res. 111, a–n. doi:10.1029/2006JB004560
Machel, H. G. (1995). Magnetic mineral Assemblages and Magnetic Contrasts in Diagenetic Environments - with Implications for Studies of Palaeomagnetism, Hydrocarbon Migration and Exploration. Geol. Soc. Lond. Spec. Publ. 98, 9–29. doi:10.1144/gsl.sp.1995.098.01.02
Mann, S., Sparks, N. H. C., Frankel, R. B., Bazylinski, D. A., and Jannasch, H. W. (1990). Biomineralization of Ferrimagnetic Greigite (Fe3S4) and Iron Pyrite (FeS2) in a Magnetotactic Bacterium. Nature 343, 258–261. doi:10.1038/343258a0
Minyuk, P. S., Tyukova, E. E., Subbotnikova, T. V., Kazansky, A. Y., and Fedotov, A. P. (2013). Thermal Magnetic Susceptibility Data on Natural Iron Sulfides of Northeastern Russia. Russ. Geol. Geophys. 54, 464–474. doi:10.1016/j.rgg.2013.03.008
Mohapatra, S., Behera, P., and Das, S. K. (2015). Heavy Mineral Potentiality and Alteration Studies for Ilmenite in Astaranga Beach Sands, District Puri, Odisha, India. Gep 03, 31–37. doi:10.4236/gep.2015.31005
Morad, S. (1988). Diagenesis of Titaniferous Minerals in Jurassic Sandstones from the Norwegian Sea. Sediment. Geol. 57, 17–40. doi:10.1016/0037-0738(88)90016-4
Morin, F. J. (1950). Magnetic Susceptibility ofαFe2O3 and αFe2O3 with Added Titanium. Phys. Rev. 78, 819–820. doi:10.1103/PhysRev.78.819.2
Moskowitz, B. M., Jackson, M., and Kissel, C. (1998). Low-temperature Magnetic Behavior of Titanomagnetites. Earth Planet. Sci. Lett. 157, 141–149. doi:10.1016/S0012-821X(98)00033-8
Muxworthy, A. R., and Dunlop, D. J. (2002). First-order Reversal Curve (FORC) Diagrams for Pseudo-Single-Domain Magnetites at High Temperature. Earth Planet. Sci. Lett. 203, 369–382. doi:10.1016/S0012-821X(02)00880-4
Muxworthy, A. R., King, J. G., and Heslop, D. (2005). Assessing the Ability of First-Order Reversal Curve (FORC) Diagrams to Unravel Complex Magnetic Signals. J. Geophys. Res. 110, 1–11. doi:10.1029/2004JB003195
Muxworthy, A. R., and McClelland, E. (2000). Review of the Low-Temperature Magnetic Properties of Magnetite from a Rock Magnetic Perspective. Geophys. J. Int. 140, 101–114. doi:10.1046/j.1365-246x.2000.00999.x
Muxworthy, A. R., Schmidbauer, E., and Petersen, N. (2002). Magnetic Properties and Mössbauer Spectra of Urban Atmospheric Particulate Matter: a Case Study from Munich, Germany. Geophys. J. Int. 150, 558–570. doi:10.1046/j.1365-246X.2002.01725.x
Nowaczyk, N. R. (2011). Dissolution of Titanomagnetite and Sulphidization in Sediments from Lake Kinneret, Israel. Geophys. J. Int. 187, 34–44. doi:10.1111/j.1365-246X.2011.05120.x
Peters, K. E., Walters, C. C., and Moldowan, J. M. (2005). The Biomarker Guide. 2nd Edn. New York: Cambridge University Press.
Pike, C. R., Roberts, A. P., and Verosub, K. L. (2001). First-order Reversal Curve Diagrams and thermal Relaxation Effects in Magnetic Particles. Geophys. J. Int. 145, 721–730. doi:10.1046/j.0956-540X.2001.01419.x
Ren, B., and Duncan, I. (2019). Modeling Oil Saturation Evolution in Residual Oil Zones: Implications for CO2 EOR and Sequestration. J. Pet. Sci. Eng. 177, 528–539. doi:10.1016/j.petrol.2019.02.072
Reynolds, R. L., Fishman, N. S., Wanty, R. B., and Goldhaber, M. B. (1990). Iron Sulfide Minerals at Cement Oil Field, Oklahoma: Implications for Magnetic Detection of Oil fields. Geol. Soc. Am. Bull. 102, 368–380. doi:10.1130/0016-7606(1990)102<0368:ismaco>2.3.co;2
Reynolds, R. L., Goldhaber, M. B., and Tuttle, M. L. (1993). Sulfidization and Magnetization above Hydrocarbon Reservoirs. Appl. Paleomagn. Sediment. Geol. 19, 167–179. doi:10.2110/pec.93.49.0167
Roberts, A. P., Chang, L., Rowan, C. J., Horng, C.-S., and Florindo, F. (2011). Magnetic Properties of Sedimentary Greigite (Fe3S4): An Update. Rev. Geophys. 49. doi:10.1029/2010RG000336
Roberts, A. P. (2015). Magnetic mineral Diagenesis. Earth Sci. Rev. 151, 1–47. doi:10.1016/j.earscirev.2015.09.010
Roberts, A. P., Pike, R., and Verosub, K. L. (2000). First-Order Reversal Curve Diagrams: A New Tool for Characterizing the Magnetic Properties of Natural Samples. J. Geophys. Res. 105, 28461–28475. doi:10.1029/2000jb900326
Roberts, A. P., Zhao, X., Harrison, R. J., Heslop, D., Muxworthy, A. R., Rowan, C. J., et al. (2018). Signatures of Reductive Magnetic Mineral Diagenesis from Unmixing of First‐Order Reversal Curves. J. Geophys. Res. Solid Earth 123, 4500–4522. doi:10.1029/2018JB015706
Rochette, P., Fillion, G., Mattéi, J.-L., and Dekkers, M. J. (1990). Magnetic Transition at 30-34 Kelvin in Pyrrhotite: Insight into a Widespread Occurrence of This mineral in Rocks. Earth Planet. Sci. Lett. 98, 319–328. doi:10.1016/0012-821X(90)90034-U
Smith, J. T., and Ehrenberg, S. N. (1989). Correlation of Carbon Dioxide Abundance with Temperature in Clastic Hydrocarbon Reservoirs: Relationship to Inorganic Chemical Equilibrium. Mar. Pet. Geol. 6, 129–135. doi:10.1016/0264-8172(89)90016-0
Sprain, C. J., Feinberg, J. M., Renne, P. R., and Jackson, M. (2016). Importance of Titanohematite in Detrital Remanent Magnetizations of Strata Spanning the Cretaceous-Paleogene Boundary, Hell Creek Region, Montana Courtney. Geochem. Geophys. Geosyst. 17, 1312–1338. doi:10.1002/2015GC006205.Received10.1002/2015gc006191
Stevens, J. G., Khasanov, A. M., Miller, J. W., Pollak, H., and Li, Z. (1998). Mössbauer Mineral Handbook. 3rd Edn. Asheville: Mossbauer Effect Data Center.
UK National Data Repository (2020). Reservoir Fluid Analysis for Premier Oil UK Limited for the Catcher Fields 28/09. Available at: https://ndr.ogauthority.co.uk.
Valdez-Grijalva, M. A., and Muxworthy, A. R. (2019). First-order Reversal Curve (FORC) Diagrams of Nanomagnets with Cubic Magnetocrystalline Anisotropy: A Numerical Approach. J. Magnet. Magn. Mater. 471, 359–364. doi:10.1016/j.jmmm.2018.09.086
Keywords: magnetic mineral diagenesis, Catcher Area Development, hydrocarbon related, oil-water transition zone, biodegradation, Central North Sea
Citation: Abdulkarim MA, Muxworthy AR, Fraser A, Sims M and Cowan A (2022) Effect of Hydrocarbon Presence and Properties on the Magnetic Signature of the Reservoir Sediments of the Catcher Area Development Region, UK North Sea. Front. Earth Sci. 10:818624. doi: 10.3389/feart.2022.818624
Received: 19 November 2021; Accepted: 10 March 2022;
Published: 08 April 2022.
Edited by:
David Mark Hodgson, University of Leeds, United KingdomReviewed by:
Sanem Acikalin, Newcastle University, United KingdomLuigi Jovane, University of São Paulo, Brazil
Copyright © 2022 Abdulkarim, Muxworthy, Fraser, Sims and Cowan. This is an open-access article distributed under the terms of the Creative Commons Attribution License (CC BY). The use, distribution or reproduction in other forums is permitted, provided the original author(s) and the copyright owner(s) are credited and that the original publication in this journal is cited, in accordance with accepted academic practice. No use, distribution or reproduction is permitted which does not comply with these terms.
*Correspondence: Maryam A. Abdulkarim, bS5hYmR1bGthcmltMThAaW1wZXJpYWwuYWMudWs=
 Maryam A. Abdulkarim
 Adrian R. Muxworthy
 Alastair Fraser1
 Michael Sims
 Alison Cowan