- 1School of Earth and Space Sciences, University of Science and Technology of China, Hefei, China
- 2Shenzhen Key Laboratory of Deep Offshore Oil and Gas Exploration Technology, Southern University of Science and Technology, Shenzhen, China
- 3Southern Marine Science and Engineering Guangdong Laboratory (Guangzhou), Guangzhou, China
- 4Department of Earth and Space Sciences, Southern University of Science and Technology, Shenzhen, China
The northwestern Bohemian Massif and adjacent areas are a tectonically active region associated with complex geodynamic activities, that manifest as Quaternary volcanism, earthquake swarms in the upper and middle crust, degassing of CO2, and crustal fluid migration. The intricate tectonic evolution and activities of this region reflect the complexity of the crustal structure therein. However, the crustal models derived from previous studies in this area offer different, even contradictory information regarding the existence of a mid-crustal low-velocity zone (LVZ). In this study, we apply the frequency-Bessel transform (F-J) method to extract the fundamental-mode and up to five higher-mode Rayleigh wave dispersion curves from ambient seismic noise data recorded in the study area and perform multimodal ambient noise dispersion curves inversion. The addition of higher-mode dispersion curves enhances the vertical resolution of the velocity structure inversion results. Our models support the view that the general S-wave velocity level of the crust is high within the study area. We detect two S-wave LVZs beneath the study area that are distributed mainly in the middle crust rather than the lower crust, and these LVZs are separated by a high-velocity zone. Considering the results of previous studies in the area, we infer that these S-wave LVZs may be the consequence of crustal fluids, plastic deformation and even partial melting of the felsic middle crust at relatively high crustal temperatures. Furthermore, these S-wave LVZs could be responsible for the origin and foci depth distribution of earthquake swarms. S-wave low-velocity anomalies are also observed in the uppermost mantle beneath the study area. These S-wave models based on the joint inversion of multimodal dispersion curves can provide new references for understanding the tectonic activity and geodynamic evolution of the northwestern Bohemian Massif and adjacent areas.
Introduction
The Bohemian Massif, which consists of four geological units, namely, the Saxo-Thuringian (ST), Teplá-Barrandian (TB), Moldanubian and Sudetes zones, is one of the largest stable outcrops of basement rocks in Central Europe (Růžek et al., 2003; Karousová et al., 2012; Plomerová et al., 2012). Tectonically, the Bohemian Massif forms the easternmost rim of the Variscan belt that developed between approximately 480 and 290 Ma during the collision between Laurussia and Gondwana (Matte, 2001; Heuer et al., 2006; Hrubcová et al., 2008; Valentová et al., 2017). The area studied herein is the key tectonic area of the Bohemian Massif, namely, the convergence area of the four geological units mentioned above (as shown in Figure 1), including the northwestern part of the Bohemian Massif and adjacent areas. This region, which is presently tectonically active and exhibits complex geological features (Kolínský and Brokešová, 2007; Mousavi et al., 2017), composes a part of the European Cenozoic Rift System and is characterized by a relic Devonian oceanic suture (Karousová et al., 2012; Plomerová et al., 2007). The ongoing geodynamic activities manifest as Quaternary volcanism, earthquake swarms in the upper and middle crust, degassing of CO2, and crustal fluid migration (Fischer and Horálek., 2003; Horálek and Fischer., 2008; Babuška et al., 2016). The signatures of the intricate regional tectonic evolution and ongoing tectonic activities are recorded in and reflect the complexity of the crustal structure in this area.
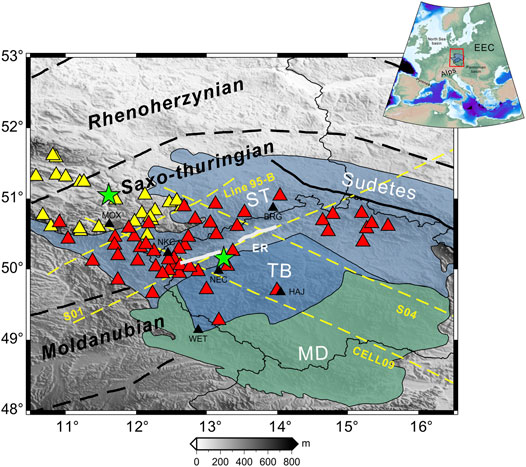
FIGURE 1. Study area and distribution of stations. A simplified overview of the northwestern Bohemian Massif and adjacent areas (modified after Knapmeyer-Endrun et al. (2014) showing the major tectonic units and seismic stations (yellow and red triangles) used in this study. Major tectonic units and zones of the Bohemian Massif: ST, Saxo-Thuringian zone; TB, Teplá-Barrandian zone; MD, Moldanubian zone; ER, Eger Rift. EEC, Eastern European Craton. Black triangles denote the stations MOX, NKC, WET, and BRG used in Wilde-Piórko et al. (2005) and the stations NEC and HAJ used in Kolínský et al. (2011). Yellow and red triangles denote the seismic stations of arrays “TH” and “ZV”, respectively; and green pentagrams denote the center positions of the two arrays. The yellow dashed lines denote profile 95-B of the GRANU95 project, profile CEL09, profile S01 and profile S04.
Previous studies on the crust of the northwestern Bohemian Massif and adjacent areas have relied mainly on seismic sounding experiments, that principally provided P-wave velocity models, such as the NW-SE-trending CEL09 profile (Růžek et al., 2007; Hrubcová et al., 2005; Novotný, 2012) and S04 profile (Růžek et al., 2007; Hrubcová et al., 2010) and the NE-SW-trending S01 profile (Růžek et al., 2007; Grad et al., 2008) and 95-B profile (Enderle et al., 1998). These seismic sounding experiments revealed that the middle crust is generally laterally homogeneous, while the lower crust is laterally inhomogeneous. Along profile 95-B, some regions exhibit high P-wave velocities in the upper and middle crust (depths of ∼5 and ∼16 km, respectively), suggesting the presence of a low-velocity zone (LVZ) in the depth range of ∼5–16 km. The crustal structure is more complicated under the Eger Rift along profile S01; P-wave high-velocity bodies (HVBs) exist mainly in the upper crust (∼2–10 km) and feature deep roots extending into the middle crust (∼18 km).
Moreover, some studies have recently applied passive seismic techniques in this area. By analyzing teleseismic records with the receiver function technique (e.g., the receiver functions at stations MOX, WET, BRG, and NKC shown in Figure 1), Wilde-Piórko et al. (2005) revealed the existence of an S-wave LVZ in the middle crust (depth range of 10–15 km) of the northwestern Bohemian Massif. With the help of Love wave phase velocity dispersion curves, Kolínský et al. (2011) discovered an S-wave LVZ in the middle and lower crust beneath the TB zone and a gradually increasing S-wave velocity structure in the crust of the ST zone. By applying ambient seismic noise interferometric surface wave tomography (ASNT) to the recordings of broadband seismic stations, Růžek et al. (2016) inverted group and phase dispersion curves to obtain crustal velocity models for the Bohemian Massif that monotonically increase with depth; they concluded that the differences among different tectonic units are small and that the most homogeneous part among them generally being the middle crust. Some researchers utilized the ASNT method with data from additional seismic stations in Europe to extract phase velocity dispersion curves (e.g., Kästle et al., 2018) and group velocity dispersion curves (e.g., Lu et al., 2018) for the inversion and derived high-resolution S-wave velocity models that present the almost smoothly increasing velocity structure of the crust in the study area. More recently, Kvapil et al. (2021) reported that the velocity-drop interface (negative velocity gradient) in the lower part of the crust of the Bohemian Massif (depth of 18–30 km); however, the general group velocity level of dispersion curves is lower than the level presented in Lu et al. (2018).
Nevertheless, the crustal models derived from previous studies for the Bohemian Massif present different, even contradictory results regarding the existence of the LVZ in the middle crust (e.g., Enderle et al., 1998; Wilde-Piórko et al., 2005; Grad et al., 2008; Kolínský et al., 2011; Růžek et al., 2016; Kästle et al., 2018; Lu et al., 2018; Kvapil et al., 2021). To address this inconsistency, in this study, we apply our newly developed multimodal ambient noise dispersion curve tomography method, denoted the frequency-Bessel transform (F-J) method (Wang et al., 2019), to investigate the crustal structure beneath the study area by using available ambient seismic noise datasets.
In the following, we describe how to process the ambient noise data used in this study. Then, we briefly summarize the principle of the F-J method and apply it to extract the fundamental-mode and higher-mode Rayleigh wave phase velocity dispersion curves from ambient seismic noise data, after which we carry out the joint inversion of these multimodal dispersion curves to obtain the S-wave velocity model for the crust and uppermost mantle with a higher vertical resolution. Finally, we compare our models with the results of previous studies conducted in our region of interest.
Data and Preprocessing
The continuous ambient seismic noise data analyzed in this study are derived from two independent datasets. The first dataset is from the Bohema digital seismic network (FDSN code: ZV), which is a part of the Bohemian Massif Anisotropy and Heterogeneity (BOHEMA) project (Babuška et al., 2005; Plomerová et al., 2003), from which we select continuous broadband vertical-component seismic noise data (channel code: BHZ/HHZ, sampling rate: 20–100 Hz) from January 2001 to December 2005 recorded by 49 stations. The second dataset is from the Thuringer Seismisches Netz (TSN) network (FDSN code: TH; Jena, 2009), from which we select continuous broadband vertical-component seismic noise data (channel code: HHZ, sampling rate: 100 Hz) from January 2015 to December 2017 recorded by 23 stations. All stations are located mainly in the northwestern Bohemian Massif and adjacent areas and span the area of approximately 6 ° × 3 °, as shown in Figure 1. We take the central longitude and latitude of the area where the seismic array is located as the center of the array (green pentagrams in Figure 1).
The procedures for preprocessing the data are similar to those described in Bensen et al. (2007), including downsampling, tapering, detrending, removing the mean, removing the instrumental response, time-domain normalization and spectral whitening. Finally, we split the whole records from each station into 1-h segments. After processing the data from all stations, we use linear stacking method to compute 1-h stacked noise cross-correlation functions (NCFs) of all station pairs in the two datasets. Supplementary Figure S1 shows the cross-correlation functions of different arrays (period band 1–50 s).
Methodology
F-J Method
We recently proposed the F-J method (Wang et al., 2019), which can effectively extract multimodal dispersion curves from ambient seismic noise data (e.g., Wu et al., 2020; Zhan et al., 2020). Having obtained the stacked NCFs in the preprocessing step, we then extract the multimodal dispersion curves of the areas beneath each dataset by using the F-J method. The main procedures of the F-J method are briefly summarized as follows.
After preprocessing the ambient seismic noise data, we can obtain the frequency spectra
Where
where
Within the interval
with
Substituting Eq. 3 into Eq. 2, and with the following formulas (
We can get the following approximation formula which can be used when scanning to obtain the F-J spectrogram (Wang et al., 2019):
where c and rj denote the phase velocity and the interstation distance of station pair j, respectively.
Identification of Multimodal Dispersion Curves
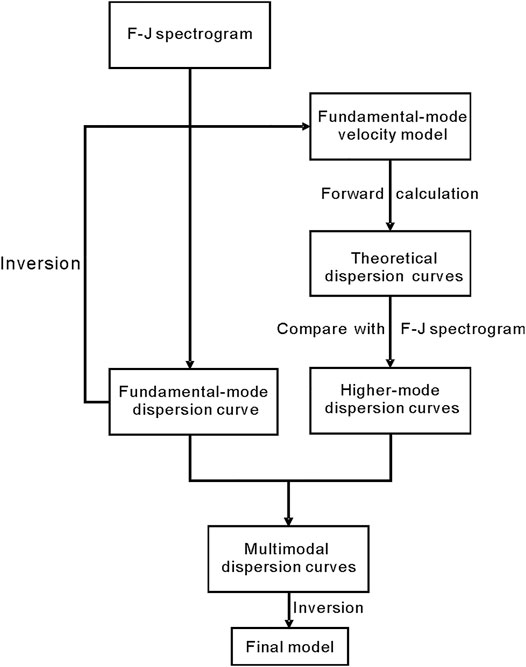
To accurately extract higher-mode dispersion curves, we extract the multimodal dispersion curves in two steps. The workflow is illustrated in Figure 2. First, we extract the fundamental-mode dispersion curve from the F-J spectrogram and invert the dispersion curve to obtain a preliminary S-wave velocity model (hereinafter referred to as the fundamental-mode velocity model). Then, we calculate the theoretical higher-mode dispersion curves of the model using the generalized reflection-transmission coefficient method (Chen, 1993) and project them onto the F-J spectrogram. Finally, taking these theoretical higher-mode dispersion curves as a reference, we identify the highlighted areas on the F-J spectrogram and extract the higher-mode dispersion curves.
Inversion Method
Having obtained the dispersion curves, we carry out the inversion by using the Broyden-Fletcher-Goldfarb-Shanno (BFGS) algorithm (e.g., Byrd et al., 1995). The detailed procedures are described in Pan et al. (2019) and Zhan et al. (2020); a brief summary is given as follows. First, an objective function of multimodal dispersion curves is defined by:
where i and k are the indices for the sampled frequency and dispersion curve mode, respectively;
In the process of iteratively solving the nonlinear inversion problem, the P-wave velocity
Results
Identification of Multimodal Dispersion Curves and Inversion Results
The distribution area of stations in seismic array “TH” is adjacent to the northwestern Bohemian Massif (yellow triangles in Figure 1). We apply the F-J method to this array and the results are shown in Figure 3. Figure 3A clearly shows the fundamental-mode dispersion curve, as well as the possible higher-mode dispersion curves. The fundamental-mode velocity model is obtained by inverting the fundamental-mode dispersion curve. Figure 3B shows the first ten well-fitting inversion results; the red line represents the model with the smallest objective function, namely, the fundamental-mode velocity model, and its fundamental-mode dispersion curve fitting is shown in Figure 3C. According to the fundamental-mode velocity model, we calculate the theoretical higher-mode dispersion curves (yellow solid lines in Figure 3A) and project them onto the F-J spectrogram. With this projection as a reference, we extract the fundamental-mode and five higher-mode dispersion curves (white dotted lines in Figure 3A).
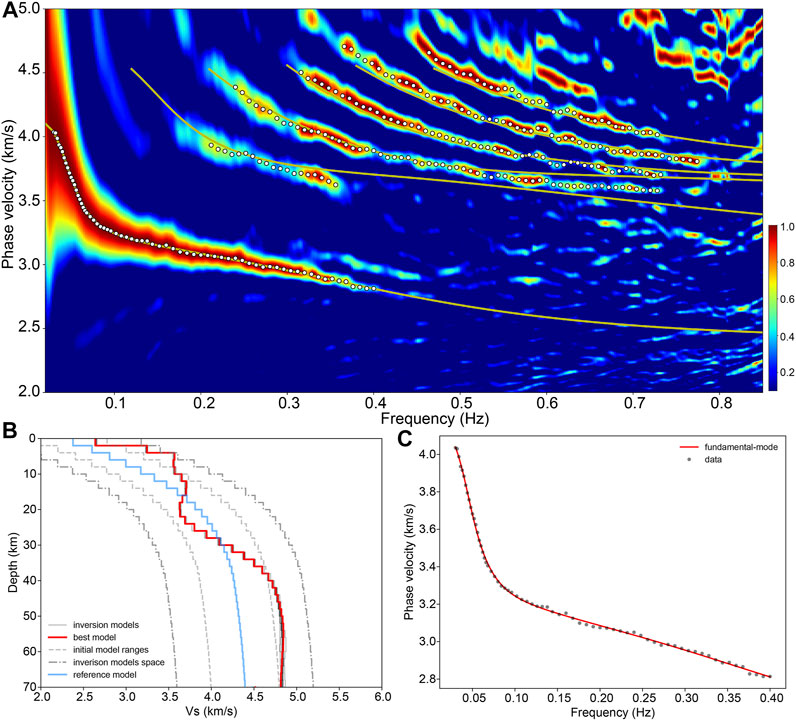
FIGURE 3. Identification of the multimodal dispersion curves for array “TH”. (A) The F-J spectrogram of seismic array “TH”; the yellow solid lines denote the theoretical multimodal dispersion curves corresponding to the fundamental-mode velocity model, and the white dotted lines denote the picked fundamental-mode and higher-mode dispersion curves. (B) The fundamental-mode dispersion curve inversion results; the blue line is the reference velocity model; the red and black lines are the first ten well-fitting models obtained from inverting the fundamental-mode dispersion curve; the red line denotes the best-fitting inversion model with the smallest objective function value; the gray dashed line lines represent the range of the initial models. the gray dash-dotted lines represent the inversion model space. (C) The fitting result of the fundamental-mode velocity model; the black points are the picked fundamental-mode dispersion points, and the red line denotes the theoretical dispersion curve corresponding to the fundamental-mode velocity model.
To invert the multimodal dispersion curves in the area of seismic array “TH”, we use the fundamental-mode velocity model (red line in Figure 3B) as the intermediate value within the range of the fundamental-mode velocity model (±0.4 km/s, gray dashed lines in Figure 4A) to randomly generate 200 initial models for the multimodal dispersion curve inversion. Figure 4A shows the first ten well-fitting inversion results (the standard deviations of the ten models are shown in Supplementary Figure S2), while the red line represents the best-fitting model with the smallest objective function value, that is, the final model of the multimodal dispersion curve inversion. The multimodal dispersion curve fitting result of this model is shown in Figure 4B. The model depicts an S-wave LVZ in the middle crust (depths of 12–22 km), and the low-velocity anomalies in the uppermost mantle (depths of 42–62 km).
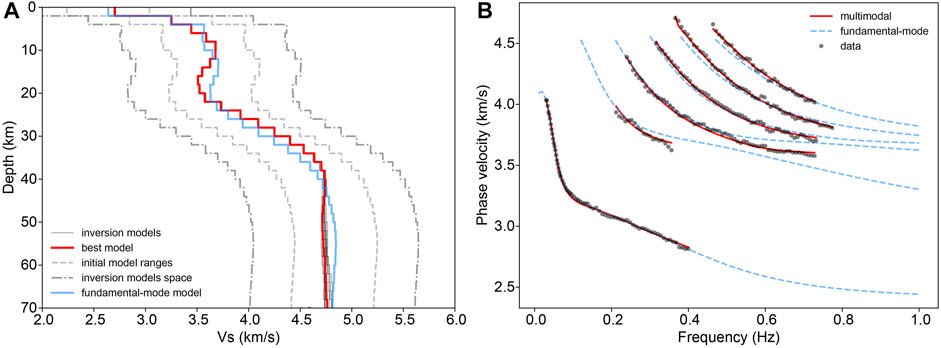
FIGURE 4. Inversion and fitting results of the multimodal dispersion curves of array “TH”. (A) The blue line is the fundamental-mode velocity model, and the red and black lines are the first ten well-fitting models obtained from the inversion of multimodal dispersion curves, where the red line denotes the best-fitting inversion model with the smallest objective function value, namely, the final model of the multimodal dispersion curve inversion. (B) The black points are the picked multimodal dispersion points, the red lines denote the theoretical multimodal dispersion curves of the final model of the multimodal dispersion curve inversion, and the blue dashed lines are the theoretical multimodal dispersion curves of the fundamental-mode velocity model.
The stations of seismic array “ZV” are distributed mainly in the northwestern Bohemian Massif (red triangles in Figure 1). Figure 5A shows the picked points of the multimodal dispersion curves and the theoretical multimodal dispersion curves corresponding to the fundamental-mode velocity model (blue line in Figure 5B). The inversion and fitting results of the multimodal dispersion curves are shown in Figures 5B,C. The final model (red line in Figure 5B) of the multimodal dispersion curve inversion similarly reveals an S-wave LVZ in the middle crust (depths of 8–12 km) and low-velocity anomalies in the uppermost mantle (below 50 km).
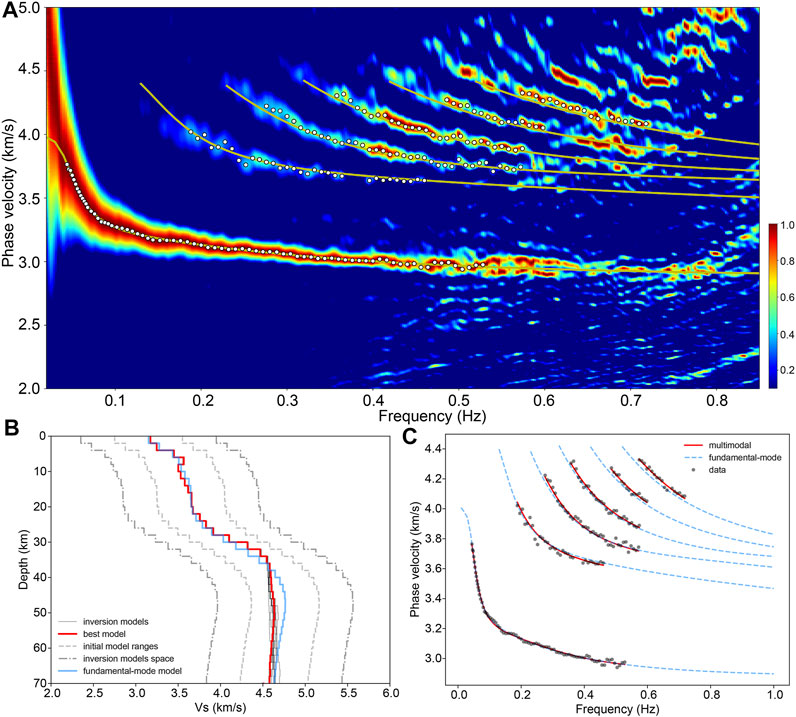
FIGURE 5. Identification of the multimodal dispersion curves of array “ZV” and inversion results and fitting results. (A) The F-J spectrogram of seismic array “ZV”. (B) and (C) The inversion and fitting results of the multimodal dispersion curves.
Sensitivity Kernel Analysis
To illustrate the influence of the higher-mode Rayleigh wave dispersion curves on the velocity structure inversion results, we employ the method of Pan et al. (2019) to calculate both the depth and the frequency distributions of the S-wave sensitivity kernel function of the final inversion model in each of the above two regions (as shown in Figure 6 and Figure 7). The distributions of these sensitivity kernel functions show that the fundamental-mode dispersion curve offers constraint on the entire crust and uppermost mantle in the study area, and the constraint is the strongest at the surface and weakens with depth. Furthermore, the higher-mode dispersion curves strongly constrain both the entire crust and the structure near the crust-mantle boundary (depth of approximately 40 km). We also employ the final models of the two arrays as the true models to test the improvement effect of higher modes on the inversion. The Supplementary Figure S3 and Supplementary Figure S4 clearly show that when only the fundamental mode is used for the inversion, the inversion models are considerably different from the true models; with the addition of higher modes to the inversion, the inversion models are much closer to the true models at depths of 0–40 km, and the inversion accuracy at depths of 40–70 km is also improved. Therefore, the addition of higher-mode dispersion curves to the inversion directly and significantly improves the inversion accuracy in the depth range of 0–40 km and thus improves the inversion accuracy in the whole inversion depth range. Introducing higher-mode dispersion curves on the basis of the fundamental-mode dispersion curve can provide more constraints on inversion, which can help mitigate the non-uniqueness problem.
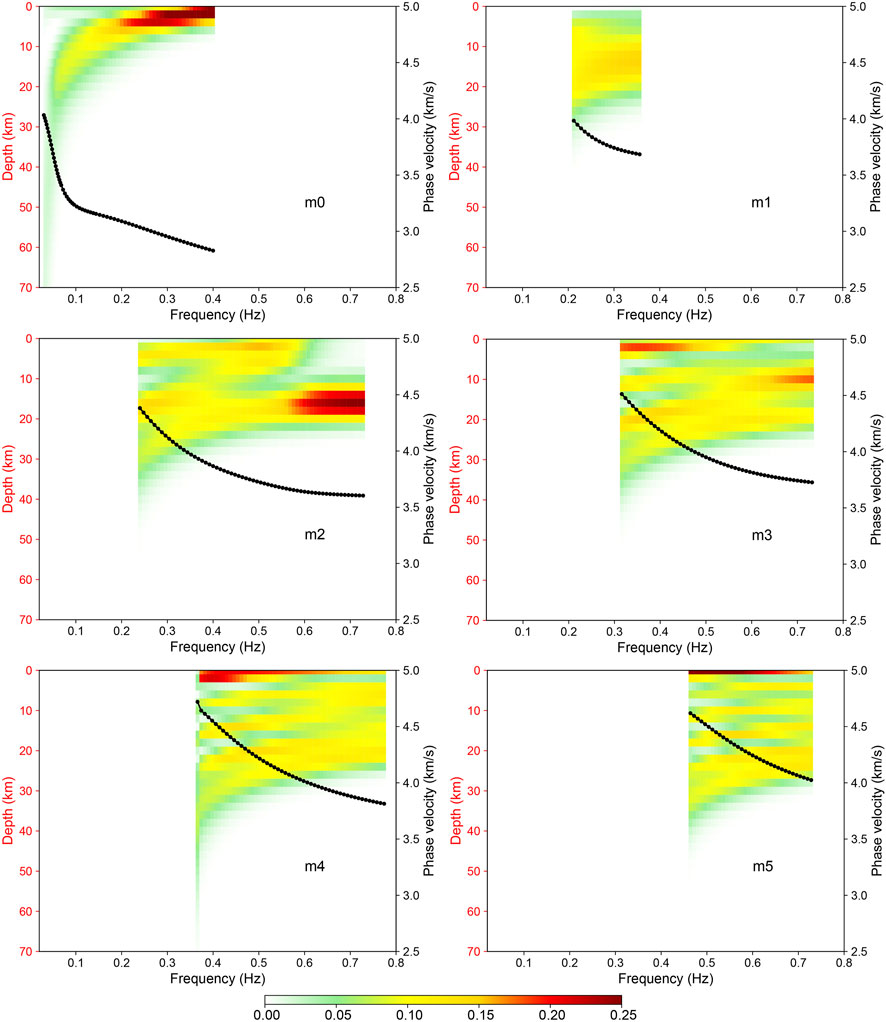
FIGURE 6. Depth and frequency distributions of the sensitivity kernel function of the final model of the multimodal dispersion curve inversion for array “TH”. The black dotted lines are the theoretical dispersion curves corresponding to the final model (truncated according to the frequency range of the picked data points).
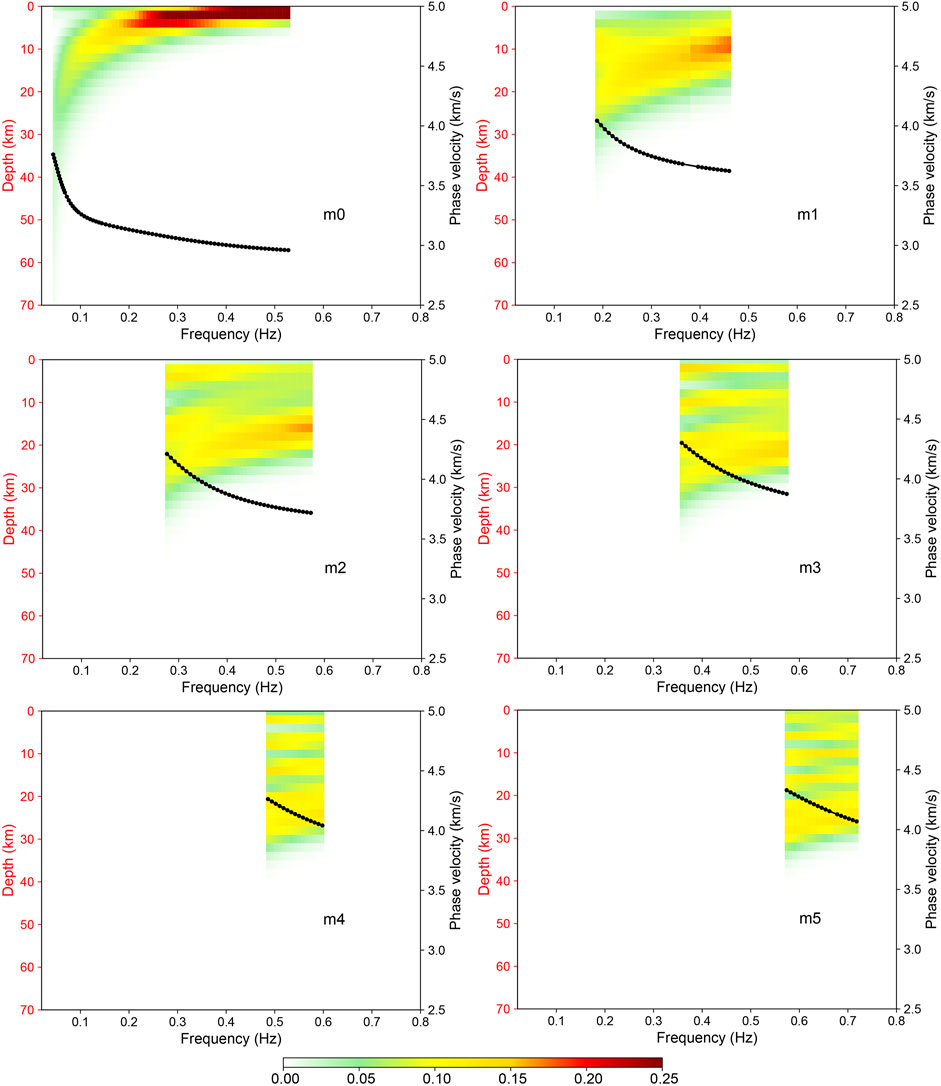
FIGURE 7. Depth and frequency distributions of the sensitivity kernel function of the final model of the multimodal dispersion curve inversion for array “ZV”.
Subregion Division
Obvious S-wave LVZs are detected in the middle crust from the velocity structure inversion results beneath the two seismic arrays. To further study the distributions of the S-wave LVZs, we divide the stations on the west side of the study area into two subarrays, as shown in Figure 8. Although some of the stations of the two subarrays overlap, the geometric centers of the subarrays are different (the green pentagrams in Figure 8) and are approximately 60 km apart.
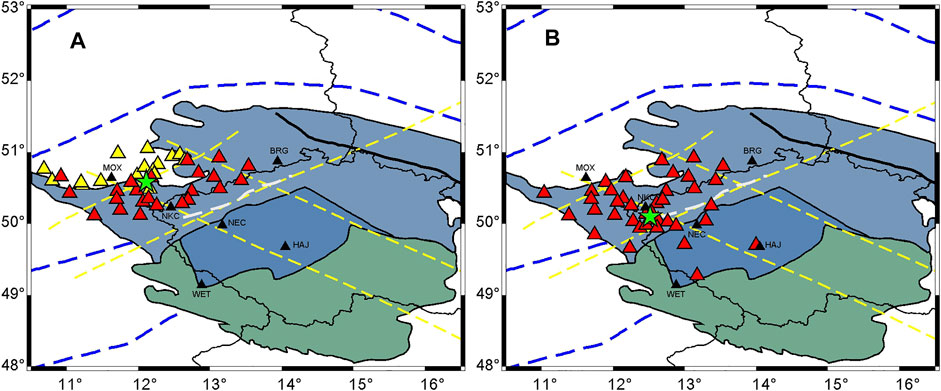
FIGURE 8. (A) Distribution of stations in subarray 1 (yellow and red triangles). (B) Distribution of stations in subarray 2 (red triangles). The two green pentagrams are the centers of the two subarrays; see Figure 1 for explanations of the other symbols.
Figure 9 shows the F-J spectrogram of subarray 1 and the picked points of the dispersion curves, the final inversion model, and the fitting results of the dispersion curves. The inversion result in this area reveals a LVZ at depths of 12–16 km in the middle crust; furthermore, the velocity gradient at depths of 22–26 km is very small, and the velocity in the uppermost mantle (below 42 km) decreases with depth. Likewise, the F-J spectrogram, the picked points of the dispersion curves, and the inversion results for subarray 2 are shown in Figure 10. The final inversion model of this area shows two S-wave LVZs in the crust at depths of 8–12 km and 18–24 km; in addition, low-velocity features appear in the uppermost mantle at depths of 36–44 km and below 50 km.
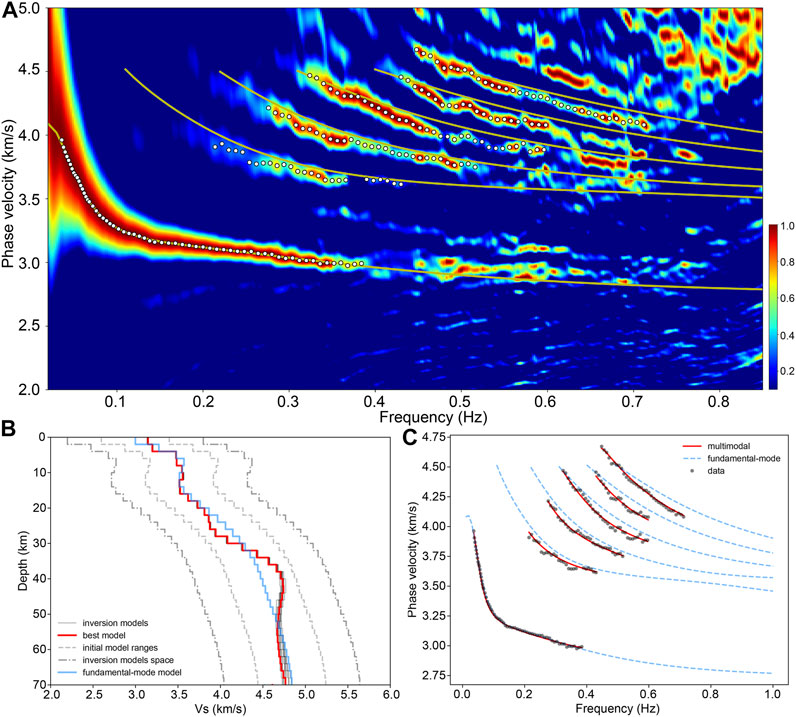
FIGURE 9. Identification of the multimodal dispersion curves of subarray 1 and the inversion and fitting results. (A) The F-J spectrogram of seismic array “subarray 1”. (B) and (C) The inversion and fitting results of the multimodal dispersion curves.
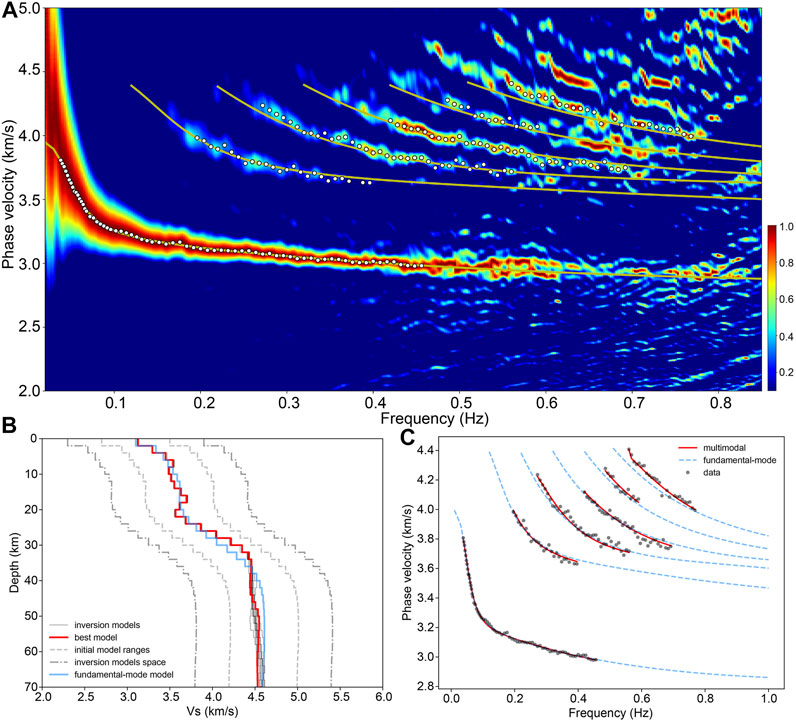
FIGURE 10. Identification of the multimodal dispersion curves of subarray 2 and the inversion and fitting results. (A) The F-J spectrogram of seismic array “subarray 2”. (B) and (C) The inversion and fitting results of the multimodal dispersion curves.
The current sub-division method considers the quality of the F-J spectrogram and the regional structural characteristics as much as possible. If we try to divide into smaller subregions, the quality of the F-J spectrogram will be lower. For example, based on Figure 8, we remove the stations on the northwest edge of the two subarrays; the two new subarrays are shown in Supplementary Figure S5 and the F-J spectrograms of the two new subarrays are shown in Supplementary Figure S6. It is clear that the quality of the F-J spectrograms decreases, especially for the higher modes.
Discussion
The Robustness of the LVZs in the Middle Crust
To verify the robustness of the LVZs in our models, we carry out the random inversions while prohibiting a decrease in velocity with depth. For the joint inversion of multimodal dispersion curves, we obtain 200 inversion models without LVZ for each array. Figure 11 shows the first ten well-fitting models of each array. We calculate the objective function values of the initial models and the inversion models of each array when the velocity decrease is prohibited, and compare them with those when the velocity is allowed to decrease (shown in Figure 12). According to the statistical significance tests and the comparisons shown in Figure 12, the objective function values of the initial models in two cases have little difference (p-value >0.05); furthermore, compared to the initial models, the inversion models in each case are significantly improved (p-value< 0.01), and the inversion models obtained by allowing the velocity to decrease are obviously better than those when the velocity is prohibited from decreasing with depth (p-value <0.01); that is, the models in which the velocity is allowed to decrease are more reasonable. These outcomes confirm that the LVZs in the inversion results are robust. In addition, based on 3D gravity modeling, geological data, seismic refraction (CEL09) and reflection (9HR), Guy et al. (2011) suggested the lower-density middle crust of the ST zone (∼10–25 km).
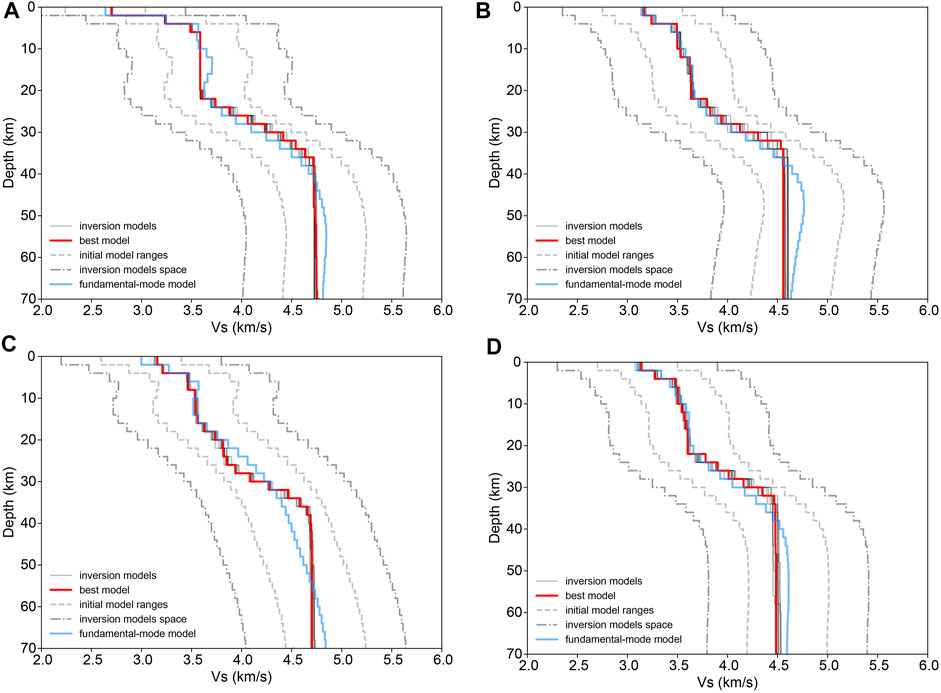
FIGURE 11. Inversion results (the velocity is prohibited from decreasing with depth) of the multimodal dispersion curves. (A) TH array; (B) ZV array; (C) subarray 1; (D) subarray 2.
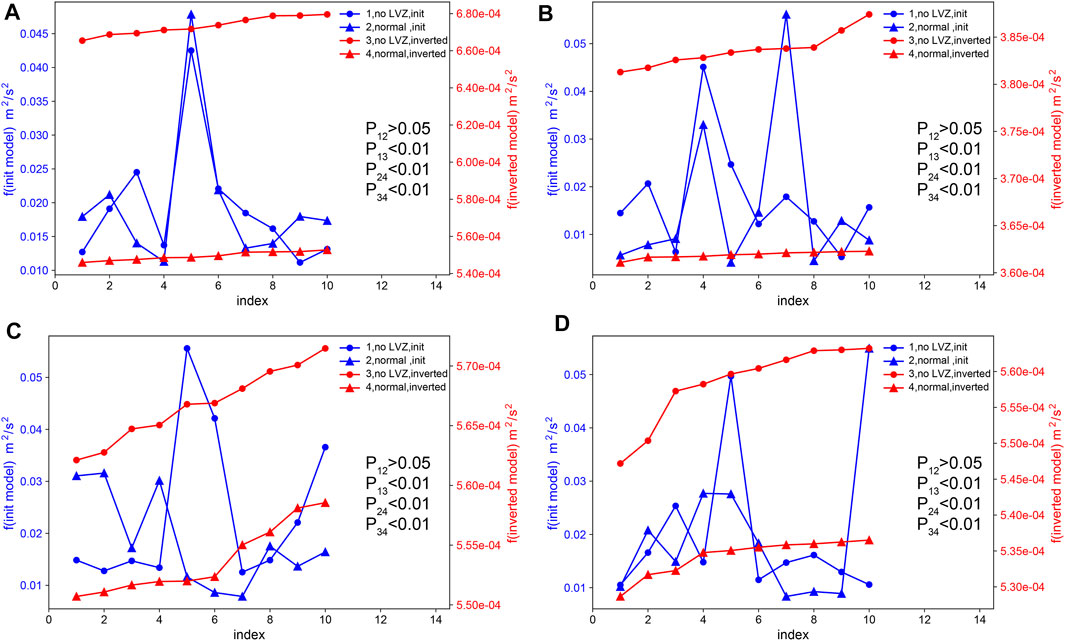
FIGURE 12. Objective function values of the models and the results of the statistical significance test. The blue and red lines denote the objective function values of the initial models and inversion models, respectively. The triangles and circles denote the inversion that allows the velocity to decrease and the inversion that prohibits the velocity from decreasing, respectively. (A) TH array; (B) ZV array; (C) subarray 1; (D) subarray 2
Crustal S-Wave Velocity Models in the Northwestern Bohemian Massif
Recently, some researchers have used the traditional ASNT method to extract phase velocity dispersion curves (e.g., Růžek et al., 2016; Kästle et al., 2018) and group velocity dispersion curves (e.g., Růžek et al., 2016; Lu et al., 2018; Kvapil et al., 2021) to study the velocity structure in the study region and obtained S-wave velocity models. Based on the velocity models of the previous studies, we obtain average 1D S-wave velocity models (Figures 13A,B; Supplementary Figure S7A, Supplementary Figure S7B) beneath the stations of the four arrays (we select the velocity models of the grid points nearest to the stations to calculate the averaged 1D models). Furthermore, the average 1D velocity model under the area of arrays “ZV” and subarray 2 (yellow line in Figure 13B and Supplementary Figure S7B) is obtained according to the 1D models of Růžek et al. (2016) in the ST and TB units. In comparison, the S-wave velocities in our models are higher than those in the other models at depths of ∼30–40 km. In addition, the S-wave velocities in the models from Kvapil et al. (2021) are obviously lower than those in other models (shown in Figure 13, Supplementary Figure S7 and Supplementary Figure S8), even the models of Lu et al. (2018), who also used group velocity dispersion curves for inversion. The general group velocity level of the dispersion curves in Kvapil et al. (2021) is lower than the level presented in Lu et al. (2018), which may be the main reason for the models’ discrepancy.
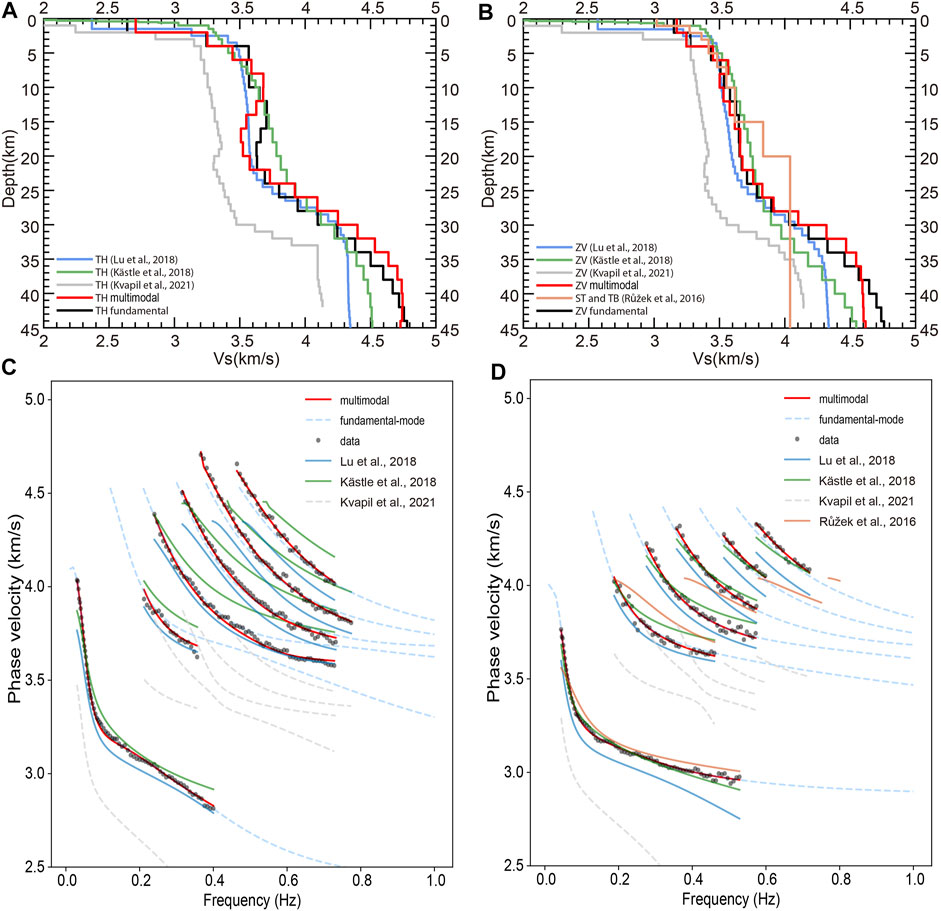
FIGURE 13. Velocity models of previous studies and their fitting results with the picked data in the study area. (A) S-wave velocity models for array “TH”. Different colors denote the different average 1D S-wave velocity models beneath the stations of array “TH” (Kästle et al., 2018; Lu et al., 2018; Kvapil et al., 2021), and the red solid line denotes our model obtained from the inversion of multimodal dispersion curves. The black solid line denotes the model obtained from the inversion using only fundamental mode. (B) S-wave velocity models for array “ZV”. The yellow line is the average of the 1D models below the ST and TB units in the study area from Růžek et al. (2016). (C) The theoretical dispersion curves of the different 1D velocity models for array “TH”. The different colors denote the theoretical dispersion curves of the different average 1D S-wave velocity models in (A); for additional explanations, see Figure 4B. (D) The theoretical dispersion curves of different 1D velocity models for array “ZV”. The different colors denote the theoretical dispersion curves of the different average 1D S-wave velocity models in (B); for other explanations, see Figure 5C.
For a comparison with the picked data, we calculate the theoretical dispersion curves of these 1D velocity models (Figures 13C,D; Supplementary Figure S7C, Supplementary Figure S7D), the results of which clearly demonstrate an unsatisfactory match between the theoretical dispersion curves of these models and the F-J spectrograms (especially at the higher modes). Specifically, the theoretical dispersion curves corresponding to the 1D models under the four arrays extracted from the models of Lu et al. (2018) and Kvapil et al. (2021) are overall lower than picked data; the two 1D models using the phase velocity dispersion curves for the inversion (Kästle et al., 2018; Růžek et al., 2016), especially the models from Kästle et al. (2018) present better fitting results for fundamental mode, but large deviations at the higher modes are still observed for the two models. Our models obtained via the joint inversion of the multimodal dispersion curves match well with the fundamental mode and higher modes for the four arrays. Therefore, introducing higher-mode dispersion curves on the basis of the fundamental-mode dispersion curve is crucial to constrain the structure of the crust in the study area.
S-Wave LVZs in the Middle Crust of Northwestern Bohemian Massif
The models obtained via the joint inversion of multimodal dispersion curves based on the F-J method reveal obvious low-velocity characteristics in the crust and uppermost mantle beneath the study area. Other studies similarly provided evidence for the existence of an LVZ in this region (e.g., Wilde-Piórko et al., 2005; Kolínský et al., 2011; Kvapil et al., 2021). Based on our inversion results, we construct a simple S-wave velocity profile of the crust and uppermost mantle beneath the western side of the study area (Figure 14B). The surface line corresponding to this profile in the study area trends NW-SE (the direction of the black arrow in Figure 14A) and mainly covers two geological tectonic units: ST and TB. Along the profile, there are two obvious LVZs (depth range of 8–24 km) in the middle crust separated by the high-velocity zone (HVZ, depth range of 12–18 km), which is different from the crustal S-wave velocity models of previous investigations (e.g., Wilde-Piórko et al., 2005; Růžek et al., 2016; Kästle et al., 2018; Lu et al., 2018; Kvapil et al., 2021). In the middle crust, the uppermost LVZ is thick in the west and thin in the east, and the velocity contrast of the LVZ is strong in the west and weak in the east; the thickness of the lowermost LVZ is relatively uniform, and the velocity contrast of the LVZ is weak in the west and strong in the east. The negligible HVZ between the upper and lower LVZs in the middle crust may be caused by the high-velocity crust beneath the Eger Rift.
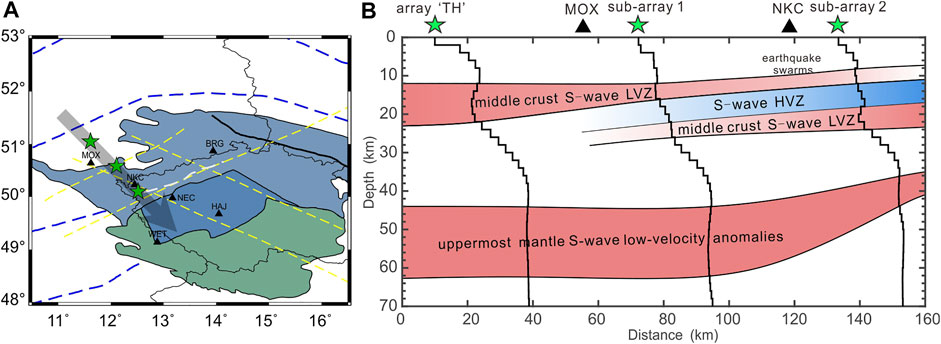
FIGURE 14. Location of the profile and low-velocity distribution (A) The three green pentagrams are the center positions of array “TH”, subarray 1, and subarray 2. (B) A simple schematic diagram depicting the distribution of the S-wave LVZs in the middle crust and the S-wave low-velocity anomalies in the uppermost mantle along the profile. The earthquake swarms beneath the station NKC occur at depths of 6–11 km.
In addition to this mid-crustal S-wave LVZs, S-wave low-velocity anomalies are also discovered in the uppermost mantle beneath the study area. The thickness of uppermost-mantle low-velocity anomalies is about ∼8–20 km. These S-wave low-velocity anomalies may be related to the partial melting in the mantle near the Eger Rift or the upwelling of materials from the lithosphere-asthenosphere transition zone (e.g., Plomerová et al., 2007; Grad et al., 2008).
Causes of the Mid-crustal S-Wave LVZs in the Study Area
The mid-crustal S-wave LVZs in the study area and the low-velocity anomalies in the uppermost mantle are not directly connected; instead, they are separated by the high-velocity lower crust. Due to the influences of temperature and pressure, the middle crust may be relatively plastic or even partially molten. The surface heat flow is an important parameter for understanding geothermal activity, which is related to regional and global tectonic activities. The average heat flow in the Bohemian Massif is 67.9 mW/m2; low heat flow values are observed in the southern and central parts, while high heat flow values are measured in the northwestern Bohemian Massif (Čermák, 1976). Previous studies have shown that the middle crust below the study area is predominantly felsic. For example, Förster and Förster (2000) calculated the heat budget based on the surface heat flow and radiogenic heat production of the ST unit, and inferred that the middle crust is relatively felsic and the lower crust may be relatively mafic and less felsic. Based on 3D gravity modeling, geological data, and seismic refraction (CEL09) and reflection (9HR), Guy et al. (2011) suggested that the lower-density middle crust of the ST zone (∼10–25 km) is felsic; similarly, they indicated that the lower-density crust underneath the TB area is also felsic. A higher surface heat flow value usually corresponds to a higher crustal temperature. Hence, the felsic middle crust beneath the northwestern Bohemian Massif could have undergone plastic deformation and even partial melting at relatively higher crustal temperatures, thereby forming the S-wave LVZs in the middle crust.
Moreover, the gases and fluids originating from activities involving the upper mantle and the lower crust caused a series of geodynamic activities in the crust of the study area. Microearthquake activities, including single events and earthquake swarms, frequently occur in western Bohemia/Vogtland, with the depths of the microearthquake hypocenters varying between 3 and 23 km (Horálek et al., 2000). The Novy Kostel focal zone (near seismic station NKC shown in Figures 14A,B) is dominant throughout the whole region of the West Bohemia/Vogtland earthquake swarms. The foci of the microearthquakes in the Novy Kostel focal zone occur at depths of 6–11 km (Fischer and Horálek, 2000). These focal depths may be related to the uppermost mid-crustal S-wave LVZ beneath the study area. The crustal fluids in the Western Bohemia/Vogtland play a key role in bringing the faults from the subcritical to the critical state, which triggers the earthquake swarms in this region (Horálek and Fischer, 2008). Fluids in the crust can lower the S-wave velocity, which may be one explanation for these mid-crustal S-wave LVZs. Špičák et al. (1999) suggested that the earthquake swarms in the western Bohemian Massif may be caused by the magma intrusions and related fluid and gas release at depths of ∼10 km. The plasticity and presence of partial melting in the fluid-rich mid-crust resulting in the S-wave LVZs, which could be responsible for the origin and foci depth distribution of earthquake swarms in the study area.
Conclusion
In the northwestern Bohemian Massif and adjacent areas, the F-J method was employed to extract up to five higher-mode dispersion curves in addition to the fundamental-mode dispersion curve. The joint inversion of these fundamental-mode and higher-mode dispersion curves improved the vertical resolution of the velocity structure inversion results, allowing us to obtain high-resolution S-wave velocity models of the crust and uppermost mantle beneath the study area. Based on our models, we report the following novel insights:
1. Introducing higher-mode dispersion curves on the basis of the fundamental-mode dispersion curve is crucial to constrain the structure of the entire crust in the study area;
2. The general S-wave velocity level of the crust in the study area is higher than that in the models from Kvapil et al. (2021), which supports the views of previous studies (Růžek et al., 2016; Kästle et al., 2018; Lu et al., 2018);
3. The S-wave velocity of the crust in the study area is relatively high at depths of ∼30–40 km;
4. The S-wave LVZs are distributed mainly in the middle crust of the study area (∼10–20 km) rather than the lower crust (e.g., Kvapil et al., 2021);
5. On the western side of the study area, there are two obvious LVZs in the middle crust which are separated by the HVZ, which is different from the crustal S-wave velocity models of previous studies (e.g., Wilde-Piórko et al., 2005; Růžek et al., 2016; Kästle et al., 2018; Lu et al., 2018; Kvapil et al., 2021).
The mid-crustal S-wave LVZs in the northwestern Bohemian Massif and its adjacent areas may be the consequence of crustal fluids, plastic deformation and even partial melting of the felsic middle crust at relatively high crustal temperatures. Furthermore, these S-wave LVZs could be responsible for the origin and foci depth distribution of earthquake swarms in the study area. In addition, we observed S-wave low-velocity anomalies in the uppermost mantle, especially near the Eger Rift, which may be related to partial melting in the mantle or the upwelling of materials from the lithosphere-asthenosphere transition zone. These S-wave models based on the joint inversion of multimodal dispersion curves can provide new references for understanding the tectonic activity and geodynamic evolution of the northwestern Bohemian Massif and adjacent areas. Moreover, considering the recent discovery of a widespread mid-crustal low-velocity layer beneath Northeast China (Zhan et al., 2020), the existence of a mid-crustal LVZ may be a common feature in tectonically active areas. Considerable in-depth research is needed to confirm this speculation.
Data Availability Statement
The datasets analyzed for this study can be found in the GEOFON Data Center (http://geofon.gfzpotsdam.de/fdsnws/dataselect/1/) and BGR Data Center (http://eida.bgr.de/fdsnws/dataselect/1/).
Author Contributions
The specific contributions of each author are as follows. QM: Conceptualization, Software, Writing–Original Draft, Validation, Data Curation, Investigation, Visualization; LP: Methodology, Software, Validation, Investigation, Visualization; J-nW: Methodology, Software; ZY: Software, Visualization; XC: Conceptualization, Methodology, Writing–Review; Editing, Resources, Supervision, Project administration. All authors read and approved the final manuscript.
Funding
This work was supported by National Natural Science Foundation of China (Grant Nos U1901602, 41790465), Key Special Project for Introduced Talents Team of Southern Marine Science and Engineering Guangdong Laboratory (Guangzhou) (GML2019ZD0203), Shenzhen Key Laboratory of Deep Offshore Oil and Gas Exploration Technology (Grant No. ZDSYS20190902093007855), Shenzhen Science and Technology Program (Grant No. KQTD20170810111725321), the leading talents of Guangdong province program (Grant No. 2016LJ06N652).
Conflict of Interest
The authors declare that the research was conducted in the absence of any commercial or financial relationships that could be construed as a potential conflict of interest.
Publisher’s Note
All claims expressed in this article are solely those of the authors and do not necessarily represent those of their affiliated organizations, or those of the publisher, the editors, and the reviewers. Any product that may be evaluated in this article, or claim that may be made by its manufacturer, is not guaranteed or endorsed by the publisher.
Supplementary Material
The Supplementary Material for this article can be found online at: https://www.frontiersin.org/articles/10.3389/feart.2022.838751/full#supplementary-material
References
Babuska, V., Plomerova, J., Vecsey, L., Jedlicka, P., and Ruzek, B. (2005). Non-Reviewed Contribution: Ongoing Passive Seismic Experiments Unravel Deep Lithosphere Structure of the Bohemian Massif. Stud. Geophys. Geod. 49, 423–430. doi:10.1007/s11200-005-0018-0
Babuška, V., Růžek, B., and Dolejš, D. (2016). Origin of Earthquake Swarms in the Western Bohemian Massif: Is the Mantle CO2 Degassing, Followed by the Cheb Basin Subsidence, an Essential Driving Force? Tectonophysics 668-669, 42–51. doi:10.1016/j.tecto.2015.12.008
Bensen, G. D., Ritzwoller, M. H., Barmin, M. P., Levshin, A. L., Lin, F., Moschetti, M. P., et al. (2007). Processing Seismic Ambient Noise Data to Obtain Reliable Broad-Band Surface Wave Dispersion Measurements. Geophys. J. Int. 169, 1239–1260. doi:10.1111/j.1365-246X.2007.03374.x
Beyreuther, M., Barsch, R., Krischer, L., Megies, T., Behr, Y., and Wassermann, J. (2010). ObsPy: A Python Toolbox for Seismology. Seismological Res. Lett. 81, 530–533. doi:10.1785/gssrl.81.3.530
Byrd, R. H., Lu, P., Nocedal, J., and Zhu, C. (1995). A Limited Memory Algorithm for Bound Constrained Optimization. SIAM J. Sci. Comput. 16, 1190–1208. doi:10.1137/0916069
Čermak, V. (1976). Heat flow map of the Bohemian Massif. Journal of Geophysics, 42(1), 455–458. Retrieved from https://journal.geophysicsjournal.com/JofG/article/view/195
Chen, X. (1993). A Systematic and Efficient Method of Computing normal Modes for Multilayered Half-Space. Geophys. J. Int. 115, 391–409. doi:10.1111/j.1365-246X.1993.tb01194.x
Enderle, U., Schuster, K., Prodehl, C., Schulze, A., and Bribach, J. (1998). The Refraction Seismic experiment GRANU95 in the Saxothuringian belt, southeastern Germany. Geophys. J. Int. 133, 245–259. doi:10.1046/j.1365-246X.1998.00462.x
Fischer, T., and Horálek, J. (2000). Refined Locations of the Swarm Earthquakes in the Nový Kostel Focal Zone and Spatial Distribution of the January 1997 Swarm in Western Bohemia, Czech Republic. Stud. Geophys. Geod. 44, 210–226. doi:10.1023/A:1022162826079
Fischer, T., and Horálek, J. (2003). Space-time Distribution of Earthquake Swarms in the Principal Focal Zone of the NW Bohemia/Vogtland Seismoactive Region: Period 1985-2001. J. Geodynamics 35, 125–144. doi:10.1016/S0264-3707(02)00058-3
Förster, A., and Förster, H.-J. (2000). Crustal Composition and Mantle Heat Flow: Implications from Surface Heat Flow and Radiogenic Heat Production in the Variscan Erzgebirge (Germany). J. Geophys. Res. 105, 27917–27938. doi:10.1029/2000JB900279
Grad, M., Guterch, A., Mazur, S., Keller, G. R., Špičák, A., Hrubcová, P., et al. (2008). Lithospheric Structure of the Bohemian Massif and Adjacent Variscan belt in central Europe Based on Profile S01 from the SUDETES 2003 experiment. J. Geophys. Res. 113, B10304. doi:10.1029/2007JB005497
Guy, A., Edel, J.-B., Schulmann, K., Tomek, Č., and Lexa, O. (2011). A Geophysical Model of the Variscan Orogenic Root (Bohemian Massif): Implications for Modern Collisional Orogens. Lithos 124, 144–157. doi:10.1016/j.lithos.2010.08.008
Haney, M. M., and Tsai, V. C. (2017). Perturbational and Nonperturbational Inversion of Rayleigh-Wave Velocities. Geophysics 82, F15–F28. doi:10.1190/geo2016-0397.1
Hansen, P. C. (2001). “The L-Curve and its Use in the Numerical Treatment of Inverse Problems,” in Computational Inverse Problems in Electrocardiology. ed. P. Johnston (Southampton: WIT Press), 119–142.
Heuer, B., Geissler, W. H., Kind, R., and Kämpf, H. (2006). Seismic Evidence for Asthenospheric Updoming beneath the Western Bohemian Massif, central Europe. Geophys. Res. Lett. 33, 1–4. doi:10.1029/2005GL025158
Horálek, J., Fischer, T., Boušková, A., and Jedlička, P. (2000). The Western Bohemia/Vogtland Region in the Light of the Webnet Network. Stud. Geophys. Geod. 44, 107–125. doi:10.1023/A:1022198406514
Horálek, J., and Fischer, T. (2008). Role of Crustal Fluids in Triggering the West Bohemia/Vogtland Earthquake Swarms: Just what We Know (A Review). Stud. Geophys. Geod. 52, 455–478. doi:10.1007/s11200-008-0032-0
Hrubcová, P., Środa, P., and CELEBRATION 2000 Working Group, (2008). Crustal Structure at the Easternmost Termination of the Variscan belt Based on CELEBRATION 2000 and ALP 2002 Data. Tectonophysics 460, 55–75. doi:10.1016/j.tecto.2008.07.009
Hrubcová, P., Środa, P., Grad, M., Geissler, W. H., Guterch, A., Vozár, J., et al. (2010). From the Variscan to the Alpine Orogeny: Crustal Structure of the Bohemian Massif and the Western Carpathians in the Light of the SUDETES 2003 Seismic Data. Geophys. J. Int. 183, 611–633. doi:10.1111/j.1365-246X.2010.04766.x
Hrubcová, P., Środa, P., Špičák, A., Guterch, A., Grad, M., Keller, G. R., et al. (2005). Crustal and Uppermost Mantle Structure of the Bohemian Massif Based on CELEBRATION 2000 Data. J. Geophys. Res. 110, 1–21. doi:10.1029/2004JB003080
Jena, F. S. U. (2009). “Thüringer Seismologisches Netz (TSN),” in International Federation of Digital Seismograph Networks. doi:10.7914/SN/TH
Karousová, H., Plomerová, J., and Vecsey, L. (2012). Seismic Tomography of the Upper Mantle beneath the north-eastern Bohemian Massif (central Europe). Tectonophysics 564-565, 1–11. doi:10.1016/j.tecto.2012.06.031
Kästle, E. D., El-Sharkawy, A., Boschi, L., Meier, T., Rosenberg, C., Bellahsen, N., et al. (2018). Surface Wave Tomography of the Alps Using Ambient-Noise and Earthquake Phase Velocity Measurements. J. Geophys. Res. Solid Earth 123, 1770–1792. doi:10.1002/2017JB014698
Knapmeyer-Endrun, B., Kruger, F., and Group, t. P. W.the PASSEQ Working Group (2014). Moho Depth across the Trans-European Suture Zone from P- and S-Receiver Functions. Geophys. J. Int. 197, 1048–1075. doi:10.1093/gji/ggu035
Kolínský, P., and Brokešová, J. (2007). The Western Bohemia Uppermost Crust Shear Wave Velocities from Love Wave Dispersion. J. Seismol. 11, 101–120. doi:10.1007/s10950-006-9040-0
Kolínský, P., Málek, J., and Brokešová, J. (2011). Shear Wave Crustal Velocity Model of the Western Bohemian Massif from Love Wave Phase Velocity Dispersion. J. Seismol. 15, 81–104. doi:10.1007/s10950-010-9209-4
Kvapil, J., Plomerová, J., Kampfová Exnerová, H., Babuška, V., Hetényi, G., and Group, A. W. (2021). Transversely Isotropic Lower Crust of Variscan central Europe Imaged by Ambient Noise Tomography of the Bohemian Massif. Solid Earth 12, 1051–1074. doi:10.5194/se-12-1051-2021
Li, Z., Zhou, J., Wu, G., Wang, J., Zhang, G., Dong, S., et al. (2021). CC-FJpy: A Python Package for Extracting Overtone Surface-Wave Dispersion from Seismic Ambient-Noise Cross Correlation. Seismological Res. Lett. 92, 3179–3186. doi:10.1785/0220210042
Lu, Y., Stehly, L., and Paul, A.AlpArray Working Group (2018). High-resolution Surface Wave Tomography of the European Crust and Uppermost Mantle from Ambient Seismic Noise. Geophys. J. Int. 214, 1136–1150. doi:10.1093/gji/ggy188
Marone, F., Van Der Lee, S., and Giardini, D. (2004). Three-dimensional Upper-mantleS-Velocity Model for the Eurasia-Africa Plate Boundary Region. Geophys. J. Int. 158, 109–130. doi:10.1111/j.1365-246X.2004.02305.x
Matte, P. (2001). The Variscan Collage and Orogeny (480-290 Ma) and the Tectonic Definition of the Armorica Microplate: a Review. Terra Nova 13, 122–128. doi:10.1046/j.1365-3121.2001.00327.x
Mousavi, S., Haberland, C., Bauer, K., Hejrani, B., and Korn, M. (2017). Attenuation Tomography in West Bohemia/Vogtland. Tectonophysics 695, 64–75. doi:10.1016/j.tecto.2016.12.010
Novotný, M. (2012). Depth-Recursive Tomography of the Bohemian Massif at the CEL09 Transect-Part B: Interpretation. Surv. Geophys. 33, 243–273. doi:10.1007/s10712-011-9155-x
Pan, L., Chen, X., Wang, J., Yang, Z., and Zhang, D. (2019). Sensitivity Analysis of Dispersion Curves of Rayleigh Waves with Fundamental and Higher Modes. Geophys. J. Int. 216, 1276–1303. doi:10.1093/gji/ggy479
Plomerová, J., Achauer, U., Babuška, V., and Granet, M. (2003). BOHEMA 2001-2003: Passive Seismic Experiment to Study Lithosphere-Asthenosphere System in the Western Part of the Bohemian Massif. Stud. Geophys. Geod. 47, 691–701. doi:10.1023/A:1024784223048
Plomerová, J., Achauer, U., Babuška, V., and Vecsey, L.BOHEMA working group (2007). Upper Mantle beneath the Eger Rift (Central Europe): Plume or Asthenosphere Upwelling. J. Int. 169, 675–682. doi:10.1111/j.1365-246X.2007.03361.x
Plomerová, J., Vecsey, L., and Babuška, V. (2012). Mapping Seismic Anisotropy of the Lithospheric Mantle beneath the Northern and Eastern Bohemian Massif (central Europe). Tectonophysics 564-565, 38–53. doi:10.1016/j.tecto.2011.08.011
Růžek, B., Vavryčuk, V., Hrubcová, P., Zedník, J., Guterch, A., Grad, M., et al. (2003). Crustal Anisotropy in the Bohemian Massif, Czech Republic: Observations Based on Central European Lithospheric Experiment Based on Refraction (CELEBRATION) 2000. J. Geophys. Res. 108. 1–15. doi:10.1029/2002JB002242
Růžek, B., Hrubcová, P., Novotný, M., Špičák, A., and Karousová, O. (2007). Inversion of Travel Times Obtained during Active Seismic Refraction Experiments CELEBRATION 2000, ALP 2002 and SUDETES 2003. Stud. Geophys. Geod. 51, 141–164. doi:10.1007/s11200-007-0007-6
Růžek, B., Valentová, L., and Gallovič, F. (2016). Significance of Geological Units of the Bohemian Massif, Czech Republic, as Seen by Ambient Noise Interferometry. Pure Appl. Geophys. 173, 1663–1682. doi:10.1007/s00024-015-1191-x
Špičák, A., Horálek, J., Boušková, A., Tomek, Č., and Vaněk, J. (1999). Magma Intrusions and Earthquake Swarm Occurrence in the Western Part of the Bohemian Massif. Stud. Geophys. Geod. 43, 87–106. doi:10.1023/A:1023366210017
Valentová, L., Gallovič, F., and Maierová, P. (2017). Three-dimensional S-Wave Velocity Model of the Bohemian Massif from Bayesian Ambient Noise Tomography. Tectonophysics 717, 484–498. doi:10.1016/j.tecto.2017.08.033
Wang, J., Wu, G., and Chen, X. (2019). Frequency-Bessel Transform Method for Effective Imaging of Higher-Mode Rayleigh Dispersion Curves from Ambient Seismic Noise Data. J. Geophys. Res. Solid Earth 124, 3708–3723. doi:10.1029/2018JB016595
Wessel, P., Smith, W. H. F., Scharroo, R., Luis, J., and Wobbe, F. (2013). Generic Mapping Tools: Improved Version Released. Eos Trans. AGU 94, 409–410. doi:10.1002/2013EO450001
Wilde-Piórko, M., Saul, J., and Grad, M. (2005). Differences in the Crustal and Uppermost Mantle Structure of the Bohemian Massif from Teleseismic Receiver Functions. Stud. Geophys. Geod. 49, 85–107. doi:10.1007/s11200-005-1627-3
Wu, G. x., Pan, L., Wang, J. n., and Chen, X. (2020). Shear Velocity Inversion Using Multimodal Dispersion Curves from Ambient Seismic Noise Data of USArray Transportable Array. J. Geophys. Res. Solid Earth 125, e2019JB018213. doi:10.1029/2019JB018213
Keywords: Europe, Bohemian Massif, ambient seismic noise, S-wave low-velocity zone, frequency-Bessel transform method
Citation: Ma Q, Pan L, Wang J-, Yang Z and Chen X (2022) Crustal S-Wave Velocity Structure Beneath the Northwestern Bohemian Massif, Central Europe, Revealed by the Inversion of Multimodal Ambient Noise Dispersion Curves. Front. Earth Sci. 10:838751. doi: 10.3389/feart.2022.838751
Received: 18 December 2021; Accepted: 13 January 2022;
Published: 08 February 2022.
Edited by:
Weijia Sun, Institute of Geology and Geophysics (CAS), ChinaReviewed by:
Zhi Guo, China Earthquake Administration, ChinaHuaiyu Yuan, Macquarie University, Australia
Copyright © 2022 Ma, Pan, Wang, Yang and Chen. This is an open-access article distributed under the terms of the Creative Commons Attribution License (CC BY). The use, distribution or reproduction in other forums is permitted, provided the original author(s) and the copyright owner(s) are credited and that the original publication in this journal is cited, in accordance with accepted academic practice. No use, distribution or reproduction is permitted which does not comply with these terms.
*Correspondence: Xiaofei Chen, Y2hlbnhmQHN1c3RlY2guZWR1LmNu
 Qingbo Ma
 Lei Pan
 Jian-nan Wang2,3