 Zhensong Gong1
 Yunyun Liu
 Zeng-Zhen Hu
 Ping Liang
- 1CMA Climate Studies Key Laboratory, National Climate Center, China Meteorological Administration, Beijing, China
- 2Key Laboratory of Meteorological Disaster, Ministry of Education and Collaborative Innovation Center on Forecast and Evaluation of Meteorological Disasters, Nanjing University of Information Science and Technology, Nanjing, China
- 3Climate Prediction Center, NCEP/NOAA, College Park, MD, United States
- 4Key Laboratory of Cities’ Mitigation and Adaptation to Climate Change in Shanghai, Shanghai Regional Climate Center, China Meteorological Administration, Shanghai, China
In the summer of 2020, tropical cyclone (TC) activities experienced a contrastive transition over the western North Pacific (WNP), from silence in July to unusually active in August. Furthermore, the generation location of TCs was further northwestward in August 2020, resulting in more typhoons landing, and three TCs successively moving northward, which is rare in history. Based on diagnoses with the total genesis potential index (GPI) in July and August 2020, it is suggested that the variation of mid-tropospheric relative humidity and upward convective motion is the major factor for the transition of TC genesis in summer 2020, while the changes of SST, low-level vorticity, and vertical wind shear anomalies played a secondary role. The exceptional variation of the Madden–Julian Oscillation (MJO) activity from July to August 2020 contributed to the transition of the environmental conditions over WNP. In July 2020, MJO was restricted in the Indian Ocean, thus generating an anomalous low-level anticyclone over WNP that intensified the WNP subtropical high. While in early August, MJO propagated eastward to enhance convective activities over the South China Sea and the Philippine Sea, favorable to TC genesis. Thus, MJO activity is a potential predictability source for intraseasonal variation of TC genesis anomalies in WNP.
Introduction
As one of the most destructive natural disasters in the world, tropical cyclones (TCs) are frequently generated over the western North Pacific (WNP), with the highest fraction of the global annual mean number of TCs (Chan, 2000; Chan, 2005; Ching et al., 2010). TCs are usually accompanied by strong winds, heavy rainfall, and storm surges, causing huge economic losses and casualties. China, Japan, the Korean Peninsula, and other Southeast Asian countries are greatly affected by TCs in WNP (Chen and Ding, 1979; Chen et al., 2019). Climatologically, July and August are the peak months of TC activities over WNP. However, 2020 summer experienced a contrastive transition of the TC activities over WNP, from silence in July to unusually active in August (Tian and Fan, 2021). The absence of TC activity over WNP in July 2020 is the first time in the available historical records since 1945 (Wang et al., 2021). The contrastive transition of the TC activities over WNP in 2020 summer suggests its possible unique driving factors.
Most TCs in WNP summer form within a southeast–northwest-extending monsoon trough over WNP, where the low-level westerlies over the warm pool converge with the trade easterlies at the southern edge of the WNP subtropical high (WPSH; McBride and Zehr, 1981; Ritchie and Holland, 1999; Chen et al., 2019). Thus, the intensity and location of the monsoon trough and the WPSH are thought to be influential to TC genesis (Ritchie and Holland, 1999; Huangfu et al., 2018). Associated with large-scale environmental conditions, TC genesis is accompanied by complex thermodynamic and dynamic interactions between the ocean and atmosphere (Walsh et al., 2016). These environmental elements usually include high sea surface temperature (SST), low-level initial cyclonic vorticity, weak vertical wind shear (VWS), sufficient midlatitude humidity, and a well-organized deep convective system (Emanuel and Nolan, 2004; Murakami and Wang, 2010; Bian et al., 2018). To quantify the impact of the atmospheric circulation on the TC genesis and development, the genesis potential index (GPI), which was motivated by the work of Gray (1979) and was originally developed by Emanuel and Nolan (2004), is a good measurement. The index involves several large-scale environmental factors, including 850-hPa absolute vorticity, vertical wind shear (VWS), 600-hPa relative humidity, and maximum potential intensity. Although the GPI was developed using a statistical fitting procedure, based on climatologically seasonal and spatial variations in TC genesis, it is also skillful in reproducing interannual variation in the observed frequency and location of TC genesis for several basins (Camargo et al., 2007). Later, Murakami and Wang (2010) modified the original GPI by explicitly incorporating the vertical motion and yielded improved results in general, including high values over the intertropical convergence zone (ITCZ) and eastern Pacific regions.
In addition to the large-scale atmospheric circulation, previous studies have noted that El Niño and Southern Oscillation (ENSO) and Indian Ocean sea surface temperature (SST) anomalies have a tremendous impact on the intraseasonal–interannual variation of TC frequency (Sobel and Maloney, 2000; Camargo et al., 2007; Chen and Tam, 2010; Wang and Chan, 2002; Du et al., 2011; Zhan et al., 2011; Huangfu et al., 2018). These anomalous modes affect TC activity through their impacts on the thermal and dynamic conditions over WNP. During the El Niño-decaying summer, an anomalous anticyclonic circulation is a recurrent pattern in the WNP, which acts to suppress TC genesis over the WNP (Wang and Chan, 2002; Du et al., 2011; Han et al., 2016; Wang et al., 2019). During 2020, the tropical Pacific SSTs evolved from a weak El Niño condition in the previous winter into a neutral ENSO state in summer (Liu et al., 2021a; Liu et al., 2021b). The weak El Niño event may imply limited influence on TC activities over the WNP in summer 2020. On the other hand, extremely warm SST anomalies were observed in the tropical Indian Ocean during the summer of 2020 (Ding et al., 2021), which could have provided an unfavorable background for the TC genesis over the WNP (Xie et al., 2009; Du et al., 2011). Some parallel independent studies have suggested a primary role of the tropical Indian Ocean, which had been the warmest in July 2020 since 1981, on the unprecedented absence of WNP tropical cyclones in July 2020 (Liu et al., 2021b; Tian and Fan, 2021; Wang et al., 2021). However, the Indian Ocean in August 2020 was still warm, which has been the second warmest since August 1981 (Supplementary Figure S1). The persistently warm SST of the Indian Ocean from July to August 2020 seems unable to explain the transition of TC activity in WNP from absence in July to active in August.
Concurrent with the remarkable SST anomaly in the Indian Ocean, it is observed that the tropical Madden–Julian Oscillation (MJO), which is initiated over the western Indian Ocean (Madden and Julian, 1971), stagnated in 2–3 phases for a long time in July and propagated rapidly eastward in August (Liu et al., 2021a). Although the physical mechanisms governing these extraordinary MJO activities are unclear, their impacts on Meiyu have been noted over the adjacent regions (Zhang et al., 2020; Liang et al., 2021). Previous studies have indicated that the MJO can regulate the TC frequency over the WNP (Chen and Huang, 2008; Li and Zhou, 2012; Li and Zhou, 2013). Thus, the MJO variation is probably a potential contribution to the contrastive transition.
The aforementioned intriguing observed phenomenon motivates us to further explore the controlling factors leading to anomalous TC activities in July and August 2020 from the perspective of large-scale environmental conditions. The environmental factors involved in GPI are the primary physical factors affecting TC genesis and are associated with the temporal and spatial variability of TC activities (Murakami and Wang, 2010). Moreover, these factors are affected/modulated by large-scale circulation, such as WPSH and MJO activity. In this work, we will first identify the importance of each of these factors resulting in the anomalies of the TC activities in July and August 2020, then further investigate the possible impact of the large-scale circulation in the contrastive transition of the TC activity from July to August 2020, especially the role of MJO.
Data and Methods
In this work, the information of TC occurrence frequency and genesis location is derived from the best track dataset provided by the Shanghai Typhoon Institute of China Meteorological Administration (CMA) (Ying et al., 2014). The data are downloaded from http://tcdata.typhoon.org.cn/zjljsjj_zlhq.html. The meteorological elements associated with the large-scale environmental conditions for TC activity over WNP in July and August are extracted from the NCEP/NCAR daily and monthly reanalysis data (Kalnay et al., 1996), including air temperature, relative and specific humidity, horizontal wind, vertical velocity, and sea-level pressure, with a spatial resolution of 2.5°
To identify the key factors of the atmospheric circulation influencing the TC activities over WNP in July and August 2020, the GPI of Murakami and Wang (2010) is calculated in this study and expressed as
where ζ is the 850-hPa absolute vorticity (s−1), RH is the 600-hPa relative humidity (%), Vpot is the maximum TC potential intensity (m s−1) (Emanuel and Nolan, 2004), Vs is the magnitude of the VWS (m s−1) between 850- and 200-hPa, and
Positive (negative) GPI values mean that large-scale conditions are favorable (unfavorable) for TC genesis. Among these factors, vertical wind shear is negatively correlated with the GPI, and all the other factors have positive correlations with the GPI. The relative humidity and maximum potential intensity are considered thermodynamical factors. The maximum potential intensity is determined by SST and the vertical structure of temperature and moisture.
Results
Contrastive TC Activities in July and August 2020
Climatologically, summer is considered the peak season with active TC activities, whereas it was anomalously silent in July 2020. The absence of TC activity in July 2020 broke the record held since 1949 over WNP, with more than two standard deviations below the climatological mean (3.7 TC geneses). In August 2020, however, the TC activities became unusually active, with 7 TC geneses and nearly one standard deviation above the climatological mean (5.7 TC geneses) (Figure 1). In particular, four of the seven were generated intensively in the first 10 days of August (Table 1), exceeding twice the number of climatology (1.9 TC geneses).
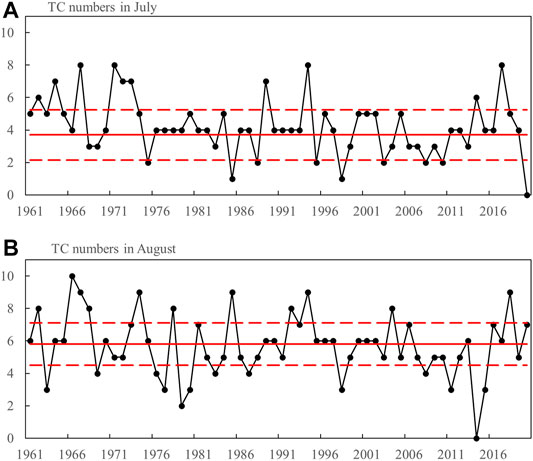
FIGURE 1. Numbers of TCs that generated over the western North Pacific (0°–25°N, 100°E–180°) (black line) in (A) July and (B) August during 1961–2020. Red solid and dashed lines indicate the climatological mean and one standard deviation of TC numbers, respectively.

TABLE 1. Information of TC geneses and landfall over WNP in summer 2020.
The average peak intensity of 8 TCs in summer is 33.6 m/s, which is weaker than the climatological average (40.1 m/s) (Table 1). Moreover, the locations of TC geneses in the 2020 summer are further northwestward than normal. In addition to the northward shift, the average location of the eight TC geneses in 2020 summer (19.6°N, 119.9°E) is about 16° westward of the average location (16.1°N, 136.5°E). The further northwestward the TC geneses are, the greater the chance of landing or affecting China’s coastal areas, Japan, and the Korean Peninsula (Liu and Chan, 2022). Among them, four typhoons landed in the southeastern coast of China, including TC2002 NURI, TC2004 HAGUPIT, TC2006 MEKKHALA, and TC2007 HIGOS. In addition, TC2008 BAVI, TC2009 MAYSAK, and TC2010 HAISHEN successively landed on the Korean Peninsula, bringing disastrous storms to South Korea, North Korea, and Northeast China.
Overall, in the summer of 2020, the number of TC genesis was significantly fewer than normal, with the unprecedented rapid change from “0 TC genesis” in July to unusually active in August. Furthermore, the genesis locations of TCs were further northwestward, resulting in more typhoons landing, and even three TCs successively moving northward during late August, which is rare in history (http://www.cma.gov.cn/en2014/20150311/20200414/202101/t20210112_570009.html).
Impacting Factors in July and August 2020
To identify the key environmental factors leading to the changes from silence in July to active in August 2020, we examine the contribution from each of the five individual variables comprising the GPI: the low-level vorticity, VWS (850–200 hPa), maximum potential intensity, 600-hPa RH, and vertical pressure velocity. Specifically, from the contribution of a given variable, the GPI is calculated using the other four variables obtained from the monthly climatology and the given variable in 2020 (Camargo et al., 2007). Such calculations provide an empirical quantification of the relative contributions of each of the specific environmental factors toward TC genesis (Camargo et al., 2007; Bruyere et al., 2012; Bian et al., 2018).
Figures 2, 3 show the total GPI anomaly relative to the climatology mean (Figures 2A, 3A) and the respective contributions from the individual factors in July (Figures 2B–F) and August (Figures 3B–F) 2020, respectively. Negative anomalies of the total GPI are observed over most of the TC genesis region (TGR, 5°-25°N, 110°E-180°) in July 2020 (Figure 2A), which are mainly attributed to weak low-level vorticity, reduced relative humidity, and descending motion (Figures 2B,C,F). Such anomalous environmental conditions inhibited TC genesis in July 2020. Interestingly, the maximum TC potential intensity associated with above-normal SST has positive contributions to GPI (Figure 2D), which does not result in TC formation. That is probably associated with the fact that WNP is mostly warm enough for the generation of TC; thus, other factors (such as wind shear, low-level vorticity, and humidity) play a more crucial role than SST in affecting TC genesis in WNP, differing from the situation in the tropical North Atlantic, where SST is the most sensitive factor for the TC genesis (Fu et al., 2011; Peng et al., 2011; Han et al., 2016).
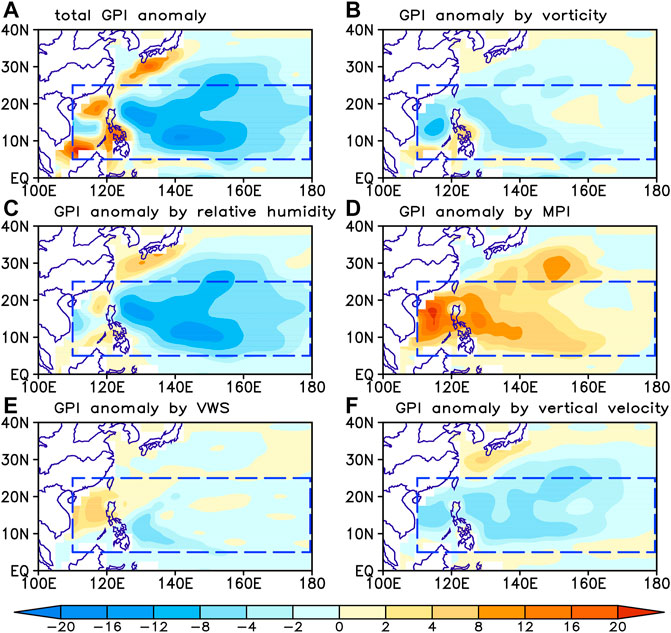
FIGURE 2. (A) Total GPI anomaly in July 2020 and the respective contribution from the individual variables for (B) 850-hPa absolute vorticity, (C) 600-hPa relative humidity, (D) maximum potential intensity, (E) VWS, and (F) 500-hPa vertical pressure velocity. The blue dashed box (5°-25°N, 110°E-180°) represents the main TC genesis region over WNP.
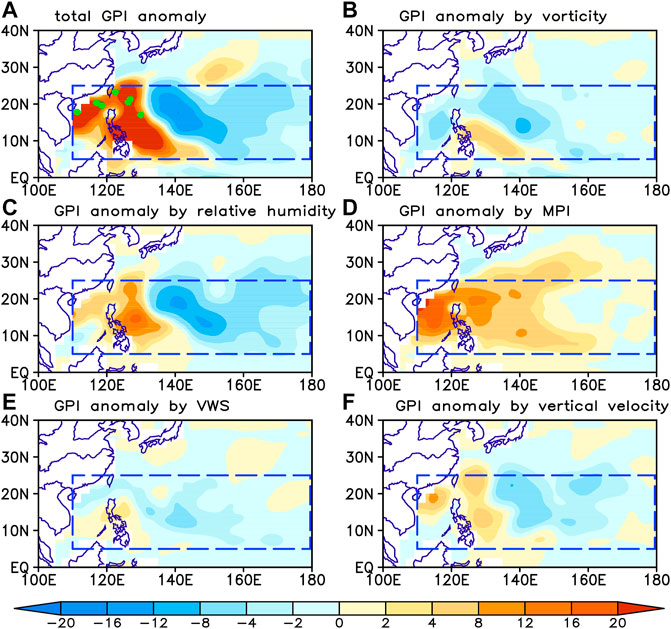
FIGURE 3. (A) Total GPI anomaly in August 2020 and the respective contribution from the individual variables for (B) 850-hPa absolute vorticity, (C) 600-hPa relative humidity, (D) maximum potential intensity, (E) VWS, and (F) 500-hPa vertical pressure velocity. The blue dashed box (5-25°N, 110°E-180°) represents themain TC genesis region over WNP. The green dots in (A) represent the locations of TC geneses.
In August 2020, however, an obvious positive anomaly of the total GPI was observed over the western part of the TGR (west of 140°E), where seven TCs generated. It is mainly attributed to enhanced relative humidity, warmer SST, slightly negative VWS anomaly, and active ascending motion (Figures 3C–F). Meanwhile, the negative anomalies of GPI are present in the eastern part of the TGR, similar to that in July 2020. The GPI distribution of “positive in the west and negative in the east” corresponds to the further westward shift of the TC genesis location in 2020.
To further examine the relative contributions of each variable to the transition of TC genesis in summer 2020, we calculated the GPI anomalies averaged over the western part of the TGR (5°-25°N, 110°-140°E) in July and August 2020 (Figure 4). For the domain-averaged total GPI increase from July to August 2020, all five factors have positive contributions. Specifically, the contribution of the low-level vorticities (vor850) increased with a reduced negative contribution; the contributions of the relative humidity at 600 hPa (rh600) and the vertical motion in the middle troposphere (ω500) increased from negative to positive; and the contributions of maximum potential intensity (MPI) and (-1)*VWS increased with enhanced positive contributions. Quantitatively, the variations of the enhanced mid-tropospheric humidity and active vertical motion acted as major factors for the transition from silence in July to active in August, while the changes of SST, low-level vorticity, and vertical wind shear anomalies played a secondary role.
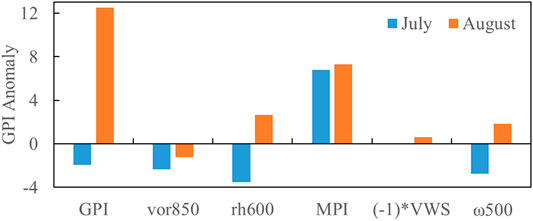
FIGURE 4. Anomalies of the total GPI and five terms associated with GPI averaged in the region of (5°-25°N, 110°-140°E) in July and August 2020, respectively.
The aforementioned analysis indicates that environmental conditions conducive to TC genesis are the relative humidity and vertical upward movement in the mid-troposphere. The relative humidity provides the necessary energy supply for the latent heat release in TC genesis (Emanuel and Nolan, 2004). Wang et al. (2021) emphasized the major contribution of the mid-level vertical motion to the absence of TC activity in July 2020. Han et al. (2016) and Zhang et al. (2020) argued that in addition to the relative humidity, the change of low-level absolute vorticity is also an important circulation factor to modulate the TC generation over WNP that is overall consistent with the aforementioned diagnostic analyses.
Large-Scale Circulation and the Role of MJO
Through the diagnoses of the respective contribution of five environmental factors in the GPI, it is suggested that environmental conditions can modulate TC genesis over the TGR. These environment conditions, especially the relative humidity in the mid-troposphere and convective upward movement, may also be the factors leading to the transition from no TC genesis in July 2020 to notably active in WNP in August 2020. Now, the question is—what causes the variations of the environment conditions? In this subsection, the atmospheric circulations between July and August 2020 are compared, and the role of MJO is examined.
Statistically, the TC generation frequency over WNP in summer is related to the intensity and location of the WPSH and the monsoon trough (Ritchie and Holland, 1999; Zhan et al., 2018; Huangfu et al., 2018; Chen et al., 2019). When the WPSH is strong and further westward as well as southward, the TC genesis frequency is lower and vice versa. In July 2020, the WPSH is anomalously strong. It extends westward to 110°E, with 17° longitude westward than the climatological location (127°E) as well as somewhat southward. Under the control of the WPSH, the South China Sea and the northern Philippines are controlled by the atmospheric downdraft; thus, the water vapor conditions are poor, with weak water vapor convergence (Figure 5A), which is consistent with the negative anomalies of the mid-level relative humidity (Figure 2C). The easterly wind, which is located at the southern side of the WPSH, inhibits the westward extension of the southwesterly summer monsoon, resulting in the weakening of the intensity of the monsoon trough and confining its eastward extension, with its eastern section only extending near 120°E as well as south of 10°N, mainly in the South China Sea (Figure 6A). In August, the WPSH is still strong, but its western part (west of 130°E) is migrated to the north (Figure 5B), the southwesterly summer monsoon advances to eastward, and the monsoon trough extends northeastward to near 135°E (Figure 6B). The southwesterly monsoon and the easterly flow on the southwest side of the WPSH converge over the South China Sea and the Philippines Sea to form a water vapor convergence center, with an anomalous positive relative humidity condition there (Figure 3C), which creates favorable conditions for TC genesis in the western part of TGR (Figure 5B). Such circulation variations in July and August 2020 are consistent with the characteristics of TC inactive and active typical years statistically analyzed by Bian et al. (2018).
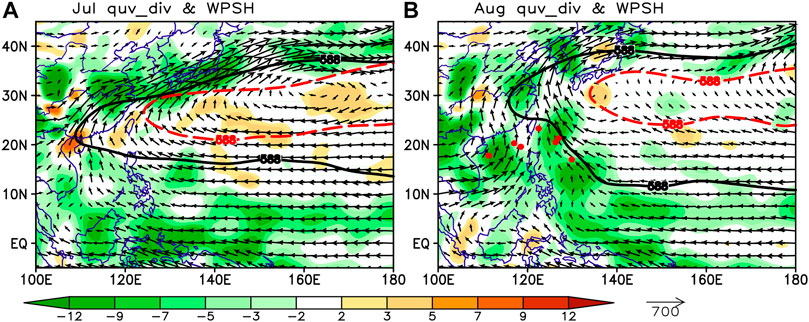
FIGURE 5. Vertically integrated water vapor transport between surface and 300 hPa (vector, kg·m−1·s−1) and divergences (shading, 10−5 kg s−1·m−2) in (A) July and (B) August 2020. The red dots in (B) indicate the locations of TC geneses. The black solid and red dashed contours of 5880 gpm in (A,B) indicate the western Pacific subtropical high in 2020 and climatology, respectively.
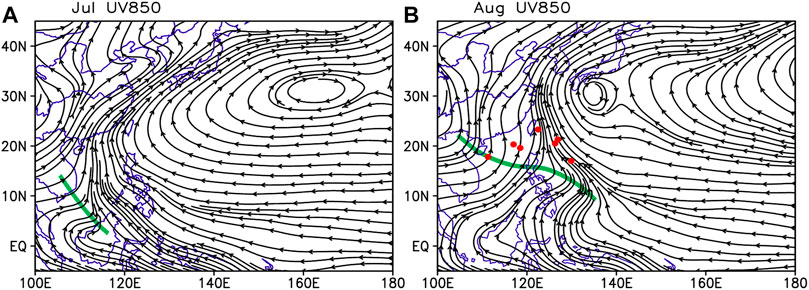
FIGURE 6. Distribution of streamline at 850hPa in (A) July and (B) August 2020. The bold green lines indicate the monsoon trough location. The red dots in (B) indicate the locations of TC geneses.
Deep convection is a reflection of both low-level convergence and ocean surface thermal conditions (McBride and Zehr, 1981). Figure 7 shows the distribution of the convective activities and low-level divergent wind anomalies in July and August 2020. It is noted that the convective activities over the whole WNP in July are restrained due to the control of the anomalously stronger and southward WPSH (Figure 7A), with the anomalous descending motion over TGR (Figure 2F). Meanwhile, the convection is active in the north of the WPSH, corresponding to the extreme Meiyu in 2020 (Ding et al., 2021; Liang et al., 2021). In August, however, due to the northward migration of the WPSH, the convective upward movement is active over the west of TGR (Figure 3F), where the outflow of the lower layer in July turns to an inflow in August, favoring TC genesis (Figure 7B).
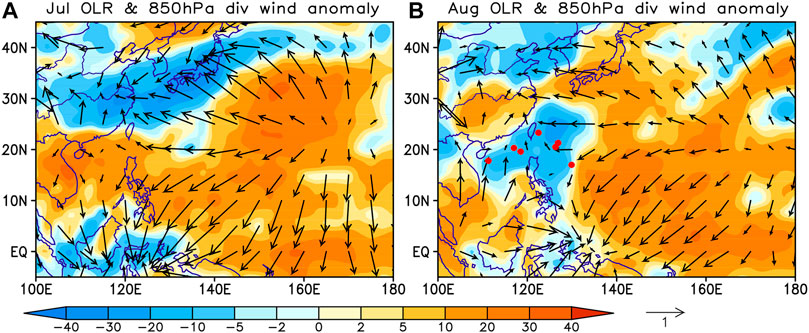
FIGURE 7. (A) OLR (shading, Wm−2) and (B) 850-hPa divergent winds (vector, m s−1) anomalies in July and August 2020, respectively. The red dots in (B) indicate the locations of TC geneses.
It has been known that the monsoon trough intensity is closely related to the location of the WPSH, and they are both affected by the local air–sea interaction or remote effect of the ENSO as well as its induced Indian Ocean SST anomaly (Wang and Chan, 2002; Xie et al., 2009; Huangfu et al., 2018). As mentioned in the introduction, the weak El Niño event and the Indian Ocean persistently warming in 2020, leading to anomalous strong WPSH both in July and August, can’t directly explain the transition of TC activity in NWP from absence in July to active in August. In fact, the critical variation of circulation systems associated with the transition is that the western part (west of 130°E) of WPSH was migrated to the north, and the monsoon trough extends northeastward. That leads to a water vapor convergence center formed over the South China Sea and the Philippines Sea and active convection in the west of 130°E of TGR. The outflow of the lower layer in July turns to an inflow in August, consisting with absence of TC in July to unusually active TC in August (Figures 5B, 6B, 7B).
The large-scale circulation in WNP linked to TC genesis can be modulated by MJO (Sobel and Maloney, 2000; Zhu et al., 2004; Li and Zhou, 2013; Chen et al., 2019). MJO affects the atmospheric temperature, water vapor content, and sea-level pressure during its eastward propagation. When MJO is in its active phase, convection is enhanced; a cyclonic vortex develops to the north of the equator at lower levels, while an anticyclonic vortex develops in the upper troposphere, vertical wind shear decreases, and upper-level divergence intensifies (Chen et al., 2019). Such a large-scale circulation background favors the generation and development of TCs. As a result, more TCs are generated in WNP. During summer 2020, MJO exhibited different propagation features from the typical MJO cycles (Zhang et al., 2020; Liang et al., 2021; Liu et al., 2021a). In July 2020, the long-term duration of MJO in the Indian Ocean, i.e., with abnormally frequent phases 1–2 (Figure 8A), favors an anomalous strong and further southward low-level anticyclone over WNP that intensifies the WPSH. Correspondingly, the positive OLR anomaly is located over most TGR, indicating that the convection is suppressed under the control of WPSH (Figure 9A). While in August, mainly in early August, MJO propagated eastward, with abnormally persistent phases 4 and 5 (Figure 8B). During the active MJO phases 4–5, an anomalous cyclonic circulation is over the South China Sea and WNP, and enhanced convections were over the Maritime Continent (Wheeler and Hendon, 2004) as well as the South China Sea and the Philippine Sea (Figure 9B) that led to intensively active TC genesis during the first 10 days of August. Thus, the contrast of MJO activity in July and August 2020 may be a key factor leading to the transition of TC genesis over WNP through modulating the large-scale environmental conditions in WNP. The role of MJO activity in modulating TC activity implies a potential predictability source of TC activity in WNP.
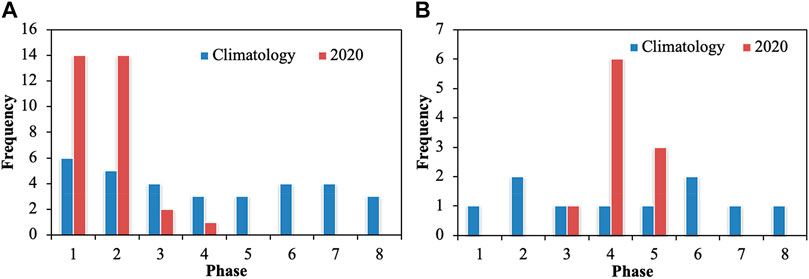
FIGURE 8. Frequency of MJO phases during (A) July and (B) early August in 2020 (red bars) and their corresponding climatology (blue bars).
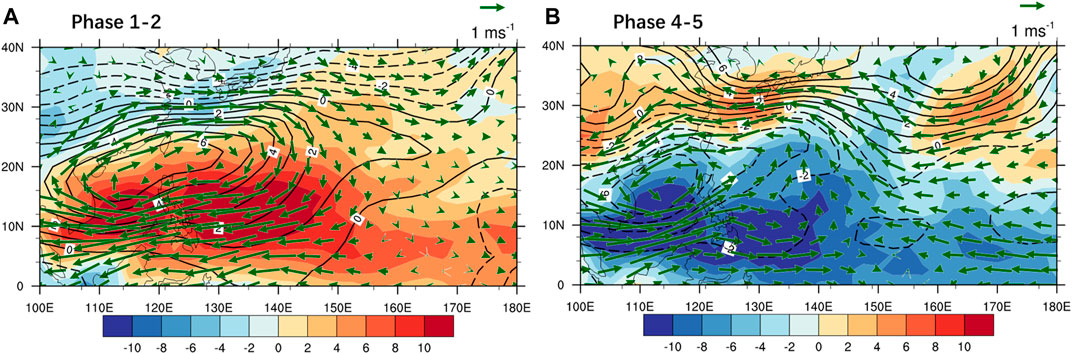
FIGURE 9. Anomalous composites of 500-hPa geopotential height (contour, gpm), OLR (shading, W m−2), and 850-hPa horizontal wind (vector, m s−1) in MJO (A) phases 1–2 and (B) phases 4–5 during July–August of 1981–2020.
Liu et al. (2021) analyzed the TC daily genesis rate anomalies for the eight MJO phases and noted that the WNP cyclogenesis exhibits a pronounced decrease (increase) when the MJO is in phases 1–3 (6–7). While MJO in phases 4–5, the TC genesis rate is near normal (Figure 4 in Liu et al., 2021). But, if we further examine the MJO’s modulation effect on WNP TC genesis during the typical TC season (June to November) through the phase-dependent MJO–TC relationships (Supplementary Figure S8 in Liu et al., 2021), it is shown that the whole TGR is favorable for TC genesis when MJO is in phases 6–7, while only the western part of TGR is favorable when MJO is in phases 4–5. The observed TC genesis in August 2020 was mainly concentrated in the western TGR, rather than the whole TGR. It is confirmed that the abnormal MJO activity from phases 1–2 in July to phases 4–5 in August was accompanied by the northward migration of the WPSH, thus creating favorable environmental conditions for TC genesis over the western part of TGR, resulting in the transition of TC genesis from July to August 2020.
Conclusion and Discussion
In the summer of 2020, TC activities experienced a contrastive transition over WNP, from silence in July to unusually active in August. Furthermore, the genesis location of TCs was further northwestward, resulting in more typhoons landing, and even three TCs successively moving northward during late August, which is rare in history. Here, we identified the controlling factors leading to the intriguing phenomenon and examined the role of large-scale environmental conditions, especially the impact of MJO.
Based on the total GPI diagnoses between July and August 2020, it is suggested that the variations of the enhanced mid-tropospheric relative humidity and enhanced upward convective motion have acted as major factors for the transition of TC genesis from July to August 2020, while the changes of SST, low-level vorticity, and vertical wind shear anomalies played a secondary role. The exceptional variation of MJO activity from July to August 2020 contributed to the transition of the environmental conditions over WNP. In July 2020, the long-term duration of MJO in the Indian Ocean favors an anomalous low-level anticyclone over WNP that intensifies the WPSH. While in August, mainly in early August, MJO propagated eastward with enhanced convections over the South China Sea and the Philippine Sea, leading to intensively active TC genesis. Thus, MJO activity plays an important role in modulating TC activity in WNP for the intraseasonal variation in 2020 summer, also implying a potential predictability source for the intra-seasonal variation of TC activity in WNP.
In this work, we investigated the role of MJO variation on the TC transition from July to August. Some previous studies pointed out that in addition to the MJO, the 10–20-day intraseasonal oscillation (QBWO) and synoptic-scale waves (SSWs) also play roles in TC genesis over the WNP (Frank and Roundy, 2006; Wu and Cao, 2017; Huangfu et al., 2022). Huangfu et al. (2022) emphasized that without SSWs, the impact from two other intraseasonal oscillations can be overestimated. Thus, it is interesting for a future work to further examine the impact of these different time scale oscillations on the contrastive transition of TC genesis in 2020.
Data Availability Statement
The original contributions presented in the study are included in the article/Supplementary Material, further inquiries can be directed to the corresponding author.
Author Contributions
YL conceived the idea in discussion with ZG and Z-ZH. ZG performed the data analyses and wrote the initial manuscript. Z-ZH and PL contributed substantially to improving the research and presentation. YL and ZG plotted the figures. All the authors contributed to the writing, editing, presentation, and reviewing of the manuscript.
Funding
This work was jointly supported by the Guangdong Major Project of Basic and Applied Basic Research (2020B0301030004), the National Natural Science Foundations of China (42175056), the China Meteorological Administration Innovation and Development Project (CXFZ 2021Z033), the Joint Open Project of KLME & CIC-FEMD, NUIST (KLME202102), the Natural Science Foundation of Shanghai (21ZR1457600), and National Key R&D Program of China (2018YFC1505806).
Conflict of Interest
The authors declare that the research was conducted in the absence of any commercial or financial relationships that could be construed as a potential conflict of interest.
Publisher’s Note
All claims expressed in this article are solely those of the authors and do not necessarily represent those of their affiliated organizations, or those of the publisher, the editors, and the reviewers. Any product that may be evaluated in this article, or claim that may be made by its manufacturer, is not guaranteed or endorsed by the publisher.
Acknowledgments
The authors appreciate the constructive comments and insightful suggestion from two reviewers.
Supplementary Material
The Supplementary Material for this article can be found online at: https://www.frontiersin.org/articles/10.3389/feart.2022.843990/full#supplementary-material
References
Bian, J., Fang, J., Chen, G., and Liu, C. (2018). Circulation Features Associated with the Record-Breaking Typhoon Silence in August 2014. Adv. Atmos. Sci. 35 (10), 1321–1336. doi:10.1007/s00376-018-7294-4
Bruyère, C. L., Holland, G. J., and Towler, E. (2012). Investigating the Use of a Genesis Potential index for Tropical Cyclones in the North Atlantic basin. J. Clim. 25, 8611–8626. doi:10.1175/JCLI-D-11-00619.1
Camargo, S. J., Emanuel, K. A., and Sobel, A. H. (2007). Use of a Genesis Potential index to Diagnose ENSO Effects on Tropical Cyclone Genesis. J. Clim. 20 (19), 4819–4834. doi:10.1175/jcli4282.1
Chan, J. C. L. (2005). Interannual and Interdecadal Variations of Tropical Cyclone Activity over the Western North Pacific. Meteorol. Atmos. Phys. 89, 143–152. doi:10.1007/s00703-005-0126-y
Chan, J. C. L. (2000). Tropical Cyclone Activity over the Western North Pacific Associated with El Niño and La Niña Events. J. Clim. 13, 2960–2972. doi:10.1175/1520-0442(2000)013<2960:tcaotw>2.0.co;2
Chen, G., and Huang, R. (2008). Influence of Monsoon Over the Warm Pool on Interannual Variation on Tropical Cyclone Activity over the Western North Pacific. Adv. Atmos. Sci. 25 (2), 319–328. doi:10.1007/s00376-008-0319-7
Chen, G., and Tam, C.-Y. (2010). Different Impacts of Two Kinds of Pacific Ocean Warming on Tropical Cyclone Frequency over the Western North Pacific. Geophys. Res. Lett. 37, L01803. doi:10.1029/2009GL041708
Chen, L., Gong, Z., Wu, J., and Li, W. (2019). Extremely Active Tropical Cyclone Activities over the Western North Pacific and South China Sea in Summer 2018: Joint Effects of Decaying La Niña and Intraseasonal Oscillation. J. Meteorol. Res. 33, 609–626. doi:10.1007/s13351-019-9009-x
Chen, L. S., and Ding, Y. H. (1979). An Introduction to Typhoons over Northwest Pacific. Beijing, China: Science Press, 1–10. (in Chinese).
Ching, L., Sui, C.-H., and Yang, M.-J. (2010). An Analysis of the Multiscale Nature of Tropical Cyclone Activities in June 2004: Climate Background. J. Geophys. Res. 115 (D24), D24108. doi:10.1029/2010JD013803
Ding, Y., Liu, Y., and Hu, Z.-Z. (2021). The Record-Breaking Mei-Yu in 2020 and Associated Atmospheric Circulation and Tropical SST Anomalies. Adv. Atmos. Sci. 38 (12), 1980–1993. doi:10.1007/s00376-021-0361-2
Du, Y., Yang, L., and Xie, S.-P. (2011). Tropical Indian Ocean Influence on Northwest Pacific Tropical Cyclones in Summer Following Strong El Niño*. J. Clim. 24, 315–322. doi:10.1175/2010JCLI3890.1
Emanuel, K., and Nolan, D. S. (2004). “Tropical Cyclone Activity and the Global Climate System,” in Preprints, 26th Conf. on Hurricanes and Tropical Meteorology, Miami, FL, USA, May 03-07, 2004 (Amer. Meteor. Soc. A.), 10.
Frank, W. M., and Roundy, P. E. (2006). The Role of Tropical Waves in Tropical Cyclogenesis. Mon. Weather Rev. 134, 2397–2417. doi:10.1175/MWR3204.1
Fu, B., Peng, M. S., Li, T., and Stevens, D. E. (2012). Developing versus Nondeveloping Disturbances for Tropical Cyclone Formation. Part II: Western North Pacific. Mon. Wea. Rev. 140, 1067–1080. doi:10.1175/2011MWR3618.1
Gray, W. M. (1979). “Hurricanes: Their Formation, Structure and Likely Role in the Tropical Circulation,” in Meteorology over the Tropical Oceans. Editor D. B. Shaw (Royal Meteorological Society), 127–139.
Han, R., Wang, H., Hu, Z.-Z., Kumar, A., Li, W., Long, L. N., et al. (2016). An Assessment of Multimodel Simulations for the Variability of Western North Pacific Tropical Cyclones and its Association with ENSO. J. Clim. 29, 6401–6423. doi:10.1175/JCLI-D-15-0720.1
Huang, B., Thorne, P. W., Banzon, V. F., Boyer, T., Chepurin, G., Lawrimore, J. H., et al. (2017). Extended Reconstructed Sea Surface Temperature, Version 5 (ERSSTv5): Upgrades, Validations, and Intercomparisons. J. Clim. 30, 8179–8205. doi:10.1175/jcli-d-16-0836.1
Huangfu, J., Cao, X., Wu, R., Chen, G., and Chen, W. (2022). Influences of central Pacific Warming on Synoptic-Scale Wave Intensity over the Northwest Pacific. Clim. Dyn. 58, 555–567. doi:10.1007/s00382-021-05922-6
Huangfu, J., Huang, R., Chen, W., and Feng, T. (2018). Causes of the Active Typhoon Season in 2016 Following a strong El Niño with a Comparison to 1998. Int. J. Climatol 38, e1107–e1118. doi:10.1002/joc.5437
Kalnay, E., Kanamitsu, M., Kistler, R., Collins, W., Deaven, D., Gandin, L., et al. (1996). The NCEP/NCAR 40-Year Reanalysis Project. Bull. Amer. Meteorol. Soc. 77, 437–471. doi:10.1175/1520-0477(1996)077<0437:tnyrp>2.0.co;2
Li, R. C. Y., and Zhou, W. (2012). Changes in Western Pacific Tropical Cyclones Associated with the El Niño-Southern Oscillation Cycle. J. Clim. 25, 5864–5878. doi:10.1175/JCLI-D-11-00430.1
Li, R. C. Y., and Zhou, W. (2013). Modulation of Western North Pacific Tropical Cyclone Activity by the ISO. Part I: Genesis and Intensity. J. Clim. 26, 2904–2918. doi:10.1175/jcli-d-12-00210.1
Liang, P., Hu, Z.-Z., Ding, Y., and Qian, Q. (2021). The Extreme Mei-Yu Season in 2020: Role of the Madden-Julian Oscillation and the Cooperative Influence of the Pacific and Indian Oceans. Adv. Atmos. Sci. 38 (12), 2040–2054. doi:10.1007/s00376-021-1078-y
Liu, C., Zhang, W., Jiang, F., Stuecker, M. F., and Huang, Z. (2021). Record‐Low WNP Tropical Cyclone Activity in Early Summer 2020 Due to Indian Ocean Warming and Madden‐Julian Oscillation Activity. Geophys. Res. Lett. 48, e2021GL094578. doi:10.1029/2021gl094578
Liu, K. S., and Chan, J. C. L. (2022). Growing Threat of Rapidly-Intensifying Tropical Cyclones in East Asia. Adv. Atmos. Sci. 39 (2), 222–234. doi:10.1007/s00376-021-1126-7
Liu, Y., Wang, Y., Gong, Z., and Lou, D. (2021a). Precursory Signals of the 2020 Summer Climate in China and Evaluation of Real-Time Prediction. Meteorol. Mon. 47 (4), 488–498. doi:10.7519/j.issn.1000-0526.2021.01.011
Liu, Y., Wang, Y., and Ke, Z. (2021b). Characteristics and Possible Causes for the Climate Anomalies over China in Suumer 2020. Meteorol. Mon. 47 (1), 117–126. doi:10.7519/j.issn.1000-0526.2021.04.010
Madden, R. A., and Julian, P. R. (1971). Detection of a 40‐50 day Oscillation in the Zonal Wind in the Tropical Pacific. J. Atmos. Sci. 25 (5), 702–708. doi:10.1175/1520-0469(1971)028<0702:doadoi>2.0.co;2
McBride, J. L., and Zehr, R. (1981). Observational Analysis of Tropical Cyclone Formation. Part II: Comparison of Non-developing versus Developing Systems. J. Atmos. Sci. 38, 585–605. doi:10.1175/1520-0469(1981)038<1132:oaotcf>2.0.co;2
Murakami, H., and Wang, B. (2010). Future Change of North Atlantic Tropical Cyclone Tracks: Projection by a 20-Km-Mesh Global Atmospheric Model. J. Clim. 23, 2699–2721. doi:10.1175/2010JCLI3338.1
Peng, M. S., Fu, B., Li, T., and Stevens, D. E. (2012). Developing versus Nondeveloping Disturbances for Tropical Cyclone Formation. Part I: North Atlantic. Mon. Wea. Rev. 140, 1047–1066. doi:10.1175/2011MWR3617.1
Ritchie, E. A., and Holland, G. J. (1999). Large-Scale Patterns Associated With Tropical Cyclogenesis in the Western Pacific. Mon. Weather Rev. 127, 2027–2043.
Sobel, A. H., and Maloney, E. D. (2000). Effect of ENSO and the MJO on Western north Pacific Tropical Cyclones. Geophys. Res. Lett. 27, 1739–1742. doi:10.1029/1999gl011043
Tian, B., and Fan, K. (2021). Absence of Tropical Cyclone Genesis over the Western North Pacific in July 2020 and its Prediction by CFSv2. Front. Earth Sci. 9, 771172. doi:10.3389/feart.2021.771172
Walsh, K. J. E., McBride, J. L., Klotzbach, P. J., Balachandran, S., Camargo, S. J., Holland, G., et al. (2016). Tropical Cyclones and Climate Change. Wires Clim. Change 7, 65–89. doi:10.1002/wcc.371
Wang, B., and Chan, J. C. L. (2002). How Strong ENSO Events Affect Tropical Storm Activity over the Western North Pacific. J. Clim. 15, 1643–1658. doi:10.1175/1520-0442(2002)015<1643:hseeat>2.0.co;2
Wang, C., Wang, B., and Wu, L. (2019). Abrupt Breakdown of the Predictability of Early Season Typhoon Frequency at the Beginning of the Twenty-First century. Clim. Dyn. 52, 3809–3822. doi:10.1007/s00382-018-4350-9
Xie, S.-P., Hu, K., Hafner, J., Tokinaga, H., Du, Y., Huang, G., et al. (2009). Indian Ocean Capacitor Effect on Indo‐Western Pacific Climate During the Summer Following El Nino. J. Clim. 22, 730–747.
Wang, C., Wu, K., Wu, L., Zhao, H., and Cao, J. (2021). What Caused the Unprecedented Absence of Western North Pacific Tropical Cyclones in July 2020? Geophys. Res. Lett. 48, e2020GL092282. doi:10.1029/2020GL092282
Wheeler, M. C., and Hendon, H. H. (2004). An All-Season Real-Time Multivariate MJO index: Development of an index for Monitoring and Prediction. Mon. Wea. Rev. 132, 1917–1932. doi:10.1175/1520-0493(2004)132<1917:aarmmi>2.0.co;2
Wu, R., and Cao, X. (2017). Relationship of Boreal Summer 10-20-day and 30-60-day Intraseasonal Oscillation Intensity over the Tropical Western North Pacific to Tropical Indo-Pacific SST. Clim. Dyn. 48, 3529–3546. doi:10.1007/s00382-016-3282-5
Ying, M., Zhang, W., Yu, H., Lu, X., Feng, J., Fan, Y., et al. (2014). An Overview of the China Meteorological Administration Tropical Cyclone Database. J. Atmos. Oceanic Technol. 31, 287–301. doi:10.1175/JTECHD-12-00119.110.1175/jtech-d-12-00119.1
Zhan, R., Chen, B., and Ding, Y. (2018). Impacts of SST Anomalies in the Indian-Pacific basin on Northwest Pacific Tropical Cyclone Activities during Three Super El Niño Years. J. Ocean. Limnol. 36, 20–32. doi:10.1007/s00343-018-6321-8
Zhan, R., Wang, Y., and Wu, C.-C.. (2011). Impact of SSTA in the East Indian Ocean on the Frequency of Northwest Pacific Tropical Cyclones: A Regional Atmospheric Model Study. J. Clim. 24 (23), 6227–6242. doi:10.1175/jcli-d-10-05014.1
Zhang, W., Huang, Z., Jiang, F., Stuecker, M. F., Chen, G., and Jin, F. F. (2021). Exceptionally Persistent Madden‐Julian Oscillation Activity Contributes to the Extreme 2020 East Asian Summer Monsoon Rainfall. Geophys. Res. Lett. 48, e2020GL091588. doi:10.1029/2020GL091588
Keywords: tropical cyclone genesis in 2020 summer, western North Pacific, transition from silence in July to active in August, genesis potential index, Madden-Julian oscillation
Citation: Gong Z, Liu Y, Hu Z- and Liang P (2022) Tropical Cyclone Activities Over the Western North Pacific in Summer 2020: Transition From Silence in July to Unusually Active in August. Front. Earth Sci. 10:843990. doi: 10.3389/feart.2022.843990
Received: 27 December 2021; Accepted: 31 January 2022;
Published: 23 February 2022.
Edited by:
Wen Chen, Institute of Atmospheric Physics (CAS), ChinaReviewed by:
Tao Feng, Hohai University, ChinaJingliang Huangfu, Institute of Atmospheric Physics (CAS), China
Copyright © 2022 Gong, Liu, Hu and Liang. This is an open-access article distributed under the terms of the Creative Commons Attribution License (CC BY). The use, distribution or reproduction in other forums is permitted, provided the original author(s) and the copyright owner(s) are credited and that the original publication in this journal is cited, in accordance with accepted academic practice. No use, distribution or reproduction is permitted which does not comply with these terms.
*Correspondence: Yunyun Liu, bGl1eXVueUBjbWEuZ292LmNu