 Estelle Elisa Ledoux1*
 Feng Lin2
 Lowell Miyagi 2Ahmed Addad 1
 Alexandre Fadel1
 Damien Jacob 1Franck Béclin 1
 Sébastien Merkel1
- 1Université de Lille, CNRS, INRAE, Centrale Lille, UMR 8207 - UMET - Unité Matériaux et Transformations, Lille, France
- 2Department of Geology and Geophysics, University of Utah, Salt Lake City, UT, United States
Ferropericlase is the second most abundant mineral in the Earth’s lower mantle and its mechanical properties have a strong influence on the rheology of this region. Here, we deform polycrystalline MgO, the magnesium end-member of ferropericlase, at conditions ranging from 1.6 to 8.3 GPa and 875–1,270 K. We analyse the flow laws and microstructures of the recovered samples using electron microscopy and compare our observations with predictions from the literature. We identify a first mechanism for samples deformed at 1,270 K, attributed to a regime controlled by grain boundary sliding accommodated by diffusion, and characterized by a small grain size, an absence of texture, and no intracrystalline deformation. At 1,070 K and below, the deformation regime is controlled by dislocations. The samples show a more homogeneous grain size distribution, significant texture, and intracrystalline strains. In this regime, deformation is controlled by the ⟨110⟩{110} slip system and a combined ⟨110⟩{110} and ⟨110⟩{100} slip, depending on pressure and temperature. Based on these results, we propose an updated deformation map for polycrystalline MgO at mantle conditions. The implications for ferropericlase and seismic observations in the Earth’s lower mantle are discussed.
1 Introduction
Periclase is the magnesium end-member of (Mg,Fe)O ferropericlase, the second most abundant mineral in the Earth’s lower mantle (Ringwood, 1991). At mantle conditions, ferropericlase is believed to be substantially weaker than bridgmanite (Girard et al., 2016) and hence accommodate large amount of deformation (Nzogang et al., 2018). As such the mechanical properties of ferropericlase and its MgO end-member are very relevant for our understanding of the Earth deep mantle. MgO is also an ionic ceramic which is mainly used for its refractory properties in furnaces (Pole et al., 1946) and flame retardants (Dong et al., 2012) as well as a compound for some technical ceramics for the construction industry. Finally, MgO is a model material for the investigation of plastic deformation and dislocation mobility in ionic ceramics due to its simple rocksalt crystal structure (Amodeo et al., 2018). As such, MgO has been the topic of advanced studies regarding the effects of pressure, temperature, and strain on its plasticity both using experiment (Paterson and Weaver, 1970; Merkel et al., 2002; Weidner et al., 2004; Lin et al., 2017) and numerical models (Amodeo et al., 2012; Cordier et al., 2012; Amodeo et al., 2016), recently reviewed in Amodeo et al. (2018).
Although the upper mantle is known to be anisotropic, the lower mantle is isotropic for body waves from 1,000 km to 2,700 km depth (Meade et al., 1995). There are two classes of anisotropic structures that could cause seismic anisotropy in the Earth’s mantle (Karato, 1998). One is the lattice preferred orientation (LPO) of anisotropic minerals and the other is the shape preferred orientation (SPO) of secondary phases. Understanding LPO in minerals requires understanding plasticity induced by deformation. Deformation controlled by dislocations or twinning will result in LPO and hence anisotropy. On the contrary, if deformation is controlled by diffusion or other homogeneous processes, it will most often not result in LPO, although there are reports of strong LPO development in the diffusion creep regime in olivine (Miyazaki et al., 2013). Numerous studies have investigated plasticity of periclase and ferropericlase under pressure and temperature (Paterson and Weaver, 1970; Stretton et al., 2001; Merkel et al., 2002; Heidelbach et al., 2003; Weidner et al., 2004; Long et al., 2006; Tommaseo et al., 2006; Mariani et al., 2009; Marquardt et al., 2011; Amodeo et al., 2012; Girard et al., 2012; Amodeo et al., 2016; Lin et al., 2017; Immoor et al., 2018; Lin et al., 2019). Most studies report that the ⟨110⟩{110} and ⟨110⟩{100} slip systems dominate in these minerals with some reports that ⟨110⟩{111} can also be active (Li et al., 2004). Both numerical simulations (Amodeo et al., 2012; Cordier et al., 2012) and single crystal deformation experiments (Girard et al., 2012) suggest a pressure induced inversion in dominant slip system. Experiments on polycrystals at room temperature and pressures up to 47 GPa report the dominance of ⟨110⟩{110} slip system with no evidence for slip system transition (Merkel et al., 2002; Tommaseo et al., 2006; Lin et al., 2017). At high temperature, the deformation of polycrystals results of a combination of two or three slip systems (Stretton et al., 2001; Heidelbach et al., 2003; Mariani et al., 2009). Recrystallization by subgrain rotation is also sometimes observed (Heidelbach et al., 2003). Immoor et al. (2018) deformed polycrystals at both high pressures and high temperatures and see an increased activity of ⟨110⟩{100} above 30 GPa consistent with predictions of Amodeo et al. (2016) of dominant ⟨110⟩{100} slip above 60 GPa. However, the transition between dominant ⟨110⟩{110} slip to a comparable activity of ⟨110⟩{110} and ⟨110⟩{100} slip can be difficult to characterize in polycrystals. Both numerical (Amodeo et al., 2016) and experimental (Immoor et al., 2018) studies show a continuous change in the induced microstructures rather than a sharp transition.
Questions also arise when addressing the relative behavior of single-vs. polycrystals. Grain-to-grain or grain boundary interactions are present in polycrystals but not in single crystals. Moreover, the history of sample deformation can affect microstructures measured in samples deformed over a broad range of conditions. To address these issues, we deform polycrystalline periclase at temperatures and pressures ranging from 875 to 1,270 K and from 1.6 to 8.3 GPa and strain rates between 10–6 and 10–4 s−1. We then characterize flow laws with in-situ X-ray diffraction and the recovered samples with electron microscopy. Based on our observations we quantify the sample’s microstructural features. We then construct a map for dominant deformation regimes and active slip systems in polycrystalline MgO as a function of pressure and temperature and discuss the implications of these results for the Earth’s lower mantle.
2 Methods
2.1 High pressure/High Temperature Deformation Experiment
The starting material was a commercial MgO powder from Alfa Aesar (part #14684, 99.95% purity, 325 mesh). Scanning electron microscope (SEM) analysis indicates that this material is made of clusters of crystallites with a typical crystallite size below 1 μm (Figure 1).
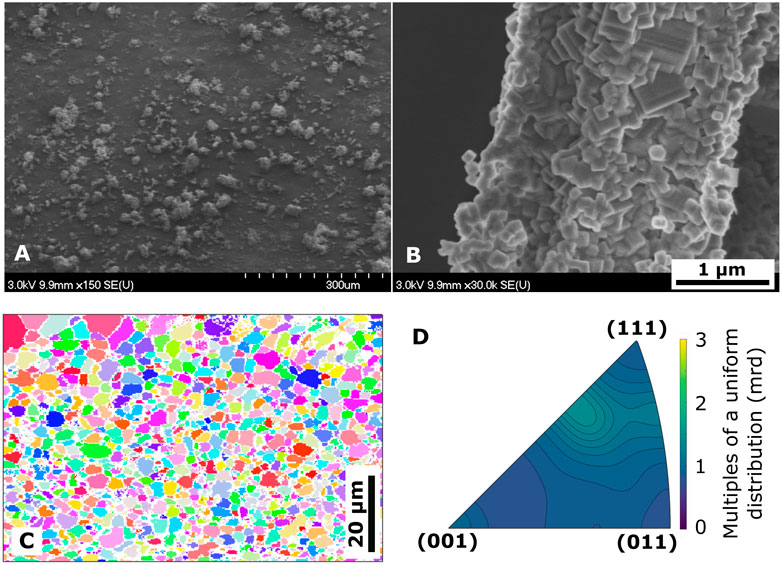
FIGURE 1. Electron microscopy imaging of MgO starting material. (A) 325 mesh clusters of the original powder. (B) Zoom on one of these clusters. The clusters are made of several smaller crystallites. (C) EBSD orientation mapping of the sample recovered after sintering and annealing at ≈ 2 GPa of hydrostatic pressure and 1,270 K in the D-DIA. The sample is dominated by grains with areas around 3 μm2. (D) Inverse pole figure of the compression direction for the reference undeformed sample (D2028).
The powder was hand-pressed into a cubic multi-anvil cell assembly for D-DIA experiments (Lin et al., 2017) with a sample dimension of 1 mm × 1 mm, for all experiments. We used the D-DIA deformation apparatus (Wang et al., 2010) available at the 13-BMD beam line of the GSECARS sector at the advanced photon source (APS). At the beginning of each run, the sample was sintered and annealed inside the D-DIA in order to generate a homogeneous microstructure. All samples were annealed at a 20 tons load (
We performed six deformation runs at different pressure and temperature conditions between 1.6 and 8.3 GPa and 875 and 1,270 K (Table 1). After the annealing step, the conditions were adjusted to the target pressure and temperature. The sample was then deformed in axial compression at fixed strain rates by advancing the vertical anvils toward the sample while retracting the horizontal anvils. The overall duration of the deformation experiments ranged between 120 and 677 min to total strains ranging between 15 and 35% with varying strain rates (Table 1). Figure 2 shows a typical example of a sample recovered after the experiment.
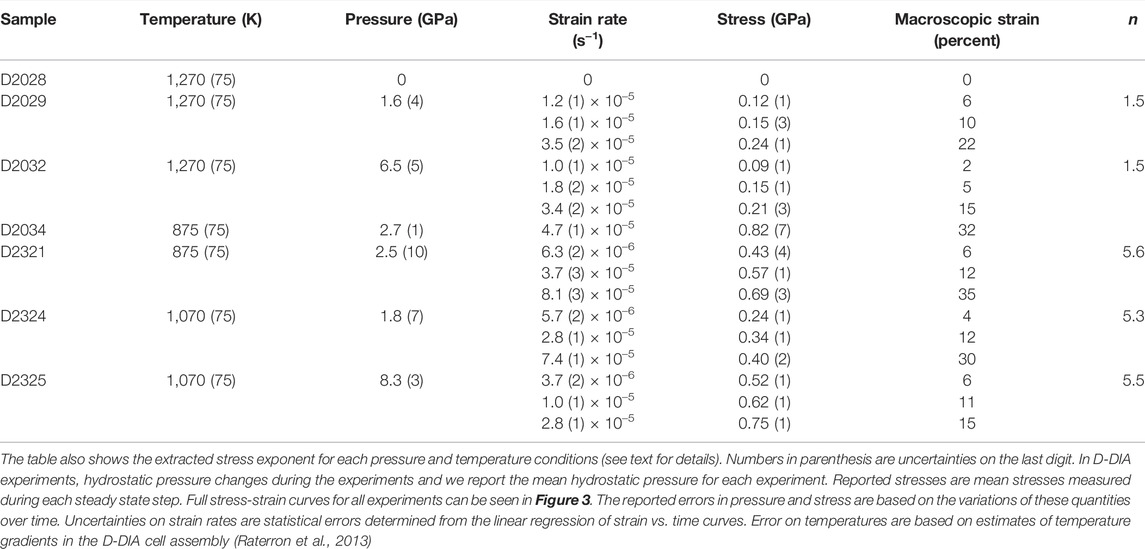
TABLE 1. Experimental results: temperature, average hydrostatic pressure, strain rate, stress and final macroscopic strain at each deformation step.
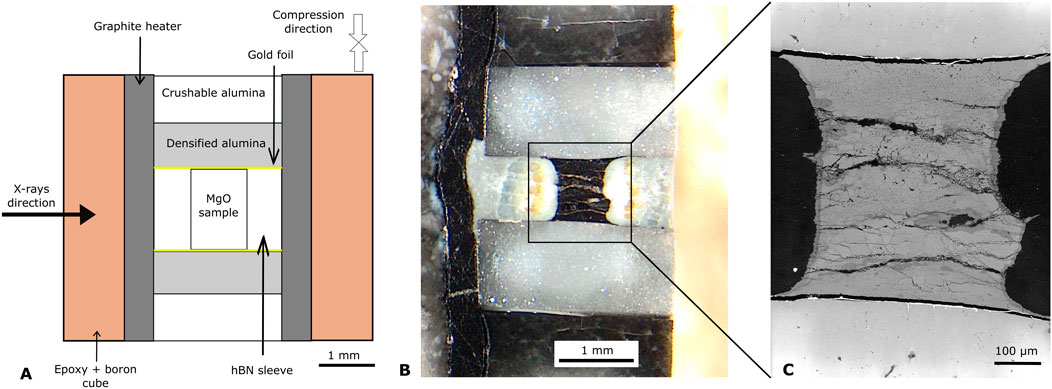
FIGURE 2. Recovered samples. (A) Sketch of the D-DIA experimental assembly; (B) Optical image of sample D2032 after recovery and preparation for electron microscopy. The right part of the assembly was cut for sample preparation; (C) SEM image of the same sample.
2.2 In situ X-Ray Measurements
During deformation, sample axial strains were measured using x-ray radiography with a large monochromatic beam (2–3 mm). Radiographs were acquired over 10 s using a YAG scintillator and a charge coupled device (CCD, resolution 1.3 μm/pixel). The sample length was defined by the shadows of the two Au foils at its top and bottom.
After each x-ray radiograph, a 2-dimensional (2D) x-ray diffraction (XRD) pattern was collected over 300–450 s with an X-ray beam tuned to a monochromatic wavelength of 0.2066 Å. The experimental layout and detector geometry were refined according to a calibration with a CeO2 polycrystal standard prior to the experiment. The XRD measurements were then processed to assess hydrostatic pressure, texture and deviatoric stress in the deforming sample using the procedure described in Lin et al. (2017).
Diffraction data was analyzed using the 2D Rietveld method as implemented in the Materials Analysis Using Diffraction (MAUD) software package (Lutterotti et al., 2014; Wenk et al., 2014) and used to extract hydrostatic unit cell parameters, lattice strain parameters for the (111), (200), and (220) diffraction lines, and texture for the MgO sample. Hydrostatic unit cell parameters were then used to calculate the hydrostatic pressure at each measured point using the hydrostatic equation of state for MgO (Speziale et al., 2001). Textures were fit using the Extented-Williams-Imhof-Matthies-Vinel (E-WIMV) method assuming axial compression around the compression axis. Stress was evaluated from the measured lattice strain parameters and elasto-visco-plastic-self-consistent calculations (Lin, 2020). The obtained stress-strain curves for all experiments are shown in Figure 3 and stress values are given in Table 1. Stress exponents have been extracted using these values of stress and strain rate, and are presented in Figure 4.
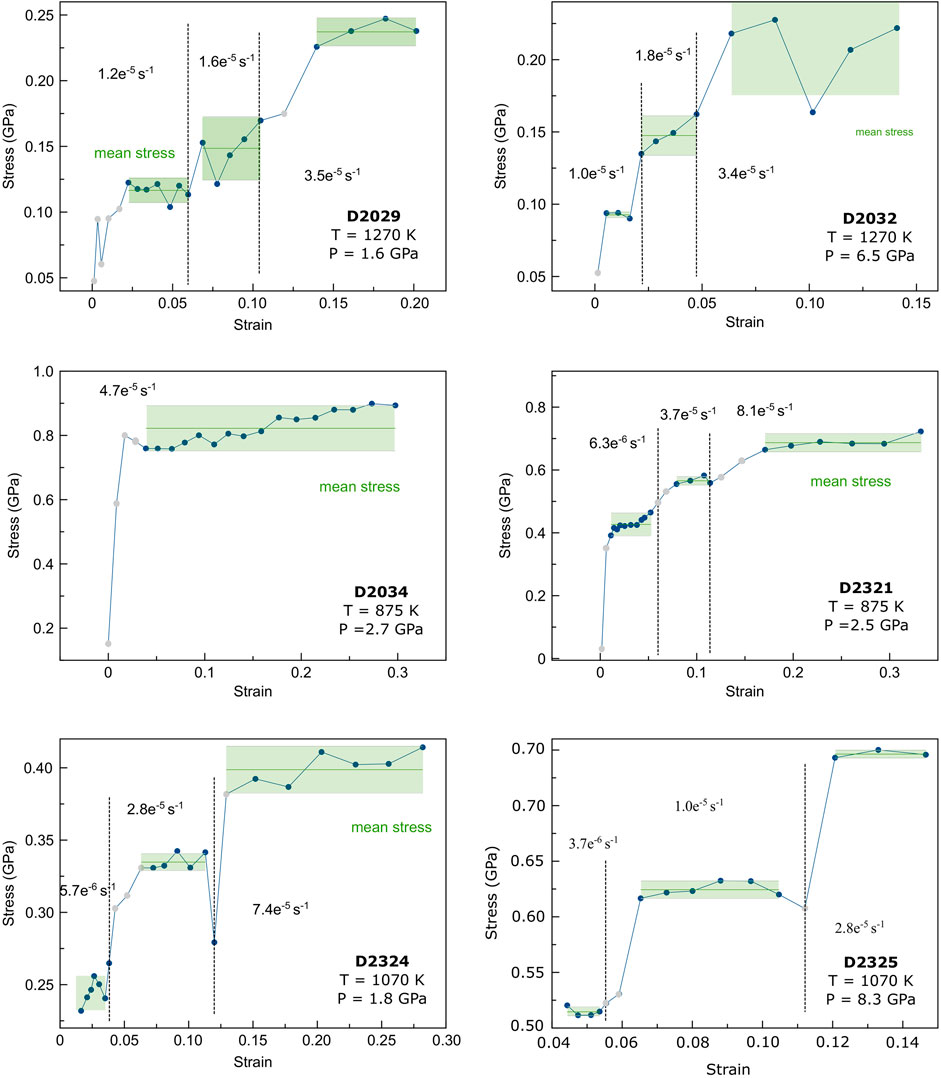
FIGURE 3. Stress vs. strain curves for all experiments. Grey data points indicate transient state before reaching steady state. Solid points are identified as “steady state” deformation and used for a computation of a mean stress (solid green line). Error bars in Table 1 were evaluated based on stress changes during steady-state, indicated by the green shading.
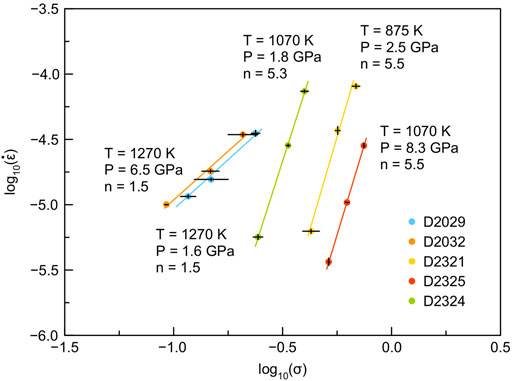
FIGURE 4. Fit of stress exponents for experiments D2029, D2032, D2321, D2324, D2325. For each experiment, the slope of the log10 (
2.3 Post-Mortem Electron Microscopy
The recovered samples were prepared for electron microscopy investigations, including Scanning Electron Microscopy (SEM), Electron Backscatter Diffraction (EBSD) and Transmission Electron Microscopy (TEM). SEM, EBSD, and TEM analysis were performed in the Lille Electron Microscopy Platform (PMEL).
The sample preparation for SEM and EBSD consisted of conventional mechanical polishing, with diamond paper from 30 to 1 μm grain size completed with diamond paste polishing down to 1/4 μm, and followed by ion polishing using a 1061 SEM Mill from Fischione Instruments. We noticed that carbon coating did not improve and sometimes decreased the quality of the EBSD indexing. Hence, unlike classical electron microscopy sample preparation, we did not coat the samples with carbon in order to avoid a pollution of the EBSD signal.
We did not measure water content of the samples. MgO is a very hydrophyllic material and the samples left in air incorporate water. In addition, we used water as a lubricant for cutting and polishing the samples. Water content measured in the post-mortem samples will then be biased by a highly possible water contamination from the sample preparation.
SEM and EBSD analysis were performed with a FEG JEOL JSM-7800F scanning electron microscope. The SEM was used in a low vacuum of 30 Pa, at a working distance of 15 mm, an acceleration voltage of 15 kV, a current between 10 and 20 nA and a spot size of few nanometers. For EBSD, the sample was tilted at 70°. The step size for EBSD map acquisitions ranged from 1 μm, for maps of the overall samples (up to 0.45 mm wide), to 0.08 μm, for specific sample characterization. EBSD data were acquired via the Aztec software from Oxford Instruments using 6–8 bands to validate an indexing, leading to mean angle deviations of 0.65–0.85.
For the TEM investigation, sample foils were cut using a focused ion beam (FIB) technique (FEI Strata DB 235 FIB-FESEM) at IEMN (Institute of Micro and Nano Electronics, Université de Lille). TEM investigations were performed in the Lille Electron Microscopy Platform with a LaB6 FEI Tecnai G220Twin microscope operating at 200 kV.
Orientation maps in the TEM were acquired with a step size of 10 nm using scanning precession electron diffraction with the ASTARTM tool from NanoMEGAS (Rauch, 2014). The TEM was set in the microbeam mode with a spot size of about 10 nm, exposure time of 40 ms and precession angle of 1°. Camera length was of 62 mm. In the ASTAR configuration, spot patterns are collected with a fast external CCD camera pointing on the TEM phosphorous screen and stored for further indexing and post-processing. As in previous studies (Nzogang et al., 2018), indexing for MgO is achieved by comparing individual patterns via cross-correlation matching techniques with ones precalculated based on an input structural model [space group
2.4 Microstructures Reconstruction
Both SEM EBSD and TEM ASTAR data were then post-processed using the open-source MTEX toolbox for MATLAB (Bachmann et al., 2010; Mainprice et al., 2015) to image the sample microstructures and extract information such as lattice preferred orientation (Figure 5), grain size distributions (Figure 6), grain shapes (Figure 7), and the intracrystalline misorientations (Figures 8, 10). The use of EBSD characterization quantities to treat ASTAR maps have already been proposed in the study of Nzogang et al. (2018).
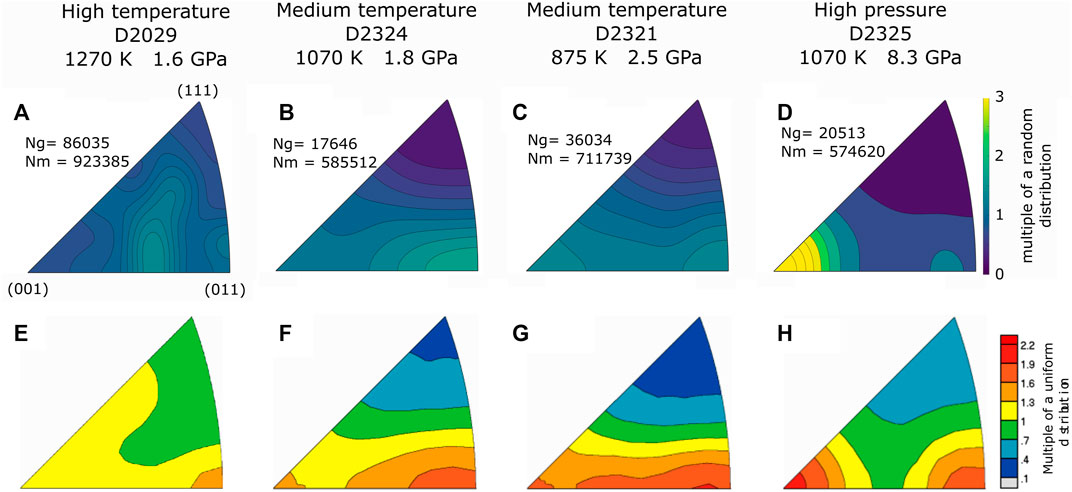
FIGURE 5. Representative inverse pole figures (IPF) of the compression direction from SEM-EBSD (A–D) and in-situ XRD measurements at the maximum strain (E–H). (A,E): texture for sample deformed at high temperature (1,270 K). (B,C,F,G): texture for samples deformed at moderate temperature (875–1,070 K). (D,H): texture for the sample deformed at 8.3 GPa and 1,070 K. Ng is the number of grains in the EBSD map from which the orientation distribution was computed and Nm is the number of measure points used to compute the IPF. Note that these textures were extracted over a broader area than that shown in Figure 8.
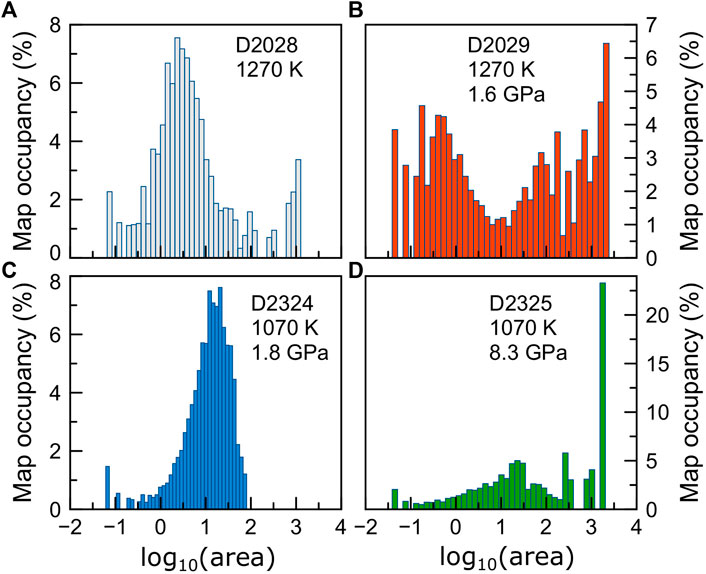
FIGURE 6. Map occupancy vs. grains area. (A) Non deformed sample annealed at high temperature. (B) Samples deformed at high temperature. (C) Samples deformed at moderate temperature. (D) Sample deformed at high pressure. Note that these distributions were extracted over a broader area than that shown in Figure 8.
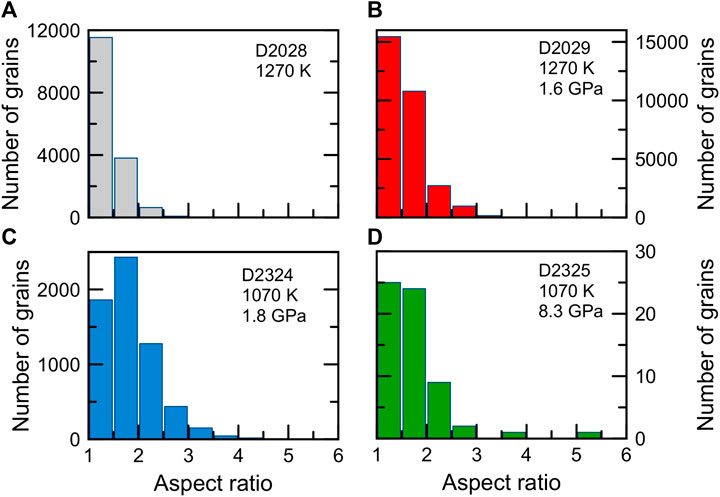
FIGURE 7. Aspect ratio distributions. (A) Non deformed sample annealed at high temperature. (B) Samples deformed at high temperature. (C) Samples deformed under moderate temperature. (D) Sample deformed at high pressure. Note that these distributions were extracted over a broader area than that shown in Figure 8.
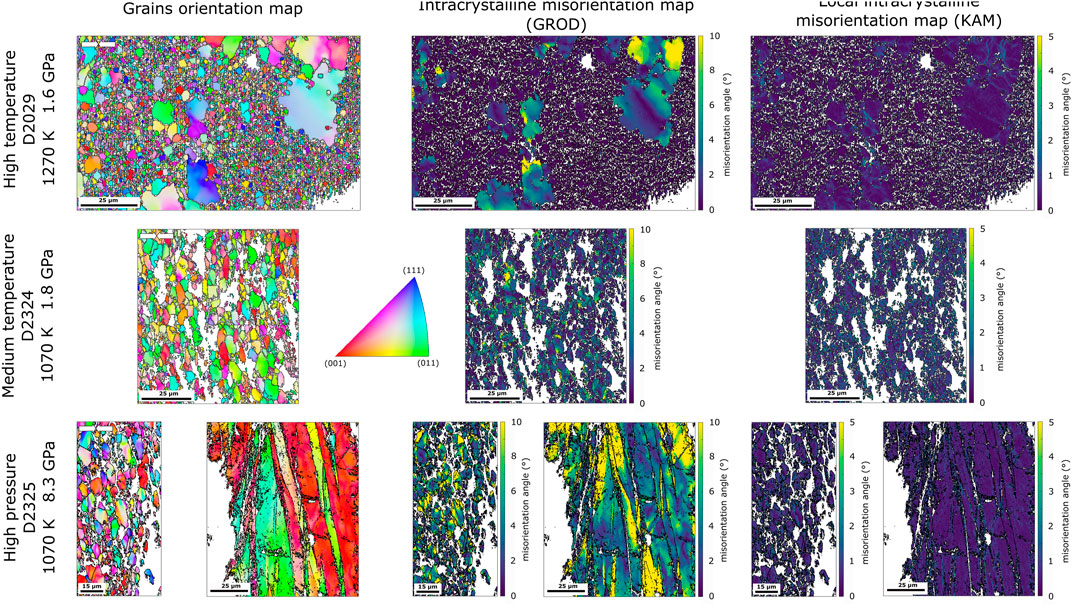
FIGURE 8. EBSD samples features. Representative orientation maps (A,D,G,H), intracrystalline misorientation (B,E,I,J), and local misorientation gradient (C, F,K,L) for samples D2029 (A,B,C), D2324 (D–F), and D2325 (G–L). Orientation maps are colored according to grain orientation relative to the compression direction (inset). Intracrystalline misorientation is represented by GROD maps showing the internal deformation in each grain relative to the mean orientation of the grain. Local misorientation gradient maps are KAM maps showing the internal deformation gradient in each grain. High resolution maps of these figures are available in the Supplementary Materials (Supplementary Figures S2–S10).
Using MTEX, we first reconstruct grains as assigned to regions of similar orientation with a threshold of 5° misorientation at grain boundaries (a 10° misorientation threshold was also tested and led to very similar results). Then, isolated non indexed pixels within grains are replaced by new pixels with an orientation in agreement with the neighboring pixels.
To compare LPO between different samples and conditions, we show inverse pole figures (IPF) of the compression direction (Figure 5). Several IPF calculations are possible, using either one average orientation per grain or one point at each measured pixel. For a proper comparison to results deduced from X-Ray data, which are not spatially resolved and sensitive to grain volumes, the EBSD IPF presented here are based on measurements at all points rather than one average orientation per grain.
Detailed microstructures are documented by 2D maps showing the grains boundaries and orientations (Figures 8, 10). Intracrystalline misorientation results are presented using two quantities: GROD and KAM. The GROD (for Grain Reference Orientation Deviation) represents the internal misorientation in a grain using the mean grain orientation as a reference. The KAM (for Kernel Average misorientation) corresponds to a local gradient of internal grain misorientation and compares the orientation in one pixel with the orientations of its first order nearest neighbours.
Finally, MTEX and custom python scripts are used to evaluate the grain size and grain elongation statistics. From the individual grain sizes estimated in MTEX, we evaluate the distribution of relative map occupancy vs. grain area (in logarithmic scale, Figure 6). From the MTEX results, we also compute histograms of the grain aspect ratios (Figure 7).
3 Results
3.1 Mechanical Data
Rheological laws are typically expressed as
where
where B is a new constant that depends on P, T and grain size. From this relation, n is the slope of the log10
The D2029 and D2032 runs, performed at 1,270 K, show stress exponents of about 1.5 while runs D2321, D2324 and D2325, performed at lower temperatures, have stress exponents ranging between 5.3 and 5.6. Based on these measurements of stress exponents, we hence anticipate a change of deformation mechanisms between 1,070 and 1,270 K. Details of these mechanisms will be discussed below with the addition of microstructural observations.
3.2 General Features of the Samples
The observation of the recovered samples using optical microscopy reveals two main features: i) macroscopic cracks that run through the overall MgO sample and ii) darker samples than the starting material (Figure 2). Cracks are only observed in the MgO samples and not in the surrounding materials. They are oriented normal to the compression direction, which correspond to disking cracks in the sample due to decompression. These are ambient temperature decompression features that are not related to the high-temperature deformation data reported in this work. The dark color is seen in MgO and not in the BN sleeve. It is probably related to carbon diffusion from the graphite heater (Freund, 1986; Lin et al., 2017), is not localized, and can be seen in all samples, including the undeformed reference specimen.
Chemical analysis using Energy Dispersive X-Ray Spectroscopy (EDS) in the SEM reveals an excess of O relative to Mg in specific locations of the samples, mostly along sample fractures formed during decompression. Sample polishing for electron microscopy involved water as lubricant. We hence assign this excess of oxygen to the polishing procedure and especially so in fractures and sites of porosity. The presence of water in the samples during experiments can then not be estimated. While we were careful during sample preparation, MgO is highly hydrophile and could have absorbed water from atmosphere during loading. Little is known about the exact effect of water on the plasticity of MgO but generally, the presence of fluid is believed to enhance diffusion mechanisms. Water may also play a role in the activity of the slip systems, as it is the case in olivine (e.g., Jung et al., 2006). Hence, if water was present in the cell assembly, the plasticity observed in our samples can be different than for completely dry samples. With our data, we cannot isolate the effect of water, if there is any, on MgO plasticity and further studies will be needed to this end.
The observed textures and microstructures indicate that the samples can be assigned to three distinct families: 1) high temperature experiments, i.e., at 1,270 K, 2) moderate temperature experiments, i.e., between 875 and 1,070 K and 3) high pressure experiment, for run D2325 performed at 1,070 K and 8.3 GPa. High temperature experiments include samples from run D2029 and D2032 at 1.6 and 6.5 GPa, respectively. Moderate temperature experiments include samples D2034, D2324, and D2321 deformed at pressure ranging from 1.8 to 2.7 GPa and temperature in the 875–1,070 K range. The rest of this section will present our observations for these three sample families. Strain vs. stress curves are presented in Figure 3. Grain sizes for the full set of samples are provided in Supplementary Figure S1.
3.3 Microstructures for Samples Deformed at 1,270 K and Pressures of 1.6 and 6.5 GPa
Two experiments were performed at high temperature, i.e. 1,270 K, at 1.6 and 6.5 GPa. The corresponding samples generally show the same features. They are characterized by IPFs that show no crystallographic preferred orientation (Figures 5A,E).
The grain size distribution is bimodal for the two high temperature samples. For the sample deformed at 1.6 GPa (D2029, Figure 6B), the small grain population shows areas ranging from the detection limit (0.03 μm2) to
The aspect ratio distribution shows a maximum between 1.0 and 1.5 and then decreases as values increase up to 3.0 (e.g., Figure 7B). The EBSD maps also show this bimodal distribution of small and large grains (e.g., Figure 8A). At this resolution, small grains seems to contain no or little internal deformation (e.g., Figures 8B,C). The mean GROD for these grains are less than 1°. Larger grains can have serrated boundaries and sometimes include smaller grains. Most of the large grains have internal deformation with a mean GROD of 3.3°. Some grains show a local gradient of orientation with a KAM of up to 2° while others show a smooth change in grain orientation (Figures 8B,C).
3.4 Microstructures for Samples Deformed Between 875 and 1,070 K and for Pressures Between 1.8 and 2.7 GPa
Exact grain sizes and aspect ratios vary for samples D2321, D2324, and D2034 but the general sample features remain similar.
EBSD maps reveal a fairly homogeneous microstructure (e.g., Figure 8D). Grains boundaries are mostly straight. The IPF of the compression direction show a LPO with maximum at ⟨110⟩, deduced both from EBSD and in-situ XRD (e.g., Figures 5B,C,F,G).
These samples show an almost normal grain size distribution. The sample presented here (D2324) has grain sizes ranging from detection limit to 74 μm2 with a maximum map occupancy by grains with areas of 10–30 μm2 (e.g., Figure 6C). The aspect ratio in these samples ranges from 1.0 to 4.0, with a normal distribution and a maximum between 1.5 and 2.0 (Figure 7C).
The mean intracrystalline misorientation measured using GROD ranges between 1.5 and 7.4° for grains in this sample family. However, locally GROD can reach values of up to 30° (Figure 8E). Local misorientation gradients (KAM) range between 0 and 2.5° (Figure 8F). KAM maps show local concentrations of misorientation gradients concentrated as lines across some grains, indicative of a concentration of deformation and probably defects at these locations.
3.5 Microstructures for the Sample Deformed at 1,070 K and 8.3 GPa
In this sample deformed at high pressure, the IPF of the compression direction shows a strong preferred orientation with a maximum at ⟨100⟩ and a secondary maximum along ⟨110⟩ (Figures 5D,H). The IPF from EBSD shows a stronger maximum at ⟨100⟩ that of in-situ XRD for which the secondary maximum at ⟨110⟩ is more visible.
EBSD maps and grain size distribution plots indicate that grains split into two distinct categories: a population of smaller grains, for which grain size distribution is a near normal distribution with a maximum map occupancy by grains with areas of
The large grains, located mostly in the center of the sample, have a lamellae shape, with straight boundaries. They show an important heterogeneous deformation, with a mean GROD of 7.5° (Figure 8J). The deformation gradient is high, with a KAM of up to 18° (Figure 8L).
Smaller grains, located mostly towards the edge of the sample, show relatively straight boundaries. The mean GROD is of 4° (e.g., Figure 8I) although some of the grains show little evidence for deformation. KAM maps show that there are strong gradients of deformation of up to 12° (e.g., Figure 8K).
3.6 Microstructures at the Grain Scale
To confirm or invalidate the dominating deformation mechanisms as well as the presence or absence of dislocations, some samples were analysed in the TEM. TEM provides access to microstructural features at the grain-scale, below that of EBSD. The TEM images show a clear difference of dislocation density between the moderate temperature and high pressure samples and the high temperature samples.
In the high temperature samples, the large grains and the small grains show the same intragranular microstructure, which consists in short and isolated dislocation segments, generally curved (Figure 9A). Dislocation density, however, is relatively low and no subgrain boundaries or other form of dislocation organization were observed.
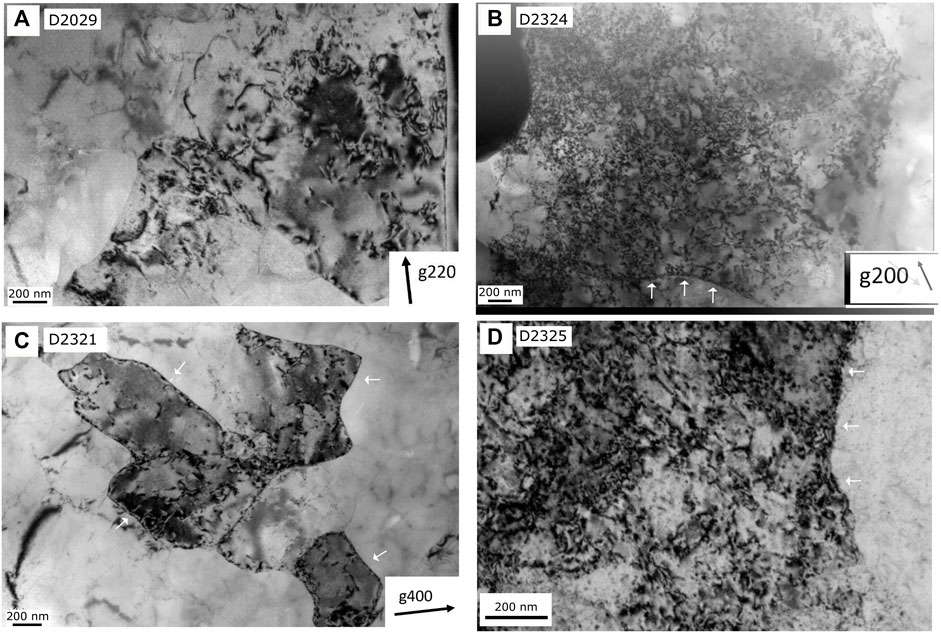
FIGURE 9. TEM images illustrating dislocation microstructures at different conditions. (A) High temperature sample deformed at 1.6 GPa and 1,270 K; (B) moderate temperature sample deformed at 1,070 K and 1.8 GPa showing a forest of dislocations; (C) moderate temperature sample deformed at 875 K and 2.5 GPa showing numerous dislocations arranged in subgrain boundaries; (D) High pressure sample deformed at 1,070 K and 8.3 GPa showing a high dislocation density, image taken in multibeam conditions. The white arrows indicate examples of subgrain boundaries. The black arrows in the bottom-right corner indicate the g-vectors used for the bright field images and their orientation.
Moderate temperature and high pressure samples are characterized by the abundance of dislocations, with a dislocations density well above that of the high temperature sample. Sample D2324 (deformed at 1,070 K and 1.8 GPa) shows forests of dislocations (Figure 9B), i.e., a multitude of small dislocations segments tangled together. Some subgrain boundaries are observed. Sample D2321 (deformed at 875 K and 2.5 GPa) also shows numerous dislocations (Figure 9C). Few are isolated while others are aligned to form well organized subgrain boundaries. The high pressure sample shows a high density of dislocations (Figure 9D). The dislocation segments are small and difficult to observe as individuals. Some align in subgrain boundaries.
3.7 High Resolution Orientation Maps
From TEM imaging it is clear that dislocations density and organization in the high temperature sample are different than in the moderate temperature and high pressure samples. To characterize the microstructures at a better resolution than that achieved in the SEM-EBSD maps, we performed orientation mapping of our samples in the TEM. Results are presented in Figure 10 for two characteristic samples, a high temperature sample (D2029) and a moderate temperature sample (D2321), with the idea to compare their microstructures at the TEM scale. The link between the ASTAR maps and the classical TEM images is illustrated in Figure 11, and support the ability of the KAM lines to detect zones of concentration of dislocations.
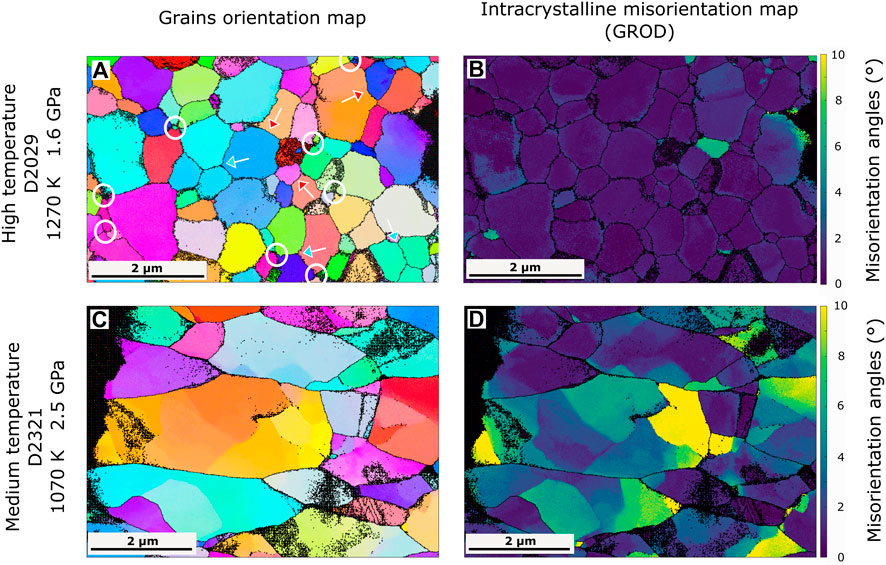
FIGURE 10. Samples features at the TEM scale. ASTAR maps for high (A,B) and moderate (C,D) temperature samples, showing the orientations of the grains (A,C) and the intracrystalline misorientation (B,D). Orientation maps are colored according to grain orientation relative to the compression direction (see inset in Figure 8). Intracrystalline misorientation is represented by GROD maps showing the internal deformation in each grain relative to the mean orientation of the grain. Corresponding local misorientation gradient maps (KAM maps showing the internal deformation gradient in each grain), are shown in Figure 11. In the high temperature sample orientation map, blue-filled arrows indicate examples of triple junctions at equilibrium, red-filled arrows indicate examples of curved grain boundaries and white rings indicate examples of quadruple junctions between grains. Full size ASTAR maps are shown in Supplementary Figures S11–S16.
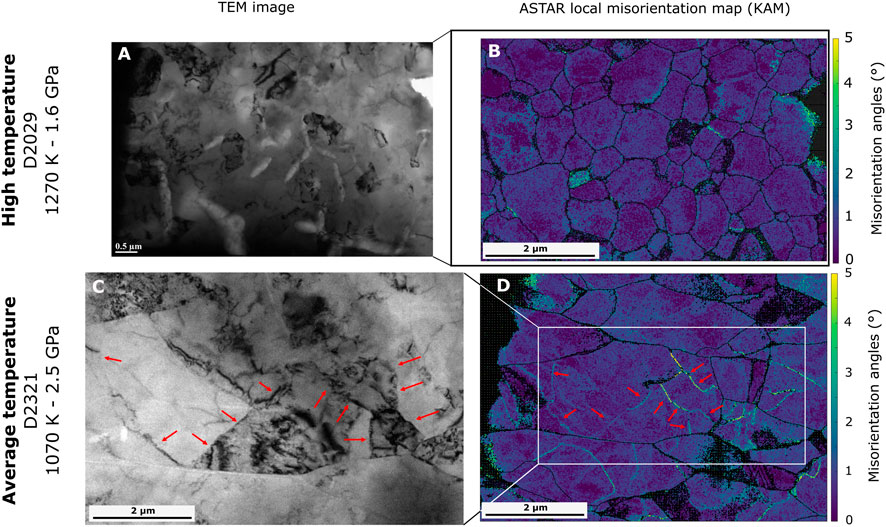
FIGURE 11. Comparison of misorientation maps acquired in the TEM (B,D) with classical TEM images (A,C) of the same sample region. Panels (A,B) illustrate the same section of sample D2029 using classical TEM imaging and ASTAR local misorientation gradients (KAM) mapping, respectively. Panels (C,D) illustrate the same area of sample D2321, by classical TEM imaging and ASTAR local misorientation gradients (KAM) mapping, respectively. Red arrows indicate accumulation of dislocations in the classical TEM image and the corresponding KAM lines of the TEM orientation map. Full size ASTAR maps are shown in Supplementary Figures S13, S16.
The high temperature sample shows grains with size between 0.5 and 2 μm and no visible preferred orientation (Figure 10A). These grains have rather equiaxed shapes and smoothly curved boundaries permitting triple junctions at equilibrium. However, some quadruple junctions between grains can be observed in the ASTAR map, as indicated by the white circles in Figure 10. The intracrystalline misorientation map indicates deformation inside the grains of generally less than 2° (Figure 10B). Accordingly, the KAM map rarely show local misorientation gradients (Figure 10C).
The microstructure in the moderate temperature sample is completely different. In this sample the grains vary sizes from less than 1 μm to 4–5 μm (Figure 10D). The preferred orientation is not obvious because of the low number of grains in the map, but an elongation of these grains normal to the compression direction is clear. The grain boundaries are mostly straight and triple junctions are generally not at equilibrium. The high internal deformation of the grains is already observable on the orientation map and is really well shown by the GROD map. Most of the grains appears divided into slightly misoriented domains with GROD up to 10° (Figure 10E). Moreover, the KAM map indicates that these intracrystalline domains are delimited by misorientation gradient lines (Figure 10F). Comparing with the microstructure observed in conventional TEM (Figure 11), we can say with confidence that these misorientation gradient lines are in fact zones of accumulation of dislocations, i.e., subgrain boundaries.
4 Discussion
4.1 Deformation Mechanisms From Mechanical Behavior
The stress exponent extracted from the mechanical data is indicative of the dominant deformation mechanism operating in a sample. Generally, it is assumed that n = 1 for a true diffusion creep, and n ≥ 3 for dislocation creep (Poirier, 1976, 1985).
In experiments at 1,270 K, the stress exponent is 1.5, indicative of a deformation regime controlled by diffusion. At 1,070 and 875 K, the measured stress exponents of 5.3–5.6 indicate dislocation-dominated plasticity. This change in dominant deformation mechanism between 1,070 and 1,270 K is also observed through the samples post-mortem microstructures. Details of these mechanisms will be further discussed below based on microstructural observations.
4.2 Effect of Stress on MgO Plasticity
Stress plays a critical role in the plastic deformation and the development of microstructures (Karato, 2008), as highlighted by the vast literature on olivine plasticity, for instance in Jung et al. (2006) and Hirth and Kohlstedt (2015). Questions hence arise whether our microstructural observations should be interpreted in terms of differences in pressure and temperature or stress.
Experiments D2321 and D2325, for instance, are performed at similar stress conditions, i.e. between 0.43 and 0.75 GPa. The measured microstructures, however, are different with an IPF maximum at ⟨110⟩ for D2321 and at ⟨100⟩ for D2325 (Figure 5). We can hence safely assign this change of microstructures to an effect of pressure and/or temperature and not stress.
Our experiments are performed over a limited range of stress and strain rates and do not allow us to precisely separate the relative effects of stress, pressure, or temperature on MgO plasticity. We hence project our observations in terms of pressure and temperature only. The effect of stress at each pressure and temperature adds an additional parameter that will have to be investigated in further studies. As highlighted by results on runs D2321 and D2325, however, stress can not be the sole explanation for conflicting results between experiments.
4.3 Microstructures of Polycrystalline MgO Deformed at High Pressure and High Temperature
Grain size distribution depends on the deformation conditions. For samples deformed at 1,270 K, the majority of the grains are small with sizes between 0.03 and 10 μm2. Some larger grains are present as in the reference sample.
In samples deformed at 1,070 K and below, the maximum map occupancy shifts to 10–30 μm2, instead of around 3 μm2 for the undeformed sample. This is indicative of some grain growth activity during deformation. An important difference between moderate temperature samples and high pressure sample is the large grain populations. In the moderate temperature samples, grains with areas larger than 74 μm2 are absent, while in the high pressure sample, a population of large grains is present. The presence of these large grains is unexpected and they are specifically located at the center of the sample. Temperature in the D-DIA experiment is provided by a graphite cylinder and we suspect that temperature gradients may have been present in this assembly. Indeed, Raterron et al. (2013) indicate that temperature gradients in D-DIA cell assembly can reach 155 K/mm. In addition, the unimodal shape of the grain size distribution indicates that grain growth is normal, in opposition to the high temperature samples. The difference in annealing time before deformation do not seems to significantly affect the sample deformation, as grains after deformation in samples annealed for the same duration have quite different sizes (e.g., D2028 vs. D2032 vs. D2321 vs. D2325) while samples annealed for different duration can have similar grain sizes after deformation (e.g., D2029 vs. D2032).
Samples deformed at 1,270 K show little change in grain shape with a grain aspect ratio distribution similar to that of the starting material (Figure 7). This feature is highlighted by the ASTAR map that shows equiaxed grains at equilibrium (Figure 10). However, EBSD maps show that large grains have serrated boundaries and include smaller grains (Figure 8). For other samples, the grain aspect ratio evolves with deformation, with grains becoming more elongated perpendicular to the compression direction (Figures 7, 8, 10). Larger aspect ratios reach 5.5 and are observed in the sample deformed at the highest pressure. Grain elongation in MgO deformed at 1,070 and 875 K can be related to results of self-consistent calculations on both MgO and NaCl deformed in dislocation-controlled regimes (Wenk et al., 1989, 2009; Lin et al., 2017). Slip systems in NaCl-structured minerals are highly symmetric and the modeling of the deformation of such material in dislocation creep using self-consistent models induces a change in grain shape. Accounting for this change in grain shape is critical for a successful self-consistent modeling of the experimental textures (Lin et al., 2017).
Deformation conditions also affect intragranular misorientations. Samples deformed at 1,270 K are fairly relaxed whereas samples deformed at lower temperatures show high internal deformations (Figure 8). The TEM analysis confirm this difference. At high temperature, sample imaging shows few isolated dislocations (Figure 9), and ASTAR orientation map show mostly undeformed grains (Figure 10). At moderate temperature the sample grains contain a higher dislocations density and dislocations organize in subgrain boundaries. Orientation map for a moderate temperature sample shows high intragranular misorientation corresponding to these subgrains (Figure 10).
Overall, microstructural observations show a clear difference between samples deformed at 1,270 K and samples deformed at lower temperature, which is consistent with the change in stress exponent discussed in Section 4.1 and indicates a deformation mechanism controlled by dislocations at 875–1,070 K and a deformation mechanism not controlled by dislocations at 1,270 K.
4.4 Deformation Mechanism at 1,270 K
Both mechanical data and microstructures of our samples deformed at 1,270 K show a different behavior than that of the samples deformed at lower temperatures, with a dominant deformation mechanism that is controlled by diffusion rather than by dislocations.
Our high temperature samples are characterized by a microstructure similar to that of the non-deformed annealed sample showing a majority of small equiaxed grains with a few large grains, no LPO, and the absence of intracrystalline deformation. In addition, triple junctions at equilibrium and curved grain boundaries are generally observed. Few grains, however, show quadruple junctions in these samples.
Quadruple junctions associated to equiaxed grains is a characteristic microstructure of GBS as defined by Ashby and Verrall (1973) and is a key in the identification of this deformation mechanism (Maruyama and Hiraga, 2017). In comparison, dislocation creep is typically associated with grain elongation coherent with the macroscopic strain and intragranular deformation, while diffusion creep can produce quadruple junctions, but associated to grains elongated in the tensile axis (Maruyama and Hiraga, 2017).
Hence, the microstructures observed in our post-mortem samples are consistent with a deformation dominated by GBS, and the stress exponent of 1.5 given by the in-situ analysis point toward a diffusion-accommodated boundary sliding. Such mechanism may allow for large deformation and lead to a superplastic behavior. In addition, the few curved dislocations observed by TEM in the grains indicate that dislocations have moved and interacted. This observation supports an activity of the dislocations but the microstructure indicates dislocation creep is not the dominant mechanism.
There are a few larger grains in these samples. They can result from abnormal grain growth during the sintering (Terwilliger et al., 1970) but the small number of such grains in the reference sample tend to invalidate this hypothesis. Abnormal grain growth can also results from the GBS, either due to movement of grain boundaries caused by an excess of vacancies near sliding boundaries created by deformation (Clark and Alden, 1973) or by grain boundary migration to recover the damage created at triple junctions by the grain sliding (Wilkinson and Cáceres, 1984). The stress exponent of 1.5, however, indicates a deformation controlled by diffusion, which is more efficient in the smaller grains. We hence believe that these large grains do not contribute significantly to the deformation of the sample.
GBS was already reported for MgO. In particular, grain boundary sliding have been reported as a dominant deformation mechanism in polycrystalline MgO with grains size below 10 μm at 1,500 K and ambient pressure (Dokko and Pask, 1979), and grain boundary diffusion with occurrences of GBS at large strains (44%) has been observed in fine grained (0.1 μm) polycrystalline MgO at ambient pressure and 1,173–1,423 K (Crampon and Escaig, 1980). Copley and Pask (1965) also observed grain boundaries dominated deformation for polycrystalline MgO samples with grain sizes up to 15 μm in the 1,300–1,700 K range and at room pressure. At larger grain sizes, however, between 18 and 60 μm, Terwilliger et al. (1970) reported non-viscous (dislocations) mechanisms in MgO at temperatures of 1,300–1,700 K, associated with stress exponents of 2.38 and 3.63. Similarly, Langdon and Pask (1970) proposed dislocation-controlled deformation in polycrystalline MgO at 1,500 K, ambient pressure and a grain size between 12 and 25 μm. The study of Stretton et al. (2001) also report dislocation creep as the dominant deformation mechanism in ferropericlase samples deformed at temperatures of 1,200–1,400 K and 300 MPa, in contradiction with our results indicating GBS at 1,270 K. Their grain size, however, are on the order of 40 μm, an order of magnitude larger than reported here. The transition between GBS and power-law creep is known to be grain size dependent and, based on our results and those of Dokko and Pask (1979), Terwilliger et al. (1970) and Stretton et al. (2001), occurs for grain sizes between
Using the two deformation runs we performed at 1,270 K, and that results in plastic deformation of MgO by GBS, we can estimate an activation volume for this deformation mechanism. Eq. 1 can be expressed as
where B = Ad−m. Assuming that A, E*, d−m and T remain constant for both runs, the activation volume is then slope of the
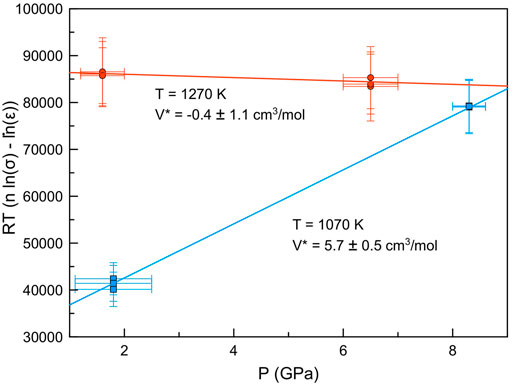
FIGURE 12. Activation volume of polycrystalline MgO in the diffusion regime at 1,270 K (Runs D2029 and D2032, red circles) and the dislocations-dominated regime at 1,070 K (Runs D2324 and D2325, blue squares). Errors bars are ±1σ uncertainties deduced from the experimental results. Reported errors on the activation volume are 1σ uncertainties deduced from a Monte Carlos method.
4.5 Slip Systems for MgO at High Pressure and High Temperature
The most characteristic feature of dislocation controlled mechanisms is the presence of LPO. High pressure and moderate temperature samples do show significant LPO and stress exponents of about 5.5, and are thus expected to deform with dislocation motion as the dominant deformation mechanism.
The observed LPO can be compared with results of self-consistent calculations (Lin et al., 2017), including the effects of the ⟨110⟩{110}, ⟨110⟩{100}, ⟨110⟩{111} slip systems and changes in grain shape (Wenk et al., 1989). In some cases, the activation of secondary slip systems or changes in grain shape are required to fulfill the Von-Mises compatibility criterion. Nevertheless, we will focus here on reporting the most-active slip system to characterize each measured texture. LPO are then assigned to a combination of most-active slip systems. The moderate temperature samples show a maximum at ⟨110⟩ in the IPF of the compression direction (Figure 5B). This is consistent with a comparable activity of the ⟨110⟩{110} and ⟨110⟩{100} slip systems. The high pressure sample shows a maximum at ⟨110⟩ in the IPF of the compression direction (Figure 5C), consistent with a dominant activity of the ⟨110⟩{110} slip system. At the temperatures investigated here (875 and 1,070 K), we hence observe a pressure-induced transition in the dominant slip system activity from a comparable activity of ⟨110⟩{110} and ⟨110⟩{100} at lower pressure (i.e., below 5 GPa) to a dominant activity of ⟨110⟩{110} slip system above 5 GPa (Figure 13B).
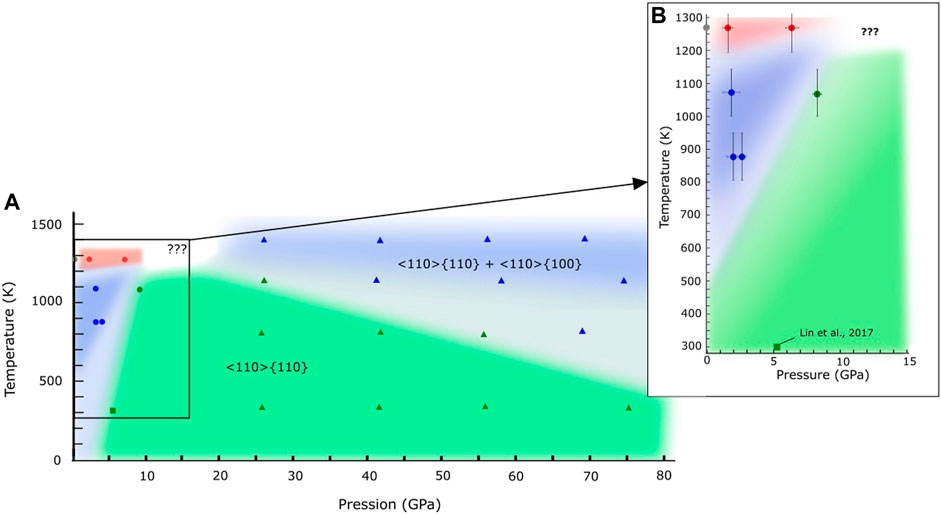
FIGURE 13. Projection of a deformation map based on microstructural observations for MgO in pressure and temperature space (for strain rates between 10–6 and 10–5 s−1 and μm grain sizes). Red markers indicate deformation conditions with dominant grain boundary sliding. Green markers and blue markers correspond to deformation conditions at which textures are consistent with dislocation glide with a dominant activity of ⟨110⟩{110} and comparable activity of ⟨110⟩{110} and ⟨110⟩{100} slip systems, respectively. The grey marker correspond to the reference undeformed sample. Red, blue, and green area are guides to eye highlighting the different domains for MgO plastic behavior. Circles are data from this study, the square is data from Lin et al. (2017), triangles are data from Immoor et al. (2018). (A) Summary of deformation mechanisms observed in this study and in studies of Lin et al. (2017) and Immoor et al. (2018). (B) Focus on pressures below 15 GPa.
Observations in polycrystals at high pressure and 300 K lead to a dominant activity of ⟨110⟩{110} slip system in MgO up to 50 GPa (Merkel et al., 2002; Lin et al., 2017). The increase activity of the ⟨110⟩{100} slip with increasing temperature was previously inferred based on deformation experiments at 300 MPa on (Mg,Fe)O (Stretton et al., 2001; Long et al., 2006). Recently, a transition between a dominant activity of ⟨110⟩{110} and a comparable activity of ⟨110⟩{110} and ⟨110⟩{100} was also inferred at higher pressure (i.e., above 30 GPa) (Immoor et al., 2018).
Finally, we can use Eq. 3 and data obtained at 1,070 K to extract the apparent activation volume for the dislocation-controlled mechanism. Here, we need to assume that the pressure-induce change in dominant slip systems activity does not strongly affects the activation volume, which will have to be confirmed in future studies. We use the results of experiments D2324 and D2325 performed at 1,070 K and fit an activation volume of 5.7 ± 0.5 cm3/mol (Figure 12). This estimated activation volume can be compared to that of the literature for dislocation creep in MgO. While our value lies in the range of 4–7 cm3/mol given by Weidner et al. (1994), it is significantly larger that the report of 2.4 cm3/mol in Mei et al. (2008). Note, however, that Mei et al. (2008) assumed a stress exponent n of 3, which is inconsistent with n = 5.3–5.6 deduced from the present measurement.
4.6 Plasticity of MgO at High Pressure and High Temperature
Based on experimental evidences, the following behavior can be deduced regarding the plasticity of μm grain size polycrystalline MgO and (Mg,Fe)O at high pressure and high temperature (Figure 13):
• At low temperature and below 70 GPa, the observed compression textures are consistent with a dominant activity of the ⟨110⟩{110} slip system.
• At low pressure (i.e. between 4.7 and 8.3 GPa), a transition to a comparable activity of ⟨110⟩{110} and ⟨110⟩{100} is observed at
• At high pressure (i.e., above 20 GPa), the transition temperature between a dominant activity of ⟨110⟩{110} slip and a comparable activity of ⟨110⟩{110} and ⟨110⟩{100} slip decreases with pressure, although this remains to be clarified (Immoor et al., 2018; Lin et al., 2019).
• Finally, for temperatures of 1,270 K and pressures up to 6.5 GPa, the deformed samples show no LPO and a stress exponent of 1.5, consistent with a change of deformation mechanism to one controlled by diffusion and identified as grain boundary sliding.
Our result in the dislocation-dominated regime is qualitatively consistent with the most recent modeling of the effects of pressure and temperature on the critical shear stress in single crystal MgO (Amodeo et al., 2012), with a dominant activity of ⟨110⟩{110} slip at low temperature and a transition towards comparable activity of ⟨110⟩{110} and ⟨110⟩{100} slip at both higher temperatures and pressures. There are differences, however.
First, the temperature of transition between ⟨110⟩{110} and combined ⟨110⟩{110} and ⟨110⟩{100} slip at room pressure is at
Second, numerical models predict a sharp transition from dominant activity of ⟨110⟩{110} slip and comparable activity of ⟨110⟩{110} and ⟨110⟩{100} slip starting at 40 GPa followed by a dominant activity of ⟨110⟩{100} slip above 60 GPa. In the calculations, this transition is not temperature dependent. In experiments on polycrystals in the diamond anvil cell (DAC), compression textures do indicate an increase activity of ⟨110⟩{100} slip at combined high pressures and temperatures (Immoor et al., 2018) but such transition is not clearly observed at 300 K (Lin et al., 2019). There are issues on interpreting a change of deformation mechanism with pressure based on compression in diamond anvil cells as the sample properties are heavily affected by the sample compression history (Amodeo et al., 2016). There may be also, differences between single-crystal and polycrystal behavior. This issue will have to be resolved in future studies.
Finally, experiments indicate that, at low pressure and at 1,270 K, the plastic deformation mechanism of μm grain size polycrystalline MgO is grain boundary sliding accommodated by diffusion, a mechanism that was overlooked in previous studies. The transition temperature between grain boundary sliding and dislocation creep is dependent on grain sizes and is not observed up to 1,400 K for 10−50 μm grain sizes (Stretton et al., 2001).
4.7 Implications for the Earth’s Mantle
Ferropericlase is the second abundant mineral in the Earth’s lower mantle. The properties of the lower mantle, such as creep rate or seismic anisotropy, will hence be influenced by the deformation mechanism in this mineral. Based on Figure 13, the dominant deformation mechanism at 1,270 K at low pressure and for μm grains is grain boundary sliding accommodated by diffusion. Such mechanism does not significantly affect microstructures and ferropericlase could hence accommodate a large amount of strain, leading to a superplastic behavior. Hence if such mechanism is in fact dominant in the lower mantle, large amount of strain could be accommodated by ferropericlase without any generation of LPO. This result is consistent with the lack of seismic anisotropy in most of the lower mantle (Meade et al., 1995).
The transition from a potential superplastic regime to dislocation-controlled plasticity in ferropericlase, however, depends on pressure, temperature, strain rates and grain size. Temperatures in the Earth’s lower mantle range from 1,900 to 2,600 K in the 24–135 GPa pressure range. Our measurements show that such temperatures could favor superplasticity in (Mg,Fe)O at the micron grain size. Little is known about grain size in the lower mantle, however, with studies reporting
For regions where grain sizes are too large for diffusion to be efficient, deformation will be dominated by dislocation-based plasticity. In this case, Figure 13 indicates that dislocation slip on both the ⟨110⟩{110} and ⟨110⟩{100} slip systems will be dominant. Questions remain regarding a dominant pure ⟨110⟩{100} slip above 60 GPa as predicted by numerical models (Amodeo et al., 2012) which has not yet been observed experimentally and could occur in the deepest portions of the Earth’s mantle.
5 Conclusion
This paper present experimental results on deformed periclase polycrystals in the Deformation-DIA press at pressures and temperatures ranging from 1.6 to 8.3 GPa and 875–1,270 K and for micrometer grain sizes. For each deformation condition, the samples are recovered and analyzed using electron microscopy. The results indicate that at temperatures of 1,270 K the dominant deformation mechanism is grain boundary sliding accommodated by diffusion (Diff-GBS), which could lead to a superplastic behavior at high strain. At lower temperatures, dislocations-based plasticity is the dominant mechanism, primarily on the ⟨110⟩{110} slip system at low temperature and/or high pressure, with a transition to combined activity of the ⟨110⟩{110} and ⟨110⟩{100} slip systems toward the higher temperatures.
In the Diff-GBS regime, the samples show small equiaxed grains with no preferred orientation, little or no intracrystalline deformation and presence of quadruple junctions between some grains. In the dislocation-based plasticity regime, samples show larger, elongated grains with a significant LPO and an important intracrystalline misorentation. Local misorientation gradients are concentrated as lines across some grains, indicative of localized deformation and high defects density at these locations, as confirmed by TEM.
Our results in the 1.6–8.3 GPa pressure range confirm the predictions of Amodeo et al. (2012) and previous observations of Stretton et al. (2001) for the transition between dominant activity of ⟨110⟩{110} slip and comparable activity of ⟨110⟩{110}-⟨110⟩{100} slip at high temperature albeit with a transition between domains 500–700 K lower in the experiments than in the numerical model. The effect of slip on ⟨110⟩{111} as inferred in previous experiments (Yamazaki and Karato, 2002; Heidelbach et al., 2003) is not observed on the LPO. In addition, the transition to a pure ⟨110⟩{100} slip above 60 GPa predicted by numerical model remains to be observed in experiments. Recent DAC experiments at 300 K find an increasing activity of ⟨110⟩{110} at
In addition, apparent activation volume have been estimated for each deformation mechanism using the pressure dependence of the flow law. For the dislocation-based deformation mechanism an activation volume of 5.7 ± 0.5 cm3/mol had been extracted, consistent with values of Weidner et al. (2004) but larger than the activation volume found by Mei et al. (2008). In the GBS deformation regime, the apparent activation volume is of −0.4 ± 1.1 cm3/mol, which is significantly smaller than the activation volumes found by Riet et al. (2021) for diffusion in MgO, but close to the values given by Yamazaki and Karato (2001) and Van Orman et al. (2003) in single crystals. Our computations of the activation volume rely on several assumptions regarding the effect of grain size, change of deformation mechanism with pressure and so should be treated with caution. Nevertheless, they are consistent with values from the literature. A detailed study of the effects of the grain size variation, pressure variation or change in dislocation mechanism on the activation volume would help in that regard.
Our experiments predict Diff-GBS as dominant deformation mechanism at 1,270 K. Such mechanism, however, will not be efficient at larger grain sizes (Terwilliger et al., 1970; Stretton et al., 2001). Grain size variations in the lower mantle, hence, will change the dominant deformation mechanism in (Mg,Fe)O in the Earth’s mantle. The absence of anisotropy in the lower mantle, however, is more consistent with Diff-GBS deformation rather than deformation by dislocation creep.
Finally, the role of time scales on plastic deformation in the Earth’s mantle is difficult to evaluate based on our experimental data. Here, numerical models of the relative efficiency of diffusion vs. that of dislocation creep and the grain growth in (Mg,Fe)O on large time scales would be of great interest.
Data Availability Statement
Datasets for this research include raw EBSD maps for samples D2028, D2029, D2032, D2034, D2321, D2324 and D2325, and TEM images for Figure 9. They are available on the permanent Zenodo repository with the DOI: 10.5281/zenodo.4073384, under a Creative common Licence.
Author Contributions
LM and SM conceived the project. FL, LM, SM, and EL conducted the experiments at APS. FL processed and interpreted the rheology data, with assistance from LM and SM. EL, AD, AF, and DJ conducted the microscopy characterization at the Chevreul Institute. EL processed the microscopy data, with assistance from AD, AF, DJ, and SM. EL interpreted the microscopy data with assistance from SM, DJ, AD, and FB. EL wrote the paper with assistance from SM and corrections from all authors.
Funding
The study was financed the bilateral ANR-DFG TIMEleSS project (ANR-17-CE31-0025; TH 1530/18-1; SA 2585/3-1; SP1216/8-1) and the bilateral PROCOPE-PPP program (PHC 40555PC; DAAD 57390184). The authors also acknowledge the Chevreul Institute and the Lille electron microscopy platform in the development of this work through the ARCHI-CM project supported by the “Ministère de l’Enseignement Supérieur de la Recherche et de l’Innovation,” the region “Hauts-de-France,” the ERDF program of the European Union and the “Métropole Européenne de Lille.” LM acknowledges support from the National Science Foundation through EAR-1654687 and the US Department of Energy National Nuclear Security Administration through the Chicago-DOE Alliance Center (DE- NA0003975). Parts of this research were performed at GeoSoilEnviroCARS (The University of Chicago, Sector 13), Advanced Photon Source (APS), Argonne National Laboratory. GeoSoilEnviroCARS is supported by the National Science Foundation – Earth Sciences (EAR – 1634415) and Department of Energy- GeoSciences (DE-FG02-94ER14466). This research used resources of the Advanced Photon Source, a U.S. Department of Energy (DOE) Office of Science User Facility operated for the DOE Office of Science by Argonne National Laboratory under Contract No. DE-AC02-06CH11357.
Conflict of Interest
The authors declare that the research was conducted in the absence of any commercial or financial relationships that could be construed as a potential conflict of interest.
Publisher’s Note
All claims expressed in this article are solely those of the authors and do not necessarily represent those of their affiliated organizations, or those of the publisher, the editors, and the reviewers. Any product that may be evaluated in this article, or claim that may be made by its manufacturer, is not guaranteed or endorsed by the publisher.
Acknowledgments
The authors wish to thank N. Hilairet for assistance with sample preparation and Y. Wang for assistance during the synchrotron experiments. We also wish to thank D. Troadec, IEMN, CNRS, Université de Lille, for the focused ion beam sample preparation and S. Demouchy for helpfull discussion.
Supplementary Material
The Supplementary Material for this article can be found online at: https://www.frontiersin.org/articles/10.3389/feart.2022.849777/full#supplementary-material
References
Amodeo, J., Carrez, P., and Cordier, P. (2012). Modelling the Effect of Pressure on the Critical Shear Stress of MgO Single Crystals. Philosophical Mag. 92, 1523–1541. doi:10.1080/14786435.2011.652689
Amodeo, J., Dancette, S., and Delannay, L. (2016). Atomistically-informed crystal Plasticity in MgO Polycrystals under Pressure. Int. J. Plasticity 82, 177–191. doi:10.1016/j.ijplas.2016.03.004
Amodeo, J., Merkel, S., Tromas, C., Carrez, P., Korte-Kerzel, S., Cordier, P., et al. (2018). Dislocations and Plastic Deformation in MgO Crystals: A Review. Crystals 8, 240. doi:10.3390/cryst8060240
Ashby, M. F., and Verrall, R. A. (1973). Diffusion-accommodated Flow and Superplasticity. Acta Metallurgica 21, 149–163. doi:10.1016/0001-6160(73)90057-6
Bachmann, F., Hielscher, R., and Schaeben, H. (2010). Texture Analysis with MTEX - Free and Open Source Software Toolbox. Ssp 160, 63–68. doi:10.4028/www.scientific.net/SSP10.4028/www.scientific.net/ssp.160.63
Clark, M., and Alden, T. (1973). Deformation Enhanced Grain Growth in a Superplastic Sn-1% Bi alloy. Acta Metallurgica 21, 1195–1206. doi:10.1016/0001-6160(73)90160-0
Copley, S. M., and Pask, J. A. (1965). Deformation of Polycrystalline MgO at Elevated Temperatures. J. Am. Ceram. Soc. 48, 636–642. doi:10.1111/j.1151-2916.1965.tb14695.x
Cordier, P., Amodeo, J., and Carrez, P. (2012). Modelling the Rheology of MgO under Earth's Mantle Pressure, Temperature and Strain Rates. Nature 481, 177–180. doi:10.1038/nature10687
Crampon, J., and Escaig, B. (1980). Mechanical Properties of fine-grained Magnesium Oxide at Large Compressive Strains. J. Am. Ceram. Soc. 63, 680–686. doi:10.1111/j.1151-2916.1980.tb09860.x
Dokko, P. C., and Pask, J. A. (1979). High-temperature Stress-Strain Behavior of MgO in Compression. J. Am. Ceram. Soc. 62, 433–439. doi:10.1111/j.1151-2916.1979.tb19099.x
Dong, Q., Gao, C., Ding, Y., Wang, F., Wen, B., Zhang, S., et al. (2012). A Polycarbonate/magnesium Oxide Nanocomposite with High Flame Retardancy. J. Appl. Polym. Sci. 123, 1085–1093. doi:10.1002/app.34574
Freund, F. (1986). Solute Carbon and Carbon Segregation in Magnesium Oxide Single Crystals ? A Secondary Ion Mass Spectrometry Study. Phys. Chem. Minerals 13, 262–276. doi:10.1007/BF00308278
Girard, J., Amulele, G., Farla, R., Mohiuddin, A., and Karato, S.-I. (2016). Shear Deformation of Bridgmanite and Magnesiowüstite Aggregates at Lower Mantle Conditions. Science 351, 144–147. doi:10.1126/science.aad3113
Girard, J., Chen, J., and Raterron, P. (2012). Deformation of Periclase Single Crystals at High Pressure and Temperature: Quantification of the Effect of Pressure on Slip-System Activities. J. Appl. Phys. 111, 112607. doi:10.1063/1.4726200
Heidelbach, F., Stretton, I., Langenhorst, F., and Mackwell, S. (2003). Fabric Evolution during High Shear Strain Deformation of Magnesiowüstite (Mg0.8Fe0.2O). J. Geophys. Res. 108. doi:10.1029/2001JB001632
Hirth, G., and Kohlstedt, D. L. (2015). The Stress Dependence of Olivine Creep Rate: Implications for Extrapolation of Lab Data and Interpretation of Recrystallized Grain Size. Earth Planet. Sci. Lett. 418, 20–26. doi:10.1016/j.epsl.2015.02.013
Immoor, J., Marquardt, H., Miyagi, L., Lin, F., Speziale, S., Merkel, S., et al. (2018). Evidence for {100} Slip in Ferropericlase in Earth's Lower Mantle from High-Pressure/high-Temperature Experiments. Earth Planet. Sci. Lett. 489, 251–257. doi:10.1016/j.epsl.2018.02.045
Ita, J., and Cohen, R. E. (1997). Effects of Pressure on Diffusion and Vacancy Formation in MgO from Nonempirical Free-Energy Integrations. Phys. Rev. Lett. 79, 3198–3201. doi:10.1103/PhysRevLett.79.3198
Ito, E., and Sato, H. (1991). Aseismicity in the Lower Mantle by Superplasticity of the Descending Slab. Nature 351, 140–141. doi:10.1038/351140a0
Jung, H., Katayama, I., Jiang, Z., Hiraga, T., and Karato, S. (2006). Effect of Water and Stress on the Lattice-Preferred Orientation of Olivine. Tectonophysics 421, 1–22. doi:10.1016/j.tecto.2006.02.011
Karato, S.-I. (2008). Deformation of Earth Materials : An Introduction to the Rheology of Solid Earth. Cambridge University Press.
Karato, S.-I. (1998). Seismic Anisotropy in the Deep Mantle, Boundary Layers and the Geometry of Mantle Convection. Pure Appl. Geophys. 151, 23. doi:10.1007/s000240050130
Karki, B. B., Wentzcovitch, R. M., de Gironcoli, S., and Baroni, S. (1999). First-principles Determination of Elastic Anisotropy and Wave Velocities of MgO at Lower Mantle Conditions. Science 286, 1705–1707. doi:10.1126/science.286.5445.1705
Langdon, T. G., and Pask, J. A. (1970). The Mechanism of Creep in Polycrystalline Magnesium Oxide. Acta Metallurgica 18, 505–510. doi:10.1016/0001-6160(70)90137-9
Li, L., Weidner, D. J., Chen, J., Vaughan, M. T., Davis, M., and Durham, W. B. (2004). X-ray Strain Analysis at High Pressure: Effect of Plastic Deformation in MgO. J. Appl. Phys. 95, 8357–8365. doi:10.1063/1.1738532
Lin, F., Couper, S., Jugle, M., and Miyagi, L. (2019). Competing Deformation Mechanisms in Periclase: Implications for Lower Mantle Anisotropy. Minerals 9, 650. doi:10.3390/min9110650
Lin, F., Hilairet, N., Raterron, P., Addad, A., Immoor, J., Marquardt, H., et al. (2017). Elasto-viscoplastic Self Consistent Modeling of the Ambient Temperature Plastic Behavior of Periclase Deformed up to 5.4 GPa, Ph.D. thesis. J. Appl. Phys. 122, 205902. doi:10.1063/1.4999951
Lin, F., Hilairet, N., Raterron, P., Addad, A., Immoor, J., Marquardt, H., et al. (2017). Elasto-viscoplastic Self Consistent Modeling of the Ambient Temperature Plastic Behavior of Periclase Deformed up to 5.4 GPa. J. Appl. Phys. 122, 205902. doi:10.1063/1.4999951
Long, M. D., Xiao, X., Jiang, Z., Evans, B., and Karato, S.-i. (2006). Lattice Preferred Orientation in Deformed Polycrystalline (Mg,Fe)O and Implications for Seismic Anisotropy in D″. Phys. Earth Planet. Interiors 156, 75–88. doi:10.1016/j.pepi.2006.02.006
Lutterotti, L., Vasin, R., and Wenk, H.-R. (2014). Rietveld Texture Analysis from Synchrotron Diffraction Images. I. Calibration and Basic Analysis. Powder Diffr. 29, 76–84. doi:10.1017/S0885715613001346
Mainprice, D., Bachmann, F., Hielscher, R., and Schaeben, H. (2015). Descriptive Tools for the Analysis of Texture Projects with Large Datasets Using MTEX: Strength, Symmetry and Components. Geol. Soc. Lond. Spec. Publications 409, 251–271. doi:10.1144/SP409.8
Mainprice, D., Tommasi, A., Ferré, D., Carrez, P., and Cordier, P. (2008). Predicted glide Systems and crystal Preferred Orientations of Polycrystalline Silicate Mg-Perovskite at High Pressure: Implications for the Seismic Anisotropy in the Lower Mantle. Earth Planet. Sci. Lett. 271, 135–144. doi:10.1016/j.epsl.2008.03.058
Mariani, E., Mecklenburgh, J., Wheeler, J., Prior, D. J., and Heidelbach, F. (2009). Microstructure Evolution and Recrystallization during Creep of MgO Single Crystals. Acta Materialia 57, 1886–1898. doi:10.1016/j.actamat.2008.12.029
Marquardt, H., Gleason, A., Marquardt, K., Speziale, S., Miyagi, L., Neusser, G., et al. (2011). Elastic Properties of MgO Nanocrystals and Grain Boundaries at High Pressures by Brillouin Scattering. Phys. Rev. B 84, 064131. doi:10.1103/PhysRevB.84.064131
Maruyama, G., and Hiraga, T. (2017). Grain- to Multiple-Grain-Scale Deformation Processes during Diffusion Creep of Forsterite + Diopside Aggregate: 1. Direct Observations. J. Geophys. Res. Solid Earth 122, 5890–5915. doi:10.1002/2017JB014254
Meade, C., Silver, P. G., and Kaneshima, S. (1995). Laboratory and Seismological Observations of Lower Mantle Isotropy. Geophys. Res. Lett. 22, 1293–1296. doi:10.1029/95GL01091
Mei, S., Kohlstedt, D. L., Durham, W. B., and Wang, L. (2008). Experimental Investigation of the Creep Behavior of MgO at High Pressures. Phys. Earth Planet. Interiors 170, 170–175. doi:10.1016/j.pepi.2008.06.030
Merkel, S., Wenk, H. R., Shu, J., Shen, G., Gillet, P., Mao, H.-k., et al. (2002). Deformation of Polycrystalline MgO at Pressures of the Lower Mantle. J. Geophys. Res. 107, 3–1. doi:10.1029/2001JB000920
Miyazaki, T., Sueyoshi, K., and Hiraga, T. (2013). Olivine Crystals Align during Diffusion Creep of Earth's Upper Mantle. Nature 502, 321–326. doi:10.1038/nature12570
Nzogang, B. C., Bouquerel, J., Cordier, P., Mussi, A., Girard, J., and Karato, S. (2018). Characterization by Scanning Precession Electron Diffraction of an Aggregate of Bridgmanite and Ferropericlase Deformed at HP-HT. Geochem. Geophys. Geosyst. 19, 582–594. doi:10.1002/2017GC007244
Paterson, M. S., and Weaver, C. W. (1970). Deformation of Polycrystalline MgO under Pressure. J. Am. Ceram. Soc. 53, 463–471. doi:10.1111/j.1151-2916.1970.tb12678.x
Poirier, J.-P. (1985). Creep of crystal. Cambridge: Cambrigde University Press. doi:10.1017/CBO9780511564451Creep of Crystals
Poirier, J.-P. (1976). Plasticité à haute température des solides cristallins (Eyroles). Paris: WorldCat.
Pole, G. R., Beinlich, A. W., and Gilbert, N. (1946). Physical Properties of Some High-Temperature Refractory Compositions*. J. Am. Ceram. Soc. 29, 208–228. doi:10.1111/j.1151-2916.1946.tb11585.x
Raterron, P., Merkel, S., and Holyoke, C. W. (2013). Axial Temperature Gradient and Stress Measurements in the Deformation-Dia Cell Using Alumina Pistons. Rev. Scientific Instr. 84, 043906. doi:10.1063/1.4801956
Rauch, E. F., and Véron, M. (2014). Automated crystal Orientation and Phase Mapping in TEM. Mater. Characterization 98, 1–9. doi:10.1016/j.matchar.2014.08.010
Riet, A. A., Van Orman, J. A., and Lacks, D. J. (2021). A Molecular Dynamics Study of Grain Boundary Diffusion in MgO. Geochimica et Cosmochimica Acta 292, 203–216. doi:10.1016/j.gca.2020.09.012
Ringwood, A. E. (1991). Phase Transformations and Their Bearing on the Constitution and Dynamics of the Mantle. Geochimica et Cosmochimica Acta 55, 2083–2110. doi:10.1016/0016-7037(91)90090-R
Silber, R. E., Girard, J., and Karato, S.-i. (2022). Effects of Pressure on Diffusion Creep in Wet Olivine Aggregates. Phys. Earth Planet. Interiors 324, 106840. doi:10.1016/j.pepi.2022.106840
Snowden, W. E., and Pask, J. A. (1974). High-temperature Deformation of Polycrystalline Magnesium Oxide. Philosophical Mag. 29, 441–455. doi:10.1080/14786437408213231
Solomatov, V. S., El-Khozondar, R., and Tikare, V. (2002). Grain Size in the Lower Mantle: Constraints from Numerical Modeling of Grain Growth in Two-phase Systems. Phys. Earth Planet. Interiors 129, 265–282. doi:10.1016/S0031-9201(01)00295-3
Speziale, S., Zha, C.-S., Duffy, T. S., Hemley, R. J., and Mao, H.-k. (2001). Quasi-hydrostatic Compression of Magnesium Oxide to 52 GPa: Implications for the Pressure-Volume-Temperature Equation of State. J. Geophys. Res. 106, 515–528. doi:10.1029/2000JB900318
Stretton, I., Heidelbach, F., Mackwell, S., and Langenhorst, F. (2001). Dislocation Creep of Magnesiowüstite (Mg0.8Fe0.2O). Earth Planet. Sci. Lett. 194, 229–240. doi:10.1016/S0012-821X(01)00533-7
Terwilliger, G. R., Bowen, H. K., and Gordon, R. S. (1970). Creep of Polycrystalline MgO and MgO-Fe2O3Solid Solutions at High Temperatures. J. Am. Ceram. Soc. 53, 241–251. doi:10.1111/j.1151-2916.1970.tb12085.x
Tommaseo, C. E., Devine, J., Merkel, S., Speziale, S., and Wenk, H.-R. (2006). Texture Development and Elastic Stresses in Magnesiowűstite at High Pressure. Phys. Chem. Minerals 33, 84–97. doi:10.1007/s00269-005-0054-x
Van Orman, J. A., Fei, Y., Hauri, E. H., and Wang, J. (2003). Diffusion in MgO at High Pressures: Constraints on Deformation Mechanisms and Chemical Transport at the Core-Mantle Boundary. Geophys. Res. Lett. 30. doi:10.1029/2002GL016343
Wang, Y., Hilairet, N., and Dera, P. (2010). Recent Advances in High Pressure and Temperature Rheological Studies. J. Earth Sci. 21, 495–516. doi:10.1007/s12583-010-0124-y
Weidner, D. J., Li, L., Davis, M., and Chen, J. (2004). Effect of Plasticity on Elastic Modulus Measurements. Geophys. Res. Lett. 31, a–n. doi:10.1029/2003GL019090
Weidner, D. J., Wang, Y., and Vaughan, M. T. (1994). Yield Strength at High Pressure and Temperature. Geophys. Res. Lett. 21, 753–756. doi:10.1029/93GL03549
Wenk, H.-R., Armann, M., Burlini, L., Kunze, K., and Bortolotti, M. (2009). Large Strain Shearing of Halite: Experimental and Theoretical Evidence for Dynamic Texture Changes. Earth Planet. Sci. Lett. 280, 205–210. doi:10.1016/j.epsl.2009.01.036
Wenk, H.-R., Lutterotti, L., Kaercher, P., Kanitpanyacharoen, W., Miyagi, L., and Vasin, R. (2014). Rietveld Texture Analysis from Synchrotron Diffraction Images. II. Complex Multiphase Materials and diamond Anvil Cell Experiments. Powder Diffr. 29, 220–232. doi:10.1017/S0885715614000360
Wenk, H. R., Canova, G., Molinari, A., and Mecking, H. (1989). Texture Development in Halite: Comparison of taylor Model and Self-Consistent Theory. Acta Metallurgica 37, 2017–2029. doi:10.1016/0001-6160(89)90086-2
Wilkinson, D. S., and Cáceres, C. H. (1984). On the Mechanism of Strain-Enhanced Grain Growth during Superplastic Deformation. Acta Metallurgica 32, 1335–1345. doi:10.1016/0001-6160(84)90079-8
Yamazaki, D., and Karato, S.-I. (2002). Fabric Development in (Mg,Fe)O during Large Strain, Shear Deformation: Implications for Seismic Anisotropy in Earth's Lower Mantle. Phys. Earth Planet. Interiors 131, 251–267. doi:10.1016/S0031-9201(02)00037-7
Yamazaki, D., and Karato, S.-i. (2001). Some mineral Physics Constraints on the Rheology and Geothermal Structure of Earth's Lower Mantle. Am. Mineral. 86, 385–391. doi:10.2138/am-2001-0401
Keywords: MgO, deformation, electron microscopy, slip systems, grain boundary sliding, lattice preferred orientation, lower mantle, anisotropy
Citation: Ledoux EE, Lin F, Miyagi L, Addad A, Fadel A, Jacob D, Béclin F and Merkel S (2022) Deformation of Polycrystalline MgO Up to 8.3 GPa and 1270 K: Microstructures, Dominant Slip-Systems, and Transition to Grain Boundary Sliding. Front. Earth Sci. 10:849777. doi: 10.3389/feart.2022.849777
Received: 06 January 2022; Accepted: 25 March 2022;
Published: 09 May 2022.
Edited by:
Francesca Miozzi, Earth and Planets Laboratory, United StatesReviewed by:
Simon A. Hunt, The University of Manchester, United KingdomHugo Van Schrojenstein Lantman, Utrecht University, Netherlands
Copyright © 2022 Ledoux, Lin, Miyagi , Addad , Fadel, Jacob , Béclin and Merkel. This is an open-access article distributed under the terms of the Creative Commons Attribution License (CC BY). The use, distribution or reproduction in other forums is permitted, provided the original author(s) and the copyright owner(s) are credited and that the original publication in this journal is cited, in accordance with accepted academic practice. No use, distribution or reproduction is permitted which does not comply with these terms.
*Correspondence: Estelle Elisa Ledoux, bGVkb3V4LmVzdGVsbGVAb3V0bG9vay5mcg==