 Meiling Hong
 Lidong Dai
 Haiying Hu
 Xinyu Zhang
 Chuang Li
- 1Key Laboratory of High-Temperature and High-Pressure Study of the Earth’s Interior, Institute of Geochemistry, Chinese Academy of Sciences, Guiyang, China
- 2University of Chinese Academy of Sciences, Beijing, China
We investigated the structural, vibrational, and electrical transport properties for natural barite under the conditions of 298–873 K and 1.5–35.0 GPa using a diamond anvil cell by virtue of Raman spectroscopy and electrical conductivity measurements. Upon compression, natural barite transformed into post-barite at 18.9 GPa and atmospheric temperature, which was evidenced by the emergence of υ5 Raman peak, the discontinuities in the pressure-dependent Raman shifts, FWHM of υ1 Raman peak and electrical conductivity under non-hydrostatic condition. The phase transition is of good reversibility, whereas a considerable pressure hysteresis was detected during the process of decompression. Under quasi-hydrostatic condition, the structural transition of natural barite occurred at a higher pressure of 21.4 GPa, which is possibly related to the influence of deviatoric stress. Furthermore, our high-temperature and high-pressure Raman spectra and electrical conductivity results for natural barite revealed that the phase transformation pressures decreased as temperatures enhanced and further, the phase boundary between barite and post-barite was described as P (GPa) = 24.00–0.0166 T (K). Our obtained phase diagram of natural barite can improve the knowledge about the structural and electrical properties for other barite-group minerals MSO4 (M = Sr and Pb) under high temperature and high pressure conditions.
Introduction
Barite-group sulfates MSO4 (M = Ba, Sr, and Pb), the most prominent and common sulfate minerals in the Earth’s crust, play a vital role in the recycling of sulfur from crust into mantle through plate subduction (Evans et al., 2014; Canil and Fellows, 2017). Under ambient conditions, barite-group sulfates crystallize into orthorhombic crystal systems, where each M atom coordinates with twelve oxygen atoms derived from six neighboring SO4 tetrahedrons to constitute MO12 polyhedron, leading to the edge sharing between SO4 and MO12 polyhedrons (Antao, 2012; Ye et al., 2019). As a representative barite-group sulfate, barite (BaSO4) primarily outcrops in low temperature hydrothermal deposits and sedimentary deposits (Abidi et al., 2012). In light of its chemical stability, high reservation, and low cost, barite has been extensively applied in the fields of chemical raw materials, drilling mud raw materials, glass raw materials, and chemical fillers (Zhou et al., 2015).
Previous high-pressure phase stability investigations on barite have been performed through synchrotron X-ray diffraction and Raman spectroscopy (Lee et al., 2001; Lee et al., 2003; Crichton et al., 2011; Santamaría-Pérez et al., 2011; Ye et al., 2019). However, there are numerous disputes regarding the phase stability and structural transition pressure for barite. Santamaría-Pérez et al. (2011) conducted the synchrotron X-ray diffraction research on synthetic barite in a diamond anvil cell using three different pressure mediums of the methanol and ethanol mixture (4:1 volume ratio), silicone oil, and helium up to 48.0 GPa. Their experimental results revealed that barite underwent a structural transition from the Pbnm to P212121 phases within the pressure range of 17.0–27.0 GPa, depending on the employed pressure medium. Subsequently, a similar synchrotron X-ray diffraction study reported the Pbnm-to-P212121 phase transition at ∼20.3 GPa with neon as the pressure medium (Ye et al., 2019). However, Lee et al. (2001); Lee et al. (2003) disclosed the occurrence of a phase transition at a lower pressure of 10.0 GPa under different hydrostatic environments with no pressure medium and the mixture of methanol and ethanol (4:1 volume ratio) as the pressure medium by virtue of synchrotron X-ray diffraction and Raman spectroscopy. By contrast, Crichton et al. (2011) performed the synchrotron X-ray diffraction and Raman spectroscopy measurements on natural barite single crystal from Germany using helium as the pressure medium and results demonstrated that natural barite remained stable up to 21.5 GPa. And thus, the controversies on the high-pressure phase stability and structural transition pressure for barite are worthy of further investigation. Besides the aforementioned two experimental means, electrical conductivity measurement is another sensitive and effective method, since the occurrence of structural transition is often accompanied by the variation in electrical transport characteristic for some rocks and minerals (Pu et al., 2018; Yang et al., 2018; Hong et al., 2022). However, the related investigation on the high-temperature and high-pressure electrical conductivity of natural barite remains blank until now.
On the other hand, temperature is an important factor of influencing the phase transition pressure for some minerals and rocks (Hong et al., 2022). To the best of our knowledge, Lee et al. (2001) have proposed the phase diagram of synthetic barite under the temperature range of 298–1000 K and pressures up to 29.0 GPa through synchrotron X-ray diffraction. Additionally, Raman spectroscopy and electrical conductivity measurements have been proved to be efficient methods of identifying the occurrence of structural transition under high temperature and high pressure conditions and thus have been extensively applied to establish the phase diagram of minerals and rocks (Pu et al., 2018; Yang et al., 2018; Hong et al., 2022). Previously available Raman spectroscopy investigations paid special attention on the structural transition of barite under high pressure and room temperature conditions (Lee et al., 2003; Chen et al., 2009; Crichton et al., 2011), whereas the relevant Raman scattering research on the phase stability of barite under simultaneously high-temperature and high-pressure conditions is still lacking.
In the present study, we reported the structural transition of natural barite up to 35.0 GPa at atmospheric temperature under different hydrostatic environments using a diamond anvil cell in conjunction with Raman spectroscopy and alternating current (AC) complex impedance spectroscopy, and the influence of different hydrostatic environments on the phase transition pressures was discussed in detail. Furthermore, we also revealed the influence of temperatures on the phase transformation pressures, and a phase diagram of natural barite was constructed under conditions of 298–873 K and 10.9–18.9 GPa.
Materials and Methods
Sample Preparation and Characterization
The natural transparent barite crystal (see the inset of Figure 1) was gathered from Huili city, Sichuan province, China. We crushed and ground the bulk sample into powders using an agate mortar. The phase identification of the initial sample was performed by X-ray diffraction (XRD) with a X’Pert Pro X-ray powder diffractometer operating at an acceleration voltage of 45 kV and a beam current of 40 mA, respectively. Figure 1 shows the typical XRD pattern of the starting sample and the results revealed that the initial sample belongs to orthorhombic structure with the space group of Pbnm. The lattice parameters of the starting sample were calculated using MDI Jade 6.5 software and the correspondent results are listed as follows: a = 7.145 Å, b = 8.866 Å, c = 5.445 Å, α = β = γ = 90.0°, and V = 345.0 Å3, which concides well with the standard PDF data of barite (JCPDS no.83-1718). Although our obtained zero-pressure unit cell volume is slightly different from previous investigations (Lee et al., 2001; Lee et al., 2003; Crichton et al., 2011; Ye et al., 2019), it has a negligible effect on the equation of state (EoS) of barite.
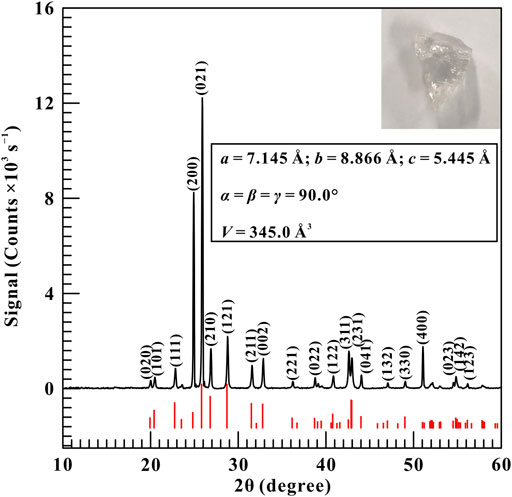
FIGURE 1. The representative diffraction pattern of natural barite. Inset: Optical microscope image and the calculated lattice parameters for the starting sample. In here, the black line represents the measured diffraction pattern and the red vertical lines are the standardized peak positions of barite from the standard PDF card of JCPDS no.83-1718.
High-Temperature and High-Pressure Raman Spectroscopy Measurements
A four column-type diamond anvil cell (DAC) with a facet diameter of 300 μm and bevel angle of 10° was utilized for high-temperature and high-pressure Raman spectroscopy and electrical conductivity measurements. High temperature was generated by an external resistance heating furnace made up of a 300-μm diametral nickel-chromium wire. We fixed the prepared heating furnace to the tungsten carbide seat by high-temperature cement. Temperature was gradually increased from 298 to 873 K with an interval of 50 K and was monitored through a k-type thermocouple adhered to the diamond with the precise of ±5 K. Raman spectroscopic experiments were performed using a Renishaw 2000 microconfocal Raman spectrometer equipped with an excitation source of 514.5 nm. In our present work, the mixture of methanol and ethanol (4:1 volume ratio) was selected as the pressure medium to provide quasi-hydrostatic condition and no pressure medium was employed to attain non-hydrostatic condition. A ruby single crystal with a grain size of ∼5 μm was chosen as the pressure calibration at room temperature based on the shift of R1 fluorescence peak. Furthermore, we determined the pressure under high temperature based on the high-temperature corrected equation of pressure calibration (Rekhi et al., 1999).
High-Temperature and High-Pressure Electrical Conductivity Measurements
A sheet of 250 μm thick T-301 stainless steel was preindented to ∼40 μm thickness and later a central hole with the diameter of 180 μm was drilled by a laser drilling machine. Afterwards, a mixture of boron nitride and epoxy powder was compacted into the hole for electrical insulation and another new central hole with a diameter of 100 μm was made as the insulating sample chamber. Subsequently, the remaining part of the gasket was coated by the insulating cement. The sample chamber was surrounded by the resistance heating furnace and thus the sample could be homogeneously heated based on the thermal conduction principle. For the sake of realizing thermal equilibrium, we waited for ∼10 min at each pre-designed temperature prior to the Raman spectroscopy and electrical conductivity measurements. No pressure medium was utilized to avoid introducing additional impurities and guarantee good contaction between sample and electrodes during electrical conductivity measurements. Figure 2 represents the experimental assemblage of the high-temperature and high-pressure electrical conductivity measurement. We measured the complex impedance spectra of natural barite under the conditions of 298–873 K and 2.8–30.0 GPa by a Solartron-1260 impedance/gain phase analyzer within the frequency range of 10−1–107 Hz and at an alternating voltage of 1.0 V. Detailed instructions on the high-temperature and high-pressure measurement principles and experimental procedures have been reported by Hong et al. (2022).
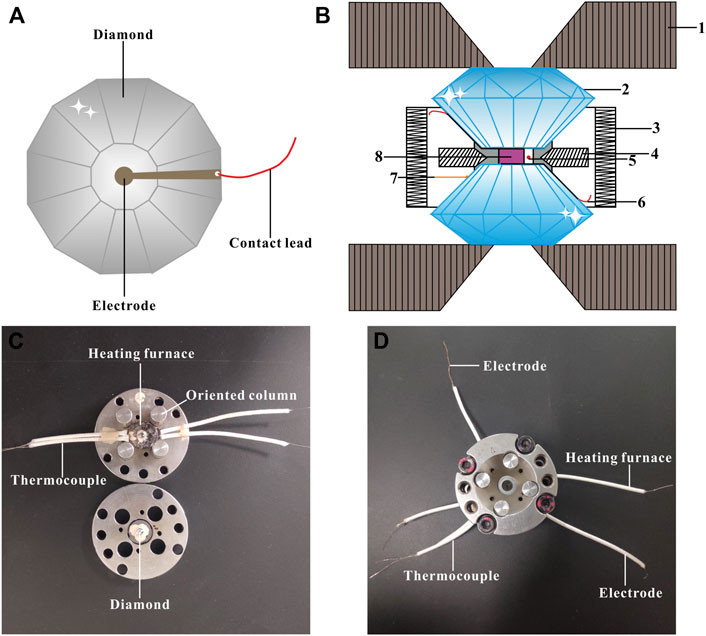
FIGURE 2. Experimental assemblage of the high-temperature and high-pressure electrical conductivity measurements on natural barite. (A) Configuration of plate electrodes installed on two diamond anvils. (B) Cross-sectional schematic of the externally heated diamond anvil cell (DAC) applied for the high-temperature and high-pressure electrical conductivity experiments. In here, (1) tungsten carbide seat; (2) diamond; (3) heating furnace; (4) gasket; (5) ruby; (6) electrode; (7) thermocouple; (8) sample. (C) and (D) The photographs of the external resistance heating DAC assembly employed in high-temperature and high-pressure electrical conductivity measurements.
Results and Discussion
The Phase Transition of Natural Barite at Room Temperature
Raman spectroscopy has been proved to be a sensitive method of exploring the occurrence of pressure-induced structural transition for some minerals and rocks (Pu et al., 2018; Yang et al., 2018; Hong et al., 2022). From Figure 3A, ten representative Raman peaks were detected for natural barite within the wavenumber range of 400–1,300 cm−1 at a given pressure of 0.5 GPa under non-hydrostatic condition, which can be assigned as υ1 (989.6 cm−1), υ2a (454.6 cm−1), υ2b (462.8 cm−1), υ3a (1,083.9 cm−1), υ3b (1,105.7 cm−1), υ3c (1,140.4 cm−1), υ3d (1,167.4 cm−1), υ4a (618.6 cm−1), υ4b (631.3 cm−1), and υ4c (648.7 cm−1), respectively. All of these Raman peaks are in good accordance with previous investigations (Lee et al., 2003; Chen et al., 2009; Liu et al., 2015; Zhou et al., 2020). Το diminish experimental error, we analyzed six stronger Raman modes of υ1, υ2a, υ2b, υ3c, υ4a, and υ4c in the processes of compression and decompression.
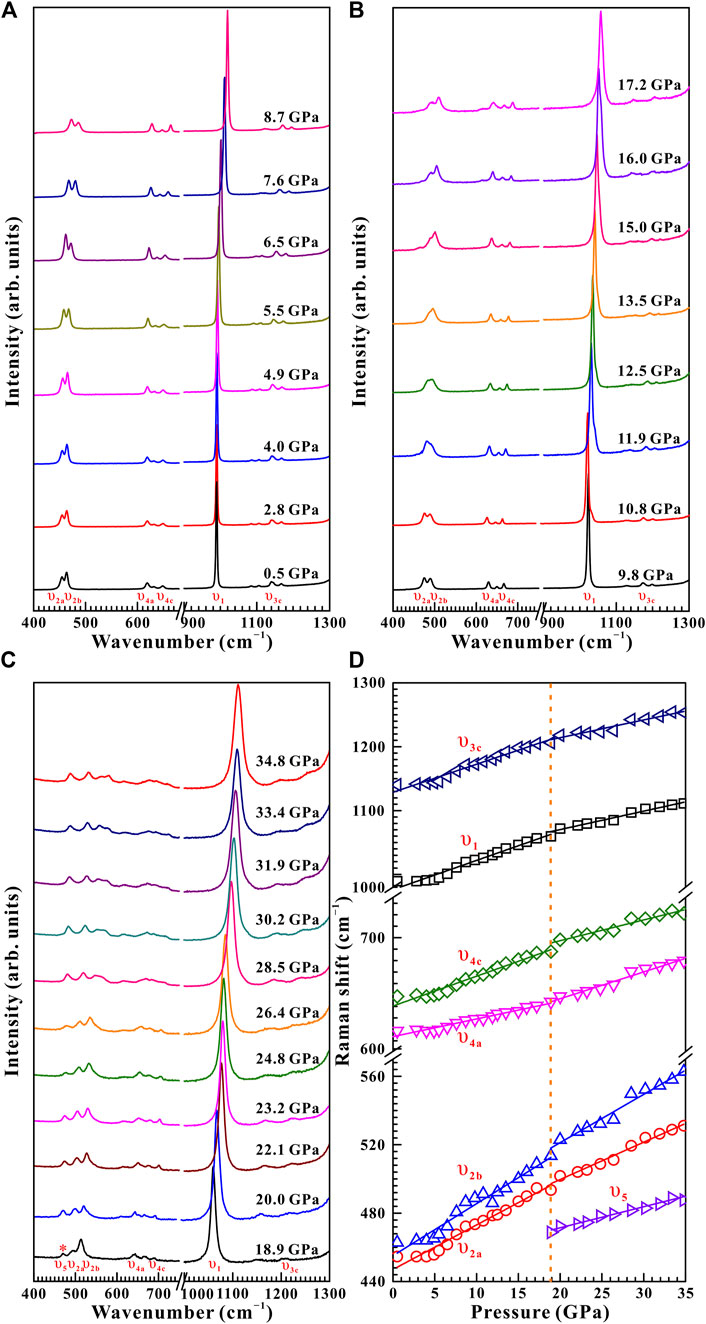
FIGURE 3. High-pressure Raman spectroscopic results on natural barite within the wavenumber range of 400–1,300 cm−1 up to 34.8 GPa and room temperature upon compression. (A) 0.5–8.7 GPa; (B) 9.8–17.2 GPa; (C) 18.9–34.8 GPa. (D) The corresponding evolution of Raman shifts with increasing pressure for natural barite under non-hydrostatic condition. The solid and dashed lines are employed to guide to the eyes.
Figure 3 displays the high-pressure Raman spectra of natural barite within the pressure range of 0.5–34.8 GPa under non-hydrostatic condition. The corresponding fitting results of the pressure-dependent Raman shifts (dω/dP, where ω and P are the Raman shift and pressure, respectively) are summarized in Table 1. As depicted in Figure 3A−C, all of these Raman peaks monotonously shifted towards higher wavenumbers with increasing pressure. Meanwhile, we found that the υ2a and υ2b Raman peaks overlapped within the pressure range of 11.9–15.0 GPa, while they separated obviously above 16.0 GPa. Notably, as the pressure reached up to 18.9 GPa, an absolutely new Raman peak at 468.7 cm−1 (denoted as the υ5 mode in Figure 3C) appeared. Furthermore, we found that the Raman peaks of sample became significant broadening accompanied by the remarkable decrease in their Raman peak intensities, which is possibly related to the intrinsic nature of crystalline structure. To further reveal the occurrence of phase transition, we detailedly analyzed the pressure dependence of Raman shifts for natural barite. Two discrete pressure ranges of 0.5–18.9 GPa and 20.0–34.8 GPa were distinguished. Below 18.9 GPa, the Raman modes of υ2a, υ2b, υ4c, υ1, and υ3a displayed blue shifts with larger slopes of 2.60, 3.03, 2.59, 4.58, and 4.39 cm−1 GPa−1 and the υ4a mode showed a smaller rate of 1.54 cm−1 GPa−1. However, within the pressure range of 20.0–34.8 GPa, smaller rates of 2.18, 2.82, 1.81, 2.88, and 2.76 cm−1 GPa−1 were acquired for the υ2a, υ2b, υ4c, υ1, and υ3a modes and a larger slope of 2.34 cm−1 GPa−1 was detected for the υ4a mode, respectively. Additionally, we also analyzed the Raman full width at half-maximum (FWHM) of υ1 Raman peak with increasing pressure under different hydrostatic environments, as displayed in Figure 4. The correspondent fitting results of pressure-dependent FWHM for natural barite under different hydrostatic environments were listed in Table 2. Results showed that the Raman FWHM of υ1 Raman peak exhibited an obvious inflection point at 18.9 GPa under non-hydrostatic condition, which can be attributed to the occurrence of structural phase transition for natural barite. In short, the appearance of υ5 Raman peak and the inflection points in the pressure-dependent Raman shifts and FWHM of υ1 Raman peak indicate that natural barite underwent a phase transformation at 18.9 GPa under non-hydrostatic condition.
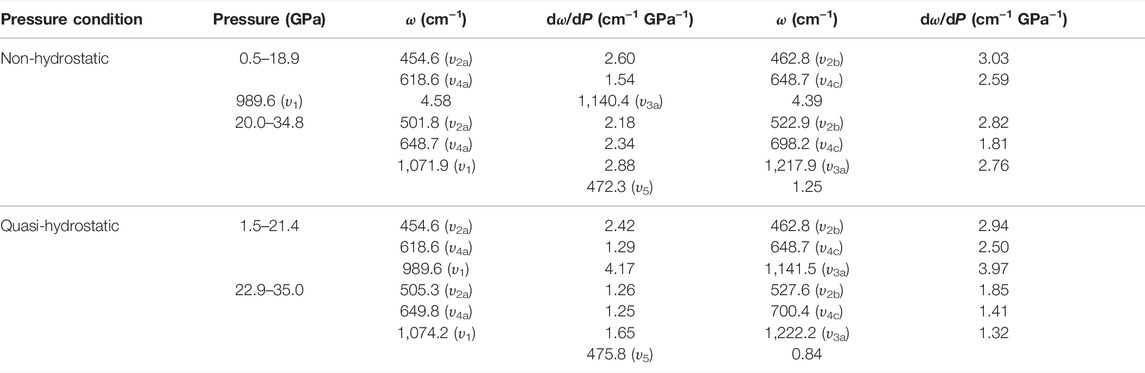
TABLE 1. Pressure-dependent Raman shift dω/dP (cm−1 GPa−1) for natural barite under non-hydrostatic and quasi-hydrostatic environments at room temperature. Here, ω (cm−1) and P (GPa) represent Raman frequency and pressure, respectively.

FIGURE 4. The evolution of Raman FWHM as a function of pressure for υ1 Raman peak under (A) non-hydrostatic condition and (B) quasi-hydrostatic condition, respectively. The solid and dashed lines serve as visual guidance.
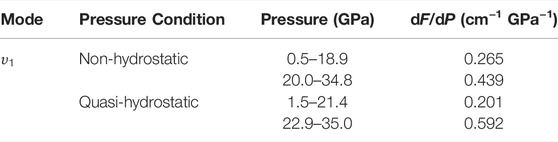
TABLE 2. Pressure dependence of Raman FWHM dF/dP (cm−1 GPa−1) for natural barite under non-hydrostatic and quasi-hydrostatic environments. In here, F (cm−1) and P (GPa) stand for Raman FWHM and pressure, respectively.
Upon decompression, within the pressure range of 32.1–2.9 GPa, all these Raman peaks of natural barite continuously shifted towards lower wavenumbers, as illustrated in Figure 5. Noteworthily, the υ5 Raman peak disappeared when the pressure was released to 1.8 GPa. At the same time, all the Raman peaks of sample became sharp and narrow accompanied by the apparent increase in their Raman peak intensities. Furthermore, an available discontinuity in the pressure-dependent Raman shifts was found at 1.8 GPa, indicating the occurrence of phase transformation. After quenched down to ambient conditions, all of these Raman peaks of barite returned to their original Raman peak positions, suggesting the reversibility of the structural transition. However, there exists a huge pressure hysteresis of approximately 17.0 GPa for natural barite, which is probably related to the large kinetic barrier for the structural transition upon decompression. In addition, we compared the pressure-dependent Raman shift relationships obtained in this study and previously available investigations from Lee et al. (2003) and Chen et al. (2009), as shown in Supplementary Figure S1. Results indicated that our acquired pressure-dependent Raman shift relationships of barite are in reasonable agreement with previous investigations under both processes of compression and decompression.
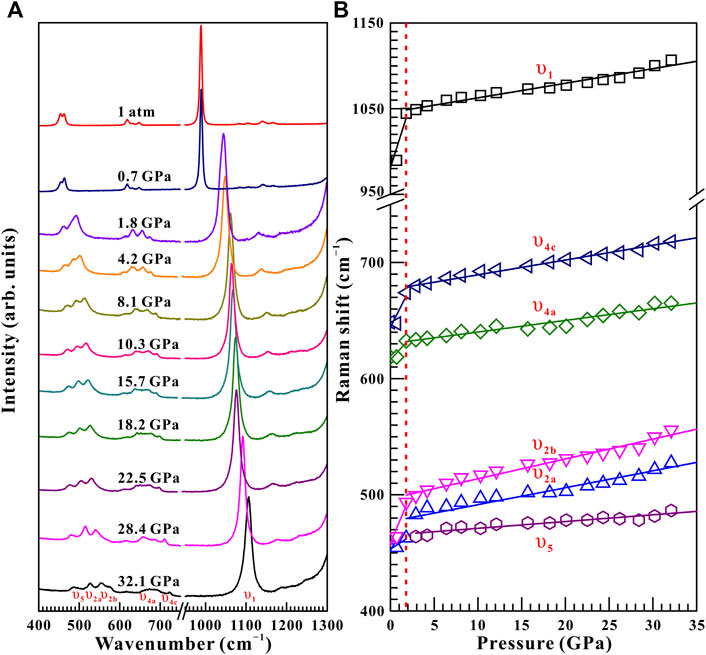
FIGURE 5. (A) Selected high-pressure Raman spectra of natural barite within the pressure range of 32.1–0.0 GPa and atmospheric temperature during the process of decompression. (B) The pressure dependence of Raman shifts for natural barite under non-hydrostatic condition. The solid and dashed lines serve as visual guidance.
Under quasi-hydrostatic condition, the high-pressure Raman spectra of natural barite in the processes of compression and decompression are displayed in Supplementary Figures S2,S3, respectively. Accordingly, the fitting results of the pressure-dependent Raman shifts are presented in Table 1. Experimental results showed similar phenomena of the emergence of υ5 Raman peak and the inflection points in the pressure-dependent Raman shifts and FWHM of υ1 Raman peak at 21.4 GPa under quasi-hydrostatic condition.
As detailedly discussed by Santamaría-Pérez et al. (2011) and Ye et al. (2019), the phase transition pressure of barite is highly sensitive to the hydrostaticity within the sample chamber of the diamond anvil cell. In other words, the larger deviatoric stress under non-hydrostatic condition can promote the occurrence of phase transition. By contrast, the smaller deviatoric stress within the sample chamber provides a reasonable explanation for the higher phase transition pressure of natural barite under quasi-hydrostatic condition. Additionally, it is indispensable to conduct the high-pressure Raman spectroscopy of natural barite under non-hydrostatic condition based on the following three dominant perspectives including detailed investigation the high-pressure physiochemical behaviors of natural barite by Raman spectroscopy combined with electrical conductivity results, comparisons with previous studies under same hydrostatic environments, as well as a systematic exploration on the influence of hydrostaticity on the structural transition pressure for natural barite.
It is well known that the structural phase transition of minerals and rocks is often accompanied by the variation in electrical transport properties (Pu et al., 2018; Yang et al., 2018; Hong et al., 2022). To further disclose the structural transition of natural barite, high-pressure electrical conductivity measurements were carried out within the pressure range of 2.8–30.0 GPa. As illustrated in Figure 6A−C, all of these measured impedance spectra were consisted of a high-frequency semicircle (∼102–107 Hz) and a small tail in the low-frequency region (∼101–102 Hz), which can be interpreted as the grain interior and grain boundary contributions of sample, respectively. We determined sample resistances by fitting impedance semicircular arcs using the appropriate equivalent circuit comprised of the parallel combination of R (resistance) and CPE (constant-phase element). In here, the fitting error is not more than 5% of the resistance. The corresponding electrical conductivity (σ) of natural barite was calculated from the resistance (R) and geometric factor (L/S; where L stands for the distance between the electrodes and S is the cross-sectional area of electrode) based on the equation σ = L/SR. The logarithmic electrical conductivity of natural barite as a function of pressure during both processes of compression and decompression is plotted in Figure 6D. It makes clear that natural barite showed a rapid increase in electrical conductivity at a rate of 0.018 S cm−1 GPa−1 within the pressure range of 2.8–19.2 GPa. However, beyond 19.2 GPa, the electrical conductivity of sample exhibited a positive pressure-dependent electrical conductivity relation with a smaller speed of 0.0046 S cm−1 GPa−1. And thus, the apparent discontinuity in electrical conductivity at 19.2 GPa confirms the occurrence of phase transition for natural barite, which is consistent with our Raman spectra results under non-hydrostatic condition. Upon decompression, the electrical conductivity of sample retained almost invariable within the pressure range of 27.2–3.2 GPa. As the pressure decreased from 3.2 to 2.4 GPa, an obvious decrease in electrical conductivity from −5.94 S/cm to −6.05 S/cm was detected. The available inflection point in electrical conductivity at 3.2 GPa can be attributed to the structural transformation of natural barite.
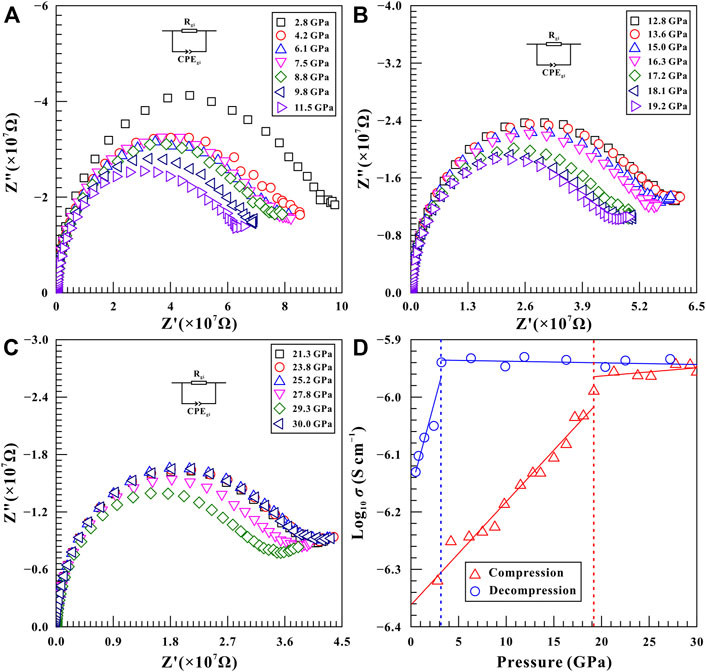
FIGURE 6. Complex impedance spectra of natural barite under the conditions of 2.8–30.0 GPa and atmospheric temperature during the process of compression. (A) 2.8–11.5 GPa; (B) 12.8–19.2 GPa; (C) 21.3–30.0 GPa. An appropriate equivalent circuit composed of the parallel combination of R (resistance) and CPE (constant-phase element) was selected to fit the impedance semicircular arcs. In here, the signals of Z′ and Z″ stand for the real and imaginary parts of complex impedance, respectively. (D) The logarithmic electrical conductivity of natural barite as a function of pressure during both processes of compression and decompression at atmospheric temperature. In here, the solid and dashed lines are used to guide to the eyes.
In the present study, we found that natural barite underwent a structural phase transition at ∼18.9 GPa and atmospheric temperature by virtue of two independent experimental methods of Raman spectroscopy and electrical conductivity. A detailed comparison on the high-pressure structural transition of barite between our acquired results and reported investigations was made and summarized in Table 3. In terms of the structural stability of barite under high pressure, our results agree well with previous investigations (Lee et al., 2001; Lee et al., 2003; Chen et al., 2009; Crichton et al., 2011; Santamaría-Pérez et al., 2011; Ye et al., 2019). Crichton et al. (2011) reported that natural barite remained stable up to 21.5 GPa with helium as the pressure medium and they attributed the phase stability of natural barite to the higher hydrostaticity and the limited experimental pressure. Our high-pressure Raman spectra results on natural barite under different hydrostatic environments provided a robust support for their conclusions that natural barite will undergo a structural transition under the conditions of lower hydrostaticity or higher experimental pressure.
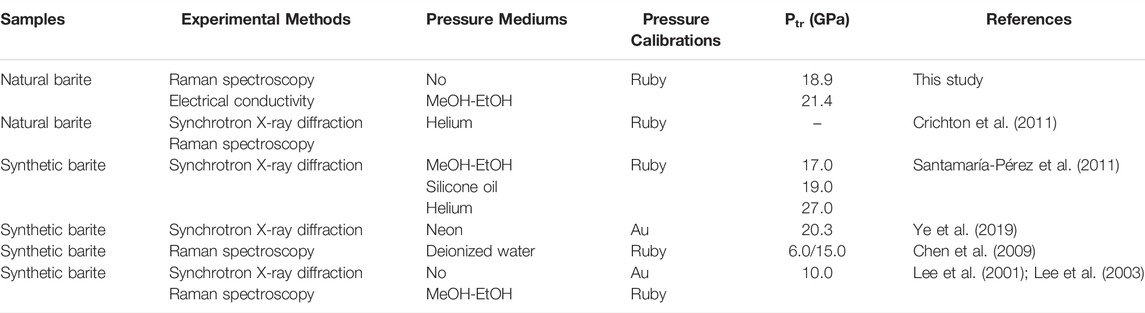
TABLE 3. Comparison of the experimental details and structural transition pressure (Ptr) between present and previous investigations on barite. In here, MeOH-EtOH represents the mixture of methanol and ethanol (4:1 volume ratio).
On the other hand, another predominate dispute is the phase transition pressure of barite. Under non-hydrostatic condition, our obtained phase transition pressure is substantially higher than that of Chen et al. (2009) with deionized water as the pressure medium and Lee et al. (2001); Lee et al. (2003) without pressure medium. As for quasi-hydrostatic condition, our acquired phase transition pressure is distinctly higher than that of Lee et al. (2001); Lee et al. (2003) and Santamaría-Pérez et al. (2011) with the mixture of methanol and ethanol (4:1 volume ratio) as the pressure medium, whereas is comparable to that of Ye et al. (2019) using neon as the pressure medium. Thus, it seems that the discrepancy in the structural transition pressure of barite cannot be fully explained by the influence of different pressure mediums alone. Although we do not have a definite explanation for the discrepancy in the structural transition pressure among different investigations, it may be related to the comprehensive influences of the difficulty in phase identification since the significant decrease in the Raman peak intensity of barite as the pressure was increased (Lee et al., 2003; Chen et al., 2009), the choice of pressure calibrations, the different starting samples, the various experimental methods, the selection of pressure mediums, and so on.
The Phase Transition of Natural Barite at High Temperature
As usual, temperature plays a crucial role in influencing the phase transition pressure for some minerals and rocks (Hu et al., 2017; Sun et al., 2017; Hu et al., 2018; Hong et al., 2022). To illustrate the effect of temperature on the phase transition pressure of natural barite, five sets of representative high-temperature Raman spectroscopy experiments were performed at pre-determined pressures of 10.9, 11.9, 13.2, 15.5, and 19.5 GPa within the temperature range of 298–873 K. The fitting results of the temperature dependence of Raman shifts (dω/dT, where ω and T are the Raman shift and temperature, respectively) are displayed in Table 4.
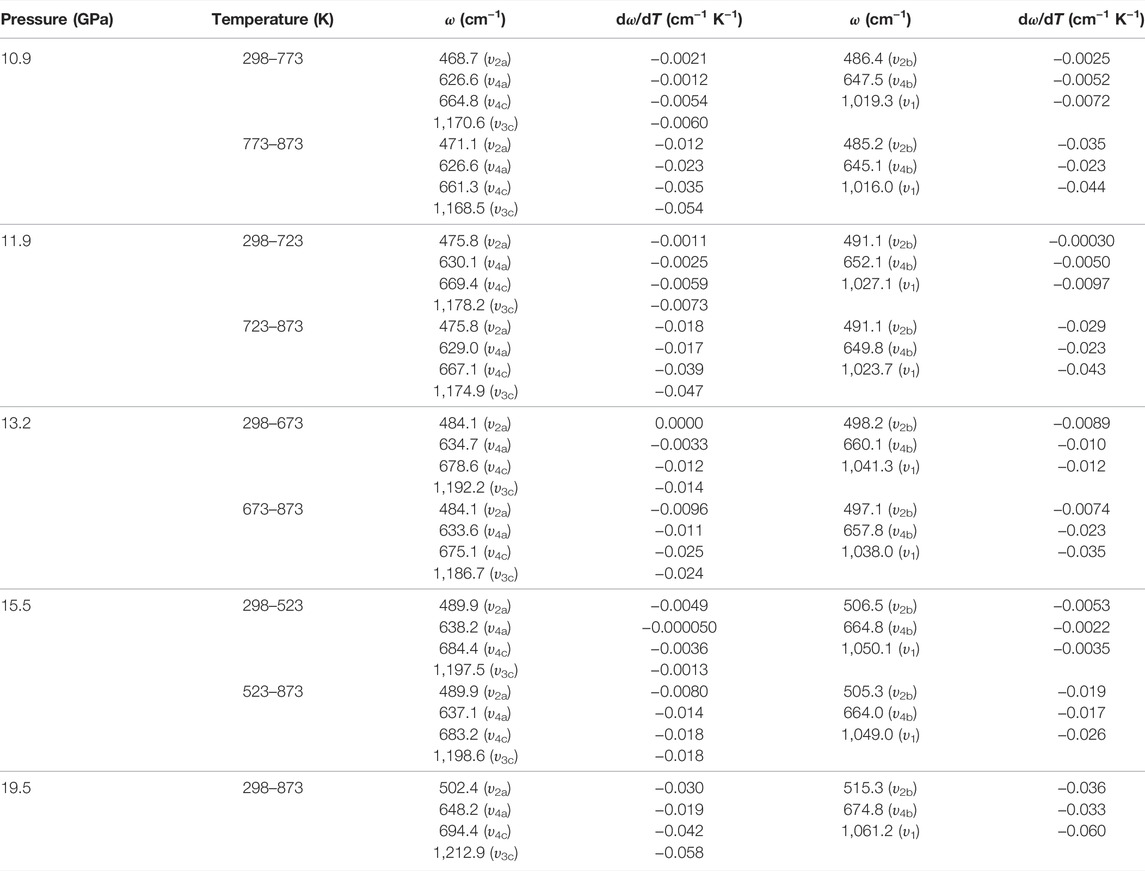
TABLE 4. Temperature-dependent Raman shift dω/dT (cm−1 K−1) for natural barite at some representative pressures of 10.9, 11.9, 13.2, 15.5, and 19.5 GPa within the temperature range of 298–873 K under non-hydrostatic condition. Here, ω (cm−1) and T (K) represent the Raman frequency and temperature, respectively.
Figure 7 represents the high-temperature Raman spectra of natural barite at a pre-designed pressure of 10.9 GPa. In contrast to the influence of pressure-induced crystal lattice contraction, all of these Raman peaks monotonously shifted towards lower wavenumbers, indicating the thermal expansion of the crystal lattice as the sample was subjected to high temperature. According to diverse temperature-dependent Raman shifts (dω/dT, where ω and T are the Raman shift and temperature, respectively), two temperature regions of 298–773 K and 773–873 K were identified at 10.9 GPa. Below 773 K, the Raman peaks of υ2a, υ2b, υ4a, υ4b, υ4c, υ1, and υ3c exhibited smaller rates of −0.0021, −0.0025, −0.0012, −0.0052, −0.0054, −0.0072, and −0.0060 cm−1 K−1 with increasing temperature, respectively. Nevertheless, larger slopes of −0.012, −0.035, −0.023, −0.023, −0.035, −0.044, and −0.054 cm−1 K−1 were obtained for the υ2a, υ2b, υ4a, υ4b, υ4c, υ1, and υ3c modes within the temperature range of 773–873 K. Therefore, at a representative pressure of 10.9 GPa, the available inflection point in the temperature-dependent Raman shifts at 773 K is probably attributed to the occurrence of phase transition. To verify this speculation, we performed an absolutely new high-temperature Raman scattering experiment for post-barite at 19.5 GPa. As shown in Supplementary Figure S4, all the Raman peaks of post-barite continuously shifted towards lower wavenumbers up to the maximum temperature of 873 K without anomaly in the temperature dependence of Raman shifts, which implies that post-barite remained stable in our investigated temperature range. Therefore, the discontinuity in the temperature dependence of Raman shifts is most possibly caused by the occurrence of structural transition for natural barite under high temperature. Furthermore, similar inflection points in Raman shifts at 723, 673, and 523 K were also detected at other three pressures of 11.9, 13.2, and 15.5 GPa, as shown in Figure 8, Supplementary Figure S5, S6Material. However, we have never observed the appearance of υ5 Raman peak up to the maximum temperature of 873 K at all of these measured pressures (10.9, 11.9, 13.2, 15.5, and 19.5 GPa). One possible explanation is the influence of high temperature. More specifically, under cold compression, the deviatoric stress within the sample chamber of the diamond anvil cell enhanced significantly as the pressure increased, resulting in the increase of dislocations and defects within the sample, which may be responsible for the emergence of υ5 Raman peak. Conversely, high temperature plays a vital role in relaxing deviatoric stress and thus minimizing the dislocations and defects inside sample, which may suppress the appearance of υ5 Raman peak. As a matter of fact, similar phenomenon has been detected in another anhydrous mineral of calcite under high temperature condition (Yuan et al., 2021). In comprehensive comparison the Raman spectroscopy results of natural barite during both processes of decompression and heating, we concluded that the decompression and heating have same effect on expanding the crystalline lattice of natural barite, which is characterized by the red shifts of Raman peaks with increasing temperature or releasing pressure.
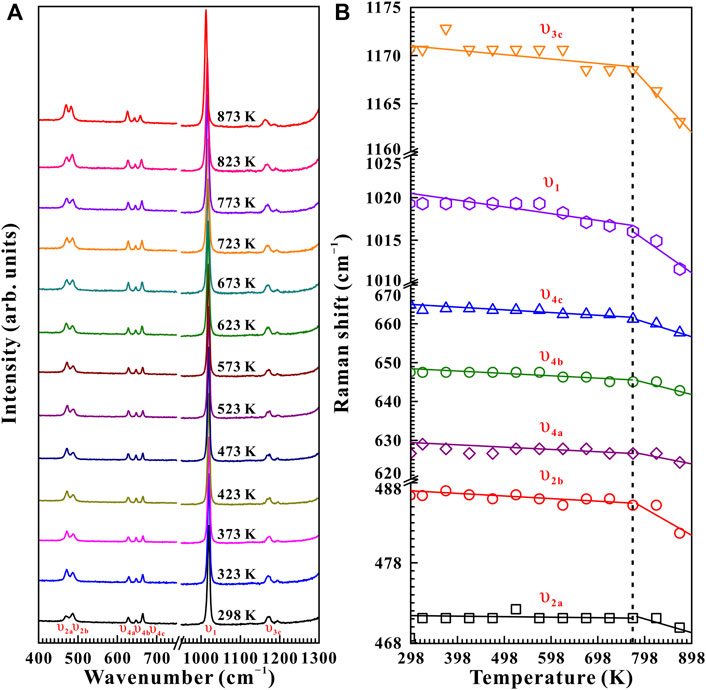
FIGURE 7. (A) High-temperature Raman spectroscopy results of natural barite at a fixed pressure of 10.9 GPa within the wavenumber range of 400–1,300 cm−1 over the temperature range of 298–873 K with the temperature interval of 50 K. (B) The evolution of Raman shifts against temperature for natural barite under non-hydrostatic condition. The solid and dashed lines act as visual guides.
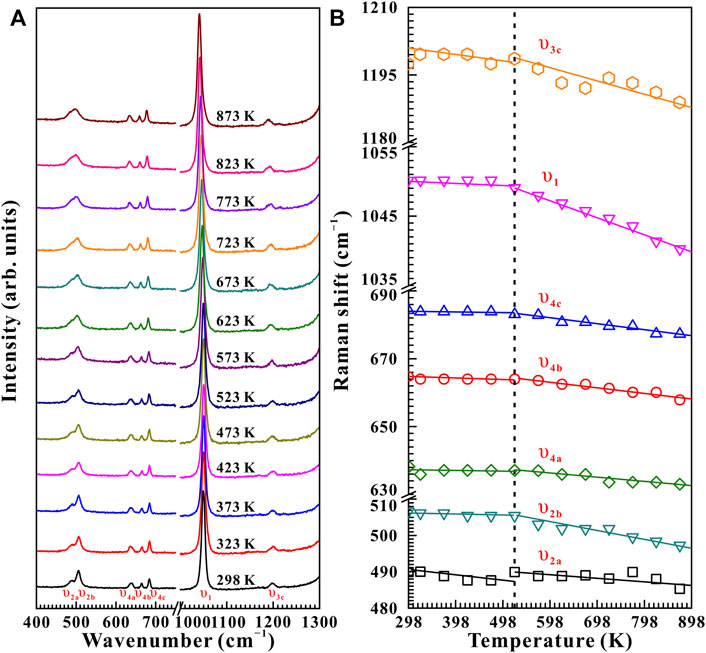
FIGURE 8. (A) High-temperature Raman spectra of natural barite at a pre-designed pressure of 15.5 GPa within the wavenumber range of 400–1,300 cm−1 in the temperature interval of 298–873 K. (B) The temperature dependence of Raman shifts for natural barite under non-hydrostatic condition.
A series of high-temperature impedance spectra on natural barite were also collected at some typical pressures of 11.5, 12.6, and 15.7 GPa within the temperature range of 298–873 K to further demonstrate the relationship between phase transition pressures and temperatures. Figure 9 shows the high-temperature complex impedance spectra for natural barite at a representative pressure of 11.5 GPa. The electrical conductivity of sample decreased obviously from −4.95 S/cm to −5.91 S/cm as the temperature enhanced from 298 to 323 K, which is probably attributed to the removal of the absorbed water from the sample surfaces (Hong et al., 2022). Within the temperature ranges of 323–523 K and 773–873 K, two positive temperature-dependent electrical conductivity correlations were obtained due to the enhanced mobility of charge carriers with increasing temperature, which satisfies with the representative electrical transport characteristic of semiconductor (Hu et al., 2017; Hu et al., 2018; Hong et al., 2022). More importantly, we found that the electrical conductivity of sample decreased significantly by approximately two orders of magnitude when the temperature was increased from 523 to 773 K. Therefore, at the given pressure of 11.5 GPa, the remarkable drop in electrical conductivity may be related to the structural phase transition of natural barite, which started at 523 K and was completed at 773 K. Furthermore, the high-temperature electrical conductivity variation tendencies observed at 11.5 GPa resemble to that at other two pressures of 12.6 and 15.7 GPa. From Supplementary Figure S7,S8, the evident decrease in the electrical conductivity of natural barite was observed within the temperature ranges of 523–673 K and 473–623 K at the respective pressures of 12.6 and 15.7 GPa. Therefore, it is reasonable to speculate that these decreases in electrical conductivities are possibly associated with the occurrence of phase transitions at high temperature.
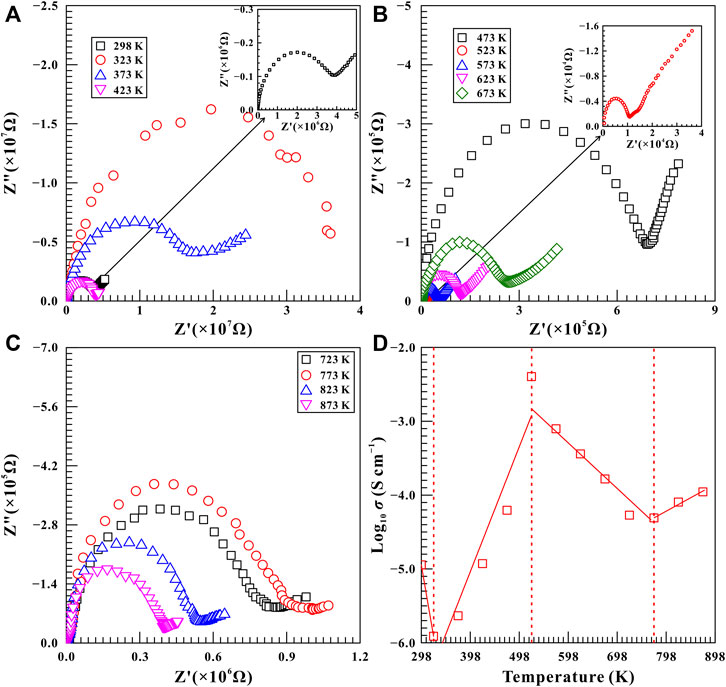
FIGURE 9. Representative complex spectra of natural barite within the temperature range of 298–873 K at a constant pressure of 11.5 GPa. (A) 298–423 K; (B) 473–673 K; (C) 723–873 K. (D) The logarithm of electrical conductivity versus temperature for natural barite. The solid and dashed lines serve as visual guides.
By comparing the variation in the electrical conductivity of natural barite under high pressure and high temperature conditions, we found that only a feeble increase by less than 0.5 log unit in the electrical conductivity of natural barite was observed as the pressure increased from 2.8 to 30.0 GPa at room temperature, as illustrated in Figure 6. However, at a certain pressure, the electrical conductivity of natural barite varies by several orders of magnitude with increasing temperature. Therefore, temperature has a much more pronounced influence on the electrical conductivity of natural barite compared with pressure, which has been extensively reported among other minerals and rocks (Hu et al., 2017; Sun et al., 2017; Hu et al., 2018; Hong et al., 2022).
Based on our high-pressure Raman spectroscopy and electrical conductivity results at room temperature, the emergence of υ5 Raman peak and the discontinuities in the pressure-dependent Raman shifts and FWHM of υ1 Raman peak indicated the occurrence of structural phase transition in natural barite at 18.9 GPa under non-hydrostatic condition, which agrees well with the inflection point in electrical conductivity at 19.2 GPa. Under high temperature and high pressure conditions, we found that the Raman shifts of natural barite exhibited obvious discontinuities in 773, 723, 673, and 523 K at the corresponding pressure points of 10.9, 11.9, 13.2, and 15.5 GPa. Furthermore, the negative correlation between the phase transition temperatures and pressures was confirmed by our electrical conductivity results. Similar phenomena of the remarkable decrease in electrical conductivities at 773, 673, and 623 K were detected at three representative pressure points of 11.5, 12.6, and 15.7 GPa, respectively.
In combination with the high-temperature and high-pressure Raman spectroscopy and electrical conductivity measurements, we concluded that the phase transition pressures decreased as temperatures increased and thus, a negative Clapeyron slope (dP/dT) was acquired for the barite to post-barite phase transition. On the basis of the phase transition temperatures and pressures derived from high-temperature and high-pressure Raman spectra results, a P−T phase diagram over broad temperature and pressure ranges of 298–873 K and 10.9–18.9 GPa was constructed for natural barite, and the phase transition boundary between barite and post-barite was described as P (GPa) = 24.00—0.0166 T (K), as shown in Figure 10. Moreover, the phase diagram obtained in our present study on natural barite was compared with that in previously available study on synthetic barite. Lee et al. (2001); Lee et al. (2003) claimed that synthetic barite transformed into post-barite at 10.0 GPa and atmospheric temperature, and further, the phase boundary of barite and post-barite under high-temperature and high-pressure conditions was determined as 90 K/GPa by virtue of synchrotron X-ray diffraction. As we know, the Clapeyron slope (dP/dT) is closely related to the variations in volumes and entropy before and after the phase transition, and they statifies the following Clapeyron equation: dP/dT = ΔS/ΔV (Lee et al., 2001). Previous synchrotron X-ray diffraction investigations disclosed that there exists an obvious volume contraction of approximately 2% during the barite-to-post-barite phase transition (Lee et al., 2001; Santamaría-Pérez et al., 2011). Therefore, the ΔV is a negative value. Meanwhile, entropy (S) is an important thermodynamic parameter characterizing the disorder of crystal. As usual, an ordered crystal is of a smaller entropy value and a larger entropy value can be obtained for a disordered crystal. At ambient conditions, barite belongs to orthorhombic structure with the space group of Pbnm. Lee et al. (2001) reported that barite transformed into post-barite under high pressure and the post-barite is of triclinic structure. However, subsequent synchrotron X-ray diffraction investigations disclosed that the post-barite belongs to orthorhombic structure with the space group of P212121 (Santamaría-Pérez et al., 2011; Ye et al., 2019). In the above-mentioned two cases, the initial high-symmetry barite transformed into the low-symmetry post-barite under high pressure, and thus, the ΔS is a positive value. In comprehensive consideration of the negative ΔV value and the positive ΔS value, the Clapeyron slope (dP/dT) for the barite to post-barite phase boundary yields a negative value, which agrees well with our acquired phase transition results under high temperature and high pressure conditions.
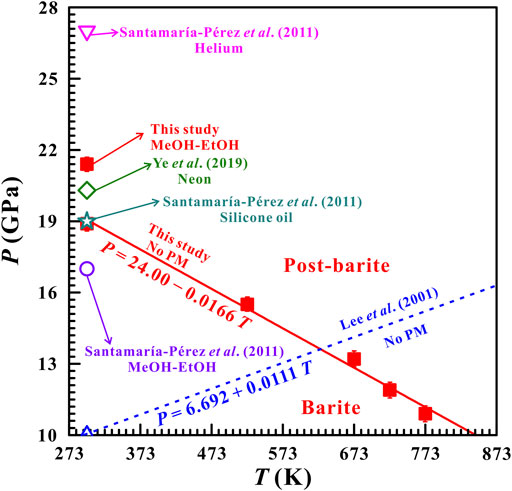
FIGURE 10. Comparisons of the P−T phase diagram obtained from this study and previous investigations from Lee et al. (2001), Santamaría-Pérez et al. (2011), and Ye et al. (2019) with different pressure mediums. The red solid line and the blue dashed line represent the phase transition boundary of barite-to-post-barite obtained from our present result and the result reported by Lee et al. (2001), respectively. In here, MeOH-EtOH stands for the methanol and ethanol mixture (4:1 volume ratio).
It is well known that barite (BaSO4) is isostructural with other barite-group minerals, including celestine (SrSO4) and anglesite (PbSO4), and they share the same orthorhombic crystal systems with the space group of Pbnm under ambient conditions. To our knowledge, there exists huge controversies on the high-pressure phase stability and structural transition pressure for other barite-group minerals until now (Kuang et al., 2017; Li et al., 2018; Ye et al., 2019). Chen et al. (2010) reported that celestite underwent a structural phase transformation at ∼12.0 GPa and atmospheric temperature with the mixture of methanol and ethanol as the pressure medium by means of Raman spectroscopy and synchrotron X-ray diffraction. However, some researchers proposed that celestine remained stable up to 22.2 GPa using neon as the pressure medium (Kuang et al., 2017; Ye et al., 2019). Our results provide a new insight into the causes of the discrepancies in the high-pressure phase stability and structural transition pressure for barite among previous investigations, which may be applied to other barite-group minerals. Additionally, the high-temperature and high-pressure phase diagram of barite-group minerals is still limited. And thus, our acquired phase diagram of natural barite can improve the knowledge about the high-temperature and high-pressure structural and electrical transport characterizations for other barite-group minerals.
Conclusion
Raman spectroscopy and electrical conductivity measurements have been conducted to investigate the structural transition of natural barite under different hydrostatic environments at temperatures of 298–873 K and pressures of 1.5–35.0 GPa using a diamond anvil cell. At room temperature, natural barite underwent a phase transformation at 18.9 GPa under non-hydrostatic condition, which was characterized by the appearance of υ5 Raman peak, the kinks in the pressure-dependent Raman shifts, FWHM of υ1 Raman peak and electrical conductivity. Moreover, the smaller deviatoric stress within the sample chamber is responsible for the higher phase transition pressure of 21.4 GPa under quasi-hydrostatic condition. On the other hand, the phase transition pressures increased from 10.9, 11.9, 13.2, and 15.5 GPa as the temperatures decreased from 773, 723, 673, and 523 K, respectively. Furthermore, the phase boundary between barite and post-barite was established as P (GPa) = 24.00—0.0166 T (K).
Data Availability Statement
The original contributions presented in the study are included in the article/Supplementary Material, further inquiries can be directed to the corresponding authors.
Author Contributions
LD designed the project. MH and LD wrote the initial draft of the work and the final paper. LD, HH, and MH contributed in interpreting the results. MH, XZ, and CL performed and interpreted the high-temperature and high-pressure Raman scattering and electrical conductivity results.
Funding
This research was financially supported by the NSF of China (grant number 42072055), the Youth Innovation Promotion Association of CAS (grant number 2019390), the Special Fund of the West Light Foundation of CAS, Guizhou Provincial 2019 and 2020 Science and Technology Subsidies (grant numbers GZ2019SIG and GZ2020SIG), and as well as the Science and Technology Foundation of Guizhou Province (grant number QKHJZ (2013) 2285).
Conflict of Interest
The authors declare that the research was conducted in the absence of any commercial or financial relationships that could be construed as a potential conflict of interest.
Publisher’s Note
All claims expressed in this article are solely those of the authors and do not necessarily represent those of their affiliated organizations, or those of the publisher, the editors and the reviewers. Any product that may be evaluated in this article, or claim that may be made by its manufacturer, is not guaranteed or endorsed by the publisher.
Acknowledgments
Some kind guidance and helps from Professor Heping Li in the Key Laboratory of High-temperature and High-pressure Study of the Earth’s Interior, Institute of Geochemistry, Chinese Academy of Sciences are obtained for the in-situ high-pressure Raman scattering measurements.
Supplementary Material
The Supplementary Material for this article can be found online at: https://www.frontiersin.org/articles/10.3389/feart.2022.864183/full#supplementary-material
References
Abidi, R., Slim-Shimi, N., Marignac, C., Hatira, N., Gasquet, D., Renac, C., et al. (2012). The Origin of Sulfate Mineralization and the Nature of the BaSO4-SrSO4 Solid-Solution Series in the Ain Allega and El Aguiba Ore Deposits, Northern Tunisia. Ore Geology. Rev. 48, 165–179. doi:10.1016/j.oregeorev.2012.03.003
Antao, S. M. (2012). The crystal Structure of Tin Sulphate, SnSO4, and Comparison with Isostructural SrSO4, PbSO4, and BaSO4. Powder Diffr. 27, 179–183. doi:10.1017/s0885715612000450
Canil, D., and Fellows, S. A. (2017). Sulphide-sulphate Stability and Melting in Subducted Sediment and its Role in Arc Mantle Redox and Chalcophile Cycling in Space and Time. Earth Planet. Sci. LettersPlanet. Sci. Lett. 470, 73–86. doi:10.1016/j.epsl.2017.04.028
Chen, Y.-H., Huang, E., and Yu, S.-C. (2009). High-pressure Raman Study on the Series. Solid State. Commun. 149, 2050–2052. doi:10.1016/j.ssc.2009.08.023
Chen, Y.-H., Yu, S.-C., Huang, E., and Lee, P.-L. (2010). Raman Spectroscopy and X-ray Diffraction Studies on Celestite. Physica B: Condensed Matter 405, 4386–4388. doi:10.1016/j.physb.2010.08.001
Crichton, W. A., Merlini, M., Hanfland, M., and Muller, H. (2011). The crystal Structure of Barite, BaSO4, at High Pressure. Am. Mineral. 96, 364–367. doi:10.2138/am.2011.3656
Evans, K. A., Tomkins, A. G., Cliff, J., and Fiorentini, M. L. (2014). Insights into Subduction Zone Sulfur Recycling from Isotopic Analysis of Eclogite-Hosted Sulfides. Chem. Geology. 365, 1–19. doi:10.1016/j.chemgeo.2013.11.026
Hong, M., Dai, L., Hu, H., and Zhang, X. (2022). Pressure-induced Structural Phase Transitions in Natural Kaolinite Investigated by Raman Spectroscopy and Electrical Conductivity. Am. Mineral. 107, 385–394. doi:10.2138/am-2021-7863
Hu, H., Dai, L., Li, H., Hui, K., and Sun, W. (2017). Influence of Dehydration on the Electrical Conductivity of Epidote and Implications for High-Conductivity Anomalies in Subduction Zones. J. Geophys. Res. Solid Earth 122, 2751–2762. doi:10.1002/2016JB013767
Hu, H., Dai, L., Li, H., Sun, W., and Li, B. (2018). Effect of Dehydrogenation on the Electrical Conductivity of Fe-Bearing Amphibole: Implications for High Conductivity Anomalies in Subduction Zones and continental Crust. Earth Planet. Sci. Lett. 498, 27–37. doi:10.1016/j.epsl.2018.06.003
Kuang, Y. Q., Xu, J. G., Zhao, D. Y., Fan, D. W., Li, X. D., Zhou, W. G., et al. (2017). The High-Pressure Elastic Properties of celestine and the High-Pressure Behavior of Barite-type Sulphates. High Temp.-High Press. 46, 481–495.
Lee, P.-L., Huang, E., and Yu, S.-C. (2003). High-pressure Raman and X-ray Studies of Barite, BaSO4. High Press. Res. 23, 439–450. doi:10.1080/0895795031000115439
Lee, P.-L., Huang, E., and Yu, S.-C. (2001). Phase Diagram and Equations of State of BaSO4. High Press. Res. 21, 67–77. doi:10.1080/08957950108201005
Li, B., Xu, J., Chen, W., Ye, Z., Huang, S., Fan, D., et al. (2018). Compressibility and Expansivity of Anglesite (PbSO4) Using In Situ Synchrotron X-ray Diffraction at High-Pressure and High-Temperature Conditions. Phys. Chem. Minerals 45, 883–893. doi:10.1007/s00269-018-0970-1
Liu, C., Wang, D., and Zheng, H. (2015). In Situ Raman Spectroscopic Study of Barite as a Pressure Gauge Using a Hydrothermal diamond Anvil Cell. Appl. Spectrosc. 70, 347–354. doi:10.1177/0003702815620556
Pu, C., Dai, L., Li, H., Hu, H., Zhuang, Y., Liu, K., et al. (2018). High-pressure Electrical Conductivity and Raman Spectroscopy of Chalcanthite. Spectrosc. Lett. 51, 531–539. doi:10.1080/00387010.2018.1522646
Rekhi, S., Dubrovinsky, L., and Saxena, S. (1999). Temperature-induced Ruby Fluorescence Shifts up to a Pressure of 15 GPa in an Externally Heated diamond Anvil Cell. High Temp.-High Press. 31, 299–305. doi:10.1068/htrt161
Santamaría-Pérez, D., Gracia, L., Garbarino, G., Beltrán, A., Chuliá-Jordán, R., Gomis, O., et al. (2011). High-pressure Study of the Behavior of mineral Barite by X-ray Diffraction. Phys. Rev. B 84, 054102. doi:10.1103/PhysRevB.84.054102
Sun, W., Dai, L., Li, H., Hu, H., Wu, L., and Jiang, J. (2017). Electrical Conductivity of Mudstone (Before and after Dehydration at High P-T) and a Test of High Conductivity Layers in the Crust. Am. Mineral. 102, 2450–2456. doi:10.2138/am-2017-6146
Yang, L., Dai, L., Li, H., Hu, H., Zhuang, Y., Liu, K., et al. (2018). Pressure-induced Structural Phase Transition and Dehydration for gypsum Investigated by Raman Spectroscopy and Electrical Conductivity. Chem. Phys. Lett. 706, 151–157. doi:10.1016/j.cplett.2018.06.007
Ye, Z., Li, B., Chen, W., Tang, R., Huang, S., Xu, J., et al. (2019). Phase Transition and Thermoelastic Behavior of Barite-Group Minerals at High-Pressure and High-Temperature Conditions. Phys. Chem. Minerals 46, 607–621. doi:10.1007/s00269-019-01026-0
Yuan, X., Mayanovic, R. A., and Zhang, G. (2021). Phase Transitions in CaCO3 under Hydrous and Anhydrous Conditions: Implications for the Structural Transformations of CaCO3 during Subduction Processes. Am. Mineral. 106, 1780–1788. doi:10.2138/am-2021-7575
Zhou, H., Wang, M., Ding, H., and Du, G. (2015). Preparation and Characterization of Barite/TiO2Composite Particles. Adv. Mater. Sci. Eng. 2015, 1–8. doi:10.1155/2015/878594
Keywords: natural barite, Raman spectroscopy, electrical conductivity, structural phase transition, hydrostaticity, high temperature, high pressure
Citation: Hong M, Dai L, Hu H, Zhang X and Li C (2022) High-Temperature and High-Pressure Phase Transition of Natural Barite Investigated by Raman Spectroscopy and Electrical Conductivity. Front. Earth Sci. 10:864183. doi: 10.3389/feart.2022.864183
Received: 28 January 2022; Accepted: 11 April 2022;
Published: 27 April 2022.
Edited by:
Nibir Mandal, Jadavpur University, IndiaReviewed by:
Pratik K. Das, University at Buffalo, United StatesPrafulla K. Jha, Maharaja Sayajirao University of Baroda, India
Copyright © 2022 Hong, Dai, Hu, Zhang and Li. This is an open-access article distributed under the terms of the Creative Commons Attribution License (CC BY). The use, distribution or reproduction in other forums is permitted, provided the original author(s) and the copyright owner(s) are credited and that the original publication in this journal is cited, in accordance with accepted academic practice. No use, distribution or reproduction is permitted which does not comply with these terms.
*Correspondence: Lidong Dai, ZGFpbGlkb25nQHZpcC5neWlnLmFjLmNu; Haiying Hu, aHVoYWl5aW5nQHZpcC5neWlnLmFjLmNu