Abstract
The giant prehistoric Seymareh landslide in the Zagros Mountains (Iran) is one of the largest known landslides on the Earth’s surface. The debris with an estimated volume of 44 km3 dammed two rivers, generating three lakes, that persisted for about 3 ka after the event. The post-overflow morphodynamics, characterized by an accelerated and intense stream network erosion, obliterated most of the primary landforms, such as ridges and blocks on the debris surface, making it difficult for scientists to interpret the emplacement kinematics of the landslide. In this regard, a novel spatial statistical approach is proposed here to zone the landslide debris in primary (original) and secondary (modified) regions which are, respectively, attributed to the original shape of the landslide debris and the one reshaped by fluvial erosion. The zonal computation combines the density classes of the mapped primary (ridge and blocks) and secondary (gullies) landforms, according to assumed conditions for representativeness of primary and secondary zones. For validating the model, 62 soil samples taken from the debris surface were classified according to the Unified Soil Classification System standard, and the field density measurements were performed in 28 sites. Based on the classification results, six types of soils were detected, among which 68% of them were ML. The ML samples were aggregated into five subgroups based on their relative proximity, and for each subgroup, four permeability tests were performed. The permeability results demonstrate that the high permeability values are associated with secondary zones, while low values with primary ones, thus confirming the zonation proposed by the statistical approach. The study of the spatial arrangement of the kinematic evidence on the primary landforms allowed to deduce that the landslide was a double-step single event, which infilled a paleo-valley enclosed by two anticline folds. During the emplacement, a part of the debris dissipated its energy over passing the anticlines with divergent directions, NW and NE, while the rest swept back into the Seymareh paleo-valley into the SE direction. The proposed approach represents a promising tool for the detection of primary landforms to assess the emplacement kinematics of landslides.
Introduction
Landslide damming is a relatively common occurrence in mountain areas caused by sediments released from hillslopes that reaches valley floors and choke rivers (Costa and Schuster, 1988; Ermini and Casagli, 2003; Evans et al., 2011; Tacconi Stefanelli et al., 2016; Fan et al., 2017). On the one hand, landslide dam lakes pose serious threats to people and property due to upstream inundation and downstream flooding generated by breaching of such dams, initiation of other landslides, and debris flows (Chen et al., 2011; Evans et al., 2011; Peng and Zhang, 2012; Fan et al., 2017; Zhong et al., 2021). On the other hand, landslide dams represent huge archives for assessing the emplacement kinematics of the debris and for understanding their formation and evolution until the possible failure (Ermini and Casagli, 2003; Dufresne et al., 2010; Dufresne et al., 2016; Tacconi Stefanelli et al., 2016; Fan et al., 2017; Rouhi et al., 2019; Fan et al., 2020; Fan et al., 2021; Mei et al., 2021).
Indeed, they preserve landforms and deposits linked to the landslide event and the post-emplacement dynamics, respectively, attributed to the original shape of the debris and to the one reshaped by other processes, such as fluvial erosion (Crozier, 2010). In this regard, landforms resulting from the past geomorphic processes can stage for the present due to reshaping (Swanson et al., 1988; Dehn et al., 2001). Sparks (1986), Etzelmüller and Sulebak (2000) propose a switch from the process study as the key for understanding landforms to the morphologic description as a key for the assessment of process. Summerfield (1991) emphasizes both the landform and the processes which create the landform as equally important subjects for geomorphology. The author argues the need to think about physical processes and explains how forms are related to them.
Regarding landslide dams, several geomorphological parameters were proposed so far for evaluating their stability, such as valley width, slope angle, and the height of the release area (Nicoletti and Sorriso-Valvo, 1991; Ermini and Casagli, 2003; Tacconi Stefanelli et al., 2016). Nevertheless, the post-dam overflow morphodynamics can obliterate most of the primary landforms, making it difficult for scientists to interpret the emplacement kinematics of the landslide and to understand the dam formation. Indeed, a sudden lowering of the river base level can occur due to the overflow and cause an accelerated and intense stream network erosion reshaping the primary landforms and deposits.
In this regard, here we propose a novel spatial statistical approach for the identification of original (primary) and reshaped (secondary) regions. Such an approach is based on the identification of landforms visible on the debris using remote and field surveying. Afterward, a zonal computation combines the density classes of the mapped primary (ridge and blocks) and secondary (gullies) landforms, according to the assumed conditions for representativeness of primary and secondary zones. We applied the new methodology to the Seymareh landslide debris (Zagros Mts. Iran), which is considered as the largest gravitational instability on the Earth’s surface, with a volume of 44 km3 (Roberts and Evans, 2013; Shoaei, 2014; Delchiaro et al., 2019; Rouhi et al., 2019). The statistical model was validated by field and laboratory tests on soil samples taken from the debris surface. In detail, 63 soil samples were classified according to the USCS standard, and the field density measurements were performed in 26 sites. Based on the classification results, six types of soils were detected on which 12 permeability tests were performed.
The proposed approach allows deducing the landslide emplacement kinematics by the analysis of the spatial arrangement of the kinematic evidence on the primary landforms. For this reason, it represents a promising tool for the scientific community to isolate the original regions to which the landslide hazard and risk reconstruction and the dam stability indexing should be referred.
Regional Geological and Climatic Setting
The Seymareh landslide detached ∼10 ka ago from the NE flank of the Kabir-Kuh fold, blocking the course of Seymareh and Kashan rivers, generating three lakes, namely, Seymareh, Jaidar, and Balmak lakes (Roberts and Evans, 2013; Shoaei, 2014; Delchiaro et al., 2019). The Kabir-Kuh fold is situated in the Lorestan arc, in the NW part of the Zagros Mountains (Vergés et al., 2011; Roberts and Evans, 2013, Delchiaro et al., 2019) (Figure 1). The Lorestan arc is part of one of the most distinctive tectonic units of the belt which is Zagros (or simply) folded belt (Talbot and Alavi, 1996; Stampfli and Borel, 2002; Golonka, 2004; McQuarrie, 2004; Agard et al., 2005; Mouthereau et al., 2012). The sedimentary cover of the unit is composed of 12–14 km of both the passive margin sequence lasting from the Upper Paleozoic to the Late Cretaceous, and the foreland basin from Late Cretaceous to the present (Talbot and Alavi, 1996; Golonka, 2004; McQuarrie, 2004; Agard et al., 2005; Mouthereau et al., 2012). Since it has already been recognized that the structural setting and the rheology of the outcropping formations represented important predisposing factors for the giant Seymareh landslide (Roberts and Evans, 2013; Delchiaro et al., 2019), we referred to the stratigraphic column proposed by James and Wynd (1965) and Alavi (2004) and to the geological maps at the scale of 1:100,000 carried out by the National Iranian Oil Company (NIOC, Setudehnia and Perry, 1967; Takin et al., 1970; Macleod, 1970) (Figure 1). At the bottom of the stratigraphic column, there is the Bangestan Group, composed of the thick carbonate unit of the Sarvak Formation (Cretaceous, thickness; 750 m) and the foredeep facies deposited in the pro-foreland basin (Elyasi et al., 2014) of the Ilam–Surgah Formation (Late Cretaceous, thickness about 250 m). At the top of such a group, there is the Gurpi Formation (Late Cretaceous, thickness about 400 m) consisting of a marly limestone, marl, and hemipelagic shales (Elyasi and Goshtasbi, 2015) containing a hard-calcareous level named Emam Hassan Member (25 m thick). Above the Gurpi Formation, the Pabdeh Formation (late Paleocene-early Oligocene, thickness about 350 m) consists of three members: i) the lower Pabdeh member (150 m thick), which is dominated by marls and shales; ii) the Taleh Zang member (50 m thick), consisting of platform limestone; and iii) the upper Pabdeh member (150 m thick), composed mainly of calcareous marls. The geological succession is completed by the Asmari Formation (Oligocene–Miocene, thickness about 200 m), which creates a stiff calcareous rock level outcropping at the top of the Kabir-Kuh fold. In the synclinal valleys between the Kabir-Kuh fold and the adjacent ones, the Asmari Formation is overlapped by the Miocene–Pliocene Mesopotamian foreland succession (Homke et al., 2004), including i) the Gachsaran Formation (early Miocene -12.3 Ma, thickness about 400 m), composed of salt, anhydrite, marl, and gypsum; ii) the epicontinental sandstones and conglomerates of the Agha Jari Formation (12.3–3 Ma, thickness approximately 1,400 m) and Bakhtiari Formation (3 Ma–early Pleistocene, thickness about 900 m), respectively.
FIGURE 1
From the climatic point of view, we referred to the climate chart of Poldokhtar village (685 m a.s.l.), located in the study area, for the period 1990–2019 based on data from Harris et al. (2020). It describes a cold semi-arid climate (BSk) following the Köppen climate classification. The autumn and winter seasons are the wettest ones, with the highest precipitation in March (77.6 mm), while the summer season is dry and hot. The average temperature of the coldest month (i.e., January) is 4.4°C, and the average summer temperature is above 24°C, with the highest temperature in July that reaches 29.5°C.
The Seymareh Landslide
Different interpretations have been proposed so far by the scientific community to explain the failure mechanism, andthe emplacement kinematics of such an exceptional event and different scenarios have been hypothesized for explaining the induced changes in the landscape.
Harrison and Falcon (1937) provided a general description and the first map of the landslide, its debris area, and two lakes formed after the event, demonstrating that a part of Dufarush-Kuh and Maleh-Kuh are buried under the landslide debris. They also mistakenly recognized the Seymareh rock avalanche as a “landslip.” Later, in Harrison and Falcon (1938), they discussed the landslide debris, the scar, the movement of the debris, and the lakes formed during the event more in detail. Based on some historical evidence, they believed that the landslide occurred more than 2 ka. Moreover, they proposed that the Seymareh landslide was a single event which involved 30 km3 of material. Watson and Wright (1969) characterized the geomorphology and stratigraphy of the debris, discussed the origin of the initial rockslide, and examined the debris avalanche emplacement mechanisms. They also stated that the evidence of large blocks on the surface probably reflects that a thick layer of limestone rock was above other rocks when the slide detached. Roberts and Evans (2013), based on the distribution of limestone rocks in the distal debris, suggested that during the initial failure, the upper plate overrode the lower plates to travel farther. Roberts and Evans (2013) also studied the failure mode and debris morphology and strongly suggested that the Seymareh rock avalanche was an instantaneous single event that traveled NE across the topographic trend of the Zagros Range, providing an estimated radiocarbon bracket age for the event at 9.8–8.71 14C ka, based on the interpretation of three separate radiocarbon ages provided additionally by Griffiths et al. (2001). Yamani et al. (2012) provided some general details on the evolution of the dammed lake drainage, describing a sequence of entrenched lacustrine terraces upstream of the landslide dam. Shoaei (2014) reviewed the possible mechanisms of failure and interpreted the post-failure geomorphic features by analyzing the processes responsible for the formation and erosion of the landslide dams of the Seymareh, Jaidar, and Balmak lakes. He also calculated the longevity of Seymareh and Jaydar lakes by using available annual sedimentation data, discharge of the rivers, and field measurements of the deposits in these lakes.
Quantitative constraints on the river valley evolution before and after the Seymareh landslide occurrence are reported by Delchiaro et al. (2019) that detected lacustrine and river terraces suites and dated with optically stimulated luminescence (OSL) two suites of fluvial terraces (one older and one younger than the Seymareh landslide) and a lacustrine terrace (formed after the temporary landslide damming), to provide time constraints to the main evolutionary stages of the valley before and after the emplacement of the landslide. In particular, Delchiaro et al. (2019) estimated that the Seymareh damming lake persisted for ∼3,500 years before starting to empty at ∼6.6 ka due to lake overflow, as demonstrated by the OSL age obtained for a strath terrace shaped by the Seymareh River on the landslide debris. Moreover, Delchiaro et al. (2020a), Delchiaro et al. (2020b) proposed a quantitative morphometric evaluation and prediction of the catchment-scale suspended sediment yield on the scar area and demonstrated that the erosion rate affecting the landslide after the cut of the landslide dam by the Seymareh River is comparable to the age defined as a time constraint for the emptying of the lake.
Despite a large number of studies about the Seymareh landslide, the complex surface features of the landslide debris were not described yet and the emplacement kinematics, including run-out directions of the avalanche flow, was never detailed so far. Due to the undistinguished original and reshaped regions on the landslide debris, the morphometric landforms were not considered reliable for describing the emplacement kinematics and cutting of the landslide debris (Rouhi et al., 2019).
Materials and Methods
Remote and Field Surveying
The study was carried out first through the analysis and interpretation of remote sensing data, such as Google Earth satellite optical images (CNES/Airbus from 2011 to 2017), aerial photos of Geographical Mapping Organization of Iran (acquired in 1955 and 2002, scale 1:55,000 and 1:40,000), and vector topographic maps (National Cartographic Center of Iran, topographic map of Kuhdasht, scale: 1:25,000) and by a 10-m digital elevation model (DEM) obtained using ArcGIS 10® software package with ANUDEM interpolation algorithm (Hutchinson et al., 2011). The remote study led to the first detection of the landforms used in the statistical analysis (block clusters, ridges, and gullies), and to a preliminary size measurement of the blocks outcropping in the landslide debris.
Field surveys were performed with the purpose of i) cross-checking the landforms previously mapped during the remote study; ii) defining the basal surface of the landslide deposit identifying bedrock outcrops, iii) identifying the location of springs, iv) sampling the landslide debris to perform permeability lab tests, and v) measuring the density of the shallow covers by volumetric techniques.
Statistical Model Building
Definition of Primary and Secondary Landforms
The Seymareh landslide debris is characterized by primary (original) and secondary (reshaped) landforms. They are linked to the erosion processes related to different natural phenomena and differential movement between the landslide debris and the underlying material. Among them, some are clearly related to the internal strain of the landslide debris during the emplacement (i.e., compression ridges and extensional features such as trenches), while others can be related to the reshaping processes following the landslide emplacement (i.e., incised gullies and denudational scarps). In order to identify the primary (preserved) and secondary (reshaped) regions on the landslide debris, we defined a specific association of landforms.
On the one hand, combinations of ridges with no gullies and ridges with blocks on their flanks are interpreted as markers of regions preserving original surface features, that is, the ones related to the landslide event and have not been significantly eroded successively. The presence of blocks with no evidence of ridges is interpreted as typical of the middle and distal areas that are preserved with respect to the original features of the landslide debris. Also, the presence of gullies with blocks inside indicates preserved regions because the formed gullies are not incised, and this means that channeled waters had not the suitable energy to move blocks and carve ridges.
On the other hand, the combination of ridges and gullies in some locations can be interpreted as the result of a reshaping, that is, the ridges are the relict of gully erosion; similarly, the combination of ridges with no blocks on their flanks is evidence that these ridges are formed during the erosion process by overflowing of water from the upstream of landslide dam, torrent or storm, and the presence of gullies with no blocks and ridges are representative of eroded areas. These landform associations are representative of regions where the primary conditions were significantly modified because of channeled and sheet water erosion.
Statistical Analysis
As mentioned before, the generation of ridges, gullies, and blocks is indicative of different kinds of geomorphic processes affecting the landslide surface. Among all the recognized landforms on the landslide debris, specific combinations of presence/absence of ridges, gullies, and blocks at different locations provide clues to distinguish original from reshaped regions on the landslide debris. Therefore, in the current study, primary deformational elements (ridges), secondary landforms (gullies), and blocks (larger than 10 m) have been chosen to be analyzed based on a new statistical approach proposed here.
As a first step, the mean and standard deviation values of lengths of ridges, gullies, and blocks were calculated to be used as a primary criterion for choosing the output raster cells for spatial density calculation. The spatial densities of the ridges, gullies, and blocks were calculated with a defined threshold area of 0.0001 km2 and a neighborhood radius around the output raster cells of 250, 200, and 150 m, for ridges, gullies, and blocks, respectively.
Considering the huge extension of landslide debris area of the Seymareh landslide, the density computation was generalized from 0.0001 to 1 km2 using the Aggregate tool in GIS, which sums the density values of all cells in 1 km2.
Afterward, the reclassification tool has been used to reclassify the density values of each landform type in four classes based on the quantile’s distribution.
To attribute a specific landform association to a primary or secondary region of the landslide debris, the landforms combinations were considered. Four landform associations were defined for recognizing primary regions (“primary conditions”). These conditions are as follows:
P1—Ridges-No Gullies.
P2—Blocks-No Ridges.
P3—Blocks-No Gullies.
P4—Blocks-Ridges.
Similarly, the following associations are selected for the recognition of the regions with secondary regions (“secondary conditions"):
S1—Ridges-Gullies.
S2—Ridges-No Blocks.
S3—Gullies-No Blocks.
S4—Gullies-No Ridges.
Each of these associations is based on the aggregate density zonation of the aforementioned conditions and has three probabilities (high, medium, and low) depending on the class of aggregate density of ridges, gullies, or blocks that contributes to the total (Table 1).
TABLE 1
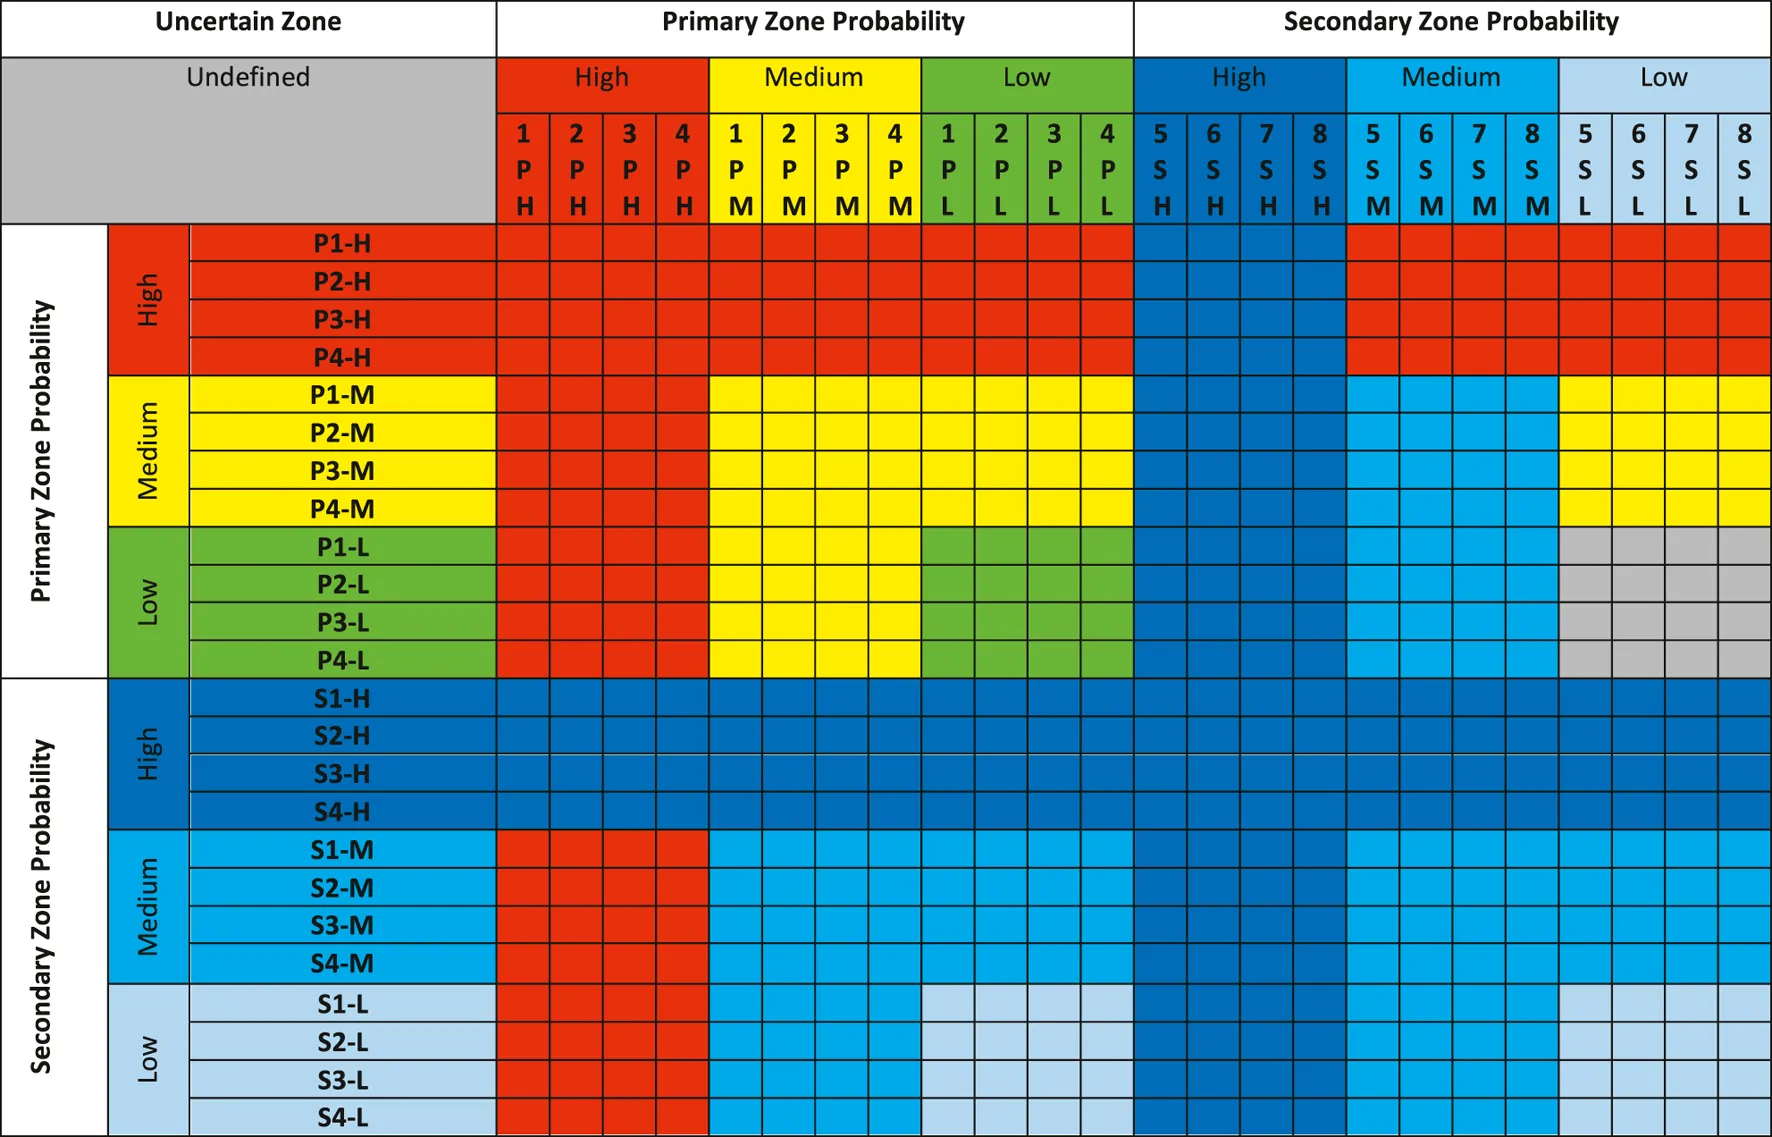 |
Matrix of probability of occurrence of primary and secondary zones on the Seymareh landslide debris.
However, there are some zones of the landslide debris which fit more than one association of landforms and related condition probability.
The probability assigned to these zones is attributed referring to the matrix of probability reported in Table 1. As an example, if a zone matches with more than one primary condition with different probabilities, the zone was considered as the primary zone with the highest possible probability. If a zone matches with both primary and secondary conditions, in the case that both have the same probability, the zone is considered a secondary zone. Otherwise, the zone was considered as the one that has a higher probability. There was only one exception to this criterion: if the probability of both was low because of low reliability, no probability was given to that zone, and it was considered as an uncertain one.
Model Validation
For validating the statistical model, permeability analysis of the fine portion of landslide debris sediments was performed.
To carry out the permeability test in the laboratory, in a first step, a total number of 63 debris matrix samples were taken to classify them according to the Unified Soil Classification System (USCS) standard (ASTM, 2017a). The outcrop of each sampling point was cleaned to a depth of 5 cm and then 1 kg samples were taken.
With this purpose, the grain size analysis was performed, and Atterberg limits were defined. The grain size analysis was carried out following ASTM (2007) recommendations at the Geotechnical Laboratory of Sapienza University. The ASTM 200 sieve passing was characterized with X-ray sedigraphy. The X-ray sedigraph consists of an analyzer unit (SediGraph III by Micromeritics) and a multisampler (MasterTech 52) interfaced by management software. Atterberg limits were measured following ASTM (2017b) recommendations at the Geotechnical Laboratory of Sapienza University.
In order to proceed with the test, it was necessary to measure the in situ density of the debris sediments in order to obtain a reconstituted laboratory sample. Therefore, the rubber balloon method (ASTM, 2015) for measuring the in situ density was used. This test was performed for 28 locations on the landslide debris surface with the values ranging between 1.2 and 1.7 kg/m3 for the finer part of the landslide debris (ASTM 40 sieve passing).
Then, the ML group samples were aggregated into five subgroups based on their relative proximity for performing the permeability tests. To determine the permeability of ASTM 40 sieve passing, various falling head tests were performed using a variable load permeameter, with the laminar flow directed from the bottom to top (ASTM, 2006). It was necessary to reconstitute the samples according to different densities corresponding to different depths for recognizing the variation of permeability with respect to depth. Therefore, assuming a linear relation between stress and density (where the stress at the surface is equal to zero corresponding to the density value of 1.2 kg/m3, increasing up to a maximum of 600 kPa, linearly correlated to the depth and corresponding to the density value of 1.7 kg/m3 and maximum permeable depth).
Geological Cross Sections
Moreover, to reconstruct the paleo-topography buried below the debris inferring insights on the emplacement dynamics of the debris, the geological map of the neighboring areas and 13 cross sections (7 along and 6 across the overall run-out direction) were performed. In particular, for the geological sections we referred to the stratigraphic column proposed by James and Wynd (1965) and Alavi (2004) and to the detailed geological mapping of Kabir-Kuh carried out by the National Iranian Oil Company (NIOC, Setudehnia and Perry, 1967; Takin et al., 1970; Macleod 1970). In addition, field surveys were carried out to define the geometry of the boundary between the bedrock and the landslide debris. For this purpose, bedrock outcrops were identified on which the cross sections were then built. Furthermore, to accurately estimate the landslide debris volume, stratigraphic logs were sampled using AutoCAD from the sections along and across the run-out direction, each 350 and 500 m, respectively, obtaining a total of 524 stratigraphic logs.
Results
Geomorphological Map of Seymareh Landslide Debris
Based on the remote analysis and on the field cross-check, we mapped the main landforms on the landslide debris (Figure 2). It was possible to point out the evidence of gravity-induced landforms such as blocks, ridges, extensional features, denudational scarps as well as fluvial and runoff landforms such as gullies, badlands, and a suite of three orders of strath terraces including a flood plain and springs. As regards the primary and secondary landforms, 1,129 ridges, 1,162 blocks, and 1,162 gullies were mapped (Table 2). The mean lengths are 256, 205, and 15 m, respectively.
FIGURE 2
TABLE 2
| A | |||||||||
|---|---|---|---|---|---|---|---|---|---|
| Ridges | Gullies | Blocks | |||||||
| Total number | 1,129 | 1,162 | 1,162 | ||||||
| Mean length (m) | 256 | 205 | 15 | ||||||
| B | ||
| Ridge density range (km/km2) | Gully density range (km/km2) | Block density range (number of blocks/km2) |
| 0–8 | 0–18.29 | 0–254.64 |
| C | ||
| Aggregate ridge density range (km/km2) | Aggregate gully density range (km/km2) | Aggregate block density range (number of blocks/km2) |
| 0–320.72 | 0–550.18 | 0–4,937 |
| D | |||
| Class | ∑ Ridge density range (km/km2) | ∑ Gullies density range (km/km2) | ∑ Blocks density range (number of blocks/km2) |
| 1 | 0 | 0 | 0 |
| 2 | 0–33.96 | 0–15.1 | — |
| 3 | 33.96–83.01 | 15-1–71.2 | 309.79–910.01 |
| 4 | 83.01–320.72 | 71.2–550.18 | 910.01–4,937.33 |
| E | |||||||
| Association number | — | Association number | — | ||||
| P1 | Aggregate ridge density class | Aggregate gully density class | Primary condition probability | S1 | Aggregate ridge density class | Aggregate gully density class | Secondary condition probability |
| 4 | 1 | High | 4 | 4 | High | ||
| 4 | 2 | Medium | 4 | 3 | Medium | ||
| 3 | 1 | Medium | 3 | 4 | Medium | ||
| 3 | 2 | Low | 3 | 3 | Low | ||
| P2 | Aggregate block density class | Aggregate ridge density class | Primary condition probability | S2 | Aggregate ridge density class | Aggregate block density class | Secondary condition probability |
| 4 | 1 | High | 4 | 1 | High | ||
| 4 | 2 | Medium | 4 | 2 | Medium | ||
| 3 | 1 | Medium | 3 | 1 | Medium | ||
| 3 | 2 | Low | 3 | 2 | Low | ||
| P3 | Aggregate block density class | Aggregate gully density class | Primary condition probability | S3 | Aggregate gully density class | Aggregate block density class | Secondary condition probability |
| 4 | 1 | High | 4 | 1 | High | ||
| 4 | 2 | Medium | 4 | 2 | Medium | ||
| 3 | 1 | Medium | 3 | 1 | Medium | ||
| 3 | 2 | Low | 3 | 2 | Low | ||
| P4 | Aggregate block density class | Aggregate ridge density class | Primary condition probability | S4 | Aggregate gully density class | Aggregate ridge density class | Secondary condition probability |
| 4 | 4 | High | 4 | 1 | High | ||
| 3 | 4 | Medium | 4 | 2 | Medium | ||
| 4 | 3 | Medium | 3 | 1 | Medium | ||
| 3 | 3 | Low | 3 | 2 | Low | ||
a) Total number and mean length of ridges, gullies, and blocks; b) density ranges adopted for ridges, gullies, and blocks; c) the aggregate density ranges each 1 km2 for ridges, gullies, and blocks; d) density range classes for ridges, gullies and blocks; e) probability of landform associations which provide a rank to the attribution of primary or secondary conditions.
Figure 3 shows some examples from the field of primary and secondary zones deduced on the base of landform associations described in the Definition of Primary and Secondary Landforms.
FIGURE 3
Statistical Model
In Table 2, the density value ranges for each landform are reported. The ridge density range is between 0 and 8 km/km2, the gully density range is between 0 and 18.29 km/km2, and the block density range is between 0 and 254.64 km/km2. The aggregate density range is between 0 and 320.72 km/km2, 0–550.18 km/km2, and 0 to 4,937 km/km2, respectively. Figure 4 shows the map of distributions of the landform density (Figures 4A–C) and the map of probability of primary and secondary zones based on the criteria described in the Definition of Primary and Secondary Landforms (Figure 4D). As can be seen in Figure 4A, the highest density of ridges is concentrated in the middle zone of the debris, while at the perimeter, the lowest density occurs. Figure 4B shows that the density of gullies is higher close to the Seymareh River gorge and in the northern part of the debris, while it tends to lower values in the rest of the debris. In Figure 4C, the highest density of blocks occurs along the perimeter of the debris, especially in the northern part, where they outcrop in a wider area, including the middle part. The lowest density is recorded in the area near the Seymareh River gorge. Based on the density distribution of each landform type, we reclassified the values into four classes according to the quantile criterion. In detail, the density classes for ridges, gullies, and blocks are reported in Table 2.
FIGURE 4
Combining the aggregate density zonation (Figures 4A–C) according to the aforementioned conditions, it was possible to compute the probability model of primary and secondary zones (Figure 4D). As reported in Figure 4D, the probability of primary zones is located along the perimeter and in the northern part where the highest density values of blocks and ridges occur. The probability of secondary zones is recorded along the Seymareh River gorge, in correspondence with the highest density of gullies.
Permeability Analysis
The results of USCS classification are shown in Figure 5, while the in situ density results are reported in Figure 6. Based on the obtained results shown in Figures 5, 6, groups of matrix types can be distinguished into high- and low-compressibility silt (MH and ML), clay of low plasticity (CL), sandy silty clay (CL-ML), clayey sand (SC), and silty sand (SM). Fine-grained soils (ML, MH, CL, and CL-ML) are mainly located in the Asmari Formation debris area along the middle and distal portions of the landslide debris, while the coarse-grained (SC and SM) soils are mainly distributed within the debris in the proximity of the detachment area of the Seymareh landslide which is the Pabdeh-Gurpi Formation debris area. However, the ML group constitutes 68% of identified soil types with 42 samples of 62, and for this reason, we chose to focus the analysis on them. In detail, the 42 samples of the ML group were aggregated into five subgroups based on their relative proximity (Figure 7). Moreover, five samples were discarded because of the high amount of matrix likely due to their location close to the scar area.
FIGURE 5
FIGURE 6
FIGURE 7
Regarding the in situ density analysis, field measurements were performed in 28 sites (Figure 6). The density values range from 1.2 to 1.62 kg/m3 and on average 1.43 kg/m3. However, a density of 1.2 kg/m3 was considered as surface density with (σ = 0 KPa) for the permeability analysis because we assumed it was more representative than measurements on other samples where the presence of rocks with higher density biased the total density result.
Then, for each of the five subgroups, four permeability tests were performed with increasing density values that were related to the depth correlated stresses (σ). The maximum value of density reconstructed in the permeameter was 1.7 kg/m3 for σ equal to 600 kPa, which corresponds to a depth of 35.29 m. From this depth, the landslide debris was assumed to be impermeable. Figure 7 represents the plots of the permeability analysis results of Table 3 as a function of the σ, γ, ρ, and H. Figure 7A shows the relationship between γ and σ used for obtaining the relative values of H (Figure 7B). Figures 7C–E report K as a function of γ, σ, and H for each permeability subgroup. In detail, the obtained K values range from 1.25 × 10⁻⁷ to 3.27 × 10⁻⁴ cm/s, from 3.37 × 10⁻⁶ to 4.52 × 10⁻⁴ cm/s, from 4.75 × 10⁻⁶ to 1.56 × 10⁻³ cm/s, from 1.25 × 10⁻⁵ to 2.3 × 10⁻³ cm/s, and from 2.40 × 10⁻⁵ to 6 × 10⁻³ cm/s, respectively, for subgroups 1, 2, 3, 4, and 5. The graph shows a similar behavior in relation to γ, σ, and H among subgroups 1, 2, and between subgroups 4 and 5. Indeed, although K decreases with γ, σ, and H for all the samples, subgroups 1, 2, and 3 intercept the K axis with a lower value in comparison with subgroups 4 and 5.
TABLE 3
| ρ (kg/m3) | γ (kN/m3) | σ (kPa) | H (m) | K (cm/s) | |
|---|---|---|---|---|---|
| Subgroup 1 | 1.7 | 17 | 600 | 35.29 | 1.25 × 10⁻⁷ |
| 1.48 | 14.8 | 336 | 22.70 | 1.00 × 10⁻⁵ | |
| 1.4 | 14 | 240 | 17.14 | 4.64 × 10⁻⁵ | |
| 1.32 | 13.2 | 144 | 10.91 | 3.27 × 10⁻⁴ | |
| Subgroup 2 | 1.57 | 15.7 | 444 | 28.28 | 3.37 × 10⁻⁶ |
| 1.44 | 14.4 | 288 | 20.00 | 2.55 × 10⁻⁵ | |
| 1.36 | 13.6 | 192 | 14.12 | 9.10 × 10⁻⁵ | |
| 1.3 | 13 | 120 | 9.23 | 4.52 × 10⁻⁴ | |
| Subgroup 3 | 1.53 | 15.3 | 396 | 25.88 | 4.75 × 10⁻⁶ |
| 1.42 | 14.2 | 264 | 18.59 | 3.53 × 10⁻⁵ | |
| 1.33 | 13.3 | 156 | 11.73 | 1.81 × 10⁻⁴ | |
| 1.2 | 12 | 0 | 0.00 | 1.56 × 10⁻³ | |
| Subgroup 4 | 1.7 | 17 | 600 | 35.29 | 1.25 × 10⁻⁶ |
| 1.55 | 15.5 | 420 | 27.10 | 5.24 × 10⁻⁵ | |
| 1.44 | 14.4 | 288 | 20.00 | 4.45 × 10⁻⁴ | |
| 1.32 | 13.2 | 144 | 10.91 | 2.30 × 10⁻³ | |
| Subgroup 5 | 1.6 | 16 | 480 | 30.00 | 2.40 × 10⁻⁵ |
| 1.51 | 15.1 | 372 | 24.64 | 8.80 × 10⁻⁵ | |
| 1.42 | 14.2 | 264 | 18.59 | 5.18 × 10⁻⁴ | |
| 1.2 | 12 | 0 | 0.00 | 6.00 × 10⁻³ |
Results of permeability analysis for each subgroup of ML soil.
Paleo-Topography Reconstruction
To reconstruct the paleo-topography beneath the landslide debris, 13 geological cross sections (7 along and 6 across the run-out direction) were built. Among them, two geological cross sections, whose traces are drawn in the map of Figure 1, are reported in Figure 8. The other geological sections and the details related to the landslide debris volume computation are reported in the Supplementary Material.
FIGURE 8
As can be observed in section A of Figure 8, oriented SW-NE, the topography beneath the landslide basal surface does not follow the anticline–syncline structure. Indeed, the topographic depocenter, as the relative lowest elevation point along the section, is not located in correspondence of the synclinal axis. Instead, it lies right next to the current course of the river, 2 km toward SW with respect to the same axis. Moreover, at the core of the syncline, there is the Agha Jari Formation with thickness greater than 500 m. From section B of Figure 8, oriented NW-SE, the Agha Jari Formation outcrops in the most NW part of the profile, reaching a thickness of almost 500 m.
Discussion
Statistical Zonation of the Landslide Debris: New Insights on Emplacement Kinematics
The mechanisms of paleo-landslides are generally difficult to be studied and interpreted since there are not enough data available from the period before the landslide event (e.g., Shoaei 2014; Pánek and Klimeš, 2016) and on damming landslide debris, original and reshaped surface landforms can outcrop extensively (Dewitte and Demoulin, 2005; Magnarini et al., 2019; Pánek et al., 2020; Magnarini et al., 2021). Original primary landforms are linked to the landslide emplacement and kinematics, while secondary reshaped landforms are associated with the run-off and fluvial erosion (Crozier, 2010). Different types of surface features can be recognized on the landslide debris, such as ridges, gullies, denudation scarps, and blocks (Parise, 2003; Rouhi et al., 2019; Pánek et al., 2020). The spatial associations of ridges, gullies, and blocks on the Seymareh landslide debris offer the opportunity to study the relationship between these features and the processes that formed them. Through the statistical model proposed in this research, it was possible to distinguish primary (original) and secondary (reshaped) zones on the landslide debris (Figure 9). By analyzing the primary landforms (ridges and blocks) on the original zones of the landslide debris (Figure 9), it was possible to understand the landslide emplacement kinematics, as they provide insights for the zonation of debris in sectors characterized by different stress configurations. So far, little attention has been given to the Seymareh landslide debris as a possible indicator of its emplacement kinematics after the slope collapse (Roberts and Evans, 2013; Shoaei, 2014). To this aim, the ridge curvature and azimuthal direction were measured. As shown in Figure 9A, kinematic arrows, deduced from the ridge orientation analysis only in the primary zones, show two main orientations, NE-SW and NW-SE, which agree with the proposed emplacement kinematics of the Seymareh landslide debris by Shoaei (2014). The block distribution also revealed that a back and forward motion involved the landslide debris during its emplacement, as the huge blocks are distributed not only along the front of the landslide mass but also in its middle zone, where the Chenareh-Kuh ridge is expected to be buried. This evidence allows us to confirm what has already been stated in the previous studies (Harrison and Falcon, 1937; Watson and Wright, 1969; Roberts, 2008; Roberts and Evans, 2013; Shoaei, 2014) that a part of the Chenareh-Kuh and Halush-Kuh anticlines in front of Kabir-Kuh are buried under the landslide debris. It means that during landslide debris emplacement a part of the debris stopped against the topographic obstacles sweeping back into the Seymareh paleo-valley, and another part with higher energy overpassed these two anticlines.
FIGURE 9
The recognition of the ridges on the surface of the Seymareh landslide debris allowed the identification of three distinct directions of the rock avalanche debris propagation during its emplacement (Figure 9B). A possible correlation among the different movement directions and zones of the landslide debris related to a specific regime of mass emplacement introduced in the literature can also be identified (Dufresne et al., 2010; Dufresne, 2012; Longchamp et al., 2016). The first zone (ZA) is in the middle area of the debris and reflects the extension regime during mass emplacement. The ridges in this zone have longer distances from each other and are perpendicular to the run-out direction. The second zone (ZB) of the landslide mass testifies the compression affecting this area during debris emplacement. The ridges in this zone are close to each other with a tendency to become parallel to the run-out direction. The third zone (ZC) is located in the distal margins of the landslide debris which reflects shearing and has ridges both parallel and perpendicular to the run-out direction. The results show that the largest ridges are in the medial (and eastern) zone, changing into smaller ridges in the distal part (Dufresne et al., 2010).
The morphology of the paleo-valley of the Seymareh landslide, reconstructed based on the field evidence collected for this research, allows locating the topographic depocenter of the valley close to the actual position of the Seymareh River course. Moreover, the distribution of the kinematic indicators extracted from ridges direction and the block location is consistent with the position of the depocenter of the Seymareh valley before the landslide emplacement. This paleo-morphology indicates that the paleo-Seymareh River was flowing to the NE of the present river gorge which agrees with Roostai et al. (2018). In detail, the confluence between Seymareh and Kashkan occurred at the toe of the collapsed slope, as suggested also by Shoaei (2014). Furthermore, the estimated volume of the landslide debris (43.97 km3, details are reported in the Supplementary Material) calculated by the reconstruction of paleo-valley morphology is in good accordance with the estimated volume of the debris by Roberts and Evans (2013), which shows the high accuracy of reconstructed paleo-morphology of the Seymareh landslide debris area in the current research.
Validation of Statistical Model: New Insights on the Lake Overflow
As it can be seen in Figure 10, the landslide debris is divided into three zones with different permeability values which fit very well with the primary and secondary zonation. It also confirms the deduced kinematics of the debris emplacement. The NE zone where the debris overpassed Chenareh-Kuh and swept back to the paleo-valley has a higher permeability value with respect to the zone where the debris emplaced in the NW direction. Moreover, we can interpret the dynamics of the lake overflow. Through the statistical approach proposed in this research, it was possible to recognize the zones with reshaped surface features. As an example, the results show that the statistical approach correctly recognized the secondary zones on the landslide debris corresponding to the current Seymareh River location. By comparing the direction of the gullies in the secondary zones with the results of the permeability test, it was possible to validate the statistical model and provide a better interpretation to the movement process which terminated the landslide dam cutting. Indeed, the distribution of gullies in the SW part of the debris mainly has a direction between 0 and 90°. In particular, that part corresponds to the area of the landslide debris with the Pabdeh–Gurpi Formation; while gullies on the left side of the river are between 90–180° which are perpendicular to the other side of the river. This area is the boundary between Pabdeh–Gurpi and Asmari Formations debris with several springs distributed along the contact between the landslide debris and its basement. Based on the results of permeability laboratory tests, a non-negligible change in the debris permeability can be observed within the landslide debris and related to the upper part of the debris in the Asmari Formation area. There is another change of the permeability related to the intersection of the Asmari Formation and Pabdeh Gurpi Formation. Moreover, it can be deduced that the surface erosion of the debris by gullies in combination with the change of the permeability and springs distribution along with the contact between the landslide debris basement from basement led to the cutting of the Seymareh landslide dam.
FIGURE 10
Comparison With Other Case Studies From Literature
Different morphological parameters control the emplacement mechanism, kinematics, and behavior of landslide dams (Ermini and Casagli, 2003; Tacconi Stefanelli et al., 2016; Rouhi et al., 2019). The parameters describing the geomorphology of the valley such as valley width, slope angle, and the height of the release area exert control on the emplacement mechanism and kinematics of the landslide deposit (Ermini and Casagli, 2003; Tacconi Stefanelli et al., 2016; Rouhi et al., 2019), and indirectly control the likelihood of landslide dam formation (Nicoletti and Sorriso-Valvo, 1991).
Landslide dams can be characterized by morphological parameters such as the size and shape of the depositional feature (Tacconi Stefanelli et al., 2015). In the case of cut landslide dams, the size, shape, and distribution of features on their surface help to forecast the cutting process. Some authors, by extracting the geomorphic parameters of landslide dams, conducted inventories for some countries in the world. The interpretation of landslide dam failure is a complex topic because of the numerous variables involving the hydrodynamic interference between landslides, rivers, and dam creation at the same time.
Numerous attempts have been made to investigate the complex behavior of the landslide dams. Some authors using landslide dams’ inventories, proposed some geomorphic indexes (Swanson et al., 1988; Ermini and Casagli, 2003; Coico et al., 2013; Dal Sasso et al., 2014) to predict the formation and evolution of landslide dams. These indexes result from the composition of two or more morphological attributes that characterize the landslide (e.g., landslide volume or length) and the involved river valley (e.g., valley width). They proved that these indexes could be a useful tool for making accurate predictions concerning the stability of landslide dams. Nash (2003) took into consideration the block size and proposed Modified Dimensionless Blockage Index (MDBI) and showed that the average block size (D50) of the dam material exerts significant influence on dam longevity and evolution. Recently, Tacconi Stefanelli et al. (2016) to overcome some limitations of other indexes, introduced two new ones: The Morphological Obstruction Index (MOI) and the Hydromorphological Dam Stability Index (HDSI) and analyzed about 300 landslide dam events extended all over Italy. The newly proposed indexes (Tacconi Stefanelli et al., 2016) show an improvement in the forecasting effectiveness and have the advantage of being based on morphometric input parameters that can be easily and quickly assessed in a distributed way even over large areas. These indexes consider mainly geomorphic variables characterizing both the landslide (e.g., landslide volume or length) and the river channel (e.g., valley width) to understand the key parameters controlling the stability and evolution of landslide dams, and to use them for providing a better modified geomorphic index. Generally, the stability and evolution of a landslide dam should be assessed based on numerical simulations or an experimental model (Chen et al., 2011). In most cases, numerous accurate parameters and materials are not easily accessible; therefore, for an immediate evaluation of landslide dams’ stability, geomorphic valley parameters and morphometric dam parameters should be analyzed (Jakobsen, 2016). A comprehensive formula or approach for assessing the behavior of landslide dams should consider all parameters related to the landslide, landslide dam, and river.
Furthermore, the analysis of morpho-structural features related to the debris of rockslides and rock avalanches provides new insights into their emplacement kinematics and failure mechanism (Dufresne and Davies, 2009; De Blasio, 2014; Esposito et al., 2014; Longchamp et al., 2016; Wang et al., 2018; Rouhi et al., 2019). Although the scientific community has focused heavily on landslide dams in various parts of the world, their evolution and behavior have not been completely understood. In this regard, the new statistical approach presented in this study represents a new tool for the recognition and distinction of original and reshaped regions, allowing to investigating the emplacement kinematics of landslide debris.
Conclusion
In this study, surface landforms, such as ridges, gullies, and blocks, are identified on the Seymareh landslide debris using remote and field surveying. Then, a novel spatial statistical approach is proposed to zone the landslide debris in primary (original) and secondary (modified) regions which are, respectively, attributed to the original shape of the landslide debris and to the one reshaped by fluvial erosion.
Based on the model results, it was possible to discuss the emplacement kinematics of the landslide recognizing three different regimes during the mobility of the debris: extensional, compressional, and shearing. As it resulted from this analysis, the Seymareh landslide collapsed toward two main directions, NW and NE. Moreover, a part of the landslide debris during emplacement overpassed the Chenareh-Kuh and Halush-Kuh, and the rest of the debris swept back to the Seymareh paleo-valley.
For validating the model, permeability tests were performed on soil samples taken from the debris surface, previously classified according to the USCS standard. The results of permeability tests combined with the field density measurements performed in 28 sites on the landslide debris allow us to divide the debris into three different zones with different permeability degrees. The obtained zonation is consistent with the results of the statistical model, that is, the high permeability values are associated to secondary zones while low values to primary ones.
The statistical approach used in this study could be applied to debris of other rock avalanches for better understanding the dynamics of their emplacement. Moreover, further studies, such as a complete grain size analysis of the debris taking into account the obtained landslide zonation into primary and secondary areas, should account for more comprehensive evaluation of the stability and cutting of these landslide dams as a multi-hazard research perspective.
Statements
Data availability statement
The data for reproducing the results of the analysis are stored in a supporting information zip folder on Zenodo (doi:10.5281/zenodo.5970316).
Author contributions
JR and MiD performed field surveying and the geological cross sections and wrote the original draft of the manuscript; JR performed the laboratory tests; MaD supervised the geomorphological data collection and analysis; and SM supervised the engineering-geological data collection and analysis. All the authors contributed to the data interpretation and to the manuscript editing.
Funding
The research was funded by the project “Integrated analysis and hazard-oriented modeling of large scale slope instabilities featured by Mass Rock Creep” of Prof. Carlo Esposito (Grant number RG11916B88FA477F) and carried out as part of the PhDs of JR and MiD in Earth Sciences at Sapienza University of Rome.
Acknowledgments
We wish to thank Luigi Marino for his help in carrying out the laboratory experiments. We appreciate the chief of the Forest, Range and Watershed Organization of Pol-e-Dokhtar, Eng. Shahram Mir Rezai, and Eng. Soleimani for their great support and collaboration both during the fieldwork and in the acquisition of some Iranian data sources. We thank Maryam Dehbozorgi, who provided several images from geological surveys and mineral exploration of Iran and sent them to us. We are also grateful to Francesco Sdao and Giulia Bossi for their comments and suggestions on the manuscript, as well as to the editorial work by the Guest Editor Monica Ghirotti.
Conflict of interest
The authors declare that the research was conducted in the absence of any commercial or financial relationships that could be construed as a potential conflict of interest.
Publisher’s note
All claims expressed in this article are solely those of the authors and do not necessarily represent those of their affiliated organizations, or those of the publisher, the editors, and the reviewers. Any product that may be evaluated in this article, or claim that may be made by its manufacturer, is not guaranteed or endorsed by the publisher.
Supplementary material
The Supplementary Material for this article can be found online at: https://www.frontiersin.org/articles/10.3389/feart.2022.869391/full#supplementary-material
References
1
AgardP.OmraniJ.JolivetL.MouthereauF. (2005). Convergence History across Zagros (Iran): Constraints from Collisional and Earlier Deformation. Int. J. Earth Sci. (Geol Rundsch)94 (3), 401–419. 10.1007/s00531-005-0481-4
2
AlaviM. (2004). Regional Stratigraphy of the Zagros Fold-Thrust belt of Iran and its Proforeland Evolution. Am. J. Sci.304 (1), 1–20. 10.2475/ajs.304.1.1
3
ASTM (2015). Standard D2167-15, Standard Test Method for Density and Unit Weight of Soil in Place by the Rubber Balloon Method. West Conshohocken, PA: ASTM International. Available at: www.astm.org. 10.1520/D2167-15
4
ASTM (2006). Standard D2434-68(2006), Standard Test Method for Permeability of Granular Soils (Constant Head) (Withdrawn 2015). West Conshohocken, PA: ASTM International. Available at: www.astm.org. 10.1520/D2434-68R06
5
ASTM (2017a). Standard D2487-17, Standard Practice for Classification of Soils for Engineering Purposes (Unified Soil Classification System). West Conshohocken, PA: ASTM International. Available at: www.astm.org. 10.1520/D2487-17
6
ASTM (2007). Standard D422-63(2007) e2, Standard Test Method for Particle-Size Analysis of Soils (Withdrawn 2016). West Conshohocken, PA: ASTM International. Available at: www.astm.org. 10.1520/D0422-63R07E02
7
ASTM (2017b). Standard D4318-17e1, Standard Test Methods for Liquid Limit, Plastic Limit, and Plasticity Index of Soils. West Conshohocken, PA: ASTM International. Available at: www.astm.org. 10.1520/D4318-17E01
8
ChenX. Q.CuiP.LiY.ZhaoW. Y. (2011). Emergency Response to the Tangjiashan Landslide-Dammed Lake Resulting from the 2008 Wenchuan Earthquake, China. Landslides8 (1), 91–98. 10.1007/s10346-010-0236-6
9
CoicoP.CalcaterraD.De PippoT.GuidaD. (2013). “A Preliminary Perspective on Landslide Dams of Campania Region, Italy,” in Landslide Science and Practice (Berlin, Heidelberg: Springer), 83–90. 10.1007/978-3-642-31319-6_12
10
CostaJ. E.SchusterR. L. (1988). The Formation and Failure of Natural Dams. Geol. Soc. America Bull.100 (7), 1054–1068. 10.1130/0016-7606(1988)100<1054:tfafon>2.3.co;2
11
CrozierM. J. (2010). Landslide Geomorphology: An Argument for Recognition, with Examples from New Zealand. Geomorphology120 (1-2), 3–15. 10.1016/j.geomorph.2009.09.010
12
Dal SassoS. F.SoleA.PascaleS.SdaoF.Bateman PinzònA.MedinaV. (2014). Assessment Methodology for the Prediction of Landslide Dam hazard. Nat. Hazards Earth Syst. Sci.14 (3), 557–567. 10.5194/nhess-14-557-2014
13
De BlasioF. V. (2014). Friction and Dynamics of Rock Avalanches Travelling on Glaciers. Geomorphology213, 88–98. 10.1016/j.geomorph.2014.01.001
14
DehnM.GärtnerH.DikauR. (2001). Principles of Semantic Modeling of Landform Structures. Comput. Geosciences27 (8), 1005–1010. 10.1016/S0098-3004(00)00138-2
15
DelchiaroM.Della SetaM.MartinoS.DehbozorgiNozaemM. R.NozaemR. (2019). Reconstruction of River valley Evolution before and after the Emplacement of the Giant Seymareh Rock Avalanche (Zagros Mts., Iran). Earth Surf. Dynam.7, 929–947. 10.5194/esurf-7-929-2019
16
DelchiaroM.MeleE.Della SetaM.MartinoS.MazzantiP.EspositoC. (2020b). “Quantitative Investigation of a Mass Rock Creep Deforming Slope through A-Din SAR and Geomorphometry,” in Workshop on World Landslide Forum. Editors VilímekV.WangF.StromA.SassaK.BobrowskyP. T.TakaraK. (Cham: Springer), 165–170. 10.1007/978-3-030-60319-9_18
17
DelchiaroM.RouhiJ.Della SetaM.MartinoS.NozaemR.DehbozorgiM. (2020a). “The Giant Seymareh Landslide (Zagros Mts., Iran): A Lesson for Evaluating Multi-Temporal Hazard Scenarios,” in The SpringerNature Book “Applied Geology”. Editors De MaioM.TiwariA. (Cham: Springer), 209–225. 10.1007/978-3-030-43953-8_13
18
DewitteO.DemoulinA. (2005). Morphometry and Kinematics of Landslides Inferred from Precise DTMs in West Belgium. Nat. Hazards Earth Syst. Sci.5 (2), 259–265. 10.5194/nhess-5-259-2005
19
DufresneA.BösmeierA.PragerC. (2016). Sedimentology of Rock Avalanche Deposits - Case Study and Review. Earth-Science Rev.163, 234–259. 10.1016/j.earscirev.2016.10.002
20
DufresneA.DaviesT. R. (2009). Longitudinal Ridges in Mass Movement Deposits. Geomorphology105 (3-4), 171–181. 10.1016/j.geomorph.2008.09.009
21
DufresneA.DaviesT. R.McSaveneyM. J. (2010). Influence of Runout-Path Material on Emplacement of the Round Top Rock Avalanche, New Zealand. Earth Surf. Process. Landforms35 (2), 190–201. 10.1002/esp.1900
22
DufresneA. (2012). Granular Flow Experiments on the Interaction with Stationary Runout Path Materials and Comparison to Rock Avalanche Events. Earth Surf. Process. Landforms37 (14), 1527–1541. 10.1002/esp.3296
23
ElyasiA.GoshtasbiK.SaeidiO.TorabiS. R. (2014). Stress Determination and Geomechanical Stability Analysis of an Oil Well of Iran. Sadhana39 (1), 207–220. 10.1007/s12046-013-0224-3
24
ElyasiA.GoshtasbiK. (2015). Using Different Rock Failure Criteria in Wellbore Stability Analysis. Geomechanics Energ. Environ.2, 15–21. 10.1016/j.gete.2015.04.001
25
ErminiL.CasagliN. (2003). Prediction of the Behaviour of Landslide Dams Using a Geomorphological Dimensionless index. Earth Surf. Process. Landforms28 (1), 31–47. 10.1002/esp.424
26
EspositoC.Di LuzioE.Scarascia MugnozzaG.Bianchi FasaniG. (2014). Mutual Interactions between Slope-Scale Gravitational Processes and Morpho-Structural Evolution of Central Apennines (Italy): Review of Some Selected Case Histories. Rend. Fis. Acc. Lincei25 (2), 151–165. 10.1007/s12210-014-0348-3
27
EtzelmüllerB.SulebakJ. R. (2000). Developments in the Use of Digital Elevation Models in Periglacial Geomorphology and Glaciology. Physische Geographie41, 35–58.
28
EvansS. G.DelaneyK. B.HermannsR. L.StromA.Scarascia-MugnozzaG. (2011). “The Formation and Behaviour of Natural and Artificial Rockslide Dams; Implications for Engineering Performance and Hazard Management,” in Natural and Artificial Rockslide Dams. Editors EvansS.HermannsR.StromA.Scarascia-MugnozzaG. (Berlin, Heidelberg: Springer), 1–75. 10.1007/978-3-642-04764-0_1
29
FanX.DufresneA.Siva SubramanianS.StromA.HermannsR.Tacconi StefanelliC.et al (2020). The Formation and Impact of Landslide Dams - State of the Art. Earth-Science Rev.203, 103116. 10.1016/j.earscirev.2020.103116
30
FanX.DufresneA.WhiteleyJ.YunusA. P.SubramanianS. S.OkekeC. A. U.et al (2021). Recent Technological and Methodological Advances for the Investigation of Landslide Dams. Earth-Science Rev.218, 103646. 10.1016/j.earscirev.2021.103646
31
FanX.XuQ.van WestenC. J.HuangR.TangR. (2017). Characteristics and Classification of Landslide Dams Associated with the 2008 Wenchuan Earthquake. Geoenviron Disasters4 (1), 12. 10.1186/s40677-017-0079-8
32
GolonkaJ. (2004). Plate Tectonic Evolution of the Southern Margin of Eurasia in the Mesozoic and Cenozoic. Tectonophysics381 (1-4), 235–273. 10.1016/j.tecto.2002.06.004
33
GriffithsH. I.SchwalbA.StevensL. R. (2001). Evironmental Change in Southwestern Iran: the Holocene Ostracod Fauna of Lake Mirabad. The Holocene11 (6), 757–764. 10.1191/09596830195771
34
HarrisI.OsbornT. J.JonesP.ListerD. (2020). Version 4 of the CRU TS Monthly High-Resolution Gridded Multivariate Climate Dataset. Sci. Data7 (1), 109. 10.1038/s41597-020-0453-3
35
HarrisonJ. V.FalconN. L. (1938). An Ancient Landslip at Saidmarreh in Southwestern Iran. J. Geology. 46 (3, Part 1), 296–309. 10.1086/624654
36
HarrisonJ. V.FalconN. L. (1937). The Saidmarreh Landslip, South-West Iran. Geographical J.89, 42–47. 10.2307/1786990
37
HomkeS.VergesJ.GarcesM.EmamiH.KarpuzR. (2004). Magnetostratigraphy of Miocene-Pliocene Zagros Foreland Deposits in the Front of the Push-E Kush Arc (Lurestan Province, Iran). Earth Planet. Sci. Lett.225 (3–4), 397–410. 10.1016/j.epsl.2004.07.002
38
HutchinsonM. F.XuT.SteinJ. A. (2011). Recent Progress in the ANUDEM Elevation Gridding Procedure. Geomorphometry2011, 19–22. 10.1002/osp4.29
39
JakobsenV. U. (2016). An Empirical Approach for Determining the Evolution and Behavior of Rockslide dams.-Development of an Empirical Tool Based on Geomorphic Parameters of Rockslide Dams and Impounded Valleys to Predict Future Rockslide Dam Heights and Their Relative Longevity. Master's thesis. Trondheim, Norway: NTNU stands for Norwegian University of Science and Technology.
40
JamesG. A.WyndJ. G. (1965). Stratigraphic Nomenclature of Iranian Oil Consortium Agreement Area. AApG Bull.49 (12), 2182–2245. 10.1306/a663388a-16c0-11d7-8645000102c1865d
41
LongchampC.AbellanA.JaboyedoffM.ManzellaI. (2016). 3-D Models and Structural Analysis of Rock Avalanches: the Study of the Deformation Process to Better Understand the Propagation Mechanism. Earth Surf. Dynam.4 (3), 743–755. 10.5194/esurf-4-743-2016
42
MacleodJ. H. (1970). Kabir Kuh, 1:100000 Geological Map. Iran Oil Operating Companies. Tehran: Geological Exploration Division.
43
MagnariniG.MitchellT. M.GorenL.GrindrodP. M.BrowningJ. (2021). Implications of Longitudinal Ridges for the Mechanics of Ice-Free Long Runout Landslides. Earth Planet. Sci. Lett.574, 117177. 10.1016/j.epsl.2021.117177
44
MagnariniG.MitchellT. M.GrindrodP. M.GorenL.SchmittH. H. (2019). Longitudinal Ridges Imparted by High-Speed Granular Flow Mechanisms in Martian Landslides. Nat. Commun.10 (1), 1–7. 10.1038/s41467-019-12734-0
45
McQuarrieN. (2004). Crustal Scale Geometry of the Zagros Fold-Thrust Belt, Iran. J. Struct. Geology. 26 (3), 519–535. 10.1016/j.jsg.2003.08.009
46
MeiS.ChenS.ZhongQ.ShanY. (2021). Effects of Grain Size Distribution on Landslide Dam Breaching-Insights from Recent Cases in China. Front. Earth Sci.9, 245. 10.3389/feart.2021.658578
47
MouthereauF.LacombeO.VergésJ. (2012). Building the Zagros Collisional Orogen: Timing, Strain Distribution and the Dynamics of Arabia/Eurasia Plate Convergence. Tectonophysics532-535, 27–60. 10.1016/j.tecto.2012.01.022
48
NashT. R. (2003). Engineering Geological Assessment of Selected Landslide Dams Formed from the 1929 Murchison and 1968 Inangahua Earthquakes. Thesis. Christchurch, New Zeland: University of Canterbury. Geological Science. 10.26021/6643
49
NicolettiP. G.Sorriso-ValvoM. (1991). Geomorphic Controls of the Shape and Mobility of Rock Avalanches. Geol. Soc. America Bull.103 (10), 1365–1373. 10.1130/0016-7606(1991)103<1365:gcotsa>2.3.co;2
50
PánekT.KlimešJ. (2016). Temporal Behavior of Deep-Seated Gravitational Slope Deformations: A Review. Earth-Science Rev.156, 14–38. 10.1016/j.earscirev.2016.02.007
51
PánekT.SchönfeldtE.WinocurD.BřežnýM.ŠilhánK.ChalupaV.et al (2020). Moraines and Marls: Giant Landslides of the Lago Pueyrredón valley in Patagonia, Argentina. Quat. Sci. Rev.248, 106598. 10.1016/j.quascirev.2020.106598
52
PariseM. (2003). Observation of Surface Features on an Active Landslide, and Implications for Understanding its History of Movement. Nat. Hazards Earth Syst. Sci.3 (6), 569–580. 10.5194/nhess-3-569-2003
53
PengM.ZhangL. M. (2012). Breaching Parameters of Landslide Dams. Landslides9 (1), 13–31. 10.1007/s10346-011-0271-y
54
RobertsN. J. (2008). Structural and Geologic Controls on Gigantic (> 1 Gm3) Landslides in Carbonate Sequences: Case Studies From the Zagros Mountains, Iran and Rocky Mountains, Canada. Master's thesis, University of Waterloo
55
RobertsN. J.EvansS. G. (2013). The Gigantic Seymareh (Saidmarreh) Rock Avalanche, Zagros Fold-Thrust Belt, Iran. J. Geol. Soc.170 (4), 685–700. 10.1144/jgs2012-090
56
RoostaiSh.Azimi-RadS.MokhtariD.HejaziA.YamaniM. (2018). Morphometry of the Seymareh Landslide and Reconstruction of its Landform Effects in Late Quaternary (Zagros Mountains in Iran). Hydrogeomorphology4 (16), 119–138. (Published in Persian).
57
RouhiJ.DelchiaroM.Della SetaM.MartinoS. (2019). Emplacement Kinematics of the Seymareh Rock-Avalanche Debris (Iran) Inferred by Field and Remote Surveying. Ital. J. Eng. Geology. Environ. Spec. Issue.1, 1–6. 10.4408/IJEGE.2019-01.S-16
58
SetudehniaA.PerryJ. T. O. B. (1967). Dal Parri. 1:100000 Geological Map. Iran Oil Operating Companies. Tehran: Geological Exploration Division.
59
ShoaeiZ. (2014). Mechanism of the Giant Seimareh Landslide, Iran, and the Longevity of its Landslide Dams. Environ. Earth Sci.72 (7), 2411–2422. 10.1007/s12665-014-3150-8
60
SparksB. W. (1986). Geomorphology. Essex, UK: Longman Group.
61
StampfliG. M.BorelG. D. (2002). A Plate Tectonic Model for the Paleozoic and Mesozoic Constrained by Dynamic Plate Boundaries and Restored Synthetic Oceanic Isochrons, Earth. Planet. Sc. Lett.196 (1), 17–33. 10.1016/S0012-821X(01)00588-X
62
SummerfieldM. A. (1991). Global Geomorphology: An Introduction to the Study of Landforms. Harlow, UK: Longman.
63
SwansonF. J.KratzT. K.CaineN.WoodmanseeR. G. (1988). Landform Effects on Ecosystem Patterns and Processes. BioScience38 (2), 92–98. 10.2307/1310614
64
Tacconi StefanelliC.CataniF.CasagliN. (2015). Geomorphological Investigations on Landslide Dams. Geoenviron Disasters2 (1), 1–15. 10.1186/s40677-015-0030-9
65
Tacconi StefanelliC.SegoniS.CasagliN.CataniF. (2016). Geomorphic Indexing of Landslide Dams Evolution. Eng. Geology. 208, 1–10. 10.1016/j.enggeo.2016.04.024
66
TakinM.AkbariY.MacleodJ. H. (1970). Pul-E Dukhtar. 1:100000 Geological Map. Iran Oil Operating Companies. Tehran: Geological Exploration Division.
67
TalbotC. J.AlaviM. (1996). The Past of a Future Syntaxis across the Zagros. Geol. Soc. Lond. Spec. Publications100 (1), 89–109. 10.1144/GSL.SP.1996.100.01.08
68
VergésJ.GoodarziM. G. H.EmamiH.KarpuzR.EfstathiouJ.GillespieP. (2011). “Multiple Detachment Folding in Pusht-E Kuh Arc, ZagrosRole of Mechanical Stratigraphy,” in Thrust Fault-Related Folding: AAPG Memoir 94. Editors McClayK.ShawJ.SuppeJ. (American Association of Petroleum Geologists), 69–94. 10.1306/13251333M942899
69
WangF.DaiZ.OkekeC. A. U.MitaniY.YangH. (2018). Experimental Study to Identify Premonitory Factors of Landslide Dam Failures. Eng. Geology. 232, 123–134. 10.1016/j.enggeo.2017.11.020
70
WatsonR. A.WrightH. E. (1969). The Saidmarreh Landslide, Iran. United States Contributions to Quaternary Research; Papers Prepared on the Occasion of the VIII Congress of the International Association for. Quat. Res. Paris, France123, 115–140. 10.1130/SPE123-p115
71
YamaniM.GoorabiA.AzimiradS. (2012). Large Seymareh Landslide and Lake Terraces Sequence. Phys. Geogr. Res. Q.44, 43–60. 10.22059/JPHGR.2012.30241
72
ZhongQ.WangL.ChenS.ChenZ.ShanY.ZhangQ.et al (2021). Breaches of Embankment and Landslide Dams - State of the Art Review. Earth-Science Rev.216, 103597. 10.1016/j.earscirev.2021.103597
Summary
Keywords
landslide kinematics, landslide emplacement, Seymareh landslide, statistical model, Zagros Mountains, Lorestan arc, Iran
Citation
Rouhi J, Delchiaro M, Della Seta M and Martino S (2022) New Insights on the Emplacement Kinematics of the Seymareh Landslide (Zagros Mts., Iran) Through a Novel Spatial Statistical Approach. Front. Earth Sci. 10:869391. doi: 10.3389/feart.2022.869391
Received
04 February 2022
Accepted
15 March 2022
Published
09 May 2022
Volume
10 - 2022
Edited by
Monica Ghirotti, University of Ferrara, Italy
Reviewed by
Francesco Sdao, University of Basilicata, Italy
Giulia Bossi, Institute for Geo-Hydrological Protection (IRPI), Italy
Updates
Copyright
© 2022 Rouhi, Delchiaro, Della Seta and Martino.
This is an open-access article distributed under the terms of the Creative Commons Attribution License (CC BY). The use, distribution or reproduction in other forums is permitted, provided the original author(s) and the copyright owner(s) are credited and that the original publication in this journal is cited, in accordance with accepted academic practice. No use, distribution or reproduction is permitted which does not comply with these terms.
*Correspondence: Javad Rouhi, javad.rouhi@uniroma1.it
This article was submitted to Environmental Informatics and Remote Sensing, a section of the journal Frontiers in Earth Science
Disclaimer
All claims expressed in this article are solely those of the authors and do not necessarily represent those of their affiliated organizations, or those of the publisher, the editors and the reviewers. Any product that may be evaluated in this article or claim that may be made by its manufacturer is not guaranteed or endorsed by the publisher.