 Pengfei Qi
 Jucai Chang
- School of Mining Engineering, Anhui University of Science and Technology, Huainan, China
The problem of low digging efficiency and mining imbalance due to outdated digging technology and low degree of equipment intelligence has long existed in coal mine roadway excavation work. Lithology identification is the key to the intelligence of roadheading equipment. Accurate lithology identification significantly affects the automatic control of roadheader cutting conditions. Completing the identification of lithology in the process of rock wall cutting by a roadheader involved the following steps: building a tunneling experiment platform, making four rock specimens with different lithologies, completing the tunneling simulation experiments on four lithologies, obtaining current sensor data of four lithologies cutting, and finally proposing an intelligent lithology identification method of PSO-VMD-LSSVM. The research results show that the particle swarm algorithm (PSO) optimized the variational modal decomposition (VMD) with minimum envelope information entropy as the fitness function can realize the adaptive decomposition of the current signal of truncated motors. The signal reconstruction can increase the signal-to-noise ratio of the current signal by selecting the eigenmodal components according to the energy density and correlation coefficient criterion. The multi-scale fuzzy entropy is used as the eigenvector of the reconstructed current signal as the fuzzy entropy of different lithology cut-off motor currents has better differentiation at different scales. The least-squares support vector machine (LSSVM) is used to classify the feature vectors processed by custom decomposition parameter VMD and gives a recognition rate of 87.5%. The recognition rate increases to 97.5% for the feature vectors processed by PSO-VMD. The particle swarm algorithm optimizes the noise reduction via VMD to effectively improve the lithology recognition rate. The research results can provide a methodological reference for rock property recognition during rock cutting by a roadheading machine.
Introduction
Coal mining mainly involves underground mining, and several underground roadways are required to ensure continuous and efficient coal production. As the key technology of coal mine roadway, rapid roadway digging is directly related to the economy and safety of coal mine production, an important guarantee for high and stable coal production. Yin studied the damage characteristics of rocks, mainly based on semi-rock or whole rock, under the action of dynamic and static coupling to improve the safety of deep mining (Yin et al., 2019). Methods to avoid the overlying rock layers being affected by mining to prevent accidents were studied by analyzing mining techniques and the mechanical properties of rocks (Du et al., 2020a). Extensive research has been conducted to minimize the impact of mining and ensure the safety and efficiency of coal production (Yin et al., 2012). However, reducing the impact of mining using roadway boring machines must be studied to minimize blasting vibrations and ensure a high degree of safety even with continuous rapid digging. Roadheader excavation has gradually become the main method of roadway mining, but safe and efficient roadheading technology is still in the exploration stage. In the process of excavation, cut-off rock wall properties change drastically. However, the roadheader driver cannot promptly adjust the cut-off speed, cantilever swing speed, and other conditions according to the cut-off lithology because of limited vision due to excessive coal and rock dust. These limitations lead to unstable output of cutting motor, excessive wear of cut-off teeth, abnormal collapse of working face, thus significantly impacting mining, accelerating the damage and aging of the digging equipment, and affecting the safety of digging the working face. Therefore, if the rock properties can be identified in the excavation, the efficiency of excavation can be improved, the service life of the excavator can be prolonged, the safety of excavation can be guaranteed, and the impact on the working face can be reduced.
The problem of rock identification has been extensively studied since it was introduced in the 1960s (Li and Ouyang, 2017; Yang et al., 2020). There are two main methods classified according to the means used: direct detection and indirect detection. The direct detection methods are as follows: 1. The natural ray method (Wang S. et al., 2021) uses the ray intensity remaining after the ray penetrates the coal seam and determines the thickness of the top and bottom coal seams according to the attenuation law to achieve the purpose of identifying lithology. However, this method is difficult to operate and has a small adaptation range (K., H, Sampath et al., 2019); 2. The radar detection method (Wang et al., 2016) determines the top coal thickness based on the characteristics of the speed, phase, propagation time of the reflected electromagnetic wave and the frequency of the emitted wave. This method is applicable only if large differences exist in the coal and rock properties as the recognition rate is low if the coal and rock properties are similar. 3. Infrared detection method (Zhang et al., 2022) uses a highly sensitive infrared temperature sensor to measure the temperature difference change of the truncated part. The lithology is identified after applying algorithm classification and artificial ray detection methods (Zhang et al., 2017). In addition to these methods, there are terahertz spectroscopy methods (Wang et al., 2018). Direct detection methods are susceptible to environmental, terrain, and working conditions due to direct contact with different lithologies. These methods are also limited by low tolerance, small application range, minimal feature extraction effects, and low recognition accuracy.
Indirect electric parametric detection is an indirect detection method. It uses image detection (Gao et al., 2021; Wang and Zhang, 2020; Wang X. et al., 2021) and was used in the early 20th century in the United Kingdom and the United States. It has re-emerged now due to the development of artificial intelligence and lithology recognition methods. Different lithology pictures are analyzed using modern image detection techniques to identify the lithology. However, the method is susceptible to working surface dust, light, and other conditions. Rocks exhibit certain electrical properties such as cutting force (Dai, 2020), current (He et al., 2020), and working voltage (Wang et al., 2018). The acceleration sensor (Zhang et al., 2020) and acoustic emission sensor (Du et al., 2020b) also show different readings. These properties can form the basis for distinguishing different lithologies. This method has the advantages of strong anti-interference ability, wide application range, clear feature extraction, and fast recognition. Moreover, current acquisition requires only the placement of the current sensor at the truncation motor, which is easy to perform with little modification to the machine. In this paper, the current signal is processed and used to identify rock lithology.
A simulated excavation experiment platform is built to simulate the cutting process and obtain the current sensor data of the excavator working on different lithologies to realize the identification of rock properties while cutting rock walls to improve the excavation efficiency. The current data are firstly decomposed by adaptive variational modal decomposition and the components are reconstructed according to the energy density and correlation coefficient criterion, Next, the multi-scale fuzzy entropy is used as the current signal feature vector. Finally, the least-squares support vector machine (LSSVM) is used to classify the features to achieve the purpose of identifying different lithologies.
Research on Lithology Identification Methods
Variational Modal Decomposition
Variational modal decomposition (VMD) is a nonlinear signal processing method that determines the center frequency and bandwidth of each component by iteratively searching the variational model in the optimal solution to achieve the effective separation of each signal component. VMD can highlight the local characteristics of the data.
The constrained variational model constructed by the VMD algorithm is (Dragomiretskiy and Zosso, 2013):
Where
To solve the variational problem, the model is converted into an unconstrained variational solution by introducing Lagrange multipliers
Then the multiplier alternating direction method is used to search for the extended Lagrangian expression, and the updated equation for each modal component
If the following equation, with
Combined with the above VMD decomposition process, there are four main parameters: decomposition mode number
Particle Swarm Algorithm Optimized Variational Modal Decomposition
The particle swarm algorithm (Kennedy and Eberhart, 1995; Eberhart and Kennedy, 2002) is a population-based evolutionary algorithm. The core idea of the algorithm is that each feasible solution is considered a “particle” and all solutions are scales of particles, each of which has an adaptation value determined by the fitness function. Each particle also has a velocity that determines its position and direction. These particles are updated iteratively in the solution space following the optimal particle value gbest and the individual extreme value pbest, and finally converge to the optimal solution. The velocity and position update is performed as follows:
where
The number of decomposition modes
The minimum value of envelope information entropy of
Signal Reconstruction
When decomposing the current signal using PSO-optimized VMD, the sampling rate may be insufficient, and spurious intrinsic mode function (IMF) components may occur. This problem is addressed by combining energy density and correlation coefficient to reconstruct the components of the current signal truncated from different lithology acquisitions. The steps are as follows.
1) Perform energy analysis on the four components obtained and calculate the energy density of each IMF:
where Ek is the energy density of the
2) Analysis of the correlation between the IMF component and the cutting current signal.
The average energy of the IMF components of the intercepted current signals of the four lithologies multiplied by the correlation coefficient. The three IMF components with the largest product are selected and superimposed to reconstruct the simulated current signals of the four lithologies.
Feature Extraction
The relevant features, such as the input for recognition, need to be extracted from the reconstructed current signal. Multi-scale fuzzy entropy is based on fuzzy entropy with the addition of scale factors. The fuzzy entropy value of the same time series under different scale factors, which can effectively overcome the defects of single-scale fuzzy entropy value, is used to measure the possible abrupt changes of time series to effectively measure the nonlinearity and complexity changes of the current signal. The algorithm description of multi-scale fuzzy entropy is:
1) Construct a new coarse-grained vector
Where
2) Fuzzy entropy solutions of all time series
Rockiness Identification
The LSSVM is an improvement of the support vector machine, using equations instead of inequality constraints, and applying the linear least-squares criterion to the optimization of the loss function to improve the convergence efficiency, with the following process (Fu et al., 2021):
1) The training data set
where
2) According to the structural risk minimization criterion,
Where
3) Construction of Lagrangian function
Here
4) Find the partial differential for
where
In lithology identification with LSSVM, the choice of kernel function significantly influences the identification performance of LSSVM. It is known from the literature that the prediction accuracy of radial basis kernel function is higher (Jiang et al., 2016); hence, the radial basis kernel function is chosen as the kernel function of LSSVM in this paper.
Where
The flow chart of PSO-VMD-LSSVM based lithology identification method is shown in Figure 1.
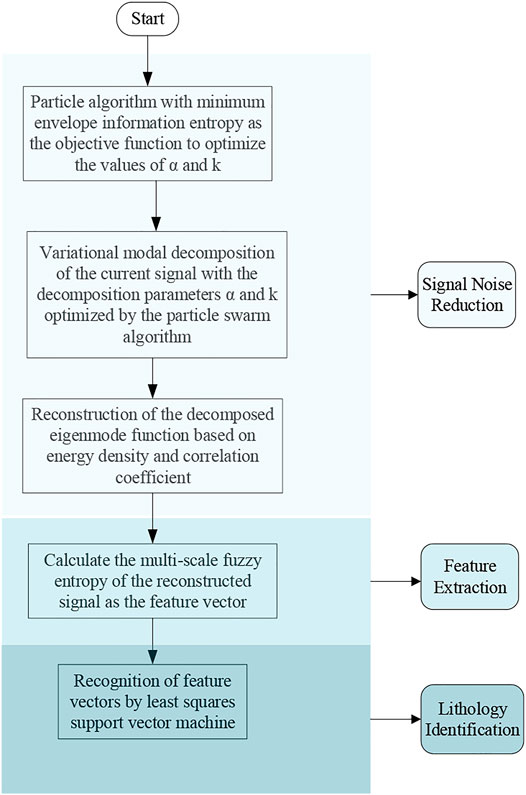
FIGURE 1. Flow chart of PSO-VMD-LSSVM algorithm.
Cut-Off Motor Current Signal Acquisition
Experimental Platform for Simulating Roadheading
As shown in Figure 2, the roadheading experimental platform, mainly comprising the propulsion system, the cutting system, and the signal acquisition system, was built to obtain the current sensor data of the roadheader under different lithology cutting work. The propulsion system comprises a 0.75 kW servo motor as the cutting propulsion motor and two slide rails as the walking guide. The cutting system uses a 1.5 kW, 60:1 reduction ratio gear motor with a frequency converter to control the cutting drilling speed. A cutting head of the roadheader with equal proportional reduction is used as the cutting tool for cutting different rock properties. The signal acquisition system uses 1.4 J LT series three-phase AC sensor; the output is analog with a range: 0 ∼ 5 V and response time is under 1 ms. LabJack T7-PRO data acquisition card, used to collect the analog output of the current sensor, is connected to the upper computer; the upper computer processes and analyzes the collected current data.
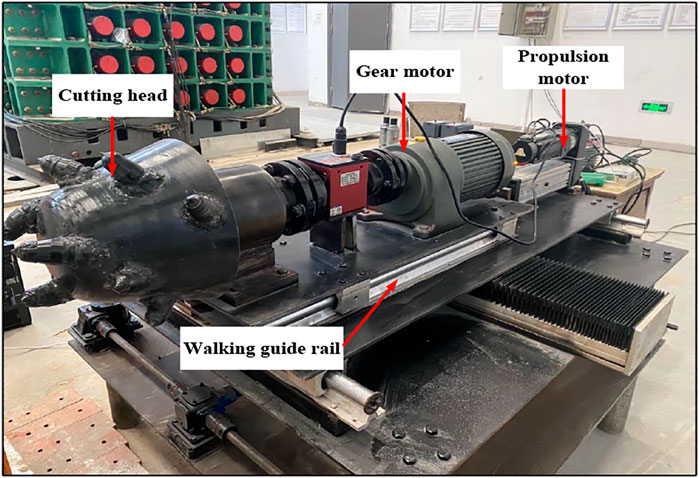
FIGURE 2. Diagram of the tunneling experiment platform.
Lithology Specimen Production
When studying the damage process, the damage of rocks is related to the force and the different rock properties (Du et al., 2020c), and the difference of compressive strength, density, and elastic modulus of similar materials can be used as a basis for different lithologies (Liu et al., 2020). In this paper, four specimen blocks with four different lithologies were prepared with four different ratios to realize the identification of lithology in the process of cutting off rocks wall using a roadheader. We selected quartz sand as the aggregate, cement and gypsum as the cementing material, and borax as an additive, collectively in four ratios (Shi et al., 2015). After weighing, mixing, compacting, resting, and air-drying, four similar simulated specimens with different lithologies were prepared as shown in Figure 3; the ratios of the four lithologies and rock mechanical properties are shown in Table 1.
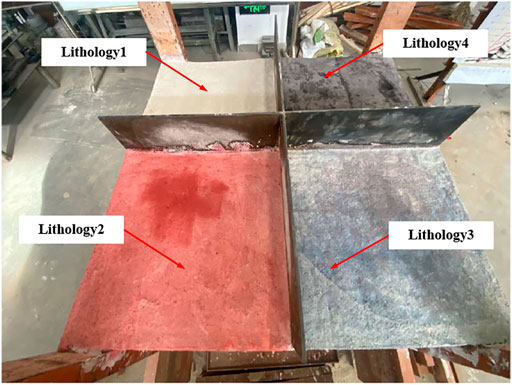
FIGURE 3. Four similar simulated specimens.
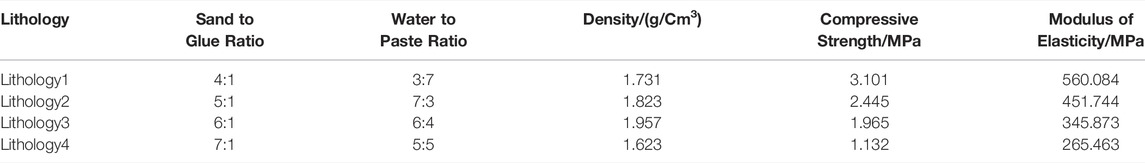
TABLE 1. Four types of ratios and rock mechanical properties.
As seen from Table 1, the mastic sand ratio plays a major role in controlling the uniaxial compressive strength and elastic modulus of similar materials; these quantities decrease significantly with the increase of the mastic sand ratio. The density, compressive strength, and elastic modulus of similar materials made with the selected four ratios are uniformly large and different. Thus, the simulated specimens can represent four kinds of lithologies.
Digging Simulation Experiment
After the four pieces of specimens were left to air-dry and stabilize, the tunneling simulation experiment was carried out for the four specimen blocks with different lithologies by controlling the reducer motor parameters; the cutting head was rotated at a speed of 10 r/min and the propulsion motor at a propulsion speed of 0.5 m/min, as shown in Figure 4.
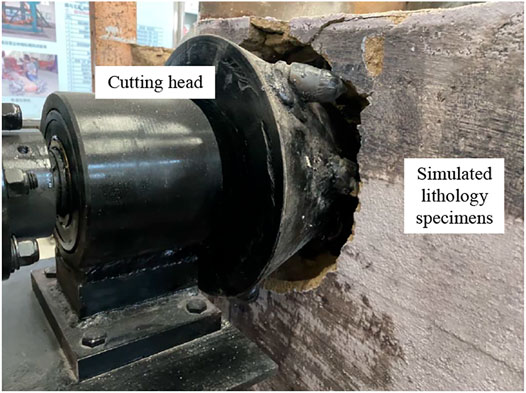
FIGURE 4. Diagram of tunneling simulation experiment.
As shown in Figure 4, the four roadheader cut-off motor currents were obtained by conducting the tunneling simulation experiments on the four simulated rock specimens of different lithologies, using 2048 sampling points. The results of the cut-off motor current sampling for cut-off lithology 1 are shown in Figure 5.
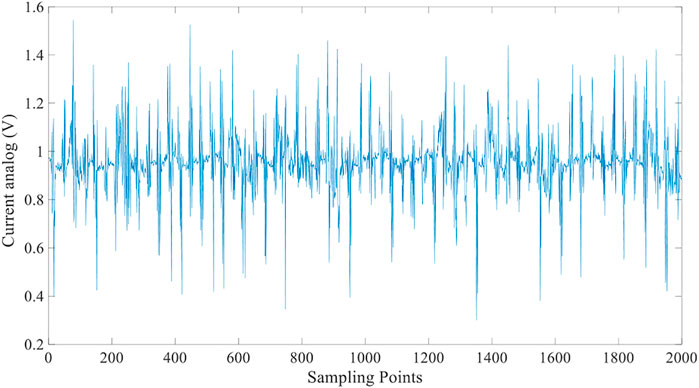
FIGURE 5. Cut-off lithology 1 cut-off motor current sampling graph.
Experimental Results and Discussion
To verify the effectiveness of adaptive modal decomposition, the current signal of the truncated motor on lithology 1 working steadily for 4s, is first subjected to variable modal decomposition with custom decomposition parameters. The input parameters are chosen as follows: decomposition modal number
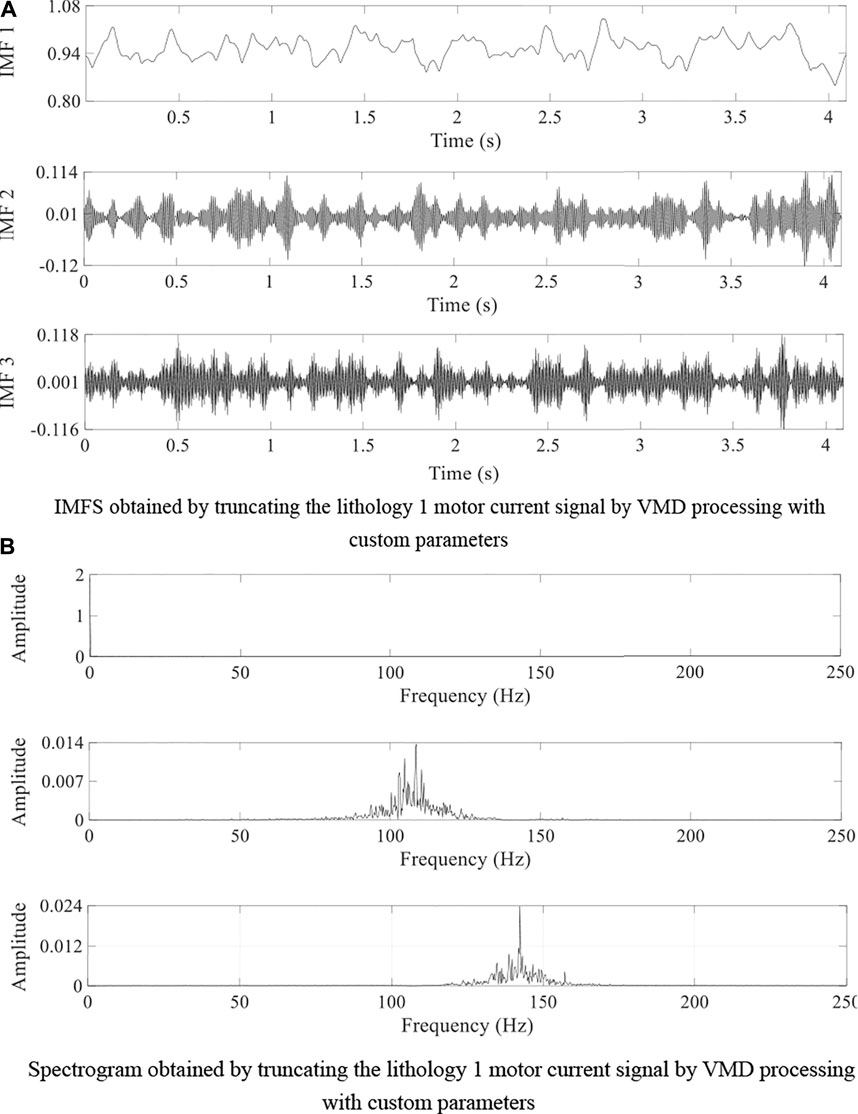
FIGURE 6. VMD with custom parameters to process the truncated lithology 1 motor current signal graph. (A) IMFs obtained by truncating the lithology 1 motor current signal by VMD processing with custom parameters (B) Spectrogram obtained by truncating the lithology 1 motor current signal by VMD processing with custom parameters.
As seen in Figure 6, using VMD with custom decomposition parameters will lead to no decomposition results at frequencies 0–70 Hz, incomplete signal decomposition, modal mixing at 114–138 Hz as the main frequency separation is not complete because the signal mainly contains the frequency signal and is not completely decomposed. Therefore, the particle swarm algorithm with the minimum envelope information entropy as the fitness function is used to optimize the selection of the parameters of the variational modal decomposition. The parameters of the particle swarm algorithm are initialized to the following values: dimension of particles,
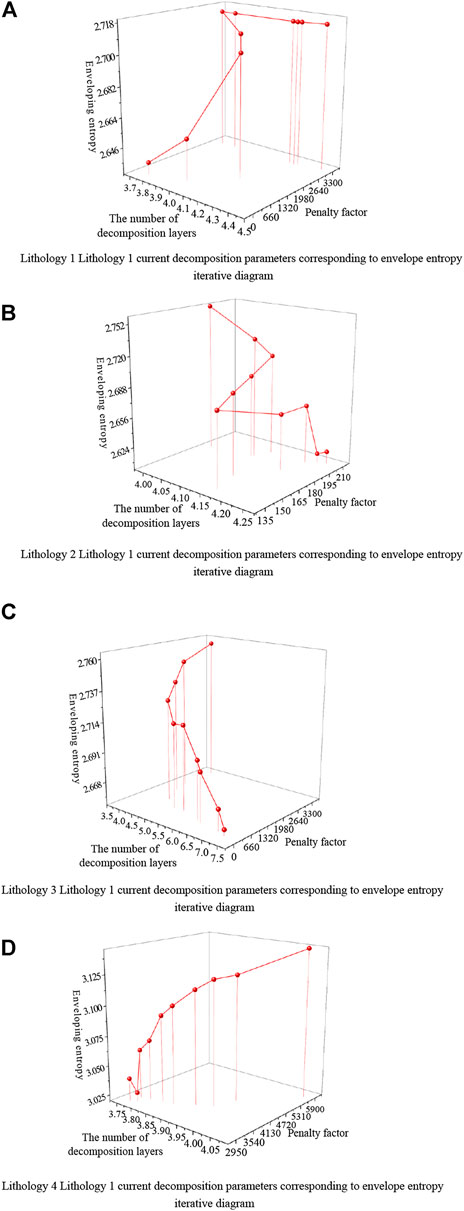
FIGURE 7. Truncation current decomposition parameters corresponding to the iterative process of envelope entropy. (A) Lithology 1 Lithology 1 current decomposition parameters corresponding to envelope entropy iterative diagram (B) Lithology 2 Lithology 1 current decomposition parameters corresponding to envelope entropy iterative diagram (C) Lithology 3 Lithology 1 current decomposition parameters corresponding to envelope entropy iterative diagram (D) Lithology 4 Lithology 1 current decomposition parameters corresponding to envelope entropy iterative diagram.
As seen in Figure 7, using PSO to optimize the VMD parameter selection first uses the envelope entropy as the objective function to randomly select the decomposition modal number
The variable modal decomposition of the cutter motor current signal after the particle swarm algorithm optimizes the value of the excavator under the four different lithologies is shown in Figure 8.
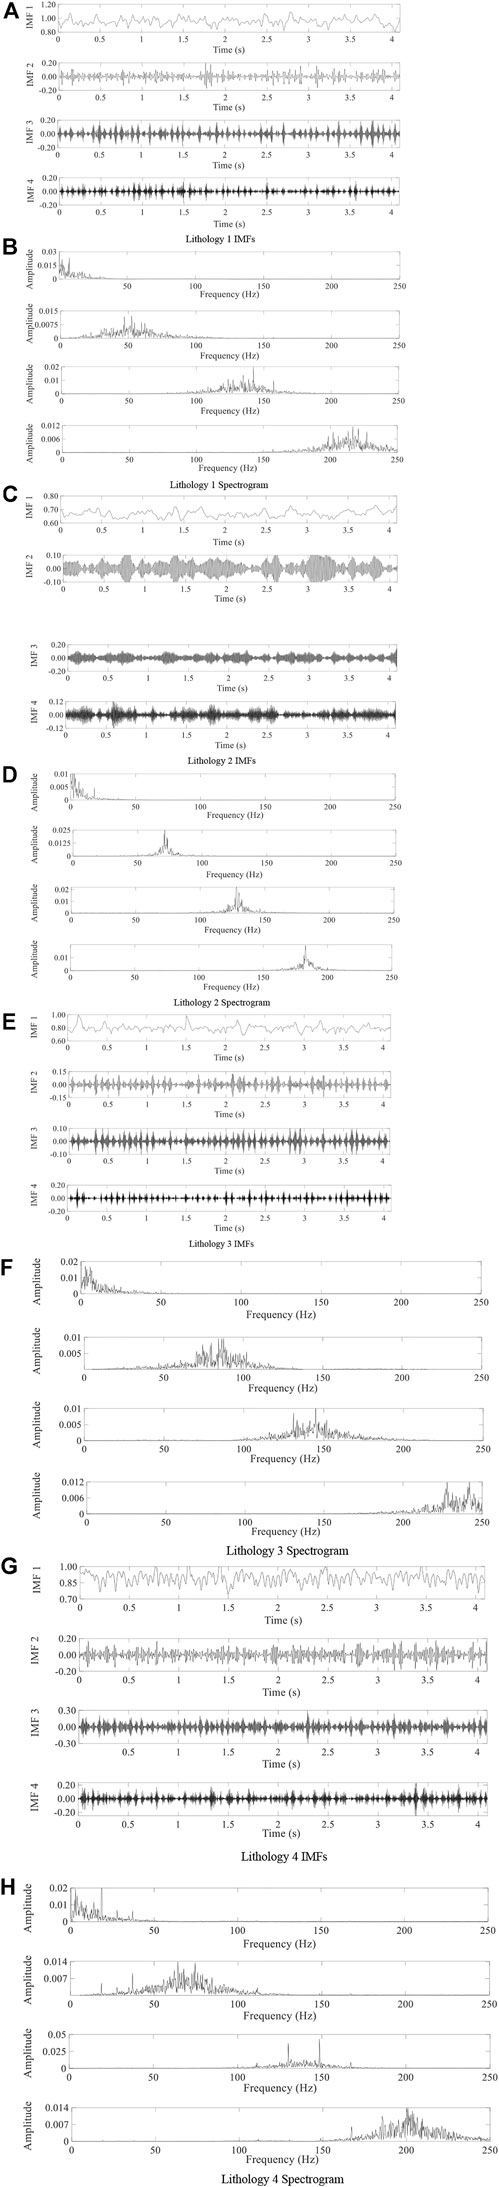
FIGURE 8. Results of truncated motor current signal decomposition of PSO-VMD for four lithologies. (A) Lithology 1 IMFs (B) Lithology 1 Spectrogram (C) Lithology 2 IMFs (D) Lithology 2 Spectrogram (E) Lithology 3 IMFs (F) Lithology 3 Spectrogram (G) Lithology 4 IMFs (H) Lithology 4 Spectrogram.
As seen from the above figure, the PSO-VMD determines the optimal decomposition parameters modal number
The results of calculating the average energy density and correlation coefficient for the decomposed current signal eigenmode function are shown in Tables 2, 3.

TABLE 2. Truncated motor current signal IMF component average energy density table.
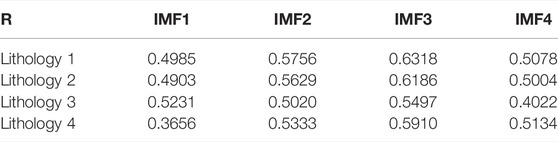
TABLE 3. Truncated motor current signal IMF component correlation coefficient table.
The average energy of the IMF components of the current signals of the four lithologies are correspondingly multiplied by the average energy. The three IMF components with the largest product are superimposed to reconstruct the current analog signals of the four lithologies. The signal-to-noise ratio before and after signal reconstruction is shown in Table 4.

TABLE 4. Signal-to-noise ratio comparison before and after signal reconstruction.
The PSO-VMD reconstructs the eigenmodes based on the correlation coefficient and energy density to reduce the noise of the original truncated current signal (Liang et al., 2021).
After noise reduction of the current signal, multi-scale fuzzy entropy is calculated, with the scale factor set to 8 and the similarity tolerance limit of 0.15. Fifty sets of 8-scale fuzzy entropy are taken for each of the current signals truncated on the four lithologies to obtain a total of 200 sets of 8-scale fuzzy entropy. Part of the 8-scale fuzzy entropy is shown in Figure 9.
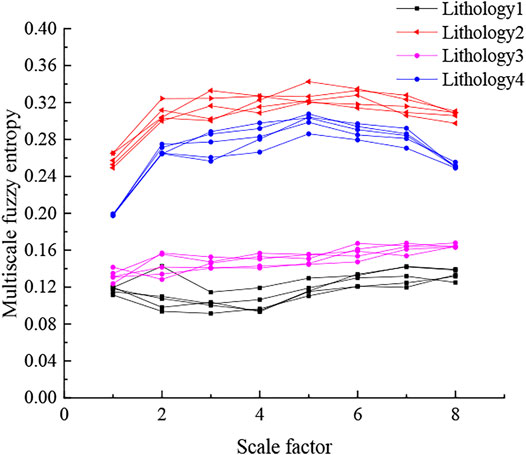
FIGURE 9. Fuzzy entropy values of the four current reconstruction signals with scale factor.
As seen from Figure 9, the fuzzy entropy values of lithology 1 and lithology 3 overlap when the scale factor is 2. When the scale factors are 3, 4, and 5, the scale factors of lithology 2 and lithology 4 do not differ much. Finally, when the scale factors are 5, 6 and 7, the scale factors of lithology 1 and lithology 3 are closer, but they do not overlap. In general, the multi-scale fuzzy entropy of each lithology is distinguishable and can be used as a feature vector for identifying these four lithologies.
Forty sets of 50 sets of multiscale fuzzy entropy for each lithology were randomly selected as the training set and 10 sets as the test set. Finally, the four lithologies are classified using a least squares support vector machine with kernel function as the radial basis function. Considering the regularization parameter
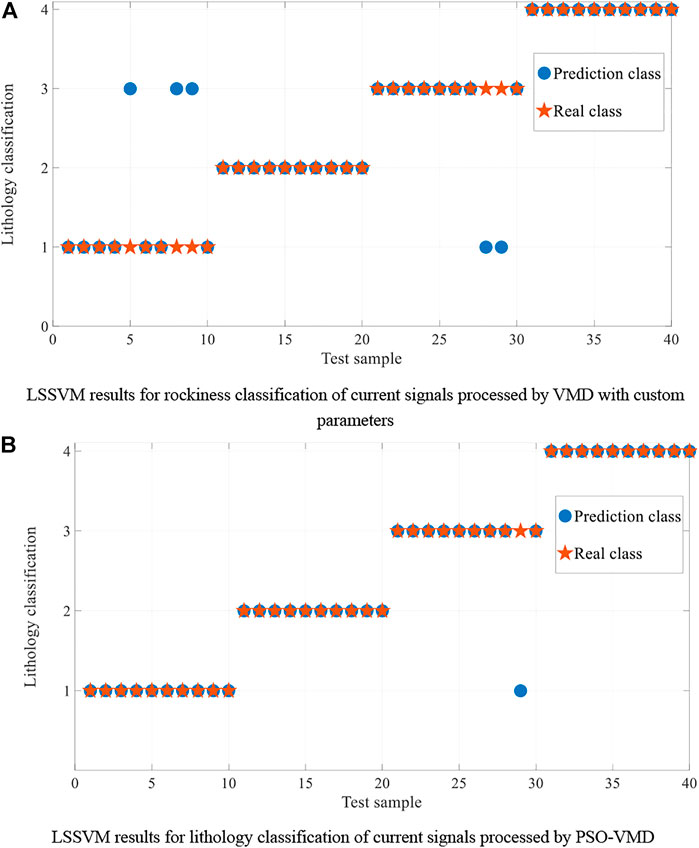
FIGURE 10. LSSVM recognition result graph. (A) LSSVM results for rockiness classification of current signals processed by VMD with custom parameters (B) LSSVM results for lithology classification of current signals processed by PSO-VMD.
As seen from Figure 10, using LSSVM to identify the lithology of the current signal processed by VMD with custom decomposition parameters, three of the ten test groups of lithology 1 failed to identify lithology 1 as lithology 3, and two of the test groups of lithology 3 identified lithology 3 as lithology 1, possibly due to the inconspicuous difference between the features of lithology 1 and 3 by multi-scale fuzzy entropy. While identifying the PSO-VMD processed current signals using LSSVM, only lithology 3 was identified as lithology 1 in one test group; the identification effect was better, and the recognition rate was improved by 10% relative to the custom parameter processed VMD.
In this study, we first obtained the eigenmode function by PSO-VMD, and then obtained the reconstructed current signal by summing the eigenmode function with energy density and correlation coefficient criterion. Multi-scale fuzzy entropy was used as the feature vector, and finally, the LSSVM was used to identify different lithologies. Further improvement of the recognition efficiency could be realized by applying other methods to improve the signal-to-noise ratio before and after noise reduction, or feature vectors with better differentiation between different lithologies.
Conclusion
Aiming to resolve the lithology identification problem of cut-off rock walls during excavation, we obtained current sensor data by building an excavation experiment platform and proposed an intelligent lithology identification method of PSO-VMD-LSSVM. The following conclusions are mainly obtained.
1) The particle swarm algorithm using the minimum envelope information entropy as the fitness function can optimize the parameter selection of the variational modal function of the current signal, ensuring that the parameters of the VMD can be selected adaptively.
2) The energy density and correlation coefficient criteria are used to reconstruct the modal components of the current signal after the VMD to increase the signal-to-noise ratio of the current signal.
3) Multi-scale fuzzy entropy is used as a feature vector for truncating the reconstructed current signal of different lithologies. It can be used as a feature vector for recognition because it has better differentiation for different lithologies under different scale factors.
4) The lithology classification by the LSSVM is performed for the VMD with custom decomposition parameters and the PSO-VMD; the recognition results are 87.5 and 97.5%, respectively. Thus, the PSO-VMD can improve the recognition rate of the LSSVM.
Data Availability Statement
The original contributions presented in the study are included in the article/Supplementary Material, further inquiries can be directed to the corresponding author.
Author Contributions
PQ: Conceptualization, Methodology, Software, Data curation, Validation, Writing-original draft. JC: Writing-review and editing, Funding acquisition. XC: Supervision, Writing-review and editing, Funding acquisition. TW: Writing-review and editing. XZ: Writing-review. MW: Data curation.
Funding
This work was supported by the National Natural Science Foundation of China (Grant No.52174105), Collaborative Innovation Project of Anhui University(GXXT-2019-029), University-level key projects of Anhui University of science and technology (xjzd2020-14), the Key Projects of Natural Science Research in Anhui Universities (KJ2021A0426).
Conflict of Interest
The authors declare that the research was conducted in the absence of any commercial or financial relationships that could be construed as a potential conflict of interest.
Publisher’s Note
All claims expressed in this article are solely those of the authors and do not necessarily represent those of their affiliated organizations, or those of the publisher, the editors and the reviewers. Any product that may be evaluated in this article, or claim that may be made by its manufacturer, is not guaranteed or endorsed by the publisher.
References
Dai, B. (2020). Coal-rock Identification Method Based on Load Data Fusion of Shearer Rocker Axle. China: Liaoning Technical University. doi:10.27210/d.cnki.glnju.2020.000032
Dragomiretskiy, K., and Zosso, D. (2013). Variational Mode Decomposition. IEEE Transactions Signal. Processing 62 (3), 531–544.
Du, K., Li, X.-f., Yang, C.-z., Zhou, J., Chen, S.-j., and Manoj, K. (2020a). Experimental Investigations on Mechanical Performance of Rocks under Fatigue Loads and Biaxial Confinements. J. Cent. South. Univ. 27 (10), 2985–2998. doi:10.1007/s11771-020-4523-7
Du, K., Li, X., Tao, M., and Wang, S. (2020b). Experimental Study on Acoustic Emission (AE) Characteristics and Crack Classification during Rock Fracture in Several Basic Lab Tests. Int. J. Rock Mech. Mining Sci. 133, 104411. doi:10.1016/j.ijrmms.2020.104411
Du, K., Yang, C., Su, R., Tao, M., and Wang, S. (2020c). Failure Properties of Cubic Granite, marble, and sandstone Specimens under True Triaxial Stress. Int. J. Rock Mech. Mining Sci. 130, 104309. doi:10.1016/j.ijrmms.2020.104309
Eberhart, R., and Kennedy, J. (2002). “A New Optimizer Using Particle Swarm Theory,” in Mhs95 Sixth International Symposium on Micro Machine & Human Science, Nagoya, Japan, 4-6 Oct. 1995 (IEEE).
Fu, L., Li, P., and G ao, L. (2021). Improved LSSVM Algorithm Considering Sample Outliers. Chin. J. Scientific Instrument 42 (06), 179–190. doi:10.19650/j.cnki.cjsi.J2107724
Gao, F., Yin, X., Liu, Q., Huang, X., Bo, Y., Zhang, T., et al. (2021). Coal-rock Image Recognition Method for Mining and Heading Face Based on Spatial Pyramid Pooling Structure. J. China Coal Soc. 46 (12), 4088–4102. doi:10.13225/j.cnki.jccs.2021.0624
He, Y., Tian, M., Song, J., Feng, J., and Dong, Z. (2020). Rock Hardness Identification Based on Cutting Motor Current of Roadheader. Saf. Coal Mines 138 (12), 159–162. doi:10.13347/j.cnki.mkaq.2020.12.032
Jiang, Y., Yang, X., He, F., Chen, L., and He, Z. (2016). Super-short-time Wind Power Forecasting Based on EEMD-IGSA-LSSVM[J]. J. Hunan University(Natural Sciences) 43 (10), 70–78. doi:10.16339/j.cnki.hdxbzkb.2016.10.009
Kennedy, J., and Eberhart, R. (1995). “Particle Swarm Optimization,” in Icnn95-international Conference on Neural Networks, Perth, WA, Australia, 27 Nov.-1 Dec. 1995 (IEEE).
Li, L., and Ouyang, C. (2017). Research on Coal-Rock Interface Recognition Based on Ultrasonic Phased Array. J. China Univ. Mining Tech. 46 (03), 485–492. doi:10.13247/j.cnki.jcumt.000668
Liang, Y., Tiegen, L., Kun, L., Junfeng, J., and Yafan, L. (2021). Optimized Gas Detection Method Based on Variational Mode-Decomposition Algorithm. Chin. J. Lasers 48 (7), 0706003–706011. doi:10.3788/CJL202148.0706003
Liu, Y., Zhou, W., Guo, B., Ma, Q., and Xiao, H. (2020). Study on Similar Materials in Similar Simulation Test. Chin. J. Rock Mech. Eng. 39 (S1), 2795–2803. doi:10.13722/j.cnki.jrme.2019.0885
Sampath, K. H. S. M., Perera, M. S. A., Li, D., Ranjith, P. G., and Matthai, S. K. (2019). Characterization of Dynamic Mechanical Alterations of Supercritical Co2-Interacted Coal through Gamma-ray Attenuation, Ultrasonic and X-ray Computed Tomography Techniques - Sciencedirect. J. Pet. Sci. Eng. 174, 268–280. doi:10.1016/j.petrol.2018.11.044
Shi, X., Liu, B., and Xiao, J. (2015). A Method for Determining the Ration of Similar Materials with Cement and Plaster as Bonding Agents. Rock Soil Mech. 36 (05), 1357–1362. doi:10.16285/j.rsm.2015.05.017
Wang, C., and Zhang, Q. (2020). Coal Rock Image Feature Extraction and Recognition Method Based on LBP and GLCM. Saf. Coal Mines 51 (04), 129–132. doi:10.13347/j.cnki.mkaq.2020.04.028
Wang, H., and Zhang, Q. (2018). Dynamic Identification of Coal-Rock Interface Based on Adaptive Weight Optimization and Multi-Sensor Information Fusion. Inf. Fusion 51, 114–128. doi:10.1016/j.inffus.2018.09.007
Wang, S., Wang, S., and Liu, W. (2021a). The Measurement Model and Error Analysis for Shearer Cutting Height. Chin. J. Sci. Instrument 42 (04), 140–149. doi:10.19650/j.cnki.cjsi.J2107324
Wang, X., Ding, E., Hu, K., and &Zhao, R. (2016). Effects of Coal-Rock Scattering Characteristics on the GPR Detection of Coal-Rock Interface. J. China Univ. Mining Tech. 45 (01), 34–41. doi:10.13247/j.cnki.jcumt.000455
Wang, X., Gao, F., Chen, J., He, P., and Jing, Z. (2021b). Generative Adversarial Networks Based Sample Generation of Coal and Rock Images. J. China Coal Soc. 46 (09), 3066–3078. doi:10.13225/j.cnki.jccs.2020.1718
Wang, X., Zhao, D., and Ding, E. (2018). Coal-rock Identification Method Based on Terahertz Spectroscopy Technology. Coal Mining Tech. (01), 13–17+91. doi:10.13532/j.cnki.cn11-3677/td.2018.01.004
Yang, J., Zhang, Q., Wang, C., Chang, B., Wang, X., Ge, S., et al. (2020). Status and Development of Robotization Research on Roadheader for Coal Mines. J. China Coal Soc. (08), 2995–3005. doi:10.13225/j.cnki.jccs.2019.1452
Yin, Z., Chen, W., Hao, H., Chang, J., Zhao, G., Chen, Z., et al. (2019). Dynamic Compressive Test of Gas-Containing Coal Using a Modified Split Hopkinson Pressure Bar System. Rock Mech. Rock Eng. 53, 815–829. doi:10.1007/s00603-019-01955-w
Yin, Z. Q., Xi-Bing, L. I., Jin, J. F., Xian-Qun, H. E., and Kun, D. U. (2012). Failure Characteristics of High Stress Rock Induced by Impact Disturbance under Confining Pressure Unloading. Chin. J. Mech. Eng. 22, 175–184.
Zhang, J., Han, X., and Cheng, D. (2022). Improving Coal/gangue Recognition Efficiency Based on Liquid Intervention with Infrared Imager at Low Emissivity. Measurement 189, 110445. doi:10.1016/j.measurement.2021.110445
Zhang, Q., Liu, Z., and Qiu, J. (2017). Design of Cutting Vibration Signal Acquisition and Recognition System for a New Type of Shearer. Colliery Mech. Electr. Tech. (06), 1–4+8. doi:10.16545/j.cnki.cmet.2017.06.001
Keywords: particle swarm optimization, variational modal decomposition, minimum envelope entropy, multi-scale fuzzy entropy, least square support vector machine, identify rock properties
Citation: Qi P, Chang J, Chen X, Wang T and Wu M (2022) Identification of Rock Properties of Rock Wall Cut by Roadheader Based on PSO-VMD-LSSVM. Front. Earth Sci. 10:884633. doi: 10.3389/feart.2022.884633
Received: 26 February 2022; Accepted: 11 April 2022;
Published: 19 May 2022.
Edited by:
Kun Du, Central South University, ChinaReviewed by:
Hao Zhang, Henan Agricultural University, ChinaYong Ren, Changshu Institute of Technology, China
Mingquan Qiu, Guizhou Minzu University, China
Bo Wu, China University of Mining and Technology, China
Copyright © 2022 Qi, Chang, Chen, Wang and Wu. This is an open-access article distributed under the terms of the Creative Commons Attribution License (CC BY). The use, distribution or reproduction in other forums is permitted, provided the original author(s) and the copyright owner(s) are credited and that the original publication in this journal is cited, in accordance with accepted academic practice. No use, distribution or reproduction is permitted which does not comply with these terms.
*Correspondence: Xiao Chen, Y2hlbnhpYW84YmFuQDE2My5jb20=