 Josh L. Hayes
 Susanna F. Jenkins
 Mathis Joffrain3
- 1Earth Observatory of Singapore, Nanyang Technological University, Singapore, Singapore
- 2Asian School of the Environment, Nanyang Technological University, Singapore, Singapore
- 3AXA, Paris, France
Frequency-magnitude relationships are a fundamental aspect of volcanic hazard and risk analysis. Typically, frequencies of previously recorded eruptions are used to identify such relationships. This works well for volcanoes that are well-studied, but it can take a long, sustained, and resource intensive research effort to compile complete eruption records. Further, the level of completeness that can be achieved will vary around the world as a function of climatic conditions, eruption style, and duration of written records. Given the importance of understanding hazard and risk for disaster risk reduction, how can frequency-magnitude relationships be determined for volcanoes with little or no eruption records? Analogue models have been used to supplement the eruption records of volcanoes with limited or no recorded eruptions. However, there has been little effort undertaken to compare the agreeability of different approaches to estimating frequency-magnitude relationships using these analogue models. This has implications for volcanic hazard and risk assessment, if different approaches are considered credible, yet yield vastly different estimates. In this work we compare frequency-magnitude relationships for volcanoes in Southeast Asia, a region where eruption records are known to be very incomplete. We do this by first reviewing published frequency-magnitude relationships to evaluate the agreeability between different approaches, and then develop a top-down multi-model Bayesian updating approach to deriving frequency-magnitude relationships for a wide variety of volcanoes in Southeast Asia (n = 176). Our review of published estimates found that there is considerable variability between published eruption probabilities for volcanoes in Southeast Asia. We also found that using different analogue models in the Bayesian analysis can lead to considerably different frequency-magnitude relationships (over an order of magnitude in some cases), highlighting the importance of using multiple models to ensure robust probability estimations are obtained. Sensitivity analysis demonstrated that the choice of model averaging or model combination method can influence the resulting frequency-magnitude estimations, whilst the choice to incorporate or remove uncertain eruption records had modest or no effect. Our findings provide important considerations for estimating frequency-magnitude relationships in volcanic hazard and risk assessments, and a method to combine multiple frequency-magnitude models whilst accounting for uncertainty in our estimations.
1 Introduction
Estimating long-term frequency-magnitude relationships for volcanic eruptions is a fundamental component of quantifying volcanic hazard and risk. These estimates provide an indication of how likely different styles and sizes of eruptions are to occur at individual volcanoes (Newhall and Hoblitt 2002; Connor et al., 2003; Marzocchi et al., 2004). This information can then be used to stochastically sample eruption scenarios when conducting probabilistic hazard and risk assessments. The eruptive history for a volcano of interest is typically used to estimate the long-term (averaged) eruption recurrence rate by dividing the volcano record length by the number of recorded eruptions. The long-term recurrence rate can then be used to estimate the probabilities of eruptions, commonly at an annual time scale (i.e., annual probability of an eruption) (Jenkins et al., 2012; Jenkins et al., 2018; Bebbington 2014; Bear-Crozier et al., 2016; Miller et al., 2016). Frequency-magnitude relationships, which define the conditional (i.e., given an eruption occurs) or absolute probability of an eruption of a certain size occurring, can then be derived by evaluating the relative frequency of different eruption sizes. However, there are numerous sources of uncertainty and error associated with this approach. For example, many volcanoes around the world have poorly characterised and incomplete eruption histories (Loughlin et al., 2015). Work at relatively well-studied volcanoes demonstrates that it can take a long, sustained, and resource intensive research effort to build high quality eruption catalogues at the individual volcano scale (Turner et al., 2008; Damaschke et al., 2017; Crummy et al., 2019); however, the level of completeness that can be achieved will vary around the world as a function of climatic conditions, eruption style, and duration of written records (Brown et al., 2014; Rougier et al., 2016; Rougier et al., 2018b; Wang et al., 2020). This raises the question: how can eruption probabilities be derived for volcanoes with little or no eruption records? Analogue models help address this question by sharing eruption frequencies between volcanoes that have similar characteristics (Solow 2001; Rodado et al., 2011; Jenkins et al., 2012; Jenkins et al., 2018; Sheldrake 2014; Whelley et al., 2015; Sheldrake and Caricchi 2017). Analogue volcanoes are volcanoes that are considered to share similarities with respect to characteristics of interest (e.g., magma composition, repose period, volcano type) (Newhall et al., 2017; Tierz et al., 2019). Analogue classification models typically use one or more of the following to assign analogue sets: volcano morphology, recent volcanic activity (e.g., eruption and degassing within the last 10 years), tectonic and/or geological setting (Hone et al., 2007; Jenkins et al., 2012; Bebbington 2014; Sheldrake 2014; Whelley et al., 2015; Tierz et al., 2019). However, as yet, there has been little consideration of how agreeable the subsequently derived frequency-magnitude relationships are between different approaches. The variability between different approaches and underlying data is reflective of the uncertainty associated with our understanding of modelling frequency-magnitude relationships for volcanoes, particularly those with limited or no recorded eruption histories. This has implications for volcanic risk assessment studies and risk reduction if each approach is considered reasonable but yield vastly different frequency-magnitude estimates from one another. Thus, comparing estimates and quantifying the uncertainty associated with each is of importance to volcanic hazard and risk assessment.
The use of multiple models helps to prevent biased predictions through clear presentation of the aleatoric and epistemic uncertainty. Many fields have found that multi-model ensembles perform better at reproducing observations than individual models (Kristiansen et al., 2012; Marzocchi et al., 2012; Martell et al., 2020). Multi-modelling requires using an ensemble of distinct candidate models to simulate a given event and/or phenomenon (Burnham and Anderson, 2002). Multi-modelling can involve model comparison and selection of an optimal model, and/or combining/averaging models into a single meta-model. Model comparison can be achieved using formal mathematical procedures and information criteria (e.g., Akaike information criterion, Bayes factor, Cross-validation). Such analyses have been undertaken to compare different models in long-term (i.e., millennial time scales) eruption frequency estimations (Bebbington 2014). However, in some instances, choosing a single model that provides optimal performance can lead to potentially useful information being unnecessarily discarded (Piironen and Vehtari 2017). This consideration has led to a proliferation of model averaging and model combination approaches, from the simplest approach of equal weighting of models to more sophisticated approaches that assign weightings based on individual model performance [e.g., Bayesian Model Averaging (BMA), pseudo Bayesian Model Averaging, and model stacking] (Fragoso et al., 2018; Yao et al., 2018). As a result, multi-model combination and averaging approaches have been gathering interest for a variety of natural hazard applications (Marzocchi et al., 2012; Marzocchi et al., 2015; Yan and Moradkhani 2014; Song et al., 2018). However, to date, there has not been any consideration of how such approaches may be applied to frequency-magnitude estimation for volcanoes.
In this work, we evaluate the uncertainty within long-term frequency-magnitude relationships for 176 volcanoes in Southeast Asia, where volcanoes were chosen by their presence in Smithsonian Institution’s Global Volcanism Program (GVP) Volcanoes of the World database (version 4.8.5) (Global Volcanism Program, 2013) and provide a detailed analysis of 24 of these volcanoes with a high Population Exposure Index (PEI) value of 7 (equivalent to a fatality-weighted population exposure of 300,000 people) (Brown et al., 2015). We focus our effort on Southeast Asia due to the region being subjected to exceptionally high population exposure to volcanic hazards (Brown et al., 2015) and being a region with volcanoes with relatively poor recorded eruption histories (Jenkins et al., 2012; Whelley et al., 2015; De Maisonneuve and Bergal-Kuvikas 2020). We begin by reviewing published estimates from the literature to examine the variability between different approaches. We then develop and apply a Bayesian updating method to derive frequency-magnitude relationships using different analogue classification frameworks. Bayesian modelling is chosen here instead of frequentist approaches due to the limited or non-existent eruption records for many volcanoes in the region. Multi-modelling approaches are then used to combine these different analogue classification models into a single frequency-magnitude estimation, with uncertainty. We compare our model outputs with published estimates from the literature to cross-reference how agreeable existing estimates are with each other and with our Bayesian model. Finally, we conduct a sensitivity analysis to examine how common assumptions and data sources can influence frequency-magnitude relationships.
2 Methods
2.1 Comparing Published Frequency-Magnitude Estimates
We reviewed existing eruption frequency estimates published within the academic literature for volcanoes in Southeast Asia. The purpose of this was to identify how published estimates vary across different methodological approaches. Our primary focus was to identify frequency-magnitude estimations at the individual volcano scale. The PEI (Brown et al., 2015) was used to focus our efforts on volcanoes that might affect the most people in a future eruption; we thus restricted our detailed examination of published estimates to volcanoes with the highest PEI value of seven (n = 24), equivalent to a fatality-weighted threshold of at least 300,000 people exposed to volcanic hazards (Aspinall et al., 2011; Brown et al., 2015). Google Scholar was used identify studies of interest for each of these volcanoes using the following English text search query: [Volcano name] + [“eruption”] + [“frequency”, “probability”, “recurrence”, “return period”, “repose”]. Google Scholar was used because it provides results that includes grey literature, which we thought might contain frequency-magnitude relationships that have not been published in the academic literature. This initial search was conducted on 10 December 2020. Search results were filtered to include only results with “volcano”, “volcanic”, or “eruption” in the title. This yielded 286 unique results. Results that were focussed on regions or volcanoes outside of Southeast Asia were identified by title, abstract, and/or contents page and removed from further consideration (n = 184), leaving 102 unique results. These were then filtered again by manually reviewing each to identify those that contained quantitative estimates of the frequency of eruptions either as annual probabilities, recurrence intervals and/or frequency-magnitude relationships, either in the main body of the article or within Supplementary Material. This left just 12 results. We then used the reference lists of selected studies to identify potentially relevant studies not captured by our initial search queries (n = 3). Once studies were identified for inclusion in our analysis, we converted the figures reported into annual probabilities for consistent comparison between published studies. A total of 15 references were considered, and are described in Section 3.1.
2.2 Deriving Frequency-Magnitudes Relationships for Southeast Asian Volcanoes
2.2.1 Conceptual Overview
We derive frequency-magnitude relationships for 176 volcanoes in Southeast Asia, but we only use the 24 volcanoes with PEI = 7 as case studies for detailed examination in this manuscript. This limits the diversity of volcano types under consideration, but we wanted to focus on high threat volcanoes as case studies in this paper. The entire dataset of n = 176 are made available as Supplementary Material. The conceptual process used in this work to derive frequency-magnitude relationships is outlined in Figure 1. We first filter the global eruption catalogue to only include eruptions within the record considered complete. The reason for this is to ensure that the eruption record is not biased towards either small or large eruptions. For example, if we considered the entire record within the global eruption catalogue, we would undoubtedly underestimate the eruption probability due to missing eruption records, with smaller eruptions overwhelmingly under-represented; conversely a too short record would not capture the larger eruptions with lower frequency. To consider only the complete portion of the record, we used the complete record change points reported in Mead and Magill (2014), which define the year for each region for smaller and larger eruptions separately, whereafter it is assumed the recording probability is 100%. We use regions for this instead of assessing at the individual volcano scale because the eruption records in Southeast Asia are not complete enough for meaningful estimations at the individual volcano scale.
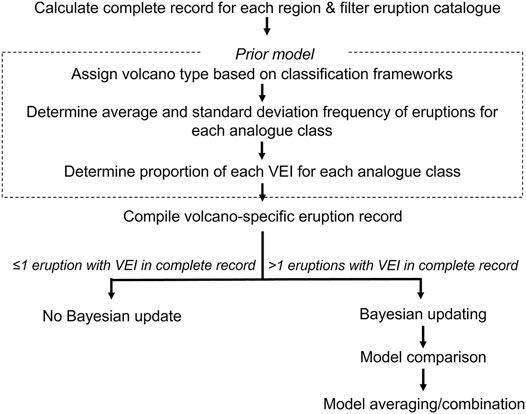
FIGURE 1. Conceptual overview of the process taken in this paper to derive frequency-magnitude relationships in Southeast Asia.
Next, we formulated sets of initial frequency-magnitude relationships for volcanoes in each of the two different analogue classification systems used in this study (discussed in Section 2.2.2); these relationships provide the frequency of eruption and relative proportion of eruptions within each Volcanic Explosivity Index (VEI) class, averaged from the eruption records of volcanoes in that class. We apply two different published analogue classification systems to establish priors for our frequency-magnitude relationships. One approach uses the average across analogue classes globally (Jenkins et al., 2012), whilst the other does this for Southeast Asia and Japan only (Whelley et al., 2015). These averaged frequency-magnitude relationships form the basis of our prior models, which are then updated by the volcano-specific record where possible. If the individual volcano has one or less records with an assigned VEI within the eruption record considered complete, no Bayesian update is conducted as there is insufficient information to update our prior model (16 volcanoes in our subset, 102 volcanoes across the entire dataset). If the volcano under investigation has more than one eruption with an assigned VEI within the record considered complete (8 volcanoes in our subset, 74 volcanoes in the entire dataset), that volcano’s eruption record is used to update the prior model and produce a frequency-magnitude estimate, which is detailed in Section 2.2.3. Since two analogue classification systems are used, two frequency-magnitude estimates are produced for a single volcano (i.e., each volcano will have multiple prior models associated with it). Therefore, we used model comparison methods to evaluate the performance of each analogue classification system’s prior model with the volcano specific eruption record, which produces a weighted score that is used to merge the different frequency-magnitude relationships into a single weighted average frequency-magnitude relationship. We detail this process in Section 2.2.4. Throughout the entire process, we examine the sensitivity of different assumptions by repeating the above process multiple times and changing each assumption appropriately, which we outline in Section 2.2.5.
2.2.2 Assigning Volcano Analogue Sets
To assign a prior model to each volcano, we use the average activity of similar volcanoes as defined by analogue classification systems. Through the process of our systematic literature review we identified just four studies that have used formal analogue classification systems when estimating frequency-magnitude relationships in Southeast Asia (Jenkins et al., 2012; Jenkins et al.,2018; Whelley et al., 2015; Bear-Crozier et al., 2016). Two broad approaches emerged from this, both resulting in five analogue categories. One approach uses the “Primary Volcano Type” field within the GVP database to classify analogue volcano sets (henceforth referred to as A1) (Jenkins et al., 2012; Jenkins et al.,2018; Bear-Crozier et al., 2016). The other approach uses a combination of geomorphological analysis (using digital elevation models, radar scenes, and satellite imagery) and an examination of recent volcanic activity from six eruption databases (see Whelley et al., 2015 for details) (henceforth referred to as A2) (Whelley et al., 2015). Both approaches are summarised in Figure 2. For the A2 approach, we adopted the classifications as reported in the supplementary material associated with Whelley et al. (2015) and assume no change in volcano analogue classification has occurred since publication (i.e., we use their results but do not repeat their analysis for volcanoes in Southeast Asia). However, there is one exception to this: Merbabu volcano (GVP number = 263,240, Indonesia) was classified as an open-vent volcano (as defined by Whelley et al. (2015)—see Figure 2 for definition) within the supplementary material of Whelley et al. (2015), but this volcano does not match the criteria of an open-vent stratovolcano (i.e., must have small eruptions within the last decade), consequently we decided to change the classification to a Semi-plugged stratovolcano (as defined by Whelley et al. (2015)—see Figure 2 for definition). In keeping with the methodologies presented in their respective publications, the A1 analogue set includes all volcanoes in the GVP Holocene volcano list, whilst the A2 approach considers only those within the GVP regions of Indonesia, Philippines and Southeast Asia, and Japan.
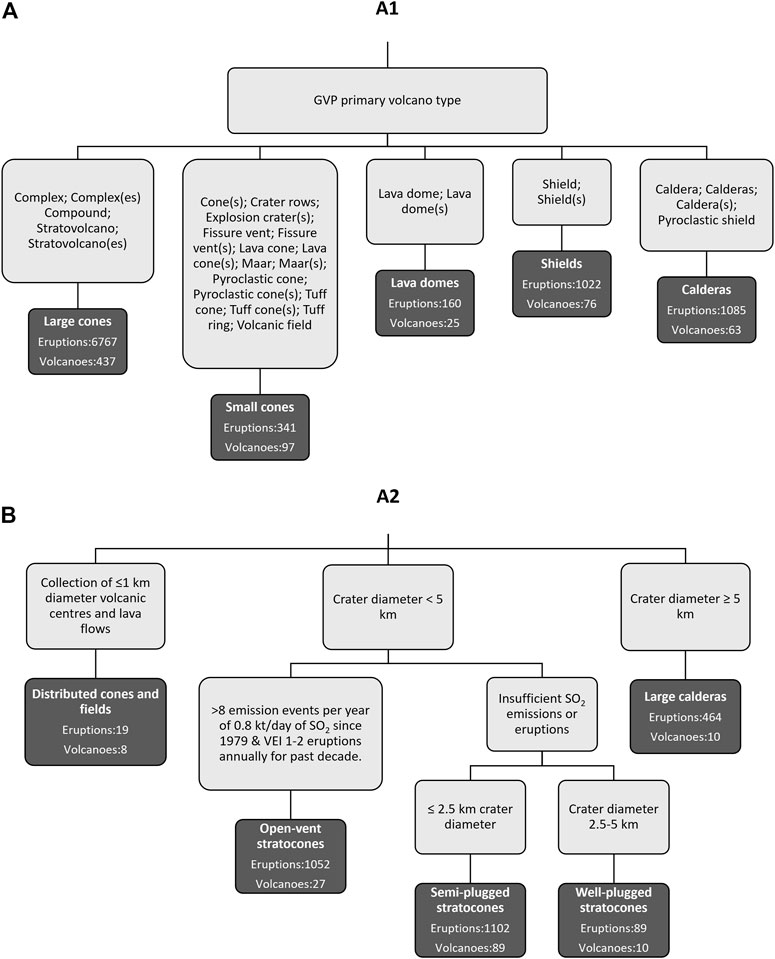
FIGURE 2. Analogue classification system, and the number of eruptions and volcanoes in each analogue subset, for (A) A1 approach (Jenkins et al., 2012), and (B) A2 approach (Whelley et al., 2015).
2.2.3 Bayesian Model
Our aim is to obtain an annualised probability of occurrence for each VEI class for any given volcano. To do so, we split the Bayesian model into two subsequent nodes in a similar manner to the event tree approach commonly undertaken in volcanic hazard assessments: 1) annualised probability of an eruption of any VEI, and 2) relative probability for an eruption of a given VEI class, conditional on an eruption already having taken place. The joint probability of these two nodes is then determined to obtain an annualised probability of an eruption of a given VEI for a given volcano. Using the Bayesian updating framework, we make two estimates of these probabilities: the first provides the prior distribution, which is based on the averaged behaviour of the analogue class of volcanoes. The prior distribution is then updated using the volcano-specific eruption record of the volcano under consideration. We outline the approach taken to characterise the annualised probability of an eruption and the relative probability of each VEI in Sections 2.2.3.1 and 2.2.3.2, respectively.
We use the Global Volcanism Program Volcanoes of the World (GVPVotW) database version 4.8.5 (downloaded 27 January 2020) in this study (Global Volcanism Program, 2013). All Bayesian analysis is conducted using the PyMC3 version 3.8 probabilistic programming package for python (Salvatier et al., 2016). PyMC3 uses the No-U-Turn Sampler (NUTS), which is a self-tuning variant of the Hamiltonian Monte Carlo algorithm (Hoffman and Gelman, 2014; Salvatier et al., 2016). The full code to our analysis including an annotated example within a Jupyter Notebook for Merapi volcano is available at: https://github.com/vharg/FreqMagSEA.
2.2.3.1 Bayesian Model for Annualised Probability of an Eruption
Bayesian inference is the process of updating a prior probability distribution based on new data (the “likelihood”) to provide a posterior probability distribution. We use the Beta-Binomial model, as proposed by Marzocchi et al. (2008), to conduct Bayesian inference for the annualised probability of an eruption of any VEI at a given volcano. The Beta distribution has a range of 0–1, making it a convenient and useful way to represent the annual probability of an eruption because: 1) beta distribution is the conjugate prior for the binomial distribution, meaning that the posterior distribution is also a beta distribution, and 2) keeps the posterior distribution in the 0–1 form. We set the prior model for the estimated annualised probability for an eruption of any VEI as:
Where:
The mean and standard deviation are determined for each analogue class by Eq. 4, 5 respectively.
Where:
A binomial likelihood function is used Eq. 6 for any individual volcanoes with > 1 eruption with an assigned VEI in the record considered complete (Figure 1).
Where:
The posterior distribution is then proportional to the product of the prior and likelihood function, which is a Beta distribution Eq. 7. Samples are drawn using PyMC3, with 20,000 samples drawn using two chains with tuning of 10,000 and a target acceptance rate of 0.99.
2.2.3.2 Bayesian Model for Relative Probability of Each VEI Class
We use a Dirichlet prior and Multinomial likelihood to estimate the relative probability of different VEI eruptions occurring for a given volcano. The Dirichlet-Multinomial model allows for the estimation of probabilities associated with categorical data and multiple mutually exclusive events (i.e., if an eruption occurs it cannot be two different VEIs at the same time). Strictly speaking VEI are not categorical, but rather ordinal data. For the purposes of our analysis, we treat VEI as categorical within the equations to calculate frequency-magnitude at each VEI and the appropriate ordering is maintained when presenting the results. The Dirichlet prior is characterised by a random vector of
Where
Where:
2.2.4 Model Comparison, Model Combination, and Model Averaging
We use PyMC3 to conduct model comparison, which computes the Widely-Applicable Information Criterion (WAIC) (Watanabe 2010) and the Leave-One-Out (LOO) cross validation (Vehtari et al., 2017), and transforms the raw WAIC/LOO values into weighted values for the set of models (Wagenmakers and Farrell 2004). We then generate combined, weighted estimates of eruption probability using PyMC3. There are three methods of model comparison and averaging that can be used within PyMCS: Stacking, Pseudo Bayesian Model Averaging (referred to as “Pseudo BMA” from here on), and Pseudo Bayesian Model Averaging with Bayesian Bootstrapping (referred to as “BB-Pseudo BMA” from here on). We use all three of these approaches to the test sensitivity of each on the output estimates. We elaborate on the appropriateness of each approach in the discussion section.
Stacking combines each base model into a single meta-model that minimises the divergence between the meta-model and the observed data (Yao et al., 2018). The stacking within the PyMC3 python package uses a logarithmic scoring system to evaluate how well a given prior probability distribution performs when compared with the observed data. The model is fitted n times, with one data point left out each time. This is approximated by using the LOO statistic within PyMC3, which estimates the expected log point-wise predictive density using Pareto-smoothed importance sampling LOO cross validation (Vehtari et al., 2017; Vehtari et al.,2019).
Bayesian model averaging weights models by their marginal likelihood. However, it is challenging to compute the marginal likelihood, which is why PyMC3 applies an alternative approach (called Pseudo BMA) using the WAIC or the LOO to estimate weights by assessing the relative probability of each model. Whilst this provides a simple approach to obtaining model weights, it does not take into account the uncertainty associated with the information criterion. Thus, the third approach within PyMC3 uses Bayesian Bootstrapping within the Pseudo BMA process (simulates the posterior distribution of the information criterion) to estimate and incorporate this uncertainty into the analysis.
Additional information on the process of model averaging used within PyMC3 can be found in library documentation (https://docs.pymc.io/notebooks/model_averaging.html).
2.2.5 Sensitivity Analysis
Sensitivity analysis is useful to understand how model parameters and components might influence the eventual results. We run the sensitivity analysis across volcanoes that are able to undergo Bayesian updating (n = 74). We test the sensitivity of our approach to the following assumptions: 1) model averaging/combination method, 2) change point date, and 3) eruption certainty included in the catalogue (Figure 3). We use both the Bayesian update estimates and the analogue prior estimates for these volcanoes, giving a total of 30 individual frequency-magnitude estimates for each volcano: 18 for when Bayesian updating and model averaging is conducted and 12 for the analogue prior estimates. Hence, we do not include the volcanoes that do not undergo Bayesian updating within the sensitivity analysis because these same estimates are already included within the prior estimates for each of the analogue classes. Note, we do not include the analogue classification system within this sensitivity analysis, as it is addressed separately within our Bayesian updating results (Section 3.2.2).
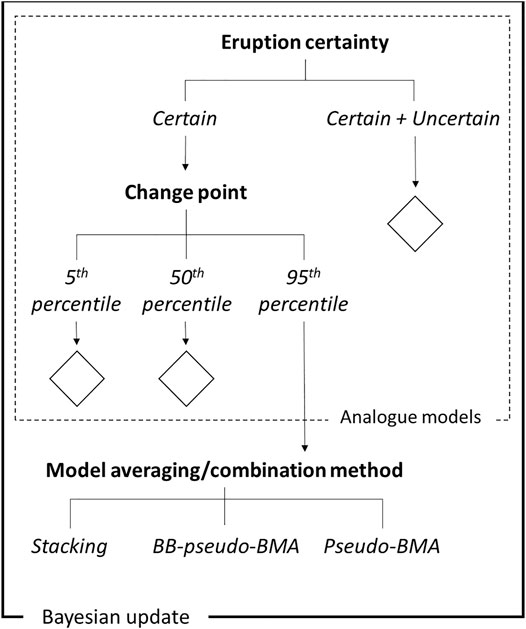
FIGURE 3. Variations used in the sensitivity analysis for the 74 volcanoes that undergo Bayesian updating. Diamonds denote branches that clone adjacent branches, but are not displayed on the figure for clarity purposes.
As outlined in the above section, PyMC3 contains three different model averaging approaches that can be applied. To test the sensitivity of the resulting frequency-magnitude relationships, we repeat the analysis using each of the three approaches, whilst keeping all other conditions constant.
The underlying data have the potential to influence both the priors and the likelihoods used in this analysis. There are two elements of this that we test for sensitivity: choice of change point, and choice of eruption certainty (as classified within the GVP catalogue). We vary the change point by using the 5th, 50th, and 95th percentile change points reported in Mead and Magill (2014) to test the sensitivity of our frequency-magnitude estimates to these parameters. There are a number of eruptions included within the global eruption catalogue that are classified as uncertain within the GVP eruption catalogue. Thus, we test the sensitivity of using or not using uncertain eruptions by conducting the analysis with and without uncertain eruptions included.
Each of the above assumptions are systematically swapped in and out one at a time. The sensitivity of each assumption is assessed by dividing the mean annual probability for each VEI across all parameters by the mean value for the specific assumption being examined. If the resulting value is greater than one, it means the assumption has the effect of decreasing the annual probability estimate and if it is less than one it has the effect of increasing the annual probability estimation.
3 Results
3.1 Previous Published Estimates
We identified 24 individual volcanoes that met our criteria for detailed analysis in this study, which are located across Indonesia and the Philippines (Figure 4; Supplementary Material 1). Comparing the eruption probabilities for volcanoes with multiple published sources shows that, for any one volcano, in some cases annual eruption probabilities can vary by over an order of magnitude, both for eruptions of any VEI and for individual VEIs (Figures 4, 5). Most of the estimates have come from studies that investigate multiple volcanoes. The only volcano that has estimates from studies specifically focussing on that volcano is Merapi, and eruption probability estimates are predominantly based on studies focussed on the stratigraphic record of the volcano.
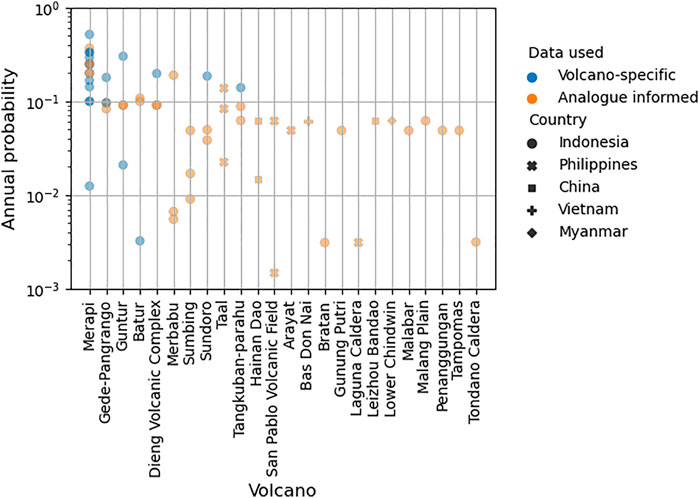
FIGURE 4. Published annual probability of eruption for subset of volcanoes in Southeast Asia (ordered by number of published estimates). Volcano-specific includes those studies that uses data only from the volcano of interest, whilst analogue-informed means that the study incorporated some form of analogue approach to attain the frequency/probability estimate. Data from: Andreastuti et al. (2000); Sagala (2009); Gertisser et al. (2012); Surono et al. (2012); Jenkins et al. (2012); Bebbington (2014); Purwadi et al. (2016) citing Newhall et al. (2000); Jenkins et al. (2015); Bear-Crozier et al. (2016); Miller et al. (2016); Napsiah et al. (2017). See Supplementary Material for detailed values.
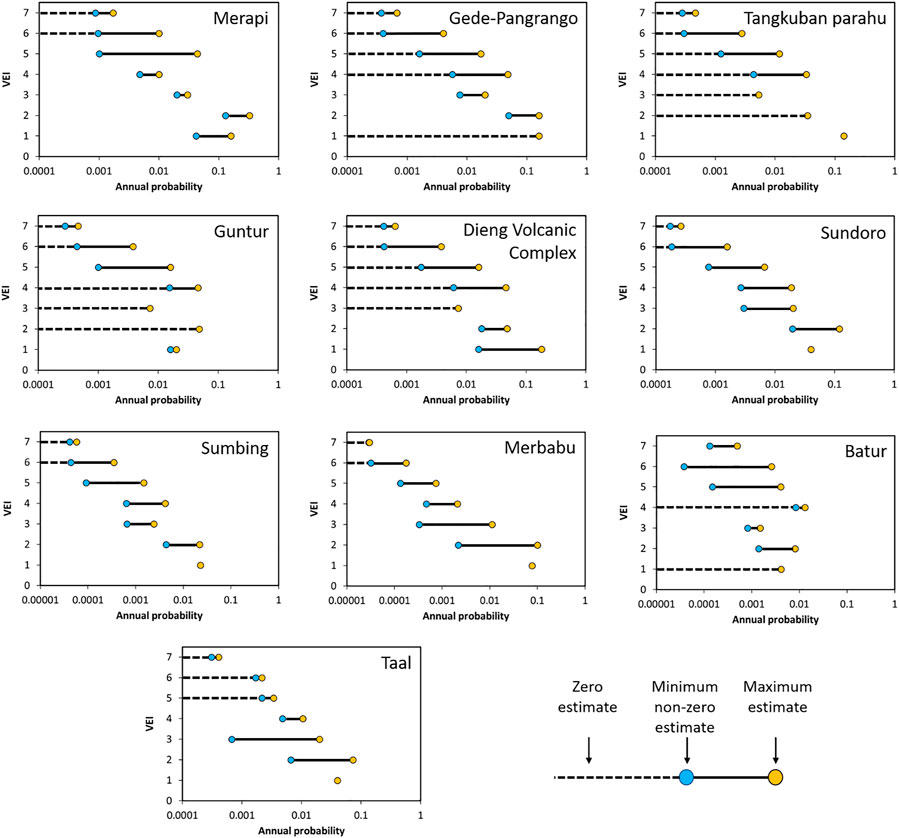
FIGURE 5. Maximum and minimum published annual probabilities of each VEI for volcanoes with at least two different published estimates. Note: not all x-axes are the same scale.
3.2 Assessing Frequency-Magnitude Relationships
3.2.1 Complete Eruption Records for Subset of Southeast Asian Volcanoes
There are 15 volcanoes in the case study set of 24 that do not have any confirmed eruptions recorded within the record considered complete using the 50th percentile change point, including 11 that did not have any recorded eruptions within the entire Holocene eruption record (Figure 6). Of the 15 volcanoes with no confirmed eruptions in the complete record, two have confirmed eruptions outside the complete record (Sumbing and Merbabu), and one (Penanggungan) has an uncertain eruption outside the complete record. One additional volcano (Hainan Volcanic Field) has confirmed eruptions recorded, but no assigned VEI (Figure 7). This means that out of our subset of volcanoes of PEI 7 (n = 24), eight are able to undergo Bayesian updating. None of the volcanoes in our subset have any eruptions of VEI 5+ within the complete and confirmed eruption record (Figure 7). We also found that only Merapi and Taal lose a VEI 4 and VEI ≤ 3, respectively, when using the 95th percentile change point compared to the 50th percentile change point. Taal gains an additional VEI ≤ 3 when using the 5th percentile change point. Including uncertain eruptions within the complete record (regardless of change point used) also yields minimal changes, with an extra VEI ≤ 3 for Merapi, Tangkuban Parahu, and Dieng Volcanic Complex, two extra VEI ≤ 3 for Batur, and three extra VEI ≤ 3 for Gede-Pangrango (Figure 7).
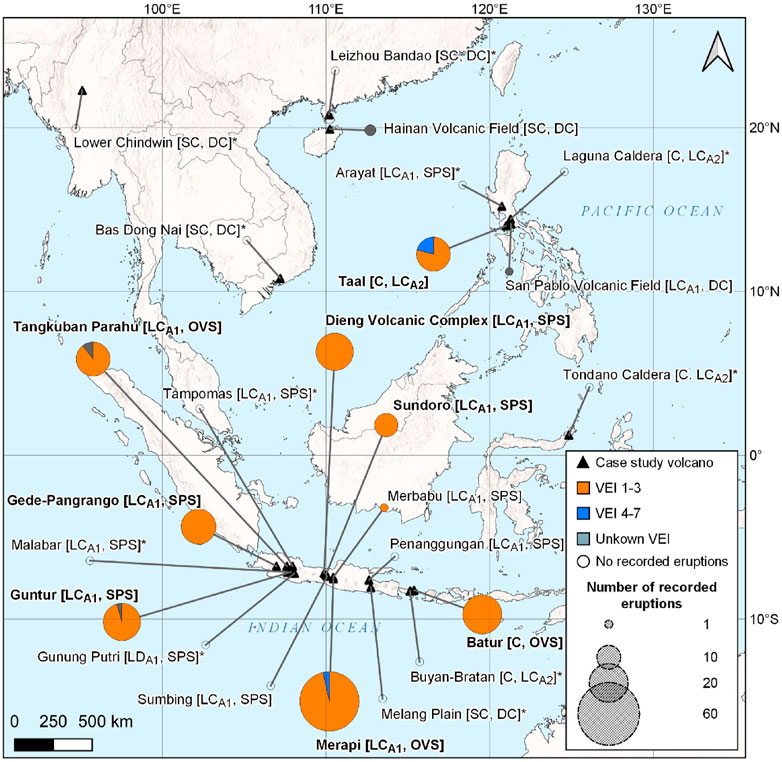
FIGURE 6. The number of recorded eruptions and the relative proportion of small (VEI < 4), large (VEI 4+), and unknown VEI eruptions within the record considered complete using the 50th percentile change point for the 24 volcanoes with PEI 7 considered in this study. Bolded volcano name indicates that we used the Bayesian updating method to update frequency-magnitude estimates. Analogue classification used by Jenkins et al. (2012), Whelley et al. (2015) in square brackets: LCA1, Large cone, LD, Lava Dome, SC, Small cone, C, Caldera, DC, Distributed cones and fields; LCA2, Large caldera, SPS, Semi-plugged stratocone, OVS, Open-vent stratocone. Volcanoes with no recorded eruption in the entire Holocene GVP eruption record are denoted by *. Note: Merbabu A2 classification was changed from OVS (Whelley et al., 2015) to SPS (this study) as it does not meet the criteria outlined in Whelley et al. (2015).
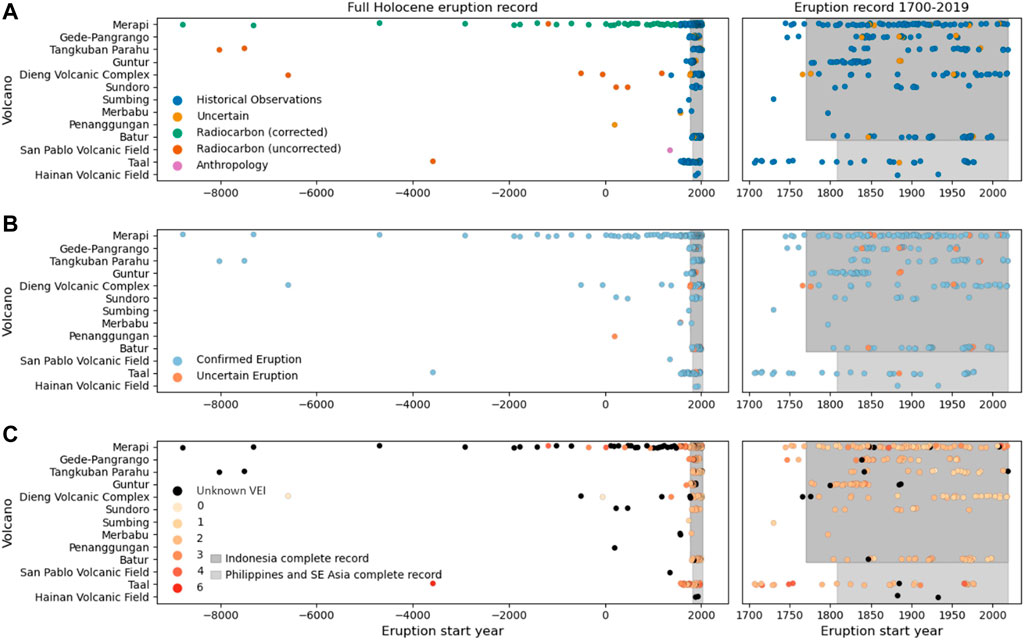
FIGURE 7. Volcanic eruption records for volcanoes with eruptions within the Holocene volcano catalogue. (A) underlying data type used to inform the eruption record as assigned by GVP, (B) the eruption certainty classification as assigned by GVP, and (C) VEI classification. All eruption data from GVP (2013), Complete record data for all VEI eruptions from Mead and Magill (2014).
3.2.2 Bayesian Update Results
The priors used in our analysis are presented in Figure 7. All priors exhibit monotonic behaviour, with the exception of the “Large Calderas” analogue class within the A2 classification system, which shows non-monotonic V-shaped behaviour (Figure 8). The A2 priors, which source eruption data from Southeast Asia and Japan, appear to show have slightly higher annual probabilities than comparable A1 priors, which source global eruption data. For example, comparing “Calderas” of the A1 classification system with “Large calderas” of the A2 classification system indicates that the latter has about an 85% higher probability of eruption. A similar comparison can be made with the “Small cones” of the A1 classification system and the “Distributed cones and fields” of the A2 classification system. For “Small cones” and “Distributed cones and fields” analogue classes, the probability of a VEI 5+ is 0 unless we add a power law distribution where we assume the probability of VEI 5 is one order of magnitude less than the probability of a VEI 4, and similarly for VEI 6 and 7, respectively. We have explored both rationales here, but given that there are no instances of VEI 5+ for these volcano types in the entire global volcanic record we use in this study and scientific understanding of the magmatic processes that drive eruptions at these volcanoes, a zero value is reasonable.
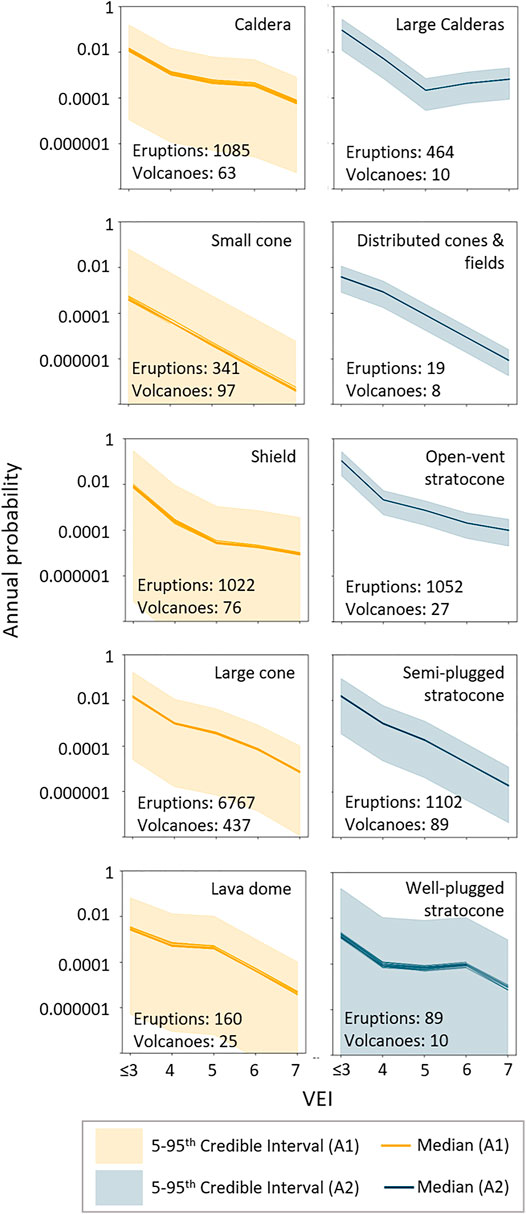
FIGURE 8. Prior models for each analogue classification system, with the number of volcanoes and eruptions for each analogue class (A1 system based on criteria from Jenkins et al., 2012 & A2 system from Whelley et al., 2015). Large uncertainty can be observed across many of the analogue classes, especially for those with limited data (i.e., lava dome, well-plugged stratocone, small cone). Note: VEI are discrete data presented as continuous data to emphasize the relationship between VEI and annual probability. See Supplementary Material 3 for the Alpha and Beta parameters.
Both the A1 and A2 priors show large credible interval bands in general, but particularly large credible interval bands are evident for small cones, shield volcanoes, and lava domes of the A1 analogue classification system, and well-plugged stratocones for the A2 analogue classification system. This indicates that this approach for analogue classification is rather coarse. The A1 classification system has larger credible interval bands compared to the A2 analogue classification system, which is probably related to the greater variability and more volcanoes included at the global level than at a regional level.
Upon updating these priors with the volcano-specific data, the uncertainty in the credible interval range reduces substantially when we apply both analogue systems separately (i.e., no model averaging or combination) (Figure 9). We also note that considering each analogue system separately when undertaking Bayesian updating (i.e., no model combination/averaging), can lead to frequency-magnitude estimates that have different shapes (e.g., Taal) and median probability values that in some cases vary between the two approaches by an order of magnitude (e.g., Batur VEI 4+) (Figure 9).
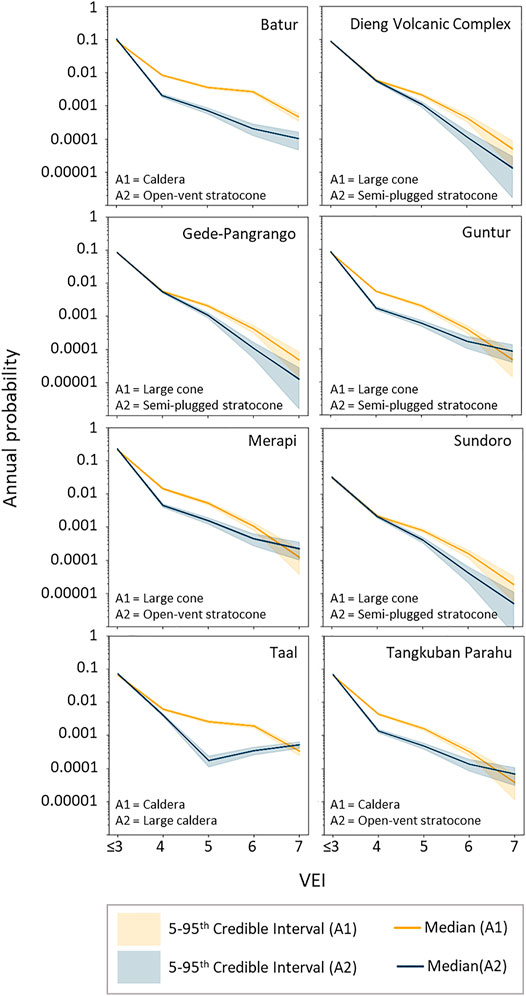
FIGURE 9. Comparing Bayesian update frequency-magnitude estimates using two different analogue models. Considerable differences between the two analogue systems can be observed. Note: VEI are discrete data presented as continuous data to emphasize the relationship between VEI and annual probability.
We present our frequency-magnitude estimates combining each of the analogue classification systems for the same subset of volcanoes in Figure 9. Comparing our estimates with those in the published literature, Whelley et al. (2015) and Jenkins et al. (2015) estimates broadly fall within the 5th–95th credible interval range (but not always), but the Bear-Crozier et al. (2016), Miller et al. (2016) estimates often fall outside of this range with much higher probabilities. We discuss possible reasons for this in the discussion section. The 5th–95th credible interval ranges are larger than when each individual analogue classification system is used, indicating the combined model uncertainty (epistemic uncertainty) being incorporated into the frequency-magnitude relationship. Of note, the non-monotonic behaviour that Taal exhibited for the A2 Bayesian update shown in Figure 8 is not evident when model combination/averaging is undertaken (Figure 10).
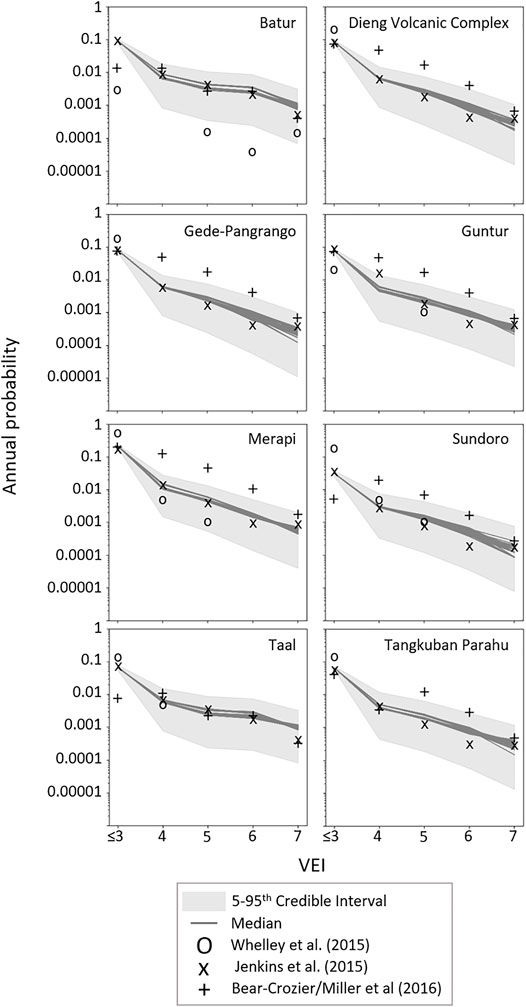
FIGURE 10. Frequency-magnitude relationships from each of the iterations for case study volcanoes undergoing the Bayesian update compared to published point estimates from the literature (see Supplementary Material 1 for full reporting of published frequency-magnitude estimates for these volcanoes). Note: VEI are discrete data presented as continuous data to emphasize the relationship between VEI and annual probability.
See Supplementary Material 2 for a full catalogue of frequency-magnitude relationships for 176 volcanoes in Southeast Asia. Note that 102 volcanoes within the catalogue do not have sufficient eruption records to conduct the Bayesian updating process undertaken in this work.
3.2.3 Model Comparison for Volcanoes with Limited/No Eruption Records
There is considerable uncertainty associated with both analogue models’ frequency-magnitude estimates for volcanoes that do not undergo Bayesian updating (Figure 11). Conceptually, this is not unexpected given these are volcanoes with 1 or less eruptions within the entire Holocene eruption catalogue, which is known to be incomplete. Thus, it is difficult to determine whether these specific volcanoes are: 1) genuinely less active, or 2) whether they have received less attention to compile their eruptive histories, or 3) some combination of both.
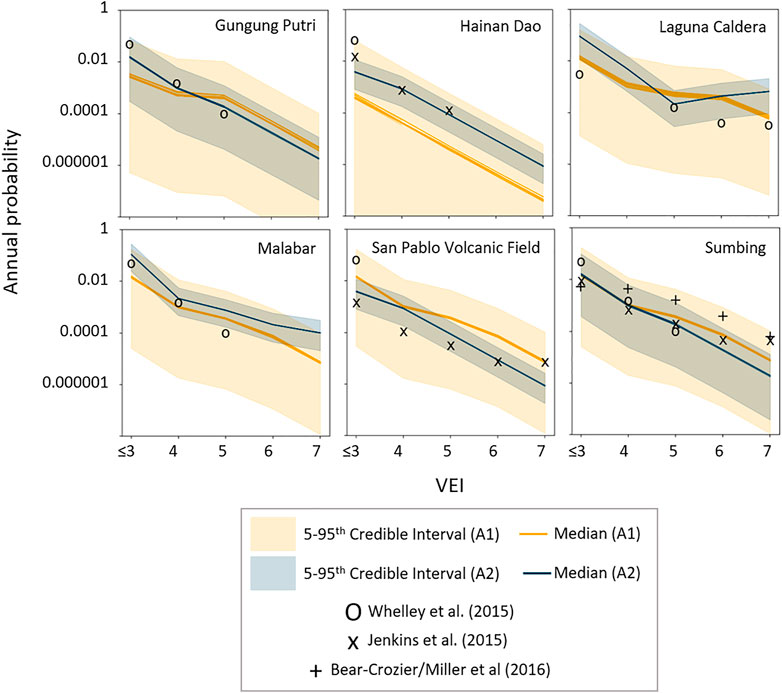
FIGURE 11. Analogue frequency-magnitude distributions compared to published point estimates from the literature for volcanoes that could not undergo Bayesian updating due to little/no eruption record. Note: VEI is discrete data that are presented as continuous data to emphasize the relationship between VEI and annual probability.
The 5th–95th credible interval bands using the A1 models are generally much larger than those of the A2 models. This is possibly an indication of heightened dispersion of volcano behaviour when using a global dataset (i.e., A1 model) compared to a more regionalised dataset (i.e., A2 model). Indeed, using a regionally constrained dataset (i.e., only the volcanoes used in the A2 model) for the A1 model leads to less dispersion across each analogue class as some of the volcanoes at the extreme high and low frequencies are removed (Figure 12). However, it also becomes difficult to use only regional level data in the A1 classification system because of limited number of volcanoes in some of the analogue classes (e.g., small cones). Volcanoes that are classified as “small cones” have a particularly large uncertainty for the A1 model that spans several orders of magnitude, potentially indicating that assigning frequency-magnitude in this manner may not be advantageous. Interestingly, for the A2 model, an inflection point occurs at VEI 5 for volcanoes classified as “Large Calderas”, indicating that this class of volcano demonstrates enhanced frequency of eruptions at VEI 7 compared to VEI 5 (Figure 8), or that the preservation, recording and/or study of the differently sized eruptions is not equal.
FIGURE 12. Comparison of dispersion within the A1 volcano classification system when using a global dataset compared to a regionally constrained dataset. Few underlying data at the regional level for shield, lava dome, and small cone makes developing analogue sets with robust statistical relationships challenging.
3.3 Bayesian Updating Sensitivity Analysis
In this section we examine the sensitivity of model assumptions on the resulting frequency-magnitude estimation for the 74 volcanoes that underwent Bayesian updating. We plot the mean for all model runs relative to the mean of the subset for each parameter as a proportion (Figure 13). Thus, values close to one indicate no or minor sensitivity, above one means the parameter is relatively lower than the average, and lower than one means the parameter is relatively higher probability than the average. We tested the effect of three main assumptions (Figure 3): 1) change point date (n = 3), 2) eruption certainty (n = 2), and 3) the Bayesian model averaging method (n = 3).
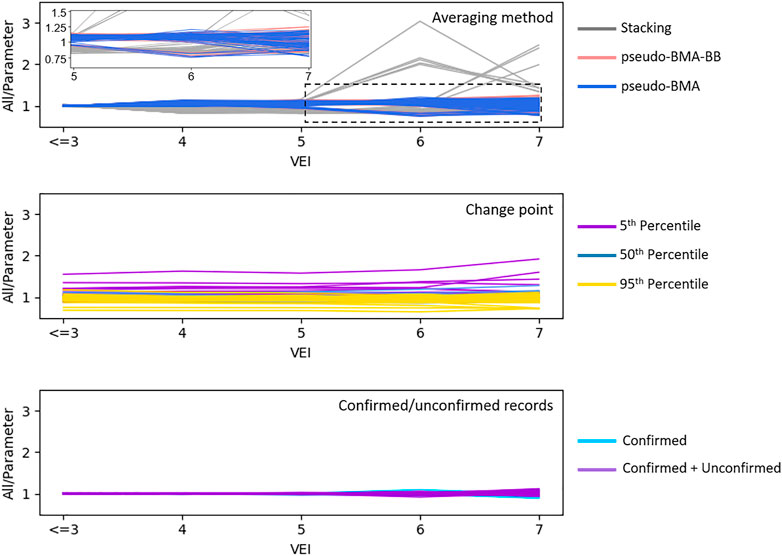
FIGURE 13. Sensitivity of frequency-magnitude estimates for volcanoes that undergo Bayesian updating. The top plot shows the influence of the model averaging method. Inset on the top plot is to show the change between VEI 6 and 7 where stacking produces relatively lower eruption probabilities compared to the BMA approaches. The middle plot shows the influence of change point selection. The bottom plot shows the influence of including only confirmed eruptions or adding unconfirmed eruptions into the eruption catalogue Values close to one indicate no or minor sensitivity, above one means the parameter is relatively lower than the average, and lower than one means the parameter is relatively higher probability than the average.
Overall, our approach appears to have relatively low sensitivity to changes in model parameters for VEI ≤ 3–5, with increasing sensitivity at VEI 6–7. Of the three parameters we test for sensitivity, including unconfirmed eruptions within the record has the least effect on the resulting frequency-magnitude estimates. Frequency-magnitude estimates are sensitive to the choice of Bayesian model combination/averaging, with model stacking having the effect of producing relatively higher probability of VEI 3–4 eruptions relative to BB-Pseudo-BMA and Pseudo-BMA, but at above VEI 4 these appear to switch although the effect is relatively modest (see inset of Figure 13). However, for several volcanoes (Colo, Ijen, Kelimutu, Parker, Pinatubo, Semeru, Tambora, Tengger Caldera) there is a large shift at VEI 6–7, where stacking produces relatively lower eruption probabilities compared to the BMA approaches.
The change point date is also sensitive, with the 5th percentile (earlier change point and longer complete record) and the 95th percentile (more recent change point and shorter complete record) systematically decreasing and increasing the eruption probabilities, respectively. However, the magnitude of this effect is volcano-specific, with some volcanoes exhibiting little effect, whilst others are more substantive. For example, the most extreme example is Sinabung, where the 95th percentile change point results in an eruption probability for a VEI ≤ 3 that is ∼80% higher than the corresponding probability using the 5th percentile change point. The difference between using the 95th and 5th percentile change points increases to ∼90% at VEI 7.
4 Discussion
4.1 Agreeability Between Published Frequency-Magnitude Estimations for Southeast Asian Volcanoes
The discrepancy between published frequency-magnitude estimates presents a challenge for hazard and risk assessments as they may make resource allocation more challenging and are likely to considerably influence risk metrics such as expected losses (e.g., life or financial) per unit time, and stochastic catalogues. Most of the published frequency-magnitude probabilities for Southeast Asian volcanoes are presented as point estimates, which means that the uncertainty associated with each is unknown. Frequency-magnitude estimates may be influenced by different aspects of the methodologies such as the underlying data (e.g., combining multiple databases vs. using a solitary database), how data completeness is dealt with, and how analogues are defined.
We attribute the relatively high Bear-Crozier (2016), Miller et al. (2016) frequency-magnitude estimates to a potential probability miscalculation in the supplementary files: the conditional probability for each VEI eruption appears to have been calculated conditional upon whether an eruption is small (VEI 2–3) or large (VEI 4–7), rather than as a condition of an eruption of any VEI. As a result, some volcanoes show unexpectedly high probabilities in the supplementary files; for example, summing the annual probability for each VEI within supplementary for Gede-Pangrango gives 1.27 × 10⁻¹, whilst the corresponding value in Table 1 is 9.58 × 10⁻² (Bear-Crozier et al., 2016), which is closer to the estimates of Jenkins and Whelley.
4.2 Model Combination/Averaging for Deriving Frequency-Magnitude Relationships for Volcanoes
Selecting only one specific model of frequency-magnitude limits our ability to robustly evaluate any subsequent hazard or risk (Marulanda et al., 2021). For example, using only the A1 classification system would lead to higher probabilities than if we only used the A2 classification system. In addition, using either classification approach in isolation yields less uncertainty (Figure 9), presenting an overly confident projection. Model combination and averaging allows one to integrate different conceptual models and evaluate the combined uncertainties in a more robust manner, making them particularly useful for integrating different analogue classification systems. In this paper we have demonstrated how multiple models that capture different conceptual elements of uncertainty (in this case analogue classification) can be combined to produce frequency-magnitude estimates for volcanoes. This is a concept that has been applied within other natural hazard risk assessment methodologies, but is still relatively new to the volcanological risk assessment community (Kristiansen et al., 2012; Sandri et al., 2018; Holland et al., 2020; Plu et al., 2021), and as far as we are aware has not been applied for large scale multi-source hazards across a region or country for risk and catastrophe modelling. We suggest that further development of multi-modelling approaches will facilitate a greater understanding of the inherent uncertainties and reduce potential for bias in volcanic hazard and risk assessments.
We found that the Bayesian updating model we applied was sensitive to the selection of model combination/averaging method. In particular, the distinction between using model stacking or the Bayesian model averaging approaches (BB-Pseudo-BMA and Pseudo-BMA). This is not an entirely unexpected finding, as these different methods have different considerations for their use. What this does highlight is the importance of considering the philosophical underpinning of the selection choice. In order to understand the appropriate choice, we must consider how to conceptually describe the relationship between the model set (e.g., different analogue models used to define the priors) and the true data generating model (i.e., the physical processes defining frequency-magnitude relationships). There are three ways to classify the relationship between the true data generator model and the model set in Bayesian model comparison (Bernardo et al., 2000):
1) M-closed—the true data generator is included within the model set, but it is unknown;
2) M-complete—a true data generator model exists, but it is not included within the model set; and
3) M-open—the true data generator model is not included within the model set and we are unable to specify its form.
Bayesian model averaging is appropriate in for the M-closed case, but is considered inappropriate for the M-complete and M-open cases (Yao et al., 2018). This is because the true data generating model is not considered to be included in the M-complete and M-open cases, and so using posterior model probabilities to obtain a model average is not applicable. Thus, consideration should be undertaken as to whether the analogues are likely to be representative of the true data-generating model or whether they are broad approximations.
4.3 Uncertainty in Frequency-Magnitude Estimates for Southeast Asian Volcanoes and Implications for Volcanic Hazard and Risk Assessments
In this paper, we have provided a generalised and systematic approach that facilitates stochastic sampling of frequency-magnitude estimates that will enhance the robustness of future hazard and risk assessments for these volcanoes. The use of freely available datasets means the approach taken in this paper may also be applicable in other volcanically active regions where considerable gaps in the volcano record exist. A feature of this is that as new information becomes available (e.g., updates to the eruption catalogue), the estimates can be easily updated to ensure that the newest information is captured within volcanic hazard and risk assessments. Over half of our study volcanoes in the region did not have sufficient eruption records to allow for Bayesian updating, including volcanoes that have a very high population exposure index (PEI 7), for example Malabar, Tampomas, and Penanggungan. Thus, a priority research area would be to obtain a broad understanding of the eruption history of high exposure/low data volcanoes (Jenkins et al., 2021). This is particularly important as recent history has examples of major eruptions affecting communities from volcanoes that had not previously erupted during historical times or had underestimated frequencies of eruption. For example, following the 2008 eruption of Chaitén volcano, Chile, dedicated geological studies found that this volcano erupted much more regularly than previously anticipated (Lara et al., 2013; Watt et al., 2013). Thus, differentiating between volcanoes that genuinely have a low eruption frequency from those that just have a limited eruption record or are in a period of relatively low eruption frequency within the eruptive cycle would improve future frequency-magnitude estimates.
Clustering of volcanic eruptions in time can influence the long-term frequency-magnitude relationship. For example, if a clustering of eruptions in a short time span occurs just outside the record considered complete, these eruptions would not be incorporated into the analysis and potentially result in a lower probability of eruption being estimated than the true long-term average. The opposite would be true if a clustering of eruptions occurs within the relatively short complete record, but does not consider a long period of quiescence that preceded it. Examples include Guntur, which was a relatively active volcano during the first half of the 19th century (21 eruptions between 1,800 and 1,847), but has no confirmed eruptions since 1847. However, it can be difficult to differentiate between a genuine lull in volcanic activity or just an incomplete volcanic record (or some combination of the two). For example, Andreastuti et al. (2000) reported an eruption frequency at Merapi volcano of one eruption every 80 years for the time period of 3,000–250 years before present and note that this frequency is much lower than the frequency seen at Merapi since that time period (∼one eruption every 4 years). They attributed this to different eruptive behaviour (less instances of dome collapse eruptions) during that earlier period than the present. The tropical climate with relatively high rates of precipitation means that lahars and landslides are frequent, lowering the preservation potential for volcanic deposits, which makes common approaches to categorising eruption histories using tephrachronological and tephrastratigraphy studies particularly challenging (De Maisonneuve and Bergal-Kuvikas 2020). Therefore, incomplete records should not be discounted as an explanation for the lower eruption frequency, particularly for smaller eruption sizes.
Another issue is how to deal with long-lived eruptions within long-term frequency-magnitude estimation. First, VEI for pre-historic eruptions has often been assigned based on erupted volume, which occurs over the entire duration of an eruption and can be subjected to considerable syn and post-eruption processes (e.g., welding and compaction, weathering) (Papale 2018). The alternative measure of eruption magnitude (M) (Pyle 2015) is often estimated using volume as a starting point and so is subjected to many of the same uncertainties as VEI (Papale 2018). Second, some volcanoes may intermittently erupt several times a year, but each eruption may be considered to be part of a single eruption period. For example, Dukono volcano in Indonesia regularly has small ash producing eruptions and degassing (Carn et al., 2017; Bani et al., 2018; Engwell et al., 2021), but the record within the GVP database is a single eruption that has been continuing since 1933, and would be counted as a single eruption within our analysis. Therefore, an important consideration when interpreting our frequency-magnitude results is they are a probability of an eruption period beginning in a year, rather than the probability of any individual explosive eruption.
We found that the prior models for volcanoes assigned a “small cone” analogue class within the A1 classification system have relatively very large uncertainty compared to other analogue classes. Whilst we did not see the same uncertainty with the Distributed Cones and Fields class within the A2 classification system, there are far fewer volcanoes within the A2 system (n = 341 vs. n = 19) and so this may explain why there is less variability. It should also be noted that reduced diversity of volcanoes at a regional level compared to the global level may mean that mixing across relatively few volcanoes is not sufficient to support a Poisson approximation (Bebbington and Lai 1996; Bebbington 2007; Rougier et al., 2018a; Wang et al., 2020). This may suggest that the transferability of characteristics between volcano analogue classifications that have few numbers of individual volcanoes may require a more considered approach than the relatively simple schemas used in this work. It may also reflect an issue with the underlying data in that the GVP assignation for volcano type may group diverse volcanoes at different stages in their eruptive cycle together and therefore the averaged behaviour from the complete portion of the record may not be truly representative for individual volcanoes within the group. Investigating relationships across volcanoes when secondary volcano types assigned by GVP are used, and ongoing work on how best to define an “analogue” (Hone et al., 2007; Rodado et al., 2011; Whelley et al., 2015; Tierz et al., 2019), will help to improve our estimates of frequency-magnitude derived at data-poor volcanoes.
5 Conclusion
One of the major challenges associated with deriving frequency-magnitude relationships for Southeast Asian volcanoes is that volcano records in the region have variable completeness across volcanoes. All volcanoes investigated in this paper have very high population exposure index values, and most also have limited or no data associated with them. This has meant that for volcanoes that may present a risk for society, it has been necessary to use analogue models of volcanism where it would be expected that certain volcanoes share common eruption characteristics. However, there are different ways to choose analogue models and the published frequency-magnitude estimates for Southeast Asian volcanoes shows considerable variation between different studies, sometimes over an order of magnitude. This is problematic if such figures are used within volcanic hazard or risk assessment applications as using one model alone may present an overly-confident assessment of the uncertainty. This problem is exacerbated as these figures have to date been reported as point estimates in the literature for many volcanoes in Southeast Asia. In this study we have developed a top-down Bayesian approach to assessing frequency-magnitude relationships for volcanoes in Southeast Asia. The approach uses multiple different analogue models to construct prior models, which are then updated using the volcano-specific eruption record and combined using different model combination and averaging approaches. We found that volcanoes that undergo the Bayesian updating and model averaging/combination have relatively low uncertainty at VEI ≤ 3, but this progressively increases to an order of magnitude at VEI 6-7 and sometimes exceeds an order of magnitude at these high VEI classes, because of the smaller amount of underlying data. Our approach allows for estimation of the uncertainty associated with frequency-magnitude relationships for Southeast Asian volcanoes, which is the first time such uncertainty has been included in published frequency-magnitude estimations for such a large number of volcanoes in Southeast Asia. However, over half of the volcanoes in Southeast Asia do not have sufficient eruption records to update from the prior models, which are highly uncertain. Given the scale of uncertainty associated with frequency-magnitude estimation for volcanoes in Southeast Asia, our results have implications for undertaking probabilistic volcanic hazard and risk modelling within the region, and uncertainty assessments are necessary to enhance the robustness of such analyses. We suggest that using multi-modelling frameworks that include models that “think differently” provides a beneficial method for deriving robust frequency-magnitude estimations for volcanoes.
Data Availability Statement
The original contributions presented in the study are publicly available. This data can be found here: https://github.com/vharg/FreqMagSEA.
Author Contributions
JH, SJ, and MJ contributed to the project idea, goals, and objectives. JH developed the methodology with input from SJ, JH ran all analysis, wrote the code, and wrote the manuscript. SJ and MJ provided review and editorial assistance on the manuscript.
Funding
This research was supported by funding from the AXA Joint Research Initiative under the project “Volcanic Risk Assessment in Asia”. This research was supported by the Earth Observatory of Singapore via its funding from the National Research Foundation Singapore and the Singapore Ministry of Education under the Research Centres of Excellence initiative. This work comprises EOS contribution number 437.
Conflict of Interest
MJ was employed by AXA.
The remaining authors declare that the research was conducted in the absence of any commercial or financial relationships that could be construed as a potential conflict of interest.
Publisher’s Note
All claims expressed in this article are solely those of the authors and do not necessarily represent those of their affiliated organizations, or those of the publisher, the editors and the reviewers. Any product that may be evaluated in this article, or claim that may be made by its manufacturer, is not guaranteed or endorsed by the publisher.
Acknowledgments
The authors would like to thank all the professionals, volunteers and contributors working to maintain the important and useful open-source datasets and python libraries used in this work.
Supplementary Material
The Supplementary Material for this article can be found online at: https://www.frontiersin.org/articles/10.3389/feart.2022.895756/full#supplementary-material
References
Andreastuti, S. D., Alloway, B. V., and Smith, I. E. M. (2000). A Detailed Tephrostratigraphic Framework at Merapi Volcano, Central Java, Indonesia: Implications for Eruption Predictions and Hazard Assessment. J. Volcanol. Geotherm. Res. 100, 51–67. doi:10.1016/S0377-0273(00)00133-5
Aspinall, W., Auker, M., and Hincks, T. (2011). Volcano Hazard and Exposure in GFDRR Priority Countries and Risk Mitigation Measures-GFDRR Volcano Risk Study. Bristol: Bristol University Cabot Institute and NGI Norway for the World Bank.
Bani, P., Tamburello, G., Rose-Koga, E. F., Liuzzo, M., Aiuppa, A., Cluzel, N., et al. (2018). Dukono, the Predominant Source of Volcanic Degassing in Indonesia, Sustained by a Depleted Indian-MORB. Bull. Volcanol. 80, 5. doi:10.1007/s00445-017-1178-9
Bear-Crozier, A. N., Miller, V., Newey, V., Horspool, N., and Weber, R. (2016). Probabilistic Volcanic Ash Hazard Analysis (PVAHA) I: Development of the VAPAH Tool for Emulating Multi-Scale Volcanic Ash Fall Analysis. J. Appl. Volcanol. 5, 3. doi:10.1186/s13617-016-0043-4
Bebbington, M. S. (2007). Identifying Volcanic Regimes Using Hidden Markov Models. Geophys. J. Int. 171, 921–942. doi:10.1111/j.1365-246X.2007.03559.x
Bebbington, M. S., and Lai, C. D. (1996). On Nonhomogeneous Models for Volcanic Eruptions. Math. Geol. 28, 585–600. doi:10.1007/BF02066102
Bebbington, M. S. (2014). Long-term Forecasting of Volcanic Explosivity. Geophys. J. Int. 197, 1500–1515. doi:10.1093/gji/ggu078
Bernardo, J. M., Smith, A. F. M., and Bayes, T. (2000). Bayesian Theory. Chichester: Wiley, 586. 978-0-471-49464-5.
Brown, S. K., Auker, M. R., and Sparks, R. S. J. (2015). “Populations Around Holocene Volcanoes and Development of a Population Exposure Index,” in Global Volcanic Hazards and Risk. Editors S. C. Loughlin, R. S. J. Sparks, S. . F. Jenkins, and C. Vye-Brown (Cambridge: Cambridge University Press). doi:10.1017/cbo9781316276273.006
Brown, S. K., Crosweller, H. S., Sparks, R. S. J., Cottrell, E., Deligne, N. I., Guerrero, N. O., et al. (2014). Characterisation of the Quaternary Eruption Record: Analysis of the Large Magnitude Explosive Volcanic Eruptions (LaMEVE) Database. J. Appl. Volcanol. 3, 5. doi:10.1186/2191-5040-3-5
Burnham, K. P., and Anderson, D. R. (2002) Model Selection and Multimodel Inference: A Practical Information-Theoretic Approach. 2nd Edn. New York: Springer.
Carn, S. A., Fioletov, V. E., McLinden, C. A., Li, C., and Krotkov, N. A. (2017). A Decade of Global Volcanic SO2 Emissions Measured from Space. Sci. Rep. 7, 44095. doi:10.1038/srep44095
Connor, C. B., Sparks, R. S. J., Mason, R. M., Bonadonna, C., and Young, S. R. (2003). Exploring Links between Physical and Probabilistic Models of Volcanic Eruptions: The Soufrière Hills Volcano, Montserrat. Geophys. Res. Lett. 30. doi:10.1029/2003GL017384
Crummy, J. M., Savov, I. P., Loughlin, S. C., Connor, C. B., Connor, L., and Navarro-Ochoa, C. (2019). Challenges of Determining Frequency and Magnitudes of Explosive Eruptions Even with an Unprecedented Stratigraphy. J. Appl. Volcanol. 8, 3. doi:10.1186/s13617-019-0083-7
Damaschke, M., Cronin, S. J., Holt, K. A., Bebbington, M. S., and Hogg, A. G. (2017). A 30,000 Yr High-Precision Eruption History for the Andesitic Mt. Taranaki, North Island, New Zealand. Quat. Res. 87, 1–23. doi:10.1017/qua.2016.11
De Maisonneuve, C. B., and Bergal‐Kuvikas, O. (2020). Timing, Magnitude and Geochemistry of Major Southeast Asian Volcanic Eruptions: Identifying Tephrochronologic Markers. J. Quat. Sci. 35, 272–287. doi:10.1002/jqs.3181
Engwell, S., Mastin, L., Tupper, A., Kibler, J., Acethorp, P., Lord, G., et al. (2021). Near-real-time Volcanic Cloud Monitoring: Insights into Global Explosive Volcanic Eruptive Activity through Analysis of Volcanic Ash Advisories. Bull. Volcanol. 83, 9. doi:10.1007/s00445-020-01419-y
Fragoso, T. M., Bertoli, W., and Louzada, F. (2018). Bayesian Model Averaging: A Systematic Review and Conceptual Classification. Int. Stat. Rev. 86, 1–28. doi:10.1111/insr.12243
Gertisser, R., Charbonnier, S. J., Keller, J., and Quidelleur, X. (2012). The Geological Evolution of Merapi Volcano, Central Java, Indonesia. Bull. Volcanol. 74, 1213–1233. doi:10.1007/s00445-012-0591-3
Hoffman, M. D., and Gelman, A. (2014). The No-U-Turn Sampler: Adaptively Setting Path Lengths in Hamiltonian Monte Carlo. J. Mach. Learn. Res. 15, 1593–1623.
Holland, L., Businger, S., Elias, T., and Cherubini, T. (2020). Two Ensemble Approaches for Forecasting Sulfur Dioxide Concentrations from Kīlauea Volcano. Weather Forecast. 35, 1923–1937. doi:10.1175/WAF-D-19-0189.1
Hone, D. W. E., Mahony, S. H., Sparks, R. S. J., and Martin, K. T. (2007). Cladistic Analysis Applied to the Classification of Volcanoes. Bull. Volcanol. 70, 203–220. doi:10.1007/s00445-007-0132-7
Jenkins, S. F., Biass, S., Williams, G. T., Hayes, J. L., Tennant, E. M., Yang, Q., et al. (2021). Evaluating and Ranking Southeast Asia's Exposure to Explosive Volcanic Hazards. Nat. Hazards Earth Syst. Sci. Discuss.. doi:10.5194/nhess-2021-320
Jenkins, S. F., Magill, C. R., and Blong, R. J. (2018). Evaluating Relative Tephra Fall Hazard and Risk in the Asia-Pacific Region. Geosphere 14, 492–509. doi:10.1130/GES01549.1
Jenkins, S. F., Wilson, T. M., Magill, C., Miller, V., Stewart, C., Blong, R., et al. (2015). “Volcanic Ash Fall Hazard and Risk,” in Global Volcanic Hazards and Risk. S. C. Loughlin, S. Sparks, S. K. Brownet al. (Cambridge: Cambridge University Press), 173–222. doi:10.1017/cbo9781316276273.005
Jenkins, S., Magill, C., McAneney, J., and Blong, R. (2012). Regional Ash Fall Hazard I: a Probabilistic Assessment Methodology. Bull. Volcanol. 74, 1699–1712. doi:10.1007/s00445-012-0627-8
Kristiansen, N. I., Stohl, A., Prata, A. J., Bukowiecki, N., Dacre, H., Eckhardt, S., et al. (2012). Performance Assessment of a Volcanic Ash Transport Model Mini-Ensemble Used for Inverse Modeling of the 2010 Eyjafjallajökull Eruption. J. Geophys. Res. 117. doi:10.1029/2011JD016844
Lara, L. E., Moreno, R., Amigo, Á., Hoblitt, R. P., and Pierson, T. C. (2013). Late Holocene History of Chaitén Volcano: New Evidence for a 17th Century Eruption. andgeo 40, 249–261. doi:10.5027/andgeoV40n2-a04
Loughlin, S. C., Vye-Brown, C., Sparks, R. S. J., Brown, S. K., Barclay, J., Calder, E., et al. (2015). “An Introduction to Global Volcanic Hazard and Risk,” in Global Volcanic Hazards and Risk. S. C. Loughlin, S. Sparks, S. K. Brownet al. (Cambridge: Cambridge University Press), 1–80. doi:10.1017/cbo9781316276273.003
Martell, M., Miles, S., and Choe, Y. (2020). Modeling of Lifeline Infrastructure Restoration Using Empirical Quantitative Data. arXiv:200800991 [stat].
Marulanda, M. C., de la Llera, J. C., Bernal, G. A., and Cardona, O. D. (2021). Epistemic Uncertainty in Probabilistic Estimates of Seismic Risk Resulting from Multiple Hazard Models. Nat. Hazards 108, 3203–3227. doi:10.1007/s11069-021-04820-8
Marzocchi, W., Sandri, L., Gasparini, P., Newhall, C., and Boschi, E. (2004). Quantifying Probabilities of Volcanic Events: The Example of Volcanic Hazard at Mount Vesuvius. J. Geophys. Res. 109. doi:10.1029/2004JB003155
Marzocchi, W., Sandri, L., and Selva, J. (2008). BET_EF: a Probabilistic Tool for Long- and Short-Term Eruption Forecasting. Bull. Volcanol. 70, 623–632. doi:10.1007/s00445-007-0157-y
Marzocchi, W., Taroni, M., and Selva, J. (2015). Accounting for Epistemic Uncertainty in PSHA: Logic Tree and Ensemble Modeling. Bull. Seismol. Soc. Am. 105, 2151–2159. doi:10.1785/0120140131
Marzocchi, W., Zechar, J. D., and Jordan, T. H. (2012). Bayesian Forecast Evaluation and Ensemble Earthquake Forecasting. Bull. Seismol. Soc. Am. 102, 2574–2584. doi:10.1785/0120110327
Mead, S., and Magill, C. (2014). Determining Change Points in Data Completeness for the Holocene Eruption Record. Bull. Volcanol. 76, 874. doi:10.1007/s00445-014-0874-y
Miller, V., Bear-Crozier, A. N., Newey, V., Horspool, N., and Weber, R. (2016). Probabilistic Volcanic Ash Hazard Analysis (PVAHA) II: Assessment of the Asia-Pacific Region Using VAPAH. J. Appl. Volcanol. 5, 4. doi:10.1186/s13617-016-0044-3
Napsiah, N., Gunawan, B., Abdoellah, O. S., and Sulaeman, M. (2017). Economic Rationality of Residents Living in the Area Prone to Merapi Volcanic Disaster. komunitas 9, 203–215. doi:10.15294/komunitas.v9i2.10002
Newhall, C. G., Bronto, S., Alloway, B., Banks, N. G., Bahar, I., del Marmol, M. A., et al. (2000). 10,000Years of Explosive Eruptions of Merapi Volcano, Central Java: Archaeological and Modern Implications. J. Volcanol. Geotherm. Res. 100, 9–50. doi:10.1016/S0377-0273(00)00132-3
Newhall, C. G., Costa, F., Ratdomopurbo, A., Venezky, D. Y., Widiwijayanti, C., Win, N. T. Z., et al. (2017). WOVOdat - an Online, Growing Library of Worldwide Volcanic Unrest. J. Volcanol. Geotherm. Res. 345, 184–199. doi:10.1016/j.jvolgeores.2017.08.003
Newhall, C., and Hoblitt, R. (2002). Constructing Event Trees for Volcanic Crises. Bull. Volcanol. 64, 3–20. doi:10.1007/s004450100173
Papale, P. (2018). Global Time-Size Distribution of Volcanic Eruptions on Earth. Sci. Rep. 8, 6838. doi:10.1038/s41598-018-25286-y
Piironen, J., and Vehtari, A. (2017). Comparison of Bayesian Predictive Methods for Model Selection. Stat. Comput. 27, 711–735. doi:10.1007/s11222-016-9649-y
Plu, M., Scherllin-Pirscher, B., Arnold Arias, D., Baro, R., Bigeard, G., Bugliaro, L., et al. (2021). An Ensemble of State-Of-The-Art Ash Dispersion Models: towards Probabilistic Forecasts to Increase the Resilience of Air Traffic against Volcanic Eruptions. Nat. Hazards Earth Syst. Sci. 21, 2973–2992. doi:10.5194/nhess-21-2973-2021
Purwadi, H., BayuAdji, T., and Ariyanti, V. (2016). Addressing Food, Energy and Water Nexus in a Volcanic Area. Chiang Mai, Thailand: 2nd World Irrigation Forum. (WIF2) 8p.
Pyle, D. M. (2015). “Sizes of Volcanic Eruptions,” in The Encyclopedia of Volcanoes (Elsevier), 257–264. doi:10.1016/b978-0-12-385938-9.00013-4
Rodado, A., Bebbington, M., Noble, A., Cronin, S., and Jolly, G. (2011). On Selection of Analog Volcanoes. Math. Geosci. 43, 505–519. doi:10.1007/s11004-011-9345-6
Rougier, J., J. Sparks, R. S. R. S., and Cashman, K. V. (2018a). Regional and Global Under-recording of Large Explosive Eruptions in the Last 1000 Years. J. Appl. Volcanol. 7, 1. doi:10.1186/s13617-017-0070-9
Rougier, J., Sparks, R. S. J., Cashman, K. V., and Brown, S. K. (2018b). The Global Magnitude-Frequency Relationship for Large Explosive Volcanic Eruptions. Earth Planet. Sci. Lett. 482, 621–629. doi:10.1016/j.epsl.2017.11.015
Rougier, J., Sparks, S. R., and Cashman, K. V. (2016). Global Recording Rates for Large Eruptions. J. Appl. Volcanol. 5, 11. doi:10.1186/s13617-016-0051-4
Sagala, S. (2009). “Implementable Land Use Plan in Volcano Prone Area in Indonesia: Challenges and Opportunities,” in International Conference on Urban and Regional Planning: “Positioning Planning in Global Crises”, 9p.
Salvatier, J., Wiecki, T. V., and Fonnesbeck, C. (2016). Probabilistic Programming in Python Using PyMC3. PeerJ Comput. Sci. 2, e55. doi:10.7717/peerj-cs.55
Sandri, L., Tierz, P., Costa, A., and Marzocchi, W. (2018). Probabilistic Hazard from Pyroclastic Density Currents in the Neapolitan Area (Southern Italy). J. Geophys. Res. Solid Earth 123, 3474–3500. doi:10.1002/2017JB014890
Sheldrake, T., and Caricchi, L. (2017). Regional Variability in the Frequency and Magnitude of Large Explosive Volcanic Eruptions. Geology 45, 111–114. doi:10.1130/G38372.1
Sheldrake, T. (2014). Long-term Forecasting of Eruption Hazards: A Hierarchical Approach to Merge Analogous Eruptive Histories. J. Volcanol. Geotherm. Res. 286, 15–23. doi:10.1016/j.jvolgeores.2014.08.021
Siebert, L., Cottrell, E., Venzke, E., and Andrews, B. (2015). “Earth's Volcanoes and Their Eruptions: An Overview,” in The Encyclopedia of Volcanoes (Elsevier), 239–255. doi:10.1016/b978-0-12-385938-9.00012-2
Solow, A. R. (2001). An Empirical Bayes Analysis of Volcanic Eruptions. Math. Geol. 33, 95–102. doi:10.1023/A:1007514410745
Song, X., Zhu, Y., Peng, J., and Guan, H. (2018). Improving Multi-Model Ensemble Forecasts of Tropical Cyclone Intensity Using Bayesian Model Averaging. J. Meteorol. Res. 32, 794–803. doi:10.1007/s13351-018-7117-7
Surono, , Jousset, P., Pallister, J., Boichu, M., Buongiorno, M. F., Budisantoso, A., et al. (2012). The 2010 Explosive Eruption of Java's Merapi Volcano-A '100-year' Event. J. Volcanol. Geotherm. Res. 241-242, 121–135. doi:10.1016/j.jvolgeores.2012.06.018
Tierz, P., Loughlin, S. C., and Calder, E. S. (2019). VOLCANS: an Objective, Structured and Reproducible Method for Identifying Sets of Analogue Volcanoes. Bull. Volcanol. 81, 76. doi:10.1007/s00445-019-1336-3
Turner, M. B., Cronin, S. J., Bebbington, M. S., and Platz, T. (2008). Developing Probabilistic Eruption Forecasts for Dormant Volcanoes: a Case Study from Mt Taranaki, New Zealand. Bull. Volcanol. 70, 507–515. doi:10.1007/s00445-007-0151-4
Vehtari, A., Simpson, D., and Gelman, A. (2019). Pareto Smoothed Importance Sampling. arXiv:150702646 [stat].
Vehtari, A., Gelman, A., and Gabry, J. (2017). Practical Bayesian Model Evaluation Using Leave-One-Out Cross-Validation and WAIC. Stat. Comput. 27, 1413–1432. doi:10.1007/s11222-016-9696-4
Global Volcanism Program (2013). in Volcanoes of the World. Editor E. Venzke (Smithsonian Institution), v. 4.9.2. (Downloaded.January 27, 2020). doi:10.5479/si.GVP.VOTW4-2013
Wagenmakers, E.-J., and Farrell, S. (2004). AIC Model Selection Using Akaike Weights. Psychonomic Bull. Rev. 11, 192–196. doi:10.3758/BF03206482
Wang, T., Schofield, M., Bebbington, M., and Kiyosugi, K. (2020). Bayesian Modelling of Marked Point Processes with Incomplete Records: Volcanic Eruptions. J. R. Stat. Soc. C 69, 109–130. doi:10.1111/rssc.12380
Watt, S. F. L., Pyle, D. M., and Mather, T. A. (2013). Evidence of Mid- to Late-Holocene Explosive Rhyolitic Eruptions from Chaitén Volcano, Chile. andgeo 40, 216–226. doi:10.5027/andgeoV40n2-a02
Whelley, P. L., Newhall, C. G., and Bradley, K. E. (2015). The Frequency of Explosive Volcanic Eruptions in Southeast Asia. Bull. Volcanol. 77, 1. doi:10.1007/s00445-014-0893-8
Yan, H., and Moradkhani, H. (2014). “Bayesian Model Averaging for Flood Frequency Analysis,” in World Environmental and Water Resources Congress 2014 (Portland, Oregon: American Society of Civil Engineers), 1886–1895. doi:10.1061/9780784413548.189
Keywords: annual probability, volcanic hazard, volcanic risk, eruptions, Bayesian analysis
Citation: Hayes JL, Jenkins SF and Joffrain M (2022) Large Uncertainties Are Pervasive in Long-Term Frequency-Magnitude Relationships for Volcanoes in Southeast Asia. Front. Earth Sci. 10:895756. doi: 10.3389/feart.2022.895756
Received: 14 March 2022; Accepted: 19 May 2022;
Published: 28 June 2022.
Edited by:
Thomas Oommen, Michigan Technological University, United StatesReviewed by:
Melody Whitehead, Massey University, New ZealandKaroly Nemeth, Massey University, New Zealand
Copyright © 2022 Hayes, Jenkins and Joffrain. This is an open-access article distributed under the terms of the Creative Commons Attribution License (CC BY). The use, distribution or reproduction in other forums is permitted, provided the original author(s) and the copyright owner(s) are credited and that the original publication in this journal is cited, in accordance with accepted academic practice. No use, distribution or reproduction is permitted which does not comply with these terms.
*Correspondence: Josh L. Hayes, ai5oYXllc0BnbnMuY3JpLm56