Abstract
Despite having relatively short timespans of eruptions, monogenetic volcanoes can pose significant risks to the nearby population. Here, we describe the ∼1700 CE eruption of Tseax volcano, British Columbia, which killed up to 2,000 people of the Nisga’a First Nation and is ranked as Canada’s worst natural disaster. Within the Nisga’a culture, Adaawak stories preserve an observational account of the Tseax eruption. In this study, we establish the chronology of the eruption by integrating field observations and petrophysical data informed by Nisga’a oral and written histories. The Nisga’a stories corroborate the short duration and exceptional intensity of the eruption as recorded in the volcanic products. The eruption was divided in two main periods: 1) Period A and 2) Period B. 1) The eruption started in a typical Hawaiian style with low levels of lava fountaining that built up a spatter rampart. This pyroclastic edifice was breached by voluminous pāhoehoe lavas erupted at high discharge rates. We estimate that almost half of the emplaced lava volume (0.20 km3) was erupted in Period A and had a flux of 800–1,000 m3/s. The low viscosity lava reached the Nass Valley, 20 km downstream of the volcano, in “swift currents”, and engulfed the former Nisga’a villages in only 1–3 days, thus likely being responsible for the reported fatalities. The discharge rates progressively diminished to 10–200 m3/s until the end of this first eruptive period, which lasted a few weeks to a few hundred days. 2) The Period B eruption produced two ‘a‘ā lavas with discharge rates <50 m3/s. This period was also characterised by an explosive phase of eruption that built a 70 m high tephra cone overlapping with a spatter rampart; Period B lasted approximately 20 days. In total, the eruption produced 0.5 km3 of volcanic materials (mostly in the form of lava flows) on the order of weeks to a few months. The mountainous terrain significantly controlled the emplacement of lava flows that reached long distances in a short amount of time. Our work shows that, under certain conditions, eruptions of small-volume monogenetic volcanoes ca pose risks comparable to flank eruptions on long-lived shield volcanoes.
1 Introduction
Mafic volcanism is the most common type of volcanic activity on Earth and often forms volcanic fields, areas of dispersed volcanic cones and flows (Németh and Kereszturi, 2015). These mafic volcanic fields are composed of individual small-scale volcanoes that are usually monogenetic. Monogenetic volcanoes are the result of a single (or small number of), low volume magma batch that erupts over a period of hours to decades, forming relatively simple volcanic edifices compared to shield/strato-volcanoes (e.g., Hasenaka and Carmichael, 1985; Hasenaka, 1994; Kereszturi et al., 2013; Németh and Kereszturi, 2015; Smith and Németh, 2017). The eruption style of monogenetic volcanoes often ranges from Hawaiian lava fountaining building spatter edifices to Strombolian explosive style building tephra cones. Lava flows up to several tens of kilometers long are also often produced. Monogenetic volcanic fields are sometimes located in areas close to population centres and, as a result, represent an unpredictable volcanic hazard (e.g., Auckland volcanic field; Bebbington and Cronin, 2011; Kereszturi et al., 2013).
Although relatively distant from major population centres the Northern Cordillera Volcanic Province (NCVP) in Western Canada, hosts more than 100 monogenetic volcanic centres, mostly consisting of isolated pyroclastic cones and associated lava flows (Figure 1; Edwards and Russell, 1999; Edwards and Russell, 2000). At least 37 eruptions have occurred in the NCVP in the past 10,000 years (Edwards and Russell, 2000; Stasiuk et al., 2003), making it the most active volcanic region in Canada. Tseax volcano (pronounced “See-Ax”, Wil Ksi Baxhl Mihl in the Nisga’a language), in western central British Columbia, is the second-youngest volcanic centre in Canada (Figure 1), with an eruption date between 1,675 and 1,778 CE (Williams-Jones et al., 2020). The volcano is associated with several small pyroclastic edifices and far-travelled lava flows (Sutherland Brown, 1969; Le Moigne et al., 2020). The eruption was recorded in the Adaawak (traditional oral histories) of the Nisga’a First Nation as they were significantly impacted with potentially up to 2,000 fatalities in three destroyed villages (Collison and Seeley, 1915; McCullagh, 1918; Hanson, 1924; Barbeau, 1935; Nisga’a Tribal Council, 2004; Williams-Jones et al., 2020), making it Canada’s deadliest volcanic event (Hickson and Edwards, 2001). Despite a rich oral history, the exact sequence and timing of the volcanic events has been difficult to establish. Furthermore, only a relatively limited number of scientific studies have been made on Tseax volcano including dating (Symons, 1975; Wuorinen, 1978; Williams-Jones et al., 2020), physical mapping (Hanson, 1924; Sutherland Brown, 1969; Le Moigne et al., 2020) and geochemistry studies (Higgins, 2009; Gallo, 2018; Le Moigne et al., 2022).
FIGURE 1
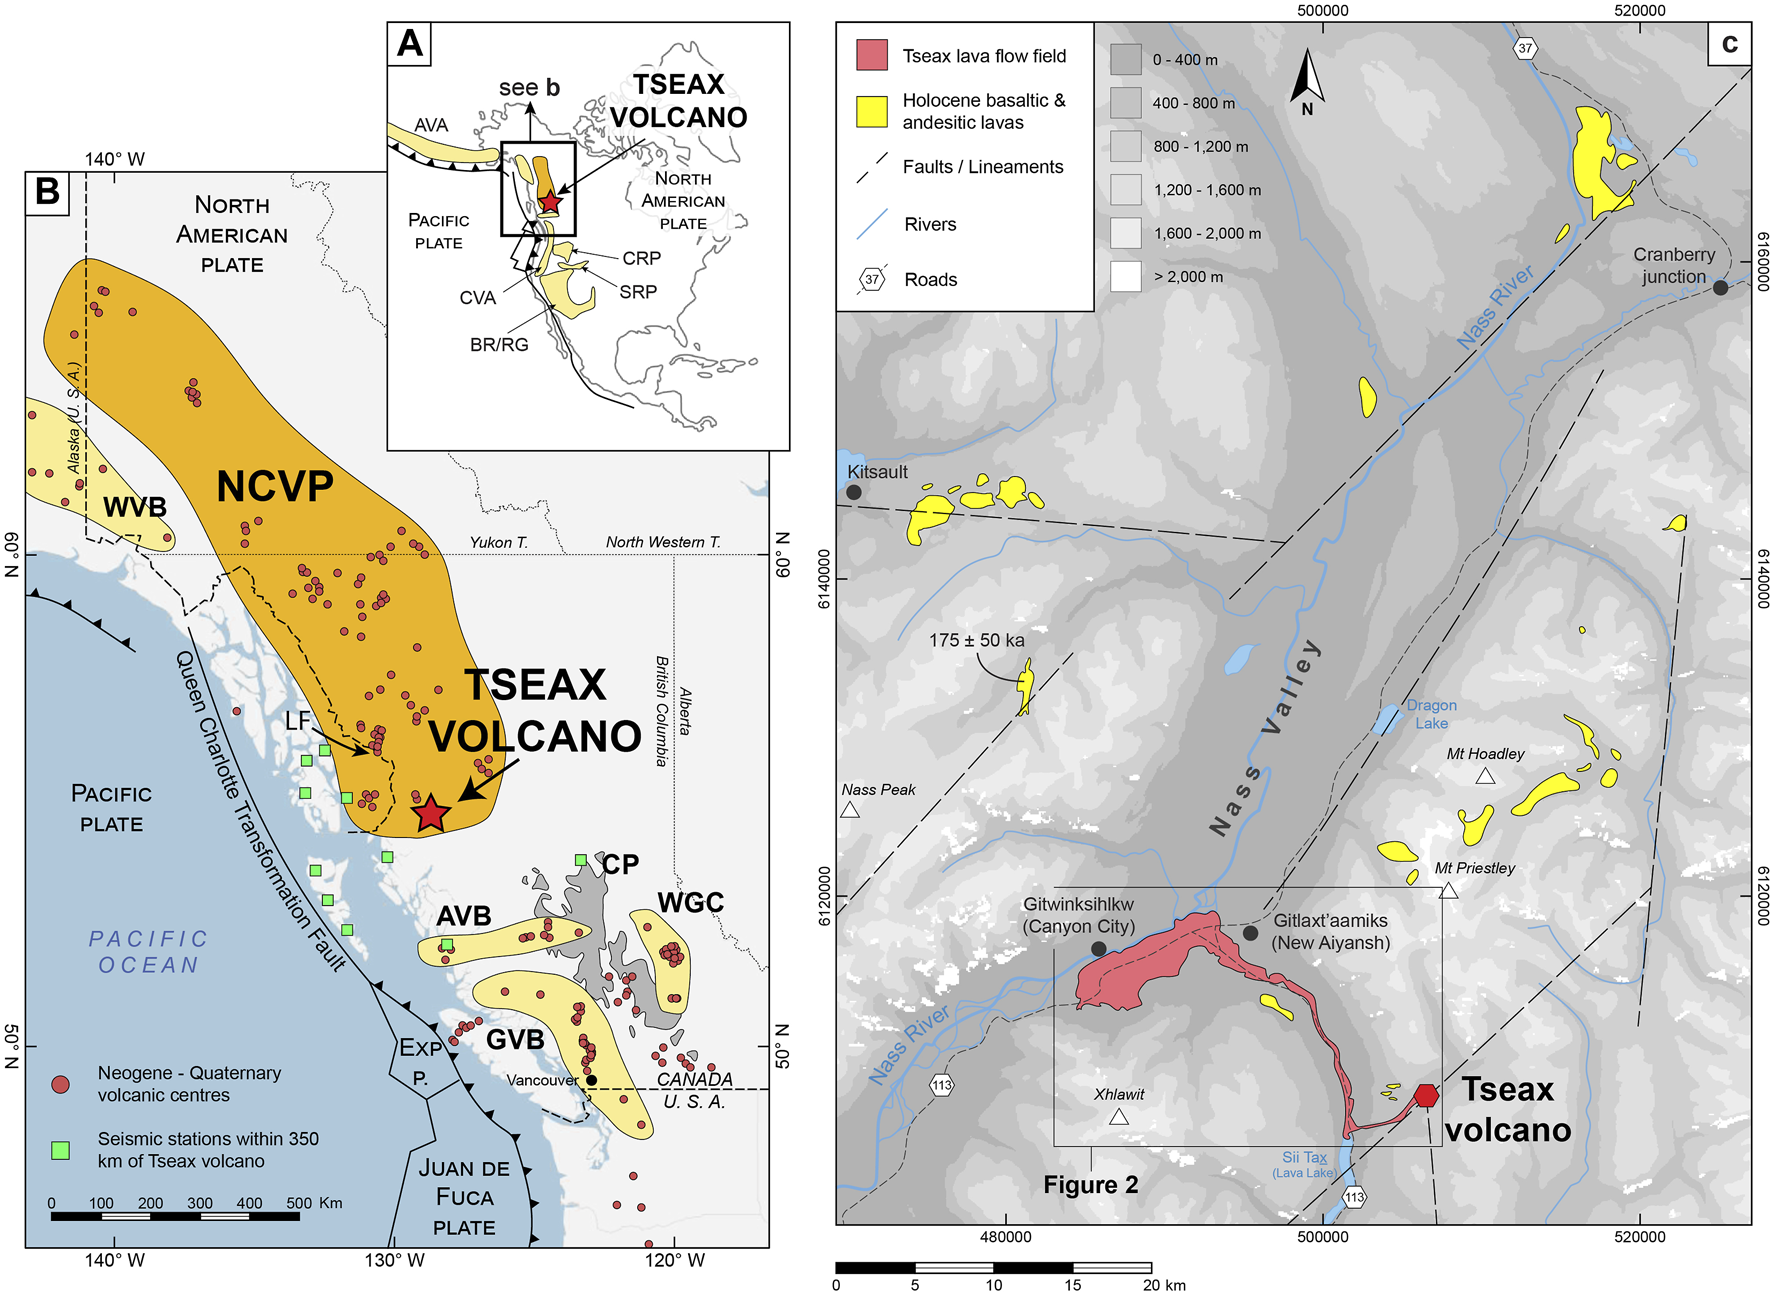
Location of Tseax volcano in North America and western Canada. (A) The active volcanic regions in north-western North America. BR/RG, Basin and Range/Rio Grande Rift; SRP, Snake River Plain; CRP, Columbia River Plateau; CVA, Cascades Volcanic Arc; AVA, Aleutian Volcanic Arc. (B) Location of Tseax volcano in Northwest British Columbia. Tseax is located near the southern end of the Northern Cordillera Volcanic Province (NCVP). GVB, Garibaldi Volcanic Belt; WGC, Wells Gray–Clearwater Volcanic Field; AVB, Anaheim Volcanic Belt; WVB, Wrangell Volcanic Belt; Exp p, Explorer plate (Modified from Edwards and Russell 1999; Edwards and Russell 2000). (C) Identified Holocene volcanic rocks in the Nass Valley area (BC Hydro 1981; van der Heyden et al., 2000; Evenchick et al., 2008). The Tseax volcanic field is highlighted in red. Faults and lineaments are from BC Hydro (1981), Evenchick et al. (2008). Note that Tseax volcano is roughly located at the intersection of N45 and north-south trending lineaments. Geographical coordinates are in UTM Zone 9N.
In this study, we provide a comprehensive and detailed eruptive model of the ∼1,700 CE Tseax eruption. We first summarise the main results from recent studies regarding the age, volume and description of the volcanic products. This information is used to reconstruct the dynamics, chronology of the eruption, and the sequence of events that ultimately led to the Nisga’a fatalities. Fishery and forestry industries and ∼1,000 people currently live in close proximity to the volcano and Tseax is part of the Anhluu’t’ukwsim Laxmihl Angwiga’asanskwhl Nisga’a (Nisga’a Memorial Lava Bed Provincial Park) including several tourist attractions. Therefore, this work also provides important information in support of future hazard and risk assessments for the area.
2 Regional and Local Settings
Western North America comprises several active volcanic belts (Figure 1A), and Western Canada alone is made up of four distinct volcanic regions, including the Northern Cordilleran Volcanic Province (NCVP; Figure 1B; Edwards and Russell, 1999). It is approximately 1,200 km long and 400 km wide, extending from Northwest British Columbia to the Yukon and Eastern Alaska (Figure 1B). More than 100 volcanic centres have been identified to date in the NCVP totalling ∼1,900 km3 (Edwards and Russell, 1999; Edwards and Russell, 2000, and references therein) although the majority of the NCVP volcanic centres are small volume edifices, i.e., <1 to a few km3. They are scattered across BC and the Yukon and consist of isolated pyroclastic cones and associated lava flows typical of monogenetic volcanoes (Edwards 1997; Edwards and Russell, 1999; Edwards and Russell, 2000).
The NCVP has a bimodal chemical signature with 70% alkali basalts to hawaiites and ∼30% basanites to nephelinites (Edwards and Russell, 2000). The geochemical compositions of the NCVP lavas are consistent with a mantle source having an OIB-like composition (Edwards and Russell, 1999; Edwards and Russell, 2000). Since its beginning (20–15 Ma), volcanism in the NCVP is mainly attributed to upwelling of asthenosphere related to back-arc extension (Edwards and Russell 2000; Batir and Blackwell, 2019). The alkaline volcanism may be attributed to adiabatic decompression melting of the lithosphere and a high temperature flux provided by the rise of the underlying asthenosphere (i.e., Thorkelson and Taylor, 1989; Manthei et al., 2010; Thorkelson et al., 2011) to a depth of ∼65 km (Edwards and Russell, 2000; Harder and Russell, 2006; Batir and Blackwell, 2019).
Volcanism in the NCVP dates from the Neogene to the Quaternary with a minimum rate of magmatism at 10−4 km3/yr (Edwards and Russell, 2000). Temporal and spatial reconstruction of its evolution is difficult due to the paucity of radiometric data and the fact that many volcanic edifices were partially or entirely eroded during the last ice age (Edwards, 1997). Pleistocene to Holocene volcanism is widespread throughout the NCVP including many small-scale volcanic edifices (e.g., Tseax volcano; Prindle volcano, Volcano Mountain, Lava Fork; Edwards and Russell, 2000). Thirty-seven volcanic eruptions have been identified covering the past 10 ka with the youngest corresponding to an eruption in Lava Fork ∼0.22 ka years ago (noted LF on Figure 1B; Elliot et al., 1981; Hauksdottir, 1992; Edwards and Russell, 2000) making the NCVP by far the most active volcanic region in Canada (Hickson and Edwards, 2001; Stasiuk et al., 2003).
Tseax volcano (55.112 N, −128.900 W) is one of the southernmost volcanic centres of the NCVP (Edwards and Russell, 1999; Edwards and Russell, 2000), located in central Western British Columbia (∼760 km North of Vancouver, BC), near the town of Gitlaxt’aamiks (New Aiyansh) and Gitwinksihlkw (Canyon City) (Figure 1; Le Moigne et al., 2020). The region is part of the Coast Belt plutonic complex (Woodsworth et al., 1991) and Tseax is located in the Hazelton mountain range (Evenchick et al., 2008). Tseax volcano developed near the intersection of North and Northeast trending lineaments (Figure 1C; BC Hydro 1981; Evenchick et al., 2008). Other occurrences of Holocene alkali olivine basalts are mapped north of Tseax on both sides of the Nass Valley and an age of 175 ± 50 ka is given for a flow filling a paleocanyon South of the abandoned town of Kitsault; Figure 1C; Evenchick et al., 2008). These lavas are either eroded columnar jointed basalts or small tuyas totalling a surface area of ∼79 km2.
A pre-eruption geography of the Nass Valley, the region surrounding Tseax and the location of the former Nisga’a villages is proposed by the Nisga’a First Nation (Figure 2A; Nisga’a Tribal Council and B. C. Parks Committee, 1997; Nisga’a Tribal Council, 2004). The bottom of Crater Creek valley was occupied by a small creek (Crater Creek). Sii Tax (Lava Lake), located South of the mouth of Crater Creek valley already existed but was substantially smaller than today. This lake is the source of the Tseax River that was flowing northwards in the Tseax River valley. At the time of eruption, a fish camp was located on the shore of a small lake (Tam Gimwits’ax) formed by the Tseax River. Several smokehouses were situated near the mouth of the Tseax River, at the confluence with the Nass River in an area called Lax Wiilaxk’ap. Before the eruption, the Nass River flowed along the southern edges of the Nass Valley (∼2.5 km further south than its current position). Between the mouths of the Tseax River and Vetter Creek, the meandering Nass River was ∼1 km wide and the village of Lax Ksiluux was located on its Northern shore. At this place, the Nass River may have been so wide that it was described as a lake (Barbeau, 1935). Further downstream, the Nass River narrowed and the villages of Laxksiwihlgest and Ts’oohlts’ap were located along its southern shore (Figure 2A).
FIGURE 2
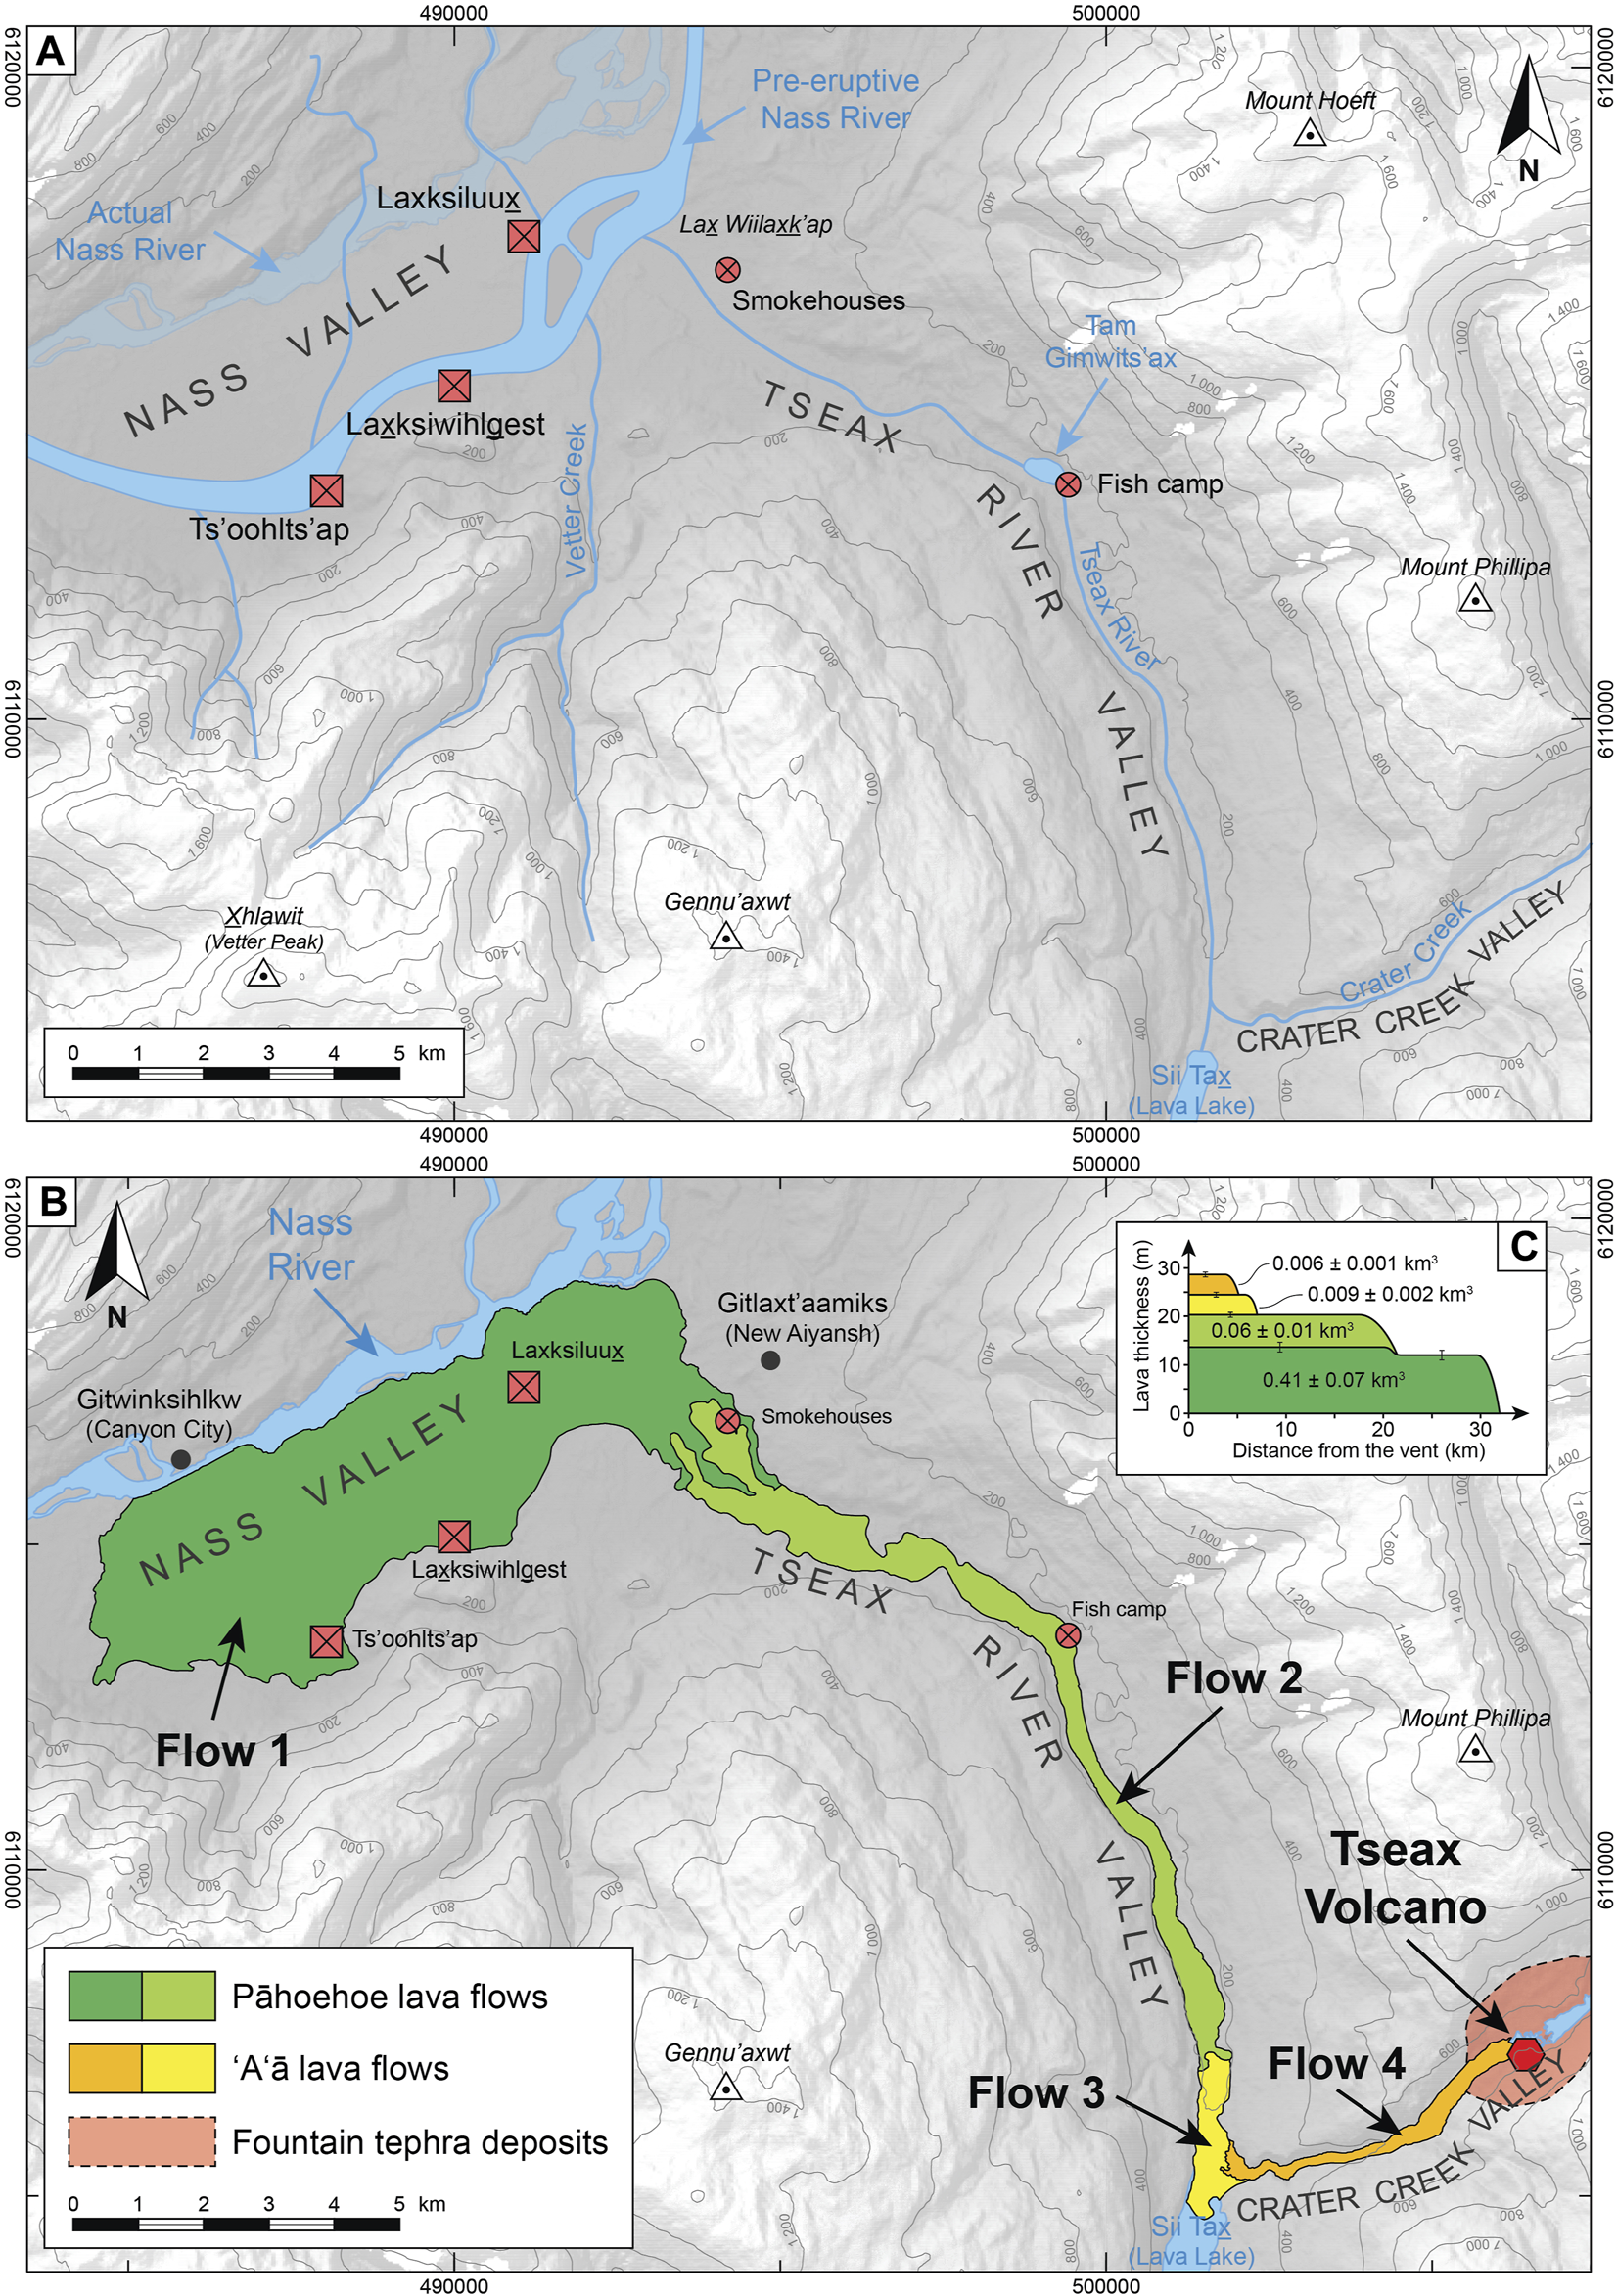
(A) Pre-eruption geography of the Tseax area. The approximate locations of the former Nisga’a villages, smokehouses and fish camps are also shown. Extensively modified from Nisga’a Tribal Council and B.C. Parks Committee. (1997). (B) Simplified map of the Tseax lava flow field. The lava field is divided into four lava flows: 2 pāhoehoe lava flows (Flow 1 and Flow 2) and 2 ‘a‘ā lava flows (Flow 3 and Flow 4). Coordinates system: UTM Projection Zone 9N, WGS 1984 Datum. Modified after Le Moigne et al. (2020). (C) Simplified stratigraphy of the lava flow field. Vertical exaggeration: 550×.
3 Methodology
In order to investigate the dynamism of the ∼1,700 CE eruption of Tseax volcano, publicly available oral and written records from the Nisga’a people (Adaawak) of the eruption were gathered (Supplementary Table S1). Other accounts of the eruption exist, but they are only for the Nisga’a to tell and are therefore not presented in this work.
Fieldwork was carried out on Tseax volcano to map the distribution of the lava flows and tephra deposits and with the aim of establishing the stratigraphy of the volcanic products. The calculations of the lava and tephra volumes are based on field observations, aerial imagery, photogrammetry and bathymetric surveys. Datasets of high resolution aerial photos acquired from aircraft above Tseax volcano and Crater Creek Valley were used to construct a DEM of the lava flow field and surrounding area (Le Moigne et al., 2020). This DEM was used to investigate the lava flow surface morphologies and the calculation of the lava and tephra volumes. We only have a single geotechnical drilling report for the entire lava flow field. It is located in the Nass Valley near the town of Gitwinksihlkw (Figure 2B) and was provided by the Ministry of Transportation and Highways of British Columbia (Purssell, 1993). We assumed that the lava depth indicated by this drilling (12 m) is representative of the flow thickness in the Nass Valley. An arbitrary error of ±2 m was added in order to account for lavas that may have undergone different inflation processes. Along Crater Creek and Tseax River valleys, 16 topographic profiles were constructed perpendicular to the flow. In order to determine the lava thickness, we reconstructed a possible pre-eruptive topography by extending the slopes on both sides of the valleys. The volumes in these valleys were bracketed between the minimum and maximum estimated depth and the total lava flow field volume was calculated by adding the lava volumes in the Nass, Tseax River and Crater Creek valleys. The Tseax lava flow field is partially submerged by Lava Lake and Melita Lake (Figure 2). Bathymetry data were acquired for these two lakes using a Lowrance Elite 5Ti chart plotter with a 10 Hz internal high-sensitivity GPS receiver with DGPS and WAAS correction. These mapping and volume calculation methods are detailed in Le Moigne et al. (2020).
Grain size and componentry analyses were performed for 18 proximal and distal locations. These samples were located 140–1,420 m from the main vent and selected to represent different domains of the tephra fallout deposits. The samples were dried and manually cleaned to remove organic material. Dried samples were then sieved using standard sieves with mesh spacings of 64, 32, 16, 8, 4, 2, and 1 mm. Each size fraction was then weighed using a Ohaus Adventurer-Pro balance. Finally, Inman parameters were calculated to estimate the degree of sorting following the approach of Cas and Wright (1987).
For petrographic investigations, lava samples were collected from each identified lava flow (except Flow 3) and pyroclastic edifices. Twenty-three bulk compositions were measured by ALS Minerals in North Vancouver, British Columbia. Major oxides were measured by X-Ray fluorescence and FeO (wt%) was estimated by iron titration on rock powder. Trace and Rare Earth Elements were measured by ICP-MS. Mineral modes were estimated from petrographic investigations of thin sections prepared by Vancouver Petrographics, Langley, British Columbia. Electron microprobe analyses of mineral phases were performed using a CAMECA SX100 electron microprobe at the Laboratoire Magmas et Volcans, Université Clermont Auvergne, Clermont-Ferrand, France. Thermobarometry and trace element modelling were then performed to estimate the magmatic origin and evolution of the Tseax magma before eruption. These data and methods are reported and detailed in Le Moigne et al. (2022).
4 Results
4.1 The Eruption of Tseax Volcano According to the Nisga’a Adaawak (Written and Oral Histories)
Before investigating the dynamics of the ∼1,700 CE Tseax eruption, it is important first to consider the observational data provided by the Nisga’a oral traditions and history (Adaawak) along with written stories (Supplementary Table S1). The eruption of Tseax forms an important part of the Nisga’a culture as it may have caused up to 2,000 fatalities, destroyed three villages, and substantially changed the local environment (Figure 2; Nisga’a Tribal Council and B.C. Parks Committee, 1997); several Adaawak refer to the eruption of Tseax. While these Adaawak are only for the Nisga’a to tell, the Adaawak Laxmihl (Where the Fire Ran Out) is related to the eruption and publicly available (Nisga’a Tribal Council, 2004). Moreover, important observational details have been reported by missionaries and anthropologists in the late 19th and early 20th centuries (Collison, 1915; McCullagh, 1918; Barbeau, 1935; Higgins, 2009; Williams-Jones et al., 2020).
A key feature that emerges from the
Adaawak
and written accounts (
Supplementary Table S1) is the relatively short duration of the eruption (
Williams-Jones et al., 2020), probably on the order of days to a few weeks (“
…the whole valley was on fire, which continue for many days…,” “
The stone was red and hot there for many days…” (
Collison, 1915;
Barbeau, 1935). From these stories, a tentative sequence of events would be the following:
1) Before the eruption started, small earthquakes were felt by the Nis
g
a’a (“The rumbling was heard once and soon the ground began to shake…”; Barbeau, 1935);2) At first, the eruption produced an eruptive column that was witnessed from the former Nis
g
a’a villages (“…a big pillar of smoke. It was as if a house was burning on the mountain top…”; Barbeau, 1935). Stories from Nisg
a’a communities not in close proximity to the volcano (locations adjacent to the Nass Valley or further downstream the Nass River) also mentioned the eruption (D. Nyce, pers. comm. 2019). Considering the mountainous nature of the area, this may suggest a convective eruption column several kilometres high;3) The lava emerged from Crater Creek valley into Tseax River valley. There, the lava blocked Tseax River where it came out of what is now Sii Ta
x
(Lava Lake) and progressively enlarged the lake to its present size. It was only “after a few years” that the Tseax River flowed again to the Nass Valley and “came back at the place where the stream was blocked up” (Barbeau, 1935);4) In the Nass Valley, some Adaawa
k
refer to a fast moving lava flow at the beginning of the eruption (“…the people saw the flames coming towards them in huge swift currents…”, “The fire then rolled down like a river…”; Barbeau, 1935). Other accounts suggest that the villages were engulfed by a slow-moving lava flow (“The fire came down the side in their direction, but not as fast as forest fire. It moved down slowly, very slowly…”; Barbeau, 1935). The lava flows may have been partly responsible for the Nisg
a’a fatalities (“Others canoed to the far side of the river but were killed by the lava…”; Nisga’a Tribal Council, 2004) as some people may have been trapped during their flight between the Nass River and the advancing lava flow (D. Nyce, pers. comm. 2019). The lava flow displaced the Nass river from the southern to the northern sides of the Nass Valley (“It flowed along by the base of the mountains on the farther side of the valley some miles away…”; Collison, 1915);5) A violent lava-water interaction may have produced a “vog” (e.g., Williams-Jones and Rymer, 2015; Carlos et al., 2018), i.e., the “spirit cloud” (Collison, 1915), that may also have been responsible for the fatalities (“…came Pluvius, pouring over all a cooling stream: Great the ire of Ignis, roaring, he dispelled it all in steam! Mighty rocks he rent in pieces; flung them high into the air…”, “There were fumes spreading ahead, and those who smelled them were smothered. They died and their body stiffened like rock…”; Collison, 1915; McCullagh, 1918; Barbeau, 1935).
4.2 Age of the Eruption
The age of the eruption of Tseax has previously been determined from scientific methods (McCullagh, 1918; Hanson, 1924; Sutherland Brown, 1969; Lowdon et al., 1971; Symons, 1975; Wuorinen, 1978; Roberts and McCuaig, 2001; Williams-Jones et al., 2020) and from Nisga’a Adaawak (Collison, 1915; McCullagh, 1918; Barbeau, 1935; Higgins 2009; Williams-Jones et al., 2020). Using dendrochronology, Hanson. (1924) and McCullagh, 1918 estimated the date of the eruption at 1,753 and 1,770 CE, respectively. Radiocarbon dating of carbonised wood gave calibrated dates of 250 ± 130 BP and 230 ± 50 BP (Sutherland Brown, 1969; Lowdon et al., 1971; Roberts and McCuaig, 2001; Williams-Jones et al., 2020). New radiocarbon dating performed on wood charcoal sampled immediately beneath Tseax tephra in conjunction with paleomagnetic studies constrain the eruption date to between 1,675 and 1,778 cal. CE (Williams-Jones et al., 2020). These dates correlate well with the Nisga’a Adaawak that dates the eruption to the 18th century (Hanson, 1924; Barbeau, 1935; Wuorinen, 1978; Williams-Jones et al., 2020). Finally, based on the Nisga’a oral histories, the eruption most likely occurred during the summer, between June and September (H. Nyce, pers. comm. 2019; Williams-Jones et al., 2020).
4.3 Description of the Volcanic Products
4.3.1 Lava Flows
4.3.1.1 Stratigraphy and Volumes
Figure 2B provides a simplified volcanological map of the Tseax lava field and the principal geometrical characteristics of the lava flow field are provided in Table 1. The total lava flow field volume is 0.49 ± 0.08 km3 covering a surface of 36.04 km2 (Le Moigne et al., 2020). The lava flows originate from a vent in Crater Creek valley (Figure 2B) and filled the narrow V-shaped Crater Creek and Tseax River valleys to depths of 30.5 ± 5.5 m and 22 ± 4 m, respectively. At the bottom of Crater Creek valley, a small volume of lava enters Lava Lake and bathymetric surveys show that the flow field terminates at about 250–270 m from the northern shore of Lava Lake at ∼27 m depth (Le Moigne et al., 2020). In the Nass Valley flats, more than 20 km from the vent, the lava spreads out to the South-West where it forms a ∼11 km long by ∼2.5 km wide lava field with an average thickness of 12 m. This corresponds to a volume of approximately 0.32 ± 0.03 km3. The Northern edges of the lava are in contact with the Nass River. Near the town of Gitwinksihlkw, a lava cliff of 4–7 m forces the Nass River to flow through a narrow canyon (Le Moigne et al., 2020).
TABLE 1
| Flow # | Type | Avg slope | Avg thickness | Avg width | Length | Surface Area | Volume (error) |
|---|---|---|---|---|---|---|---|
| m | km | km | km2 | km3 | |||
| Flow 1 | Pāhoehoe | 0.2a; 2.5 ± 0.6b | 12 ± 2a; 14 ± 2b | 2.47a; 0.30b | 31.6 | 26.97 | 0.41 ± 0.07 |
| Flow 2 | Pāhoehoe | 2.5 ± 0.6 | 7 ± 1 | 0.44 | 21.2 | 6.74 | 0.06 ± 0.01 |
| Flow 3 | ‘A‘ā | 3.1 ± 0.4 | 4.5 ± 1 | 0.28 | 7.2 | 1.11 | 0.009 ± 0.002 |
| Flow 4 | ‘A‘ā | 3.1 ± 0.4 | 4.5 ± 1 | 0.26 | 5.3 | 1.22 | 0.006 ± 0.001 |
| Total | 0.49 ± 0.08 | ||||||
Type and geometrical characteristics of the Tseax lava flows (from Le Moigne et al., 2020).
Average in the Nass Valley.
Average in Crater Creek valley and in Tseax River valley.
The lava flow field is divided into four lava flows (Figure 2B): the earliest lava flows are the pāhoehoe Flow 1 and Flow 2, and the uppermost are the ‘a‘ā Flow 3 and Flow 4 (Figure 2B). Flow 1 is the most voluminous and longest flow (32 km) with 0.41 ± 0.07 km3 of lava representing ∼84% of the total erupted volume. At more than 21 km long, Flow 2 has a volume of 0.06 ± 0.1 km3. The two ‘a‘ā flows are constrained to Crater Creek valley and the southern part of Tseax River valley (Figure 2B) with estimated volumes of 0.009 ± 0.002 and 0.006 ± 0.001 km3.
4.3.1.2 Morphologies
The two ‘a‘ā lava flows show brecciated, rough and jagged surfaces made of loose angular to rounded lava fragment clinkers (Figure 3A). The majority of clinkers are 0.1–0.5 m in diameter, with the largest fragments up to 2 m in diameter. The terminus of Flow 3 displays a series of pressure ridges oriented perpendicular to flow direction.
FIGURE 3
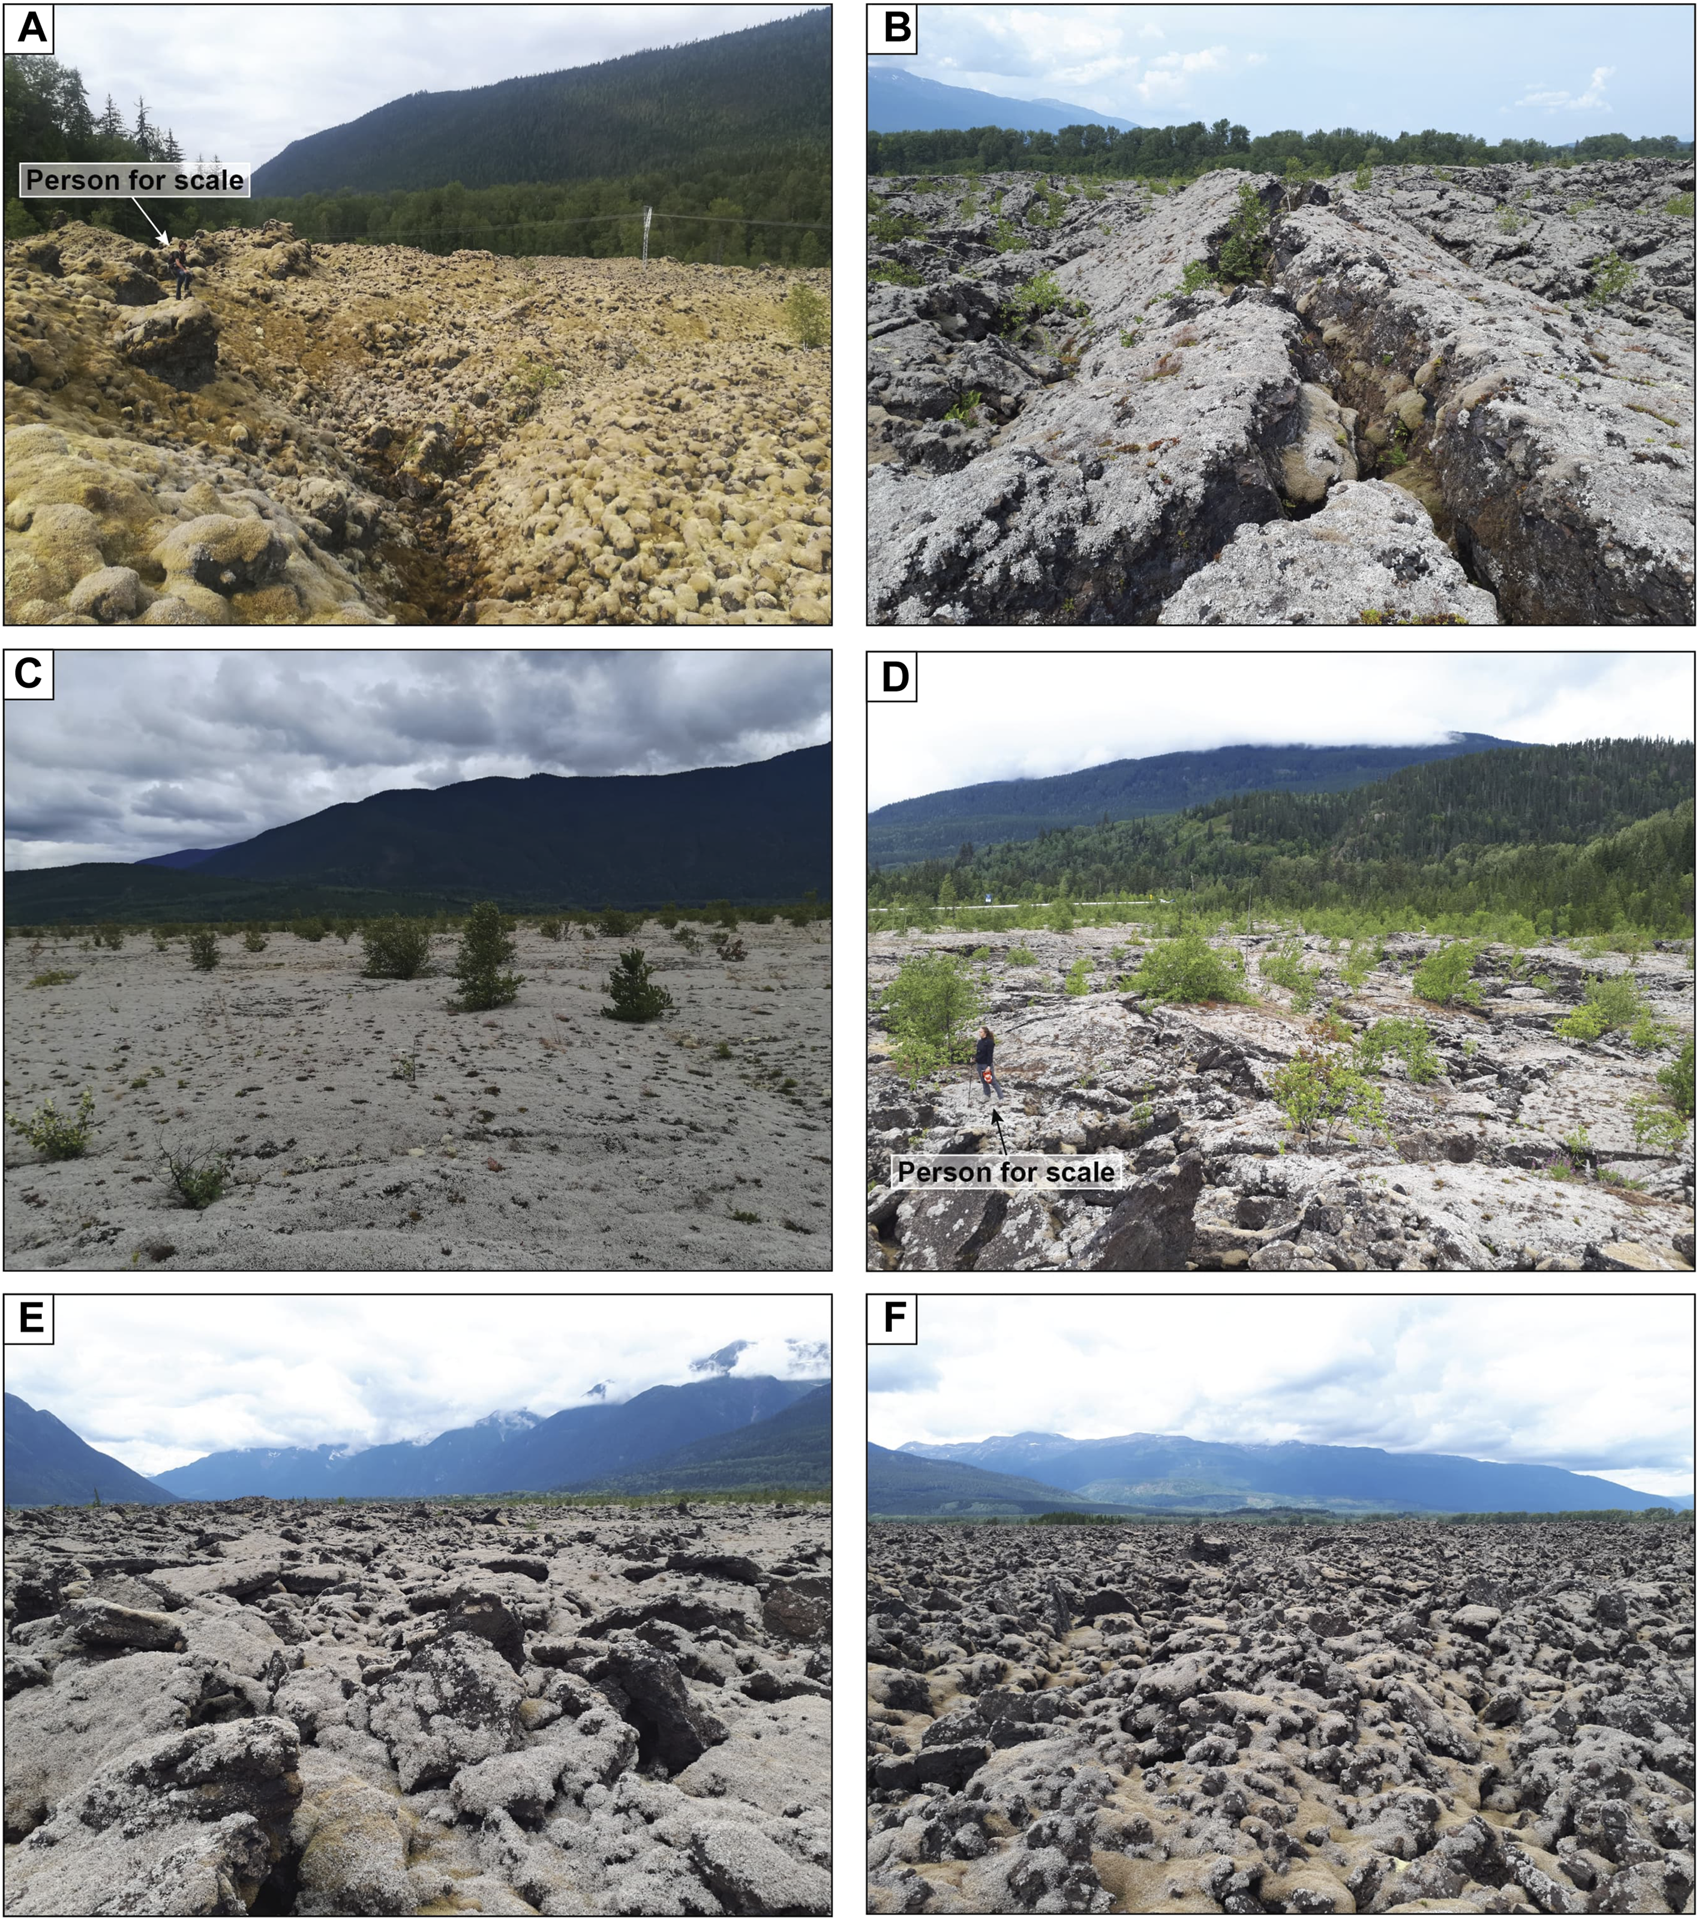
Main Tseax lava flow surface morphologies. Note that the entire lava flow field is covered by a few cm-thick layer of grey to yellow lichens and mosses. (A) “A”ā lava flow at the bottom of Crater Creek valley. (B) Hummocky pāhoehoe. (C) Lava-rise. (D) Hummocky-to-lava-rise. (E) Slabby pāhoehoe. (F) Slabby-to-rubbly pāhoehoe.
Pāhoehoe flows are the longest, most voluminous and stratigraphically lowest of the lava flow field (Figures 2B,C). There are various pāhoehoe surface flow morphologies implying different mechanism of emplacement and flow regimes. Flow 1 has many surface flow features characteristic of inflated lava flows (Figure 3). This includes large areas of hummocky pāhoehoe, lava rises, and numerous lava-rise pits (Walker, 1991).
Hummocky pāhoehoe is a very irregular inflated pāhoehoe lava flow surface with hummocks called tumuli (Swanson, 1973; Hon et al., 1994). These tumuli are up to 200 m long, sinuous and 1–4 m in height. They are pāhoehoe lava lobes that failed to coalesce or have undergone differential inflation processes. Hummocky pāhoehoe is mainly found along the northern and western most margins of the flow field in the Nass Valley (Figure 3B). Lava rises are uniquely found on Flow 1 in the western part of the Nass Valley (Figure 3C). They are large flat surfaces of fully developed inflated flows (Walker, 1991) only disturbed by lava rise pits or superficial cooling cracks. Lava rise regions are up to 1.5 km wide without significant change in surface morphology. There is a continuum between hummocky pāhoehoe and lava rise morphology types (Figure 3D).
Flow 2 and large surfaces of lava in the Nass Valley are disrupted, i.e., made of slabby or slabby-to-rubbly pāhoehoe (Figures 3E,F). They are found upstream of hummocky pāhoehoe or lava-rises and are formed as the lava internal pressure increases along with increases in the lava supply; the top crust is broken into slabs and progressively into smaller fragments or rubble (Peterson and Tilling, 1980; Keszthelyi and Thordarson, 2000; Guilbaud et al., 2005). Slabby pāhoehoe consists of 0.1–1 m thick, 1–10 m2 broken vesiculated fragments of pāhoehoe top crust creating a chaotic flow surface (Figures 3E,F). Flow 2 is essentially composed of slabby pāhoehoe and it is also the principal flow surface morphology on Flow 1. The slabby-to-rubbly pāhoehoe morphology is only found on Flow 1 at the mouth of the Tseax River valley.
4.3.2 Stratigraphy and Characteristics of the Tephra
Tseax volcano is composed of two nested, but not exactly coaxial structures: an external horseshoe-shaped spatter rampart and an inner tephra cone (Figure 4; Sutherland Brown, 1969; Le Moigne et al., 2020). Two vertical walls (∼250 m long) of the spatter rampart are visible to the west and south of Tseax. These spatter walls are ∼15–25 m high, but their bases are hidden beneath thick deposits of tephra sourced from the inner cone (Figure 4). The spatter rampart is composed of layers of agglutinated spatter and scoria variably coalesced (see Figure 5 for more stratigraphic details). The total volume of the spatter edifice is 1.1 ± 0.3 × 10⁶ m3 (Le Moigne et al., 2020).
FIGURE 4
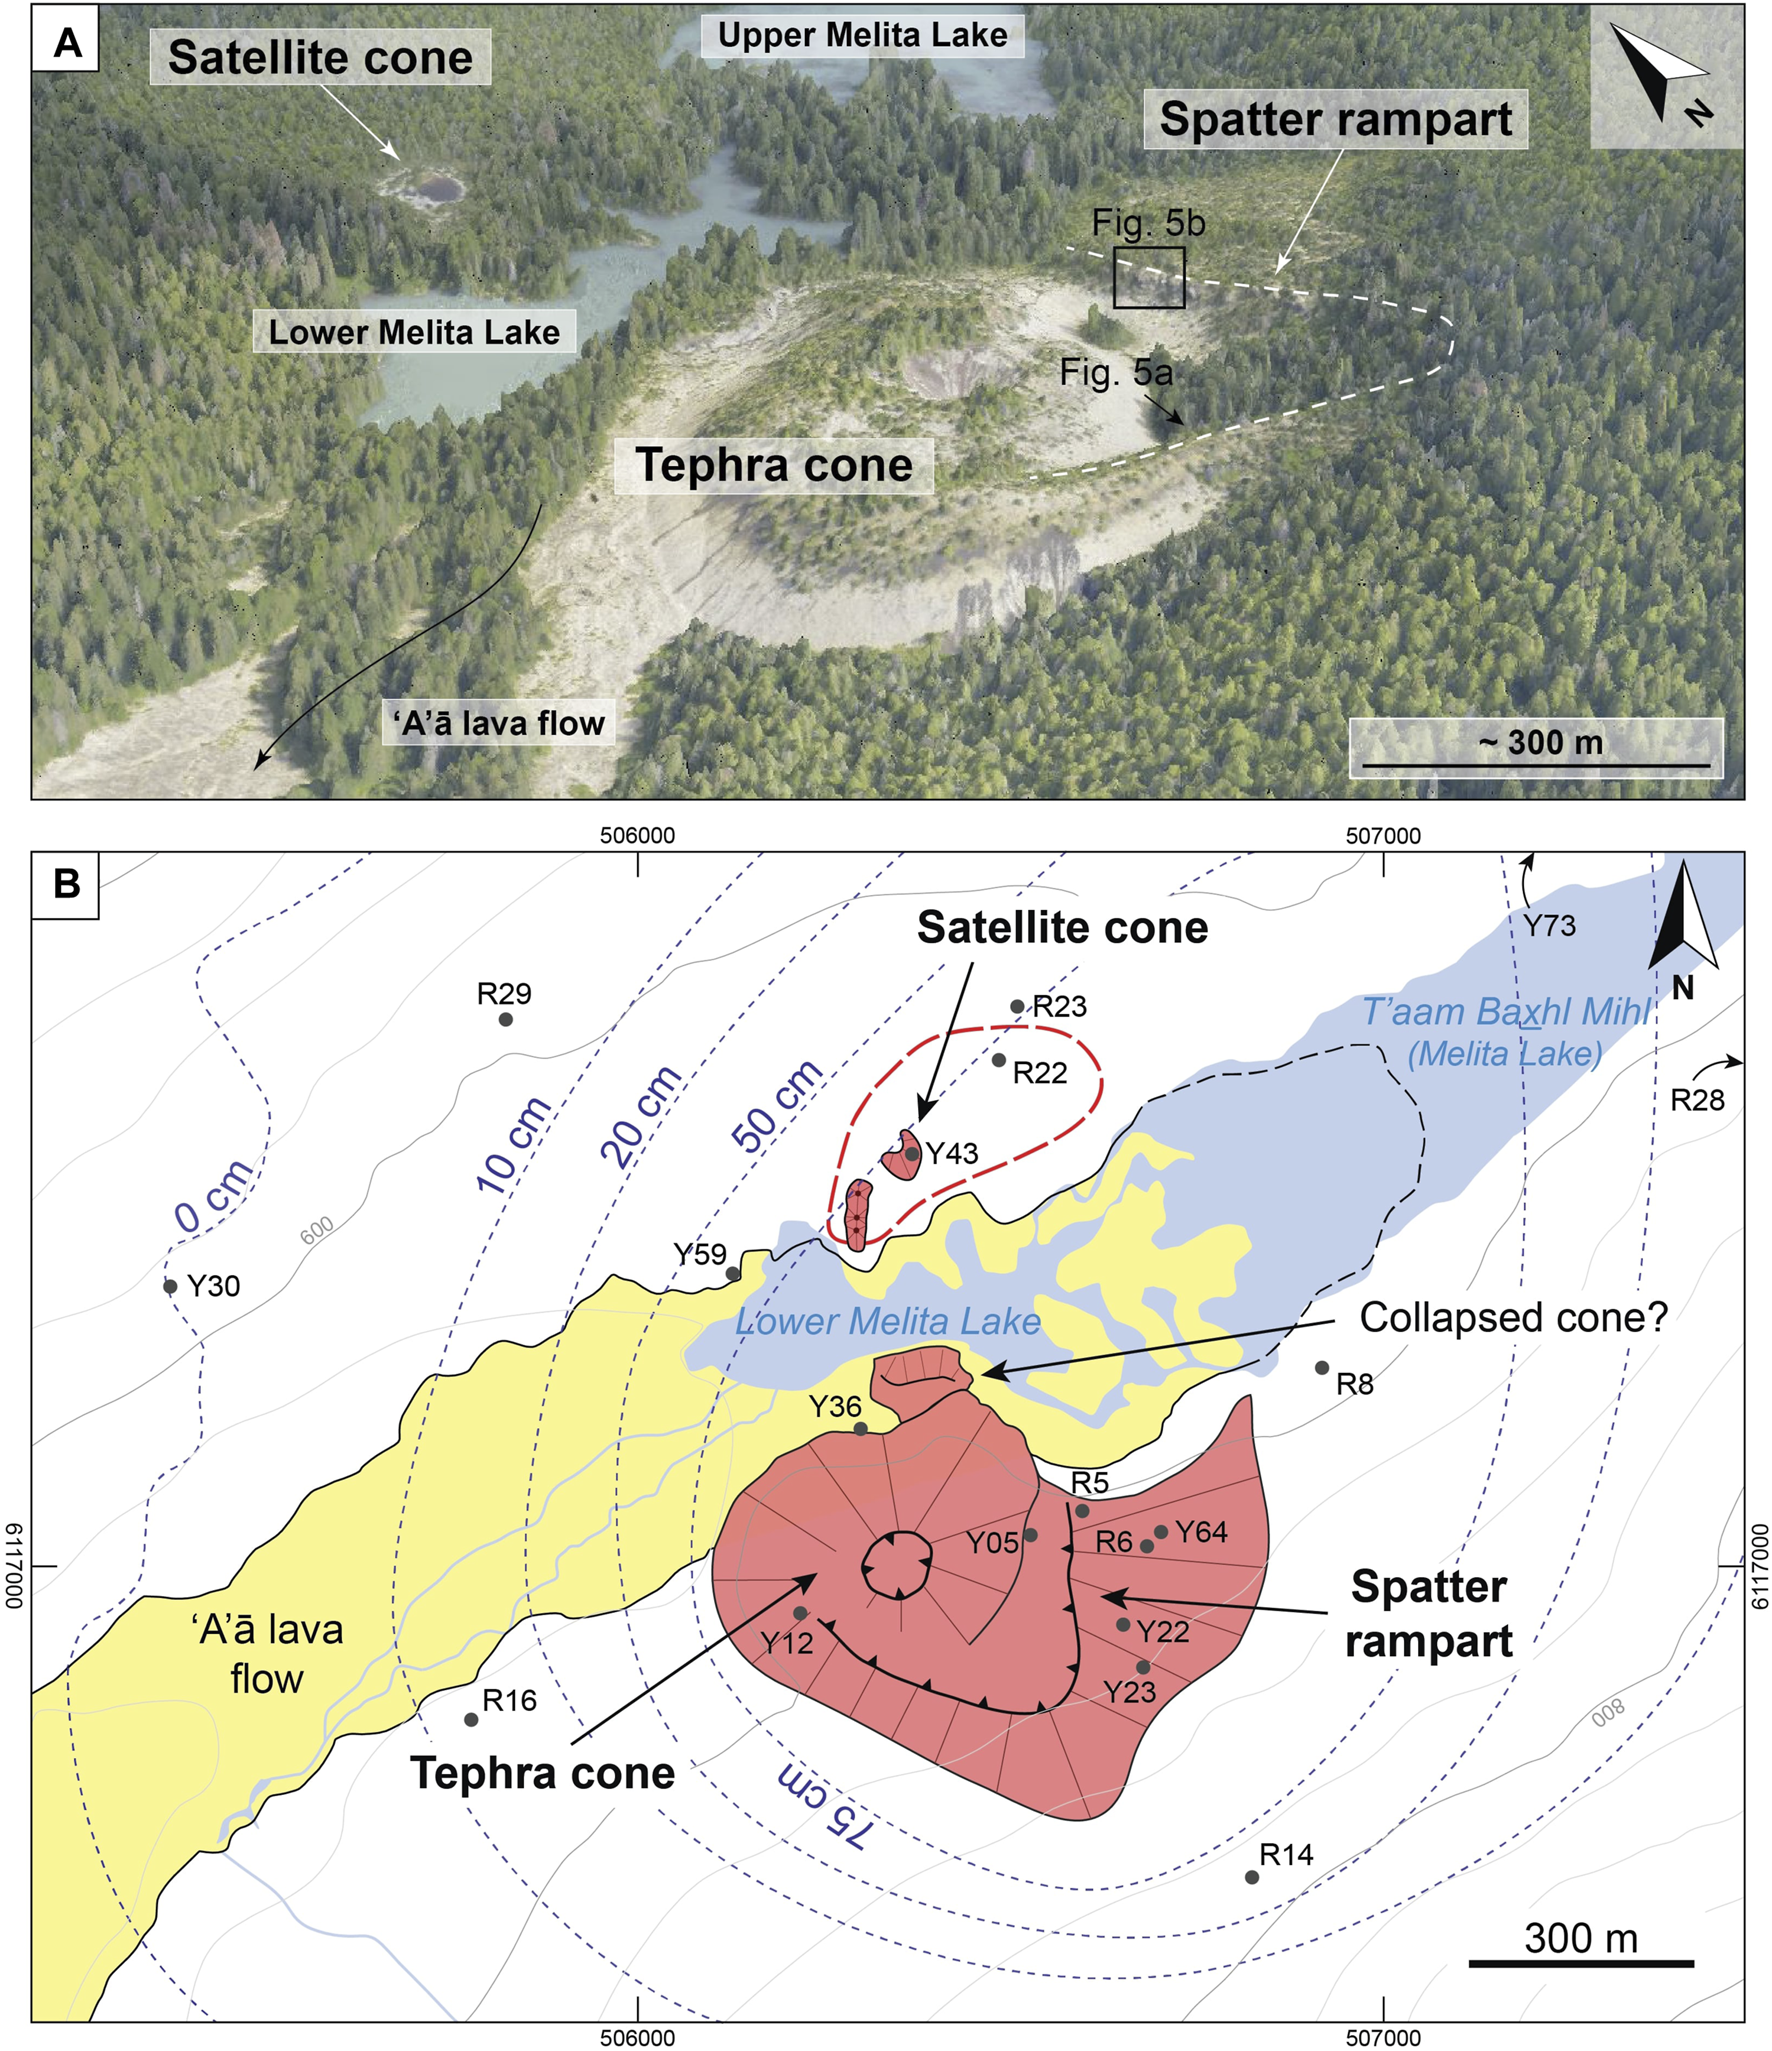
(A) Oblique 3D view of Tseax and surrounding area generated by digital photogrammetry. Modified after Le Moigne et al. (2020). (B) Volcanological map of Tseax. Dashed lines are isopach contours. Red dashed line is the extent of tephra deposit from the Satellite cone. Labelled black dots are location of tephra samples collected for grain size and componentry analyses. Samples Y73 and R28 are located further away.
FIGURE 5
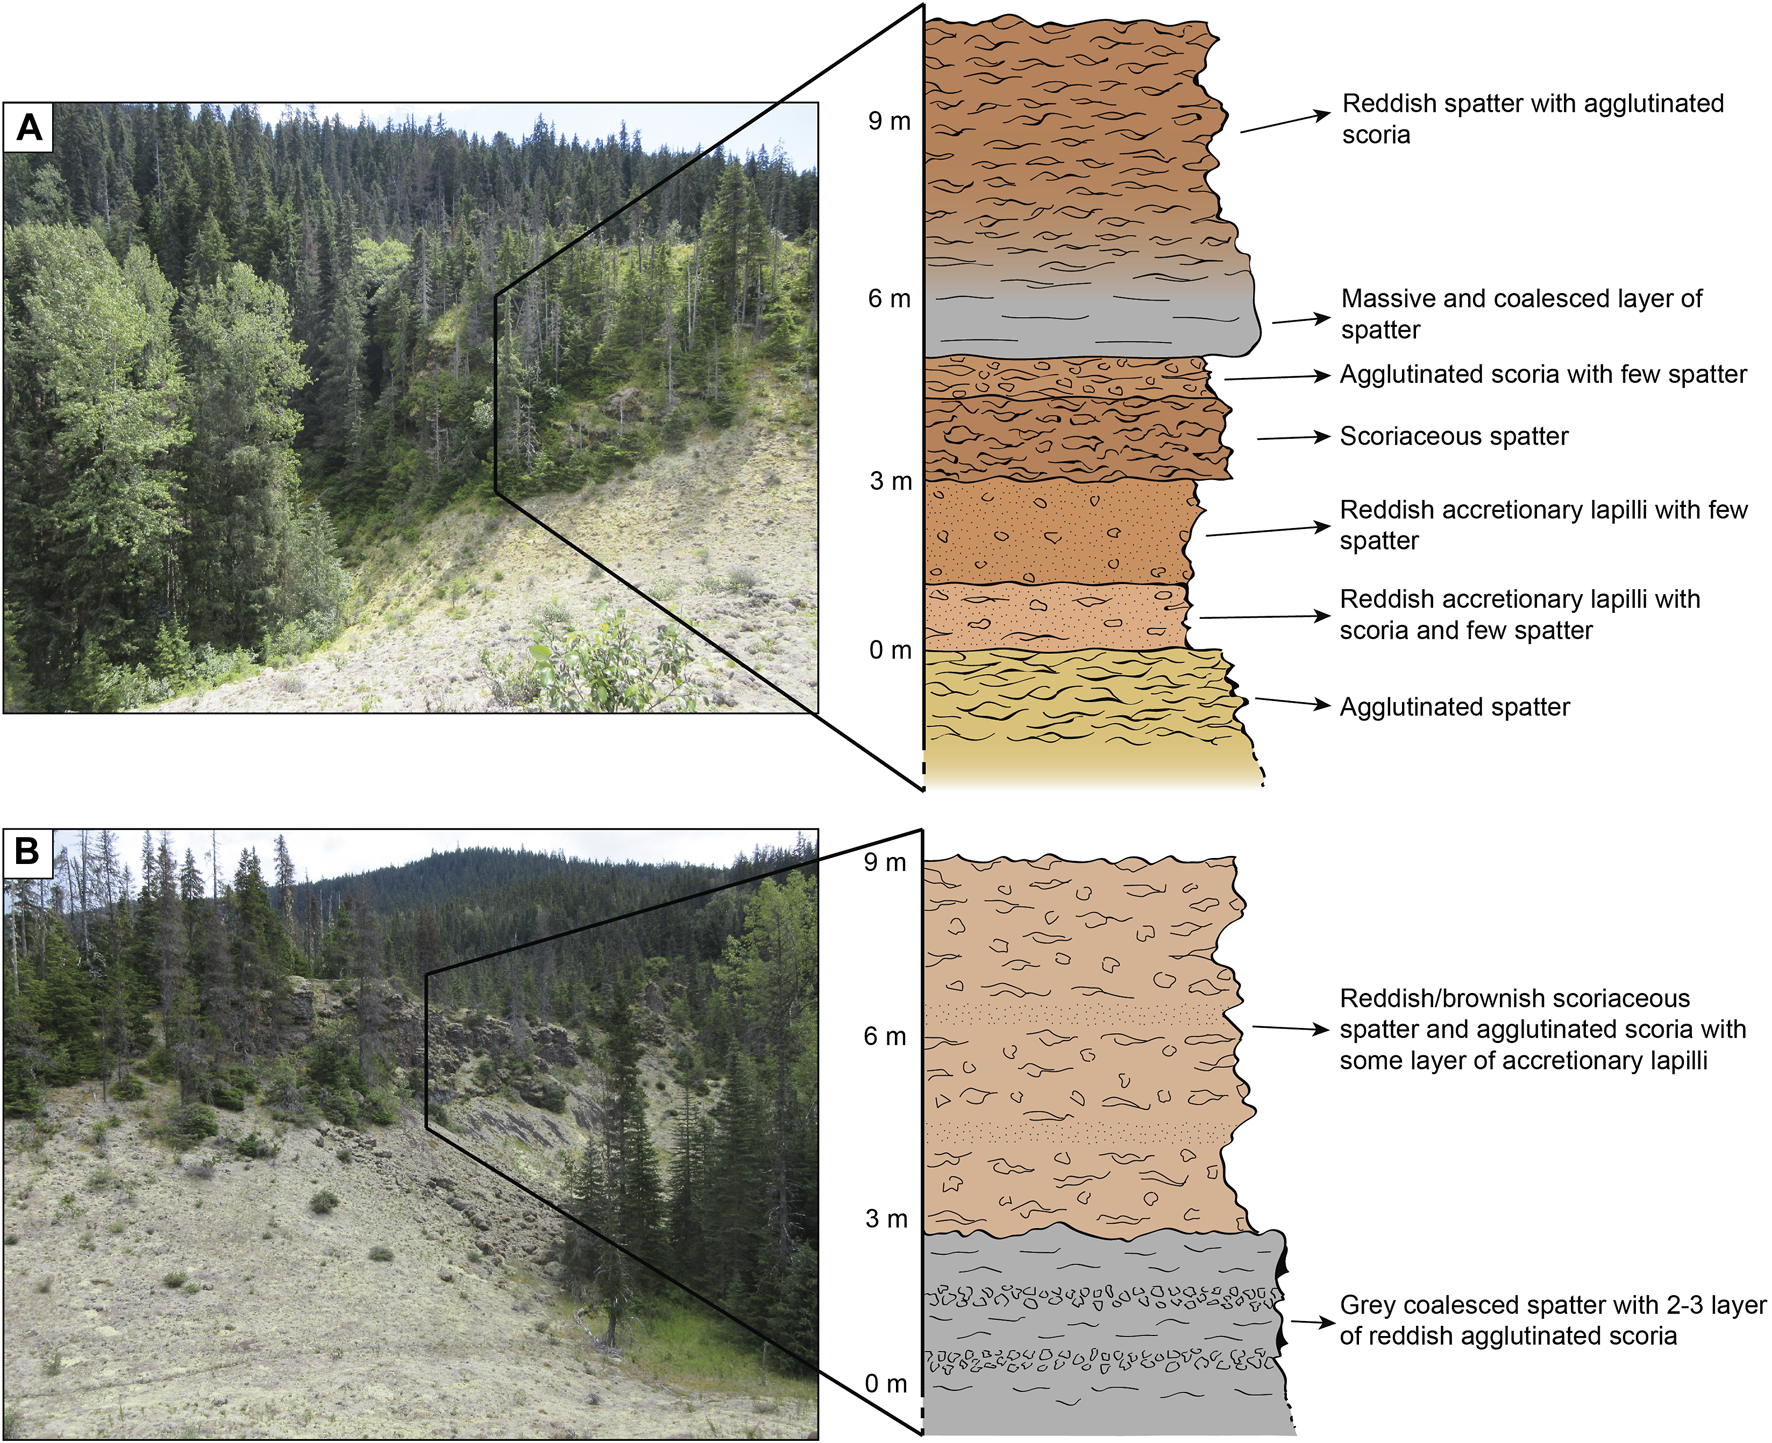
Detailed stratigraphy of the southern (A) and eastern (B) wall of the horseshoe-shaped spatter rampart.
The inner tephra cone is 65–75 m high and hosts a crater 80 m in diameter and 30–35 m deep (Figure 4) for an estimated volume of 2.8 ± 0.4 × 10⁶ m3 (Le Moigne et al., 2020). The area proximal to the volcano is covered by a tephra blanket; however, the maximum extent was difficult to map due to the extremely dense vegetation and a well-developed soil above the tephra. The tephra dispersal pattern is elongated to the northeast, with a maximum extent of 2,500 m from the vent, likely due to dominant SW-NE winds during the eruption. The maximum eastern extent of the deposit was estimated at 1,100 m from the vent assuming a constant thinning of the blanket from the inner cone. The deposits to the North and South were limited by topographic highs. Four smaller unnamed tephra cones are located North of Lower Melita Lake, including a 20 m high cone (here named Satellite cone; Figure 4). The estimated volume of ejected tephra is ∼6.5 × 10⁶ m3 and the total volume of pyroclastics is 10.5 ± 0.7 × 10⁶ m3 covering a surface area of ∼2.2 × 10⁷ m2 (Gallo, 2018; Le Moigne et al., 2020). The inner cone is most likely younger as the associated tephra deposits cover the spatter ramparts.
The tephra deposit represents a single depositional unit with no visible stratigraphy within the deposit. In many locations, however, extensive forest covers and a very well-developed soil made tephra deposit observations difficult. Grain size and componentry analyses were performed in 18 proximal and distal locations. These samples were located 140–1,420 m from the main vent (Figure 6). Accessory clasts are rare (∼0.5 vol%) and consist of mm-size fragments of mostly platy gray to brown siltstones and sandstones; a few mm-size fine grained metamorphic and plutonic clasts were also observed. Most of the samples are well sorted (e.g., Cas and Wright, 1987) and dominated by the 4–8 mm size fraction (35% in mass). The median tephra diameter is −2.59Φ and there is no significant variation between the proximal and distal tephra (Figure 6).
FIGURE 6
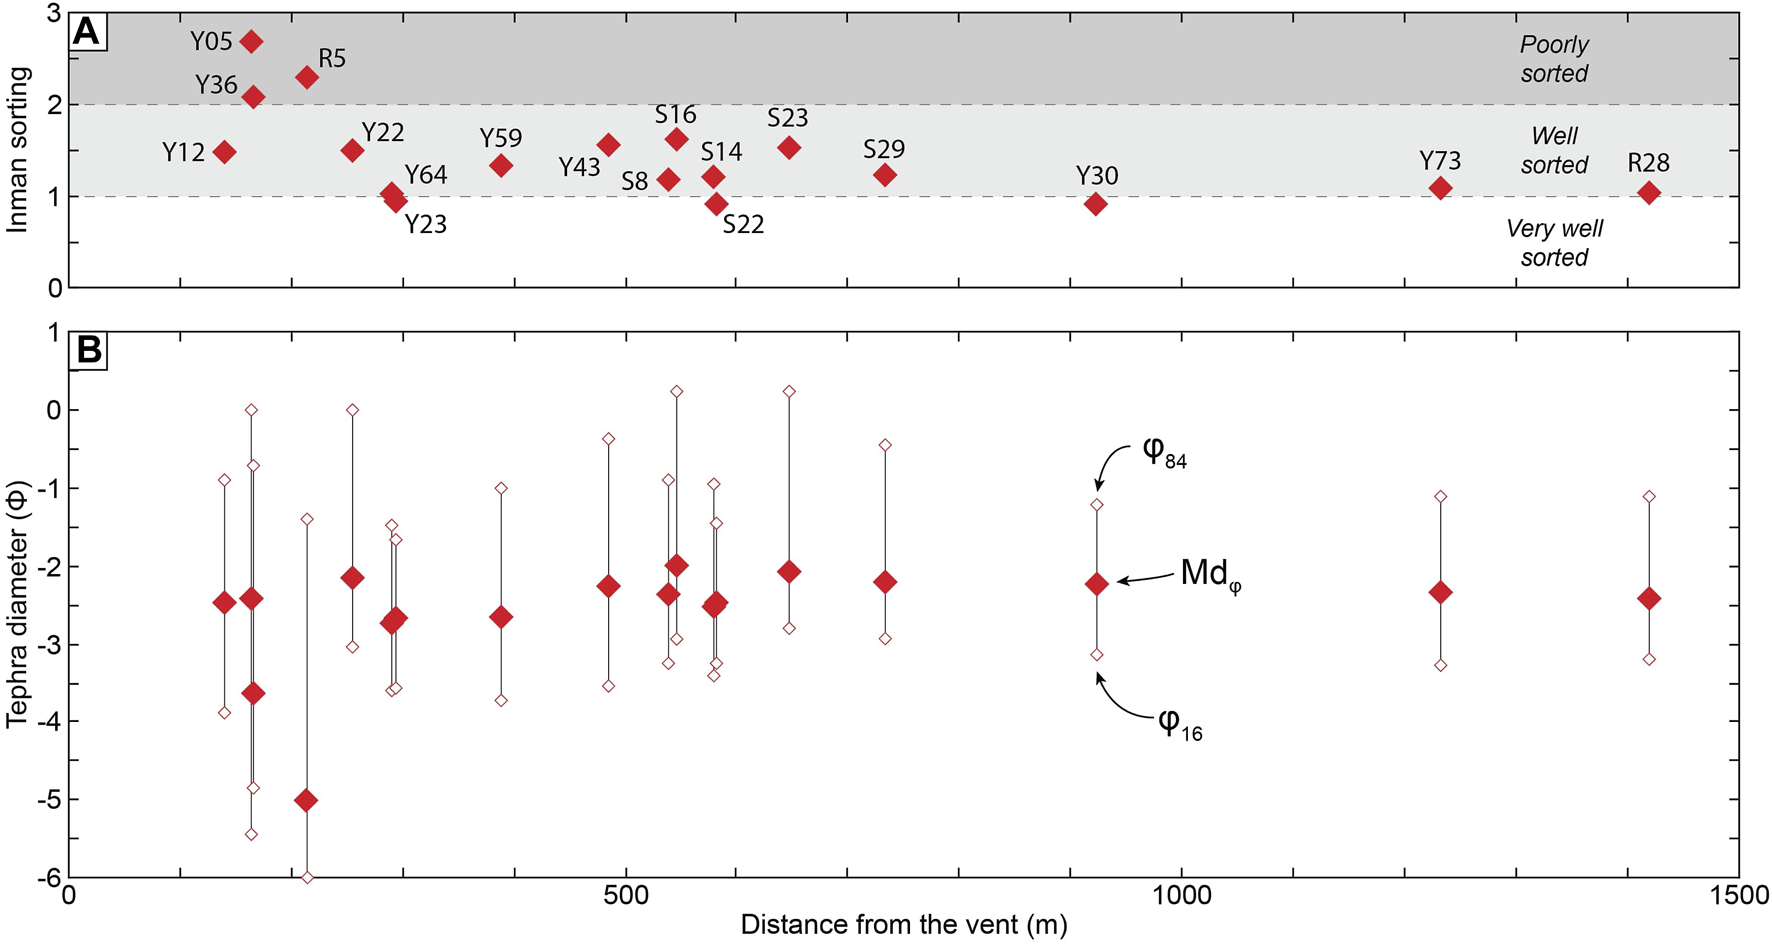
Grain size analyses on 18 Tseax tephra samples collected between 140 and 1,420 m from the main inner tephra cone. A Inman sorting parameter (A) and tephra diameter (Φ) (B) plotted against distance from the vent. Mdφ: median diameter; φ16 and φ84: 16th and 84th percentiles, respectively.
A newly discovered type of proximal basaltic pyroclast, termed inflated pyroclasts, was identified on the Satellite cone and at a few locations on the main spatter ramparts (Jones et al., 2022). These are mm-to cm-size hyper-vesiculated pyroclasts (74% vesicularity on average) and are found intercalated between scoria deposits. They are thought to be the result of low energy bubble bursts from low viscosity magma (Jones et al., 2022).
4.4 Petrology and Geochemistry
The Tseax volcanic products are all Fe- Ti-rich, Mg-poor basanite-to-trachybasalt (Le Moigne et al., 2022). All samples show very minor variations in major oxides and trace elements and the different flow units and tephra cannot be geochemically distinguished (Table 2). The products contain phenocrysts of plagioclase, olivine and titanomagnetite and the groundmass comprises plagioclase, olivine, titanomagnetite, clinopyroxene and minor apatite. The lowermost stratigraphic deposits (i.e., Flow 1 and Flow 2) have low phenocryst contents, 5–10% (Figures 7A,B), while the uppermost deposits (i.e., the two ‘a‘ā flows) have phenocryst contents up to 26% (Figure 7C; Higgins, 2009; Le Moigne et al., 2022).
TABLE 2
| Lava type | Flow 1 | Flow 2 | Flow 4 | Tephra |
|---|---|---|---|---|
| SiO2 | 46.85 | 46.30 | 46.70 | 46.54 |
| TiO2 | 3.67 | 3.36 | 3.43 | 3.68 |
| Al2O3 | 14.64 | 14.60 | 14.20 | 14.54 |
| FeOT | 14.74 | 14.40 | 14.45 | 14.70 |
| MnO | 0.22 | 0.22 | 0.22 | 0.22 |
| MgO | 4.64 | 4.31 | 4.21 | 4.65 |
| CaO | 7.51 | 7.37 | 7.49 | 7.44 |
| Na2O | 4.03 | 3.99 | 3.95 | 4.02 |
| K2O | 1.81 | 1.78 | 1.78 | 1.78 |
| P2O5 | 1.16 | 1.15 | 1.18 | 1.12 |
Major element analyses of some Tseax lavas. Data from Le Moigne et al. (2022).
FIGURE 7
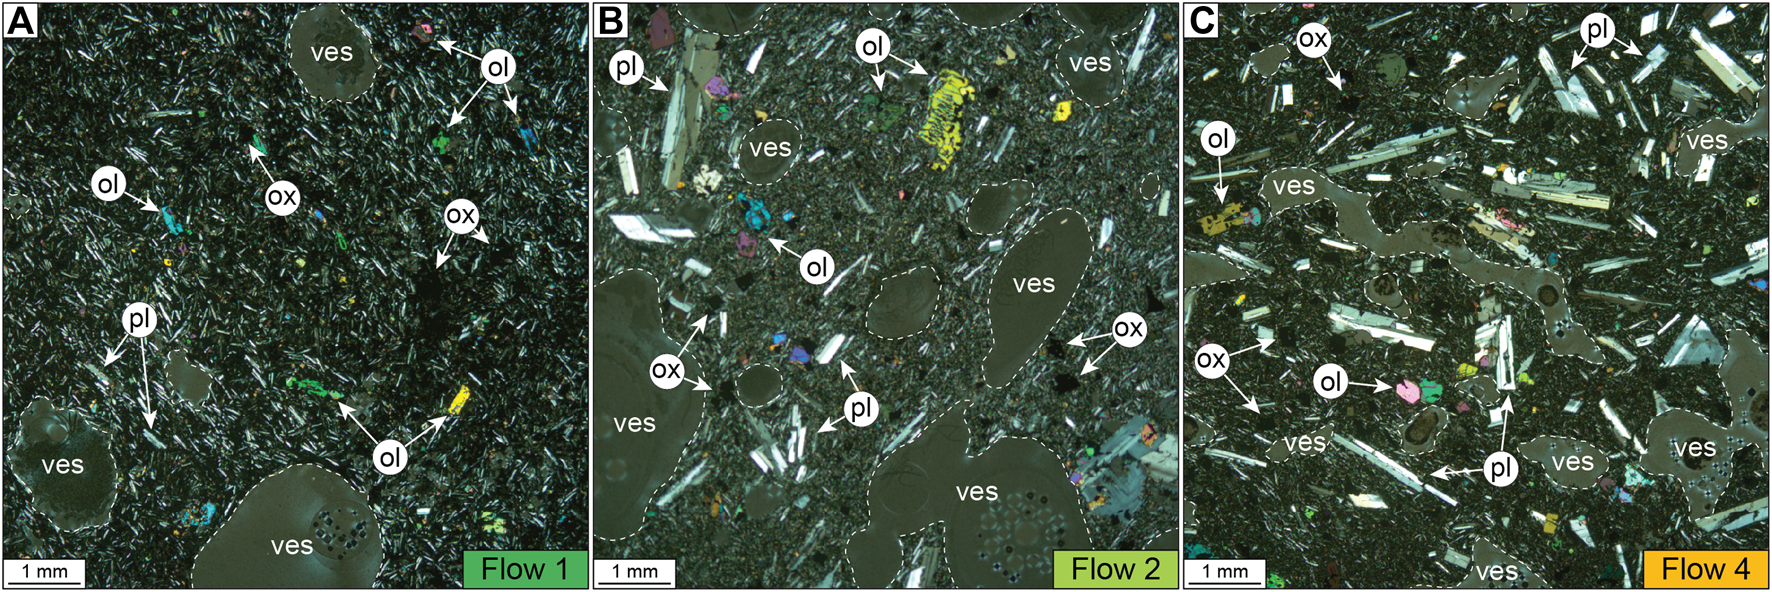
Representative cross-polarized photomicrographs of Tseax lavas. Note the increasing amount of phenocrysts from Flow 1 to Flow 4. Abbreviations: ol, olivine; ox, titanomagnetite; pl, plagioclase; ves, vesicle.
The similar petrological and geochemical compositions of the whole rock and mineral phases, including the nearly identical trace element signature of the lavas and tephras, suggest that all the lavas have undergone an identical evolution from their source to the surface. The Tseax magma is most likely derived from the melting of a fertile upper-asthenospheric mantle source. The magma then rapidly rose to the upper crust and erupted at estimated temperatures of 1,087–1,094°C. The iron-rich and alkali characteristics are synonymous with low magma viscosity (Chevrel et al., 2014). At the onset of crystallisation (1,245°C), the magma viscosity is measured at ∼17 Pa s (Jones et al., 2022) and estimated at 72–160 Pa s prior to eruption (Le Moigne et al., 2022).
5 Discussion
5.1 Eruptive Dynamics and Chronology of the Eruption
The chemical homogeneity of the erupted materials (lava flows and tephra; Table 2) points to a single magma batch that probably erupted in a relatively short amount of time (Le Moigne et al., 2022). The most recent paleomagnetic study (Williams-Jones et al., 2020) and the constraints from the Nisga’a Adaawak also suggest a short-lived eruption, most likely on the order of days to months.
The most straightforward model would consist of the effusion of the four identified lava flows (Figure 8) emplaced consecutively without any significant pause. The products of the eruption indicate two periods of activity, here called Period A and Period B with contrasting eruptive dynamics. The petrographic variations in the Tseax lava flows provide useful correlations with the activity of the pyroclastic edifices. Hence, in Period A, we group the early phenocryst-poor lavas, i.e., Flow 1, Flow 2 and the spatter rampart (Figure 8). Period A was predominantly effusive producing two voluminous (0.47 ± 0.08 km3) lava flows and characterised by low levels of spatter activity at the vent. Period B comprises the late phenocryst-rich ‘a‘ā lavas, i.e., Flow 3, Flow 4, the inner tephra cone and the associated fallout deposit (Figure 8). Due to higher lava viscosity, this episode was characterised by more violent explosions at the vent, ejection of 9.3 × 10⁶ m3 of tephra, formation of the main tephra cone and effusion of the two more crystal-rich ‘a‘ā lava flows. Less than 5% of the total lava volume was erupted during Period B.
FIGURE 8
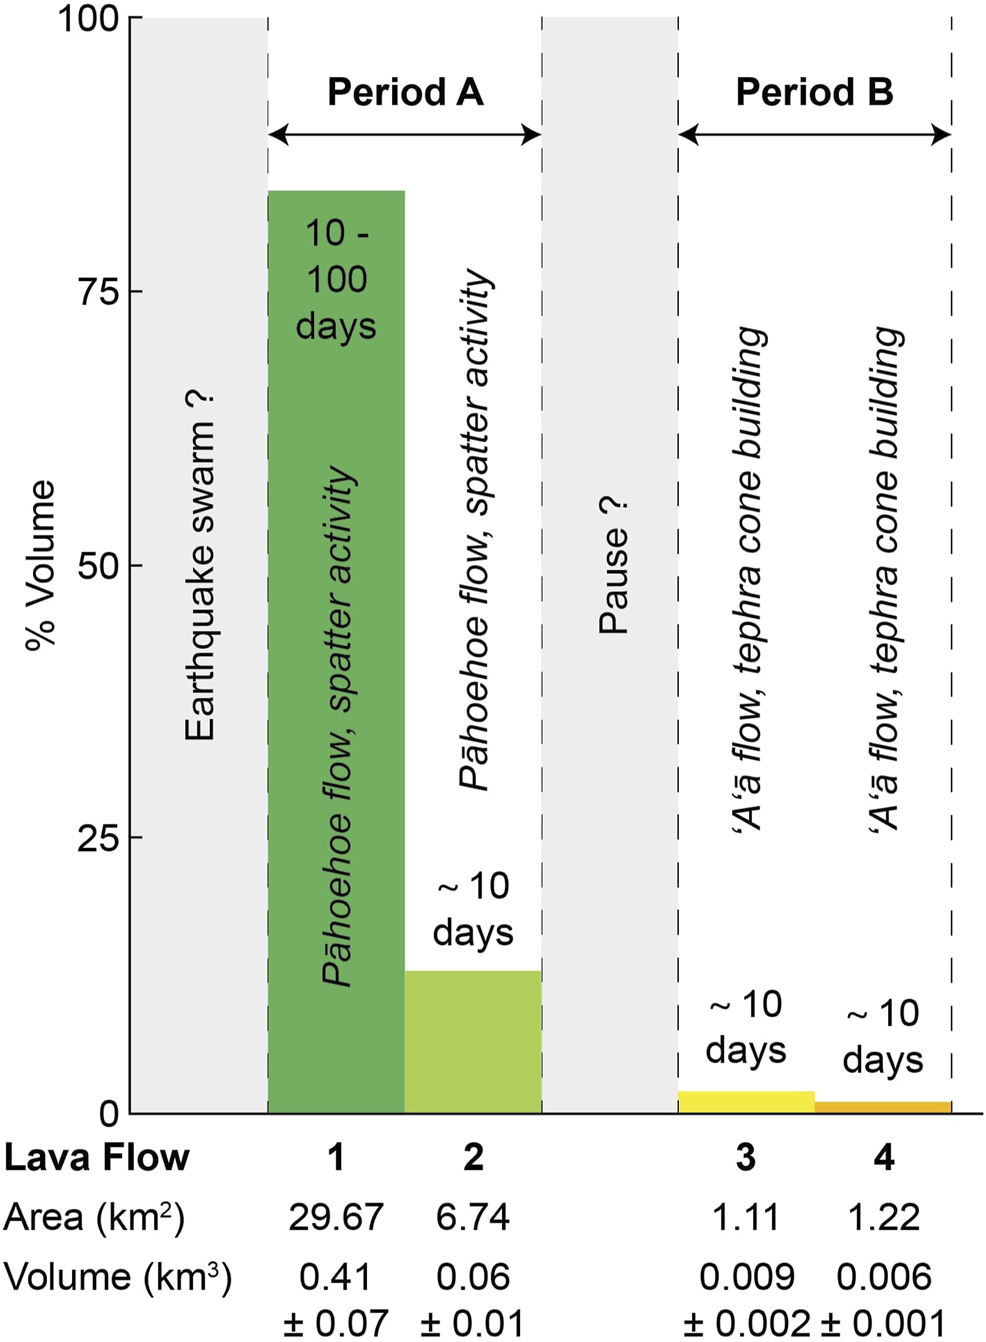
Sequence of eruptive episodes versus volume emitted. The eruption is divided in two periods and the emission of the four lava flows.
5.1.1 Period A
5.1.1.1 Vent Activity
The first reported signs of activity were earthquakes felt by the Nisga’a before the start of eruption (Barbeau, 1935), perhaps in a similar manner as to eruption of Paricutin, Mexico (Foshag and Gonzalez, 1956). These tremors would have been followed by the emission of a convective volcanic plume in the atmosphere that was visible from the Nass Valley. This buoyant plume must have been at least ∼1 km high in order to be visible from the village of Laxksiluux and ∼5.7 km from the village of Ts’oohlts’ap (Figure 9). The Nisgga’a Adaawak mention a convection cloud only in the earliest stage of the eruption.
FIGURE 9
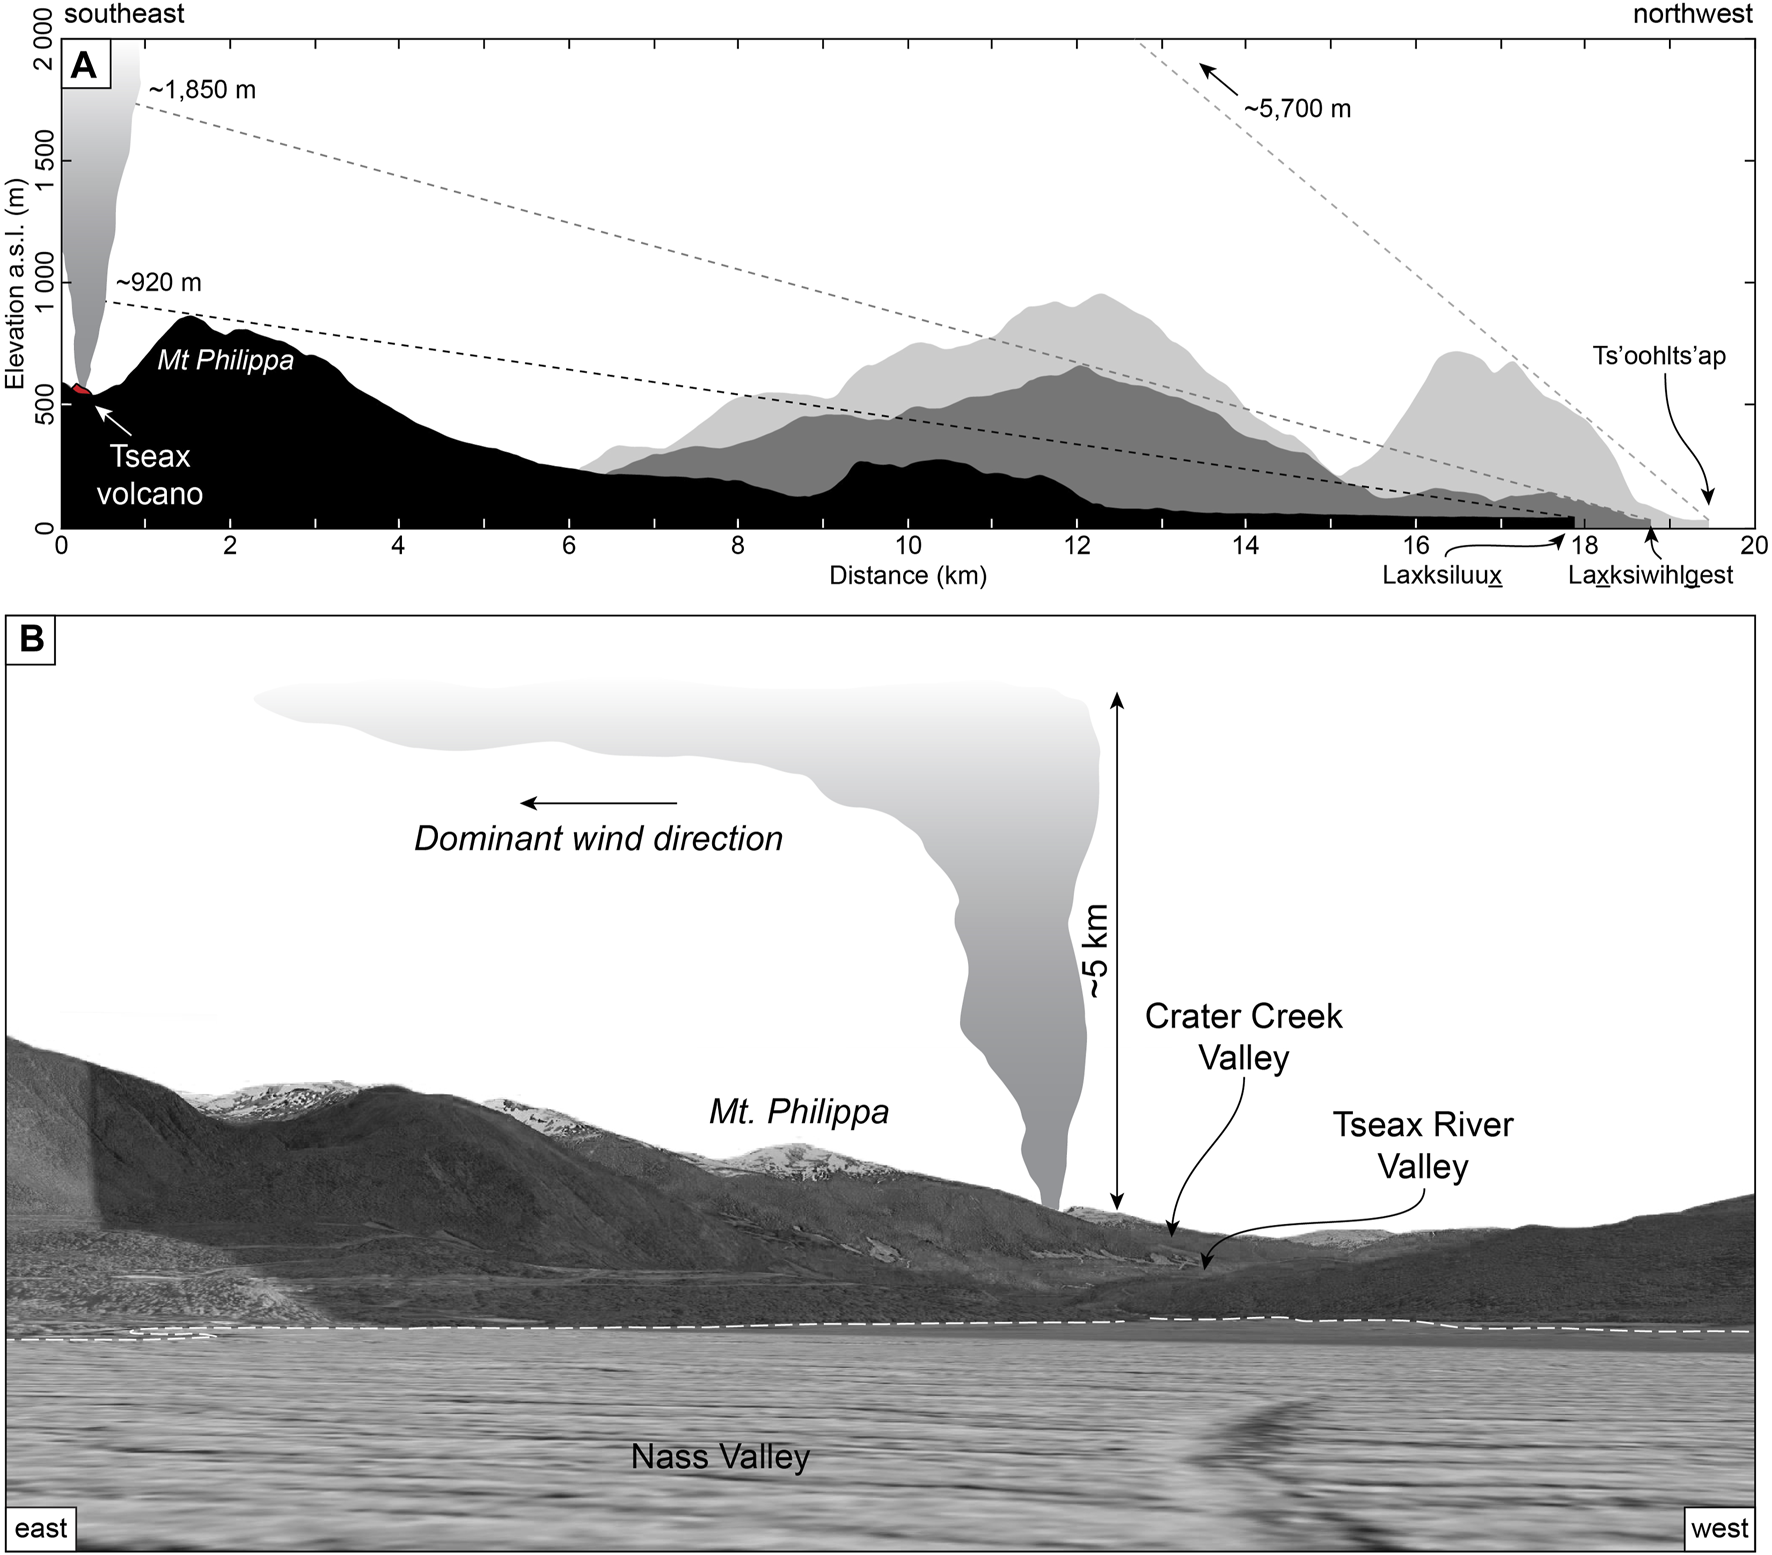
(A) Minimum height estimate of the convective plume using lines of sight of a person standing in the former Nisga’a villages towards the location of Tseax volcano. (B) An ∼5 km high buoyant plume seen from the former location of Laxksiluux.
We suggest that the eruption was structurally controlled by a fissure, although there is no direct field evidence aside from the rough North-South alignment of the eruptive vents (spatter rampart, tephra cone, satellite cone; Figure 4B). This orientation also agrees with the regional lineament that intersects with the location of Tseax (Figure 1C; BC Hydro 1981). The eruption would likely have begun with the opening of a 750–800 m-long fissure (Figure 10B) at the bottom of Crater Creek valley, which is approximately the distance between the two most distant pyroclastic edifices (i.e., the spatter rampart and the Satellite cone; Figure 4). At the vent, the first period of activity corresponded to the building of the spatter-rich rampart with abundant welding (Figures 4, 5) typical of a Hawaiian eruption style and products of lava fountaining (Head and Wilson, 1989; Sumner et al., 2005; Valentine and Gregg, 2008; Jones et al., 2018). Variation in the welding and size of the pyroclasts likely resulted from pulsing of the lava fountain (e.g., Valentine and Gregg, 2008).
FIGURE 10
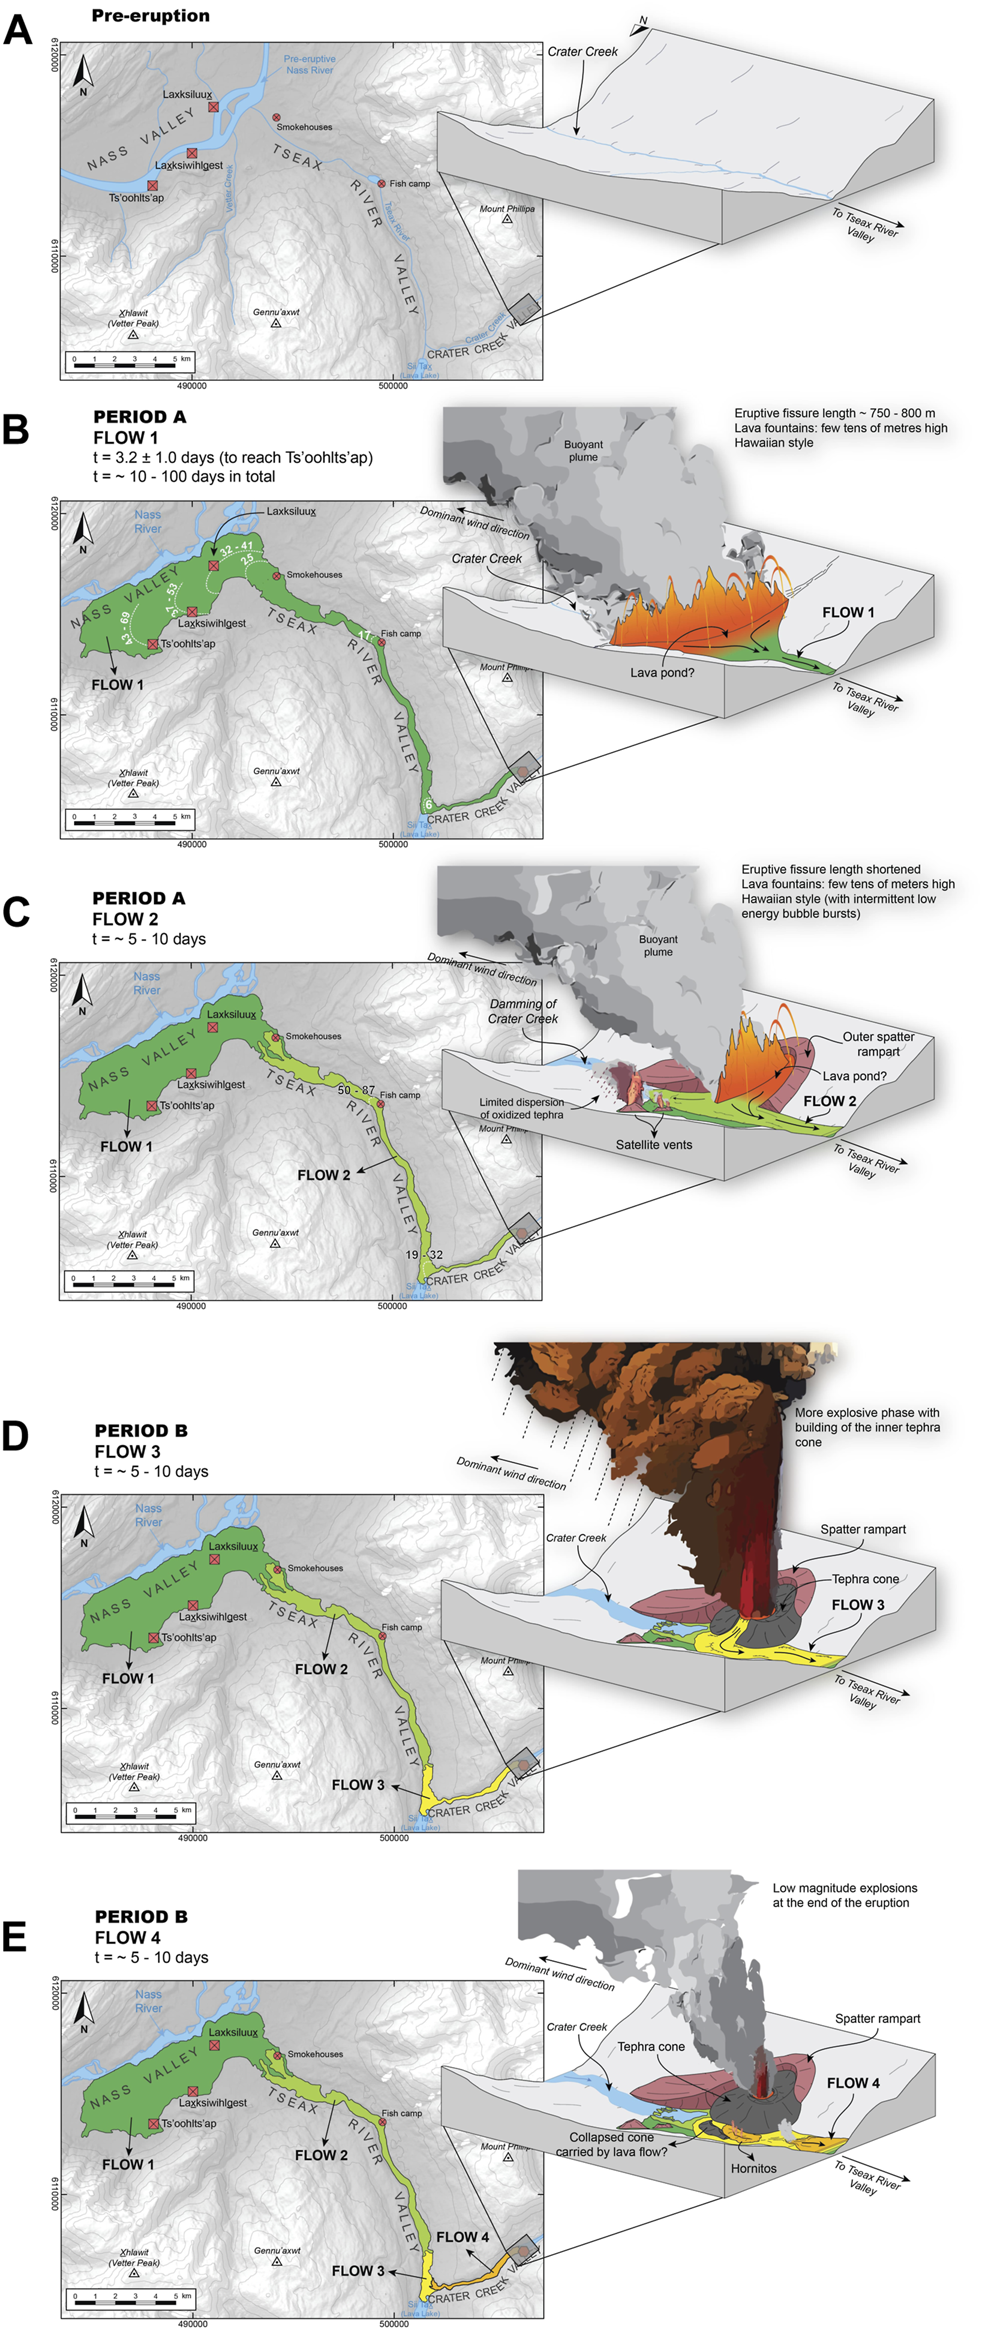
Main eruptive events of the ∼1,700 CE eruption of Tseax volcano. (A) Pre-eruption settings. (B) Period A, Flow 1: the eruption started with the opening of a 750–800 m long fissure, creating a lava curtain a few tens of meters high typical of Hawaiian eruption style. Early stages had high effusion rates and emission of a pāheohoe lava flow that reached the Nass Valley and the Nisga’a villages in 1–2 days. The flux progressively diminished and the lava inflated by endogenous growth for 10–100 days. White dashed lines are approximate arrival times in hours. (C) Period A, Flow 2: Accumulation of pyroclasts formed the horseshoe-shaped spatter rampart. Emission of Flow 2 in 5–10 days. (D) Period B, Flow 3: localisation to a single vent and formation of the inner tephra cones during a more explosive phase. Flow 3 was emplaced in 5–10 days. (E) Period B, Flow 4: last phases of the eruption corresponded to low magnitude explosions. Flow 4 was probably erupted from beneath the tephra cone and was emplaced in 5–10 days.
Due to the high eruption rates, the spatter rampart was probably continuously breached by the lava flows explaining its horseshoe-shape. The breached spatter rampart is asymmetric with pyroclasts extending up to ∼300 m East and >100 m to the West (Figure 4). This may suggest that winds were sufficiently strong to favour preferential accumulation of the pyroclasts to the East. Over time, the lava curtain shortened (e.g., Vergniolle and Mangan, 2000; Jones and Llewellin, 2021) as the eruption rates decreased, and localised short lived small vents might have been active (e.g., Satellite cone; Figures 4, 10C), ejecting 5 × 10⁴ m3 of oxidised tephra and forming a localised tephra blanket (Figure 10C).
5.1.1.2 Emplacement of Flow 1
The first period of the eruption was dominantly effusive. About 84% of the total lava volume was extruded to form Flow 1 (0.41 ± 0.07 km3). The magma discharge rate was probably high and sufficiently continuous to produce a single flow rather than a sequence of multiple overlapping lava flows.
Flow 1 cannot be simplified as a channelised lava flow. Indeed, ∼65% of its volume (0.32 ± 0.03 km3) forms a 26.3 km2 (12 × 2.5 km) inflated lava field in the Nass Valley (Figure 2B; Le Moigne et al., 2020). Lateral confinement in the V-shaped Crater Creek and Tseax River valleys most likely played a considerable role in the emplacement of the Tseax lava flows, potentially lengthening them by several kilometers. Lava flow surface morphologies are the result of their emplacement mechanism and are the expression of the complex interplay between the physical forces that favour surface deformation and the cooling mechanism that resists crustal deformation and can be used to constrain lava advance rates (e.g., Solana et al., 2004; Guilbaud et al., 2005). Based on this principle, Kilburn, 2004 predicts that the maximum advance rates of a lava in transition from pāhoehoe to ‘a‘ā flow is:where b is a constant related to the importance of shearing versus the tensile deformation occurring on the crust (0.0006 m/s for basalts; Kilburn, 2004; Solana et al., 2004) and α is the underlying slope in degrees. When v/vtr < 1, a pāhoehoe flow is sustained. Inversely, when v/vtr > 1, an ‘a‘ā crust will develop, i.e., continuous deformation of the upper crust.
For Flow 1, the transition regime would have been reached at an average velocity of 0.14 m/s in the Nass Valley (α ∼ 0.24). The absence of ‘a‘ā (Le Moigne et al., 2020) thus suggests that the flow never reached this point of continuous deformation (i.e., advance rate of <0.14 m/s). However, ∼50% of the surface morphologies in the Nass Valley are slabby or slabby-to-rubbly pāhoehoe (Figures 3E,F; Le Moigne et al., 2020) indicating that the flux in the flow core was locally high enough to partially disrupt the top crust. Rubbly surface morphologies are sometimes referred to as a transition state from pāhoehoe to ‘a‘ā and slabby pāhoehoe a transition state preceding rubbly pāhoehoe (Peterson and Tilling, 1980; Keszthelyi and Thordarson, 2000; Keszthelyi et al., 2001; Pedersen et al., 2017). Therefore, slabby and slabby-to-rubbly pāhoehoe surface morphologies occur when v/vtr approaches unity (e.g., Kilburn, 2004; Solana et al., 2004). Assuming these constraints, we can expect an average advance rate of ∼0.08–0.12 m/s to form the slabby and slabby-to-rubbly surface morphologies present in the Nass Valley. The corresponding average effusion rate is then simply obtained by multiplying the flow velocity by flow width. The slabby-to-rubbly flow surfaces are located at the mouth of Tseax River valley where the flow width is 1,200–1,500 m and the flow thickness is 12 ± 2 m (Le Moigne et al., 2020). This gives discharge rates of 1,700 ± 750 m3/s. However, it is evident that the flow was not entirely inflated when it reached the mouth of Tseax River valley. Considering a 50 vol% reduction from the final fully inflated volume, more reasonable peak effusion rates would be ∼800–1,000 m3/s at the beginning of the eruption. Similar high effusion rates were measured during two consecutive days at the beginning of the 1991 eruption of Hekla (Gudmundsson et al., 1992) and during the first day of the 1984 eruption of Mauna Loa (Lipman and Banks, 1987). At Tseax, sustained effusion at 800–1,000 m3/s for 2 days implies eruption of 0.15 ± 0.02 km3 of lava (∼37% of the total volume of Flow 1).
An important question to address is how much the effusion rate decreased as the eruption proceeded. This cannot be accurately answered because these details of the eruption are not reported in the Nisga’a Adaawak or without conducting a detailed analysis of the surface flow morphologies. Estimating the timing of catastrophic natural events through oral histories is challenging because their durations are often underestimated (Masse et al., 2007; Cashman and Cronin, 2008). For example, if the eruption lasted only a few days, average effusion rates would have been >103 m3/s which seems unlikely unless we involve a flood-like scenario similar to the 1783–84 eruption of Laki (Iceland; Thordarson and Self, 1993). Conversely, the emplacement of Flow 1 over more than a year seems very unlikely given the chemical homogeneity and low crystallinity of the products (Le Moigne et al., 2022).
Below, we examine three possible scenarios based on historical basaltic eruptions: 1) the 27th June 2014–2015 Pāhoa flow (Hawaii;
Poland et al., 2016); 2) the 1991 eruption of Hekla (Iceland;
Gudmundsson et al., 1992); and 3) the 1984 eruption of Mauna Loa (Hawaii;
Lipman and Banks, 1987). These three scenarios imply very different timescales of emplacement, from several weeks to several years:
1) In 27th June 2014–2015, the Pāhoa (Hawaii) inflated flow was emplaced in 270 days at an average rate of 1–2 m3/s (Poland et al., 2016). Such low effusion rates are typical of other inflated pāhoehoe flows (e.g., Hon et al., 1994). Approximately 11 km2 (∼40%) of the surface flows in the Nass Valley have typical morphologies of inflated pāhoehoe (e.g., hummocky pāhoehoe, lava rises, etc.; Figures 3B–D; Le Moigne et al., 2020). At Tseax, if the effusion rates dropped to 1–2 m3/s, Flow 1 could have been emplaced in 4–8 years. This scenario is rejected because it contradicts the chemical homogeneity of the product and does not agree with the Nis
g
a’a Adaawak
.2) The 1991 eruption of Hekla (Iceland) started with 2 days of activity at ∼800 m3/s. Effusion rates then rapidly decreased to ∼10 m3/s until the end of the eruption (Gudmundsson et al., 1992). In this scenario for Tseax, Flow 1 would have continued to form over a period of ∼300 days following the peak effusion rate.
3) During the eruption of Mauna Loa (Hawaii) in 1984, effusion rates evolved from 800 to 300 m3/s during the first few days. Then, the lava flux remained at ∼110 m3/s for 10 days before progressively decreasing to 10–20 m3/s until the end of the eruption (Lipman and Banks, 1987). Such a scenario for Flow 1 would imply extrusion of 0.24 ± 0.02 km3 of lava during the first 12 days of the eruption. The remaining 0.17 ± 0.05 km3, if extruded at 10–20 m3/s, would have been emplaced in 70–250 days. In total, Flow 1 would be fully emplaced in ∼12–37 weeks.
Evolution of lava discharge rates in a scenario similar to that of the 1991 Hekla eruption (scenario 2) predicts an emplacement duration of ∼8 months. High effusion rates (800–1,000 m3/s) at the beginning would represent the extrusion of 0.15 ± 0.02 km3 in a short period of time. The remaining Hekla lavas were emplaced by slower endogenous growth of the lava plain over several months and an equivalent scenario can be reasonably envisaged for Tseax even with slightly higher fluxes. For instance, if the lava flux was sustained at 20 m3/s, the emplacement duration of Flow 1 would be ∼4 months. Emplacement of Flow 1 with a similar evolution of the effusion rate to that of the eruption of Mauna Loa in 1984 (scenario 3) involves a duration <250 days with almost half of the volume emplaced during the first 2 weeks of eruption. Scenarios 2 and 3 imply emplacement of large volumes of lava in a few days to a couple of weeks that may have been responsible for the destruction of the Nisga’a villages, and therefore, recorded in the oral histories.
In summary, our observations support high effusion rates (800–1,000 m3/s) at the beginning of the emplacement of Flow 1 that progressively decreased to 10–200 m3/s until the end of this pulse. We estimate a total emplacement duration of a few weeks to a few hundred days, with almost half of the lava volume extruded during the first days of the eruption.
5.1.1.3 Approximate Arrival Times of the Lava Flow at Key Locations
From the vent area, the lava was forced to flow down the narrow V-shaped Crater Creek valley, reached the Tseax River valley (∼5 km to the West) and then flowed North ∼15 km to the Nass Valley (Figure 2B). In these two narrow valleys, the lava was probably flowing faster than in the Nass Valley flats due to the lateral confinement and steeper slopes. Flow 1 fills a volume of 0.14 ± 0.02 km3 (∼35% of the Flow 1 volume) in Crater Creek and Tseax River valleys. Again, considering peak effusion rates of ∼800–1,000 m3/s at the beginning of the eruption, ∼50 vol% of the final fully inflated flow in Crater Creek and Tseax River valleys would have been emplaced in ∼17–28 h. This implies average lava advance rates of 0.2–0.4 m/s (∼720–1,440 m/h) along Crater Creek and Tseax River valleys.
Based on the above constraints, Flow 1 would have reached Lava Lake in <10 h (Figure 10B). It then flowed down Tseax River valley to the north until it encountered the Nass River near Lax Wiilaxk’ap (Figure 10B) after approximately 25 h, destroying the fish camps located on the shore of Tam Gimwits’ax (a small lake on the pre-eruptive Tseax River) and the smokehouses near the mouth of Tseax River valley (Figure 10B).
The lava diverted the Nass River from the South to the North side of the Nass Valley to its current position (Figures 10A,B). The lava initially flowed in the Nass River flood plain and then progressively extended to the north (D. Nyce, pers. comm., 2019). With maximum advance rates of 0.08–0.12 m/s in the Nass Valley, the lava would have reached the Nisga’a village of Laxksiluux in ∼32–41 h after the beginning of the eruption (see the approximate locations of the former Nisga’a villages on Figures 2A, 10A). Located about 5 km from the mouth of Tseax River valley, the lava may have engulfed the village of Laxksiwihlgest after ∼37–53 h and finally arrived in the village of Ts’oohlts’ap ∼43–69 h after the start of the eruption.
5.1.1.4 The Nisga’a Fatalities
Given the observations recorded in the Nisga’a Adaawak and the mapped flow morphologies, the emplacement of Flow 1 was most likely responsible for the fatalities as it flooded the three former Nisga’a villages (Figure 10B). Lava flows are generally not a threat to livelihoods or to population, nevertheless, under certain circumstances (i.e., high discharge rates and flow front velocities), they can be dangerous to individuals living in their path. For instance, the eruptions of Nyiragongo (D.R.C.) in 1977, 2002, and 2021 produced low viscosity lava flows which reached the densely populated city of Goma at extremely high velocities, on the order of 10–100 km/h, and tens of inhabitants were directly killed by the lava flows or due to incidents caused by their rapid emplacement (Tazieff, 1977; Komorowski et al., 2003; Favalli et al., 2009; Global Volcanism Program, 2021). Although at Tseax, the flow advance rates may have been locally and/or punctually faster, perhaps on the order of several m/s (“swift currents” as reported by Barbeau, 1935), the average lava flow front advance rate in the Nass Valley was too low to be the unique cause of the fatalities. Indeed, even with lava velocities of a few hundred metres per hour, people would have had the time to evacuate their villages and escape up the slopes of the nearby mountains.
The former villages of Laxksiwihlgest and Ts’oohlts’ap were located on the southern shores of the Nass River (Figure 2A). While some villagers may have “…canoed to the far side of the river…” (Nisga’a Tribal Council, 2004), it is reported that during the eruption some people were caught between the advancing lava flow and the Nass River (D. Nyce, pers. comm., 2019), which is the third largest river in British Columbia in terms of annual discharge rates (Roden, 1967). Ninety years of real time hydrometric data for the Nass River (from 1929 to 2020) are available from the Water Office of the Government of Canada (hydrometric station 08DB001 located north of Gitlaxt’aamiks; https://wateroffice.ec.gc.ca/report/historical_e.html?stn=08DB001). According to the Nisga’a Adaawak, the eruption is suspected to have occurred between June and September (Nisga’a Tribal Council, 2004; Williams-Jones et al., 2020). During the summer, monthly average discharge rates are 2,070, 1,650, and 887 m3/s in June, August and September, respectively (assuming similar discharge rates between present day and during eruption in the 18th century). A person trying to escape the advancing lava flow would have had to swim a few hundred meters to reach the opposite shore of the Nass River. Panic, struggling against the current or helical flows near the river banks would have been strong enough to drown anyone attempting to escape by swimming (e.g., Connolly, 2014; Peden et al., 2016).
When the lava arrived in the Nass Valley, it came in contact with the Nass River and may have produced dense clouds of vaporised water mixed with volcanic gases such as CO2 and H2S; sometimes referred to as “laze” and “vog”, this can be deadly to individuals in close vicinity (e.g., Williams-Jones and Rymer, 2015; Carlos et al., 2018). McCullagh (1918) described that explosions occurred when the lava covered the Nass River beds and that the valley was enveloped by clouds of steam. There is, however, no evidence of such explosions on the lava field (e.g., rootless cones, hornitos formed by bubble bursts, rings of spatter; Mattox and Mangan, 1997; Hamilton et al., 2010; Boreham et al., 2018). Moreover, McCullagh, 1918) turned the eruption narrative into a poem and thus his texts can be subject to different interpretations. Nevertheless, parts of the Nisga’a Adaawak refer to people suffocating and dying from a “poisonous smoke” (Barbeau, 1935) when the lava flow entered the Nass Valley because people were “frightened” and took refuge in small caves in the villages (Barbeau, 1935). Since CO2 is denser than air, some fatalities may have been due to accumulation of CO2 in the low-lying areas and in the caves. Short term exposure to CO2 leads to rapid unconsciousness and is lethal at concentrations >11% in the air. Present in volcanic laze, H2S (and HF or H2SO4 formed through interaction with the ambient atmosphere) is also hazardous and lethal at concentrations >0.1% (e.g., Williams-Jones and Rymer, 2015). Furthermore, when the lava flowed over the Nass River floodplain, CO2 and CH4 (both asphyxiating gases) may have been released as wetlands and marshlands are good reservoirs for these gases.
5.1.1.5 Emplacement of Flow 2
Nearly 13% of the total lava volume corresponded to the effusion of Flow 2 (0.06 ± 0.01 km3). The Tseax lava flow field has an original geometry which is strongly controlled by the environmental conditions, notably the topography (Figure 2; e.g., Miyamoto and Papp, 2004; Rumpf et al., 2018; Richardson and Karlstrom, 2019). In particular, Flows 2, 3 and 4 are confined in V-shaped valleys along their entire length, limiting lateral spreading (Figure 2). Pinkerton and Wilson, 1994 developed an empirical relationship between lava flow length (L) and volume (V) of channelised lava flows that can be applied with 75% confidence:
Within error, Flows 2, 3 and 4 fit the model of Pinkerton and Wilson, 1994 for channelised flows over their entire length (Figure 11). Therefore, these flows can be approximated as channelised lava flows and the volumetric effusion rate can then be calculated by (Pinkerton and Wilson, 1994):where, κ is the thermal diffusivity (3.82 × 10⁻⁷ m2/s; Kilburn and Lopes, 1994), GZ is the Gratz number, W and H are the average flow width and thickness, respectively. This model assumes that the lava advance is controlled by the viscous core of the flow and that heat transfer by conduction is the dominant cooling mechanism (symbolised by the Gratz number; Knudson and Katz, 1958; Hulme and Fielder, 1977; Pinkerton and Sparks, 1978). Observations of Hawaiian and Etnean basaltic lava flows have shown that the flow usually stops when GZ∼300. Considering the values reported in Table 1 and GZ of 300, we obtain effusion rates of 124 ± 25 m3/s for Flow 2. Accordingly, the estimated emplacement duration of Flow 2 is 4.4 ± 1.2 days.
FIGURE 11
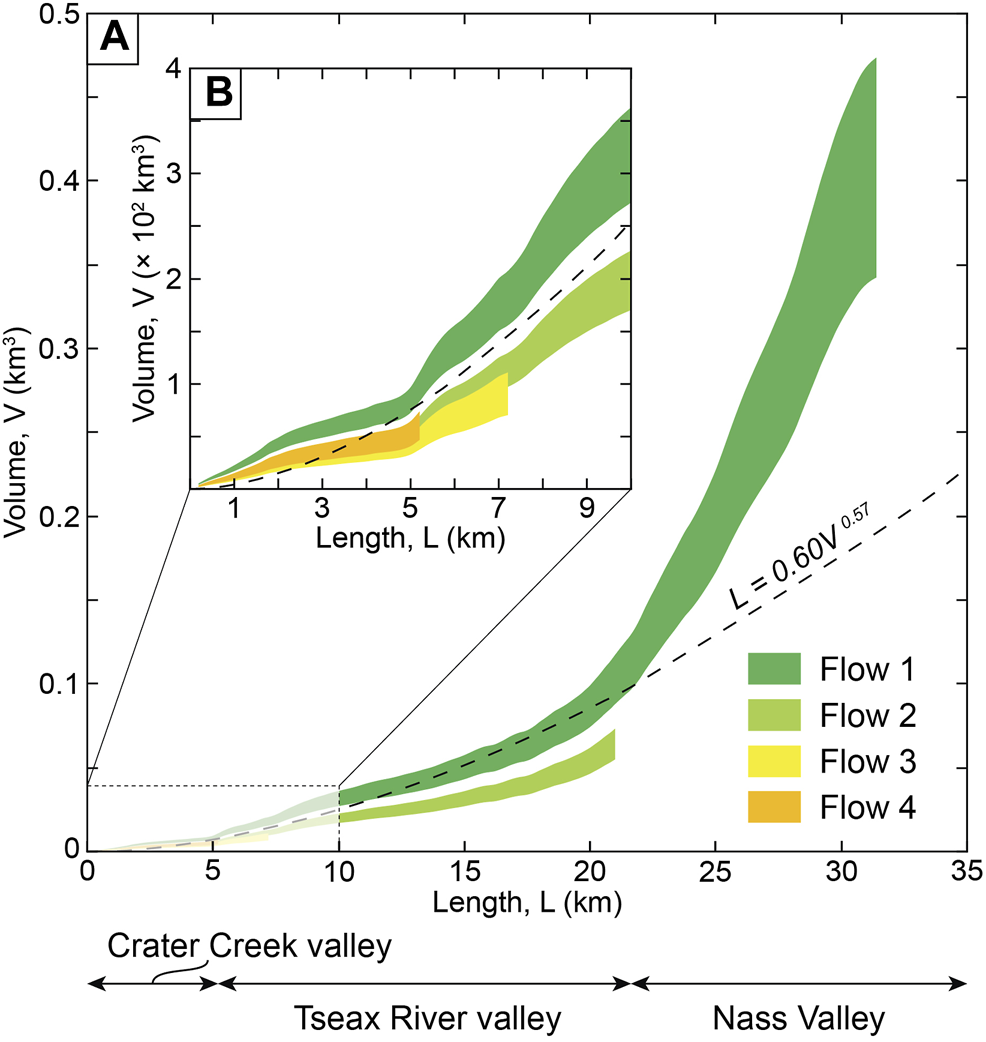
Length-volume relationship of the four Tseax lava flows. (A) Length-volume relationship along the entire flow field. Dashed line is the Pinkerton and Wilson (1994) model. (B) Zoom on the first 10 km of the Tseax lava flow field. Note that the four flows closely follow the model along the narrow V-shaped Crater Creek and Tseax River valleys. In the Nass Valley, Flow 1 departs from the model due to widening of the lava.
A similar argument as for Flow 1 concerning the average effusion rate and emplacement duration could be made here. However, the Nisga’a Adaawak do not constrain the mechanism and emplacement duration of Flow 2. Therefore, the effusion rates given here might be overestimated and the emplacement durations are considered a minimum. However, Flow 2 is essentially a slabby pāhoehoe lava flow (Le Moigne et al., 2020) suggesting relatively high effusion rates for pāhoehoe flows. We propose that the total emplacement duration of Flow 2 would have been 5–10 days.
5.1.2 Period B
5.1.2.1 Emplacement of Flow 3 and 4
The products belonging to Period B of the eruption are phenocryst-rich compared to the earliest lavas (Figure 7; Le Moigne et al., 2022). Only 3% of the total lava volume was erupted during this phase and in two separate lava flows: Flow 3 (0.009 ± 0.002 km3) and Flow 4 (0.006 ± 0.001 km3), both “a” ā flows (Figure 2B). Using the geometrical values reported in Table 1, the average effusion rates would have been 54 ± 12 m3/s and 36 ± 8 m3/s for Flow 3 and Flow 4, respectively (from Eq. 3). This gives an emplacement duration of 2.1 ± 0.9 for Flow 3 and 2.1 ± 0.8 days for Flow 4. Again, these are minimum emplacement durations and an emplacement over 5–10 days is probably more realistic.
5.1.2.2 Vent Activity
During Period B, the curtain of fire phase ended, and the vent localised to a single point progressively forming the inner tephra cone (Figures 10D,E). This phase was characterised by more intense eruptions with higher degrees of magma fragmentation mostly producing pyroclasts 4–8 mm in diameter (Figure 6). The tephra fallout was preferentially deposited to the northeast (up to 1.5 km from the cone; Figure 4B) likely due to the prevailing wind direction. We estimate similar effusion rates for Flow 3 and 4 indicating that the explosive dynamics were fairly constant throughout the duration of Period B. This is in agreement with the uniformity of the tephra deposit.
5.2 Comparisons With Other Volcanic Eruptions
Comparisons between Tseax and other NCVP monogenetic volcanoes are limited due to recent and extensive glacial erosion of the majority of the edifices (Edwards and Russell, 2000). Nevertheless, the architecture of the Tseax volcanic edifice compares well with the most recent monogenetic volcanoes of the NCVP which are also small tephra cones associated with long valley-filling mafic lava flows (e.g., Lava Fork, Volcano Mountain; Edwards and Russell, 2000). We note that the erupted volume at Tseax is larger than most of the mafic monogenetic volcanoes in the Auckland Volcanic Field (AVF) by one or two orders of magnitude (Kereszturi et al., 2013). Within the AVF, only One Tree Hill (0.26 km3) and the more complex system Rangitoto (0.7 km3) compare with Tseax in terms of total lava volumes (Kereszturi et al., 2013). Basaltic andesite to andesite monogenetic volcanoes within the Michoácan-Guanajuato Volcanic Field (MGVF) tend to be more voluminous and long-lived. For example, Paricutin (3.56 km3), El Jorullo (1.75 km3) and El Metate (9.2 km3) produced basaltic andesite to andesite lavas during eruptions that lasted several years or decades (Luhr and Carmichael, 1985; Pioli et al., 2008; Chevrel et al., 2016). Even for a slightly higher volume, the andesitic Rancho Seco volcano (0.72 km3) in the MGVF is believed to have lasted between 2 and 6 years (Ramírez-Uribe et al., 2021).
Tseax erupted 0.5 km3 of low viscosity basanite-trachybasalt lavas over a period of weeks to a few months assuming continuous activity, corresponding to time-averaged eruption rates (e.g., Harris et al., 2007) of tens to a few hundred m3/s. Similar eruption rates characterize the most recent alkali basalts in the Harrat Rahat monogenetic volcanic field (1256 CE Al Madinah flow, Five Fingers flows; (Dietterich et al., 2018). Tseax eruption rates also overlap with eruptions of similar volumes of tholeiitic lavas from large shield volcanoes. For example, eruption rates of 47–95, 116–174, 58, and 78–90 m3/s were estimated for the 1,669 Etna, 1859 Mauna Loa, 2018 Kilauea Fissure 8, and 2007 Piton de la Fournaise eruptions, respectively (Corsaro et al., 1996; Riker et al., 2009; Rhéty et al., 2017; Neal et al., 2019). The eruption of Tseax suggests that monogenetic eruptions can be comparable in size and time-averaged eruption rate to eruptions occurring on larger edifices with more complex plumbing systems and relatively stable magma storage zones.
5.3 Hazard Implications
During the Holocene, the NCVP hosted at least one eruption every 270 years (Stasiuk et al., 2003). These recent eruptions happened in mountainous regions and produced valley-filling lava flows with the potential of reaching distal areas (e.g., Iskut River basalts; Lava Fork; Volcano Mountain; Jackson and Stevens, 1992; Cousens and Bevier, 1995; Edwards and Russell, 2000). Therefore, volcanic hazard assessment must be improved in the NCVP.
The products of Tseax are alkali and Fe-rich (Table 2) lavas. It has been shown that Fe-rich basaltic melts (FeOT = 10–22 wt%) can be up to two orders of magnitude less viscous at the glass transition temperature than a typical basalt (Chevrel et al., 2014). At Tseax, the low lava viscosities could have favoured the length of the lava flows and their relatively rapid emplacement. NCVP volcanics tend to be Fe-rich; in particular, the southern volcanic centres have Mg# <50 (Edwards and Russell, 2000). Therefore, if an eruption were to happen in that region, we should expect low viscosity lavas, potentially producing long valley-filling lava flows. In fact, the ∼1,800 CE eruption of Lava Fork (170 km to the Northeast of Tseax; Figure 1B) appears to have been predominantly effusive and produced a 20 km long lava flow (Hauksdottir, 1992).
Tseax volcano is a good example of how a single and short-lived eruption from an isolated monogenetic volcano could produce a significant hazard to the nearby population. The eruption produced a small tephra blanket around the volcano but a total area of 40 km2 was covered by extensive, valley-filling mafic lava flows (Figure 2). Considering similar eruptive dynamics, this scenario is one of the most hazardous that can be expected for the NCVP. At present, nearly 1,000 people live in Gitlaxt’aamiks and Gitwinsilhkw (Statistics Canada, 2016 Census of Population) and forestry, fishing and tourism activities are also located in the area. Several occurrences of Holocene volcanic rocks have been identified in close proximity to Tseax volcano (Figure 1C). This area was recently ranked as having a moderate threat level amongst 28 other potentially active Canadian volcanoes (Wilson and Kelman, 2021). In fact, it is the only region in Canada where monogenetic mafic volcanoes are not considered as a very low volcanic threat. Therefore, if an eruption were to occur again in same area and in a similar manner as Tseax, low viscosity magma would quickly reach the surface without significant advance warning (Le Moigne et al., 2022) and would produce comparable low viscosity mafic lavas. While small lava flows such as the “a”ā flows from the last two eruptive episodes of Tseax should not pose a threat, eruption of larger volumes of lava could be more complicated to manage. Lava flows would disrupt the Nisga’a highway (Highway 113; Figures 1C, 2A) which provides access to the Nisga’a villages of Gitlaxt’aamiks, Gitwinksihlkw, Laxgalts’ap and Gingolx further downstream along the Nass River. Lava flows could again reach the Nass River with potentially disastrous consequences for the nearby population and fisheries in the Nass River.
6 Conclusion
We present here a model for the ∼1,700 CE Tseax volcano eruption in British Columbia, Canada. This eruption was the only volcanic event directly observed and recorded by individuals in Canada with observational accounts recorded in oral and written stories of the Nisga’a people. The eruption extruded ∼0.5 km3 of Fe-rich, Mg-poor basanite-to-trachybasalt lavas covering an area of ∼40 km2 and having a significant impact on the local environment and on the people of Nisga’a First Nation living in the area. Most of the erupted products are lava flows that destroyed three Nisga’a villages and killed up to 2,000 people. This makes it the deadliest volcanic eruption in Canada and possibly the deadliest recorded effusive eruption of direct impact (Auker et al., 2013). The chemical homogeneity of the lava and tephra points towards a single magma batch that erupted over a short period of time, most likely on the order of weeks to a few months.
The magma ascended to the surface in two distinct eruptive periods (Period A and B) perhaps separated by a short pause. The products of Period A are characterised by phenocryst-poor lavas and this phase was predominantly effusive, while those of Period B are phenocryst-rich. The eruptive history can be summarised in the following key points (
Figure 9):
1) Period A began with the opening of a fissure that erupted lava in a typical Hawaiian style progressively building a ∼600 m-diameter horseshoe-shaped spatter rampart, and the effusion of ∼0.47 km3 of low viscosity pāhoehoe lava (Flow 1 and 2) in a few weeks to months;
2) We estimated that about half the entire lava volume was emitted during the first days of the eruption at effusion rates of 800–1,000 m3/s. The lava rapidly reached the Nass River in about 1 day, which it progressively diverted to its current position. Within 2–3 days, the lava engulfed the Nis
g
a’a villages and may have been responsible for the reported fatalities. Another factor that may have caused deaths is potential volcanic laze produced during the lava-water interaction;3) The “a”ā flows (Flow 3 and 4) were extruded during Period B. This phase was characterised by more violent explosions that fragmented the magma to form the inner tephra cone. The explosive activity continued for the entire duration of Period B at a constant rate according to the homogeneity of the tephra deposit.
The present study shows that small volume, isolated volcanoes can represent an unpredictable and significant hazard to nearby populations. Low viscosity magma, such as the one erupted at Tseax, combined with hilly/mountainous topography, can significantly increase the risk to nearby populations notably by producing rapidly emplaced lava flows that can stretch unusually long distances. Finally, the geomorphological, physical and geochemical characteristics of Tseax volcano are typical of a “sensu stricto” monogenetic volcano (Németh and Kereszturi, 2015), i.e., a single and small magma batch producing a simple volcanic edifice in a relatively short lived eruption. However, it appears that the eruption dynamics were comparable to flank eruptions on long-lived shield volcanoes in terms of eruption volume, rates and duration.
Statements
Data availability statement
The original contributions presented in the study are included in the article/Supplementary Material, further inquiries can be directed to the corresponding author.
Author contributions
YLM contributed to conception, writing original draft and visualization. GW-J and NV contributed to supervision. YM, GW-J, NV, and JKR contributed to review and editing of manuscript drafts.
Acknowledgments
Many thanks to Deanna Nyce of the Wilp Wilxo’oskwhl Nisga’a Institute (WWNI) for her continued and enthusiastic support. Mansell Griffiths and Harry Nyce (Nisga’a Lisims Government) generously shared their extensive knowledge of Tseax and the Nisga’a Lava Beds. We are grateful to Irene Squires (WWNI) for her generous hospitality, to Rachel Warwick, Rose Gallo and Sarah Aufrère for assistance during fieldwork. The authors thank two reviewers for helpful comments that strengthened the manuscript and Journal editors A. H. Graettinger and V. Acocella for handling the manuscript. This work was supported by the WWNI, the Nisga’a Lisims Government (NLG) and NSERC Discovery grants to GW-J and JKR This research was carried out as part of BC Parks/NLG permit 108312.
Conflict of interest
The authors declare that the research was conducted in the absence of any commercial or financial relationships that could be construed as a potential conflict of interest.
Publisher’s note
All claims expressed in this article are solely those of the authors and do not necessarily represent those of their affiliated organizations, or those of the publisher, the editors and the reviewers. Any product that may be evaluated in this article, or claim that may be made by its manufacturer, is not guaranteed or endorsed by the publisher.
Supplementary material
The Supplementary Material for this article can be found online at: https://www.frontiersin.org/articles/10.3389/feart.2022.910451/full#supplementary-material
References
1
AukerM. R.SparksR. S. J.SiebertL.CroswellerH. S.EwertJ. (2013). A Statistical Analysis of the Global Historical Volcanic Fatalities Record. J. Appl. Volcanol.2, 1–24. 10.1186/2191-5040-2-2
2
BarbeauM. (1935). Volcanoes on the Nass. Can. Geogr. J.10, 215–225.
3
BatirJ. F.BlackwellD. D. (2019). Thermal Evolution of the Northern Cordillera Volcanic Province: Implication for Heat Flow in Remnant Back-Arc Regions. Int. Geol. Rev.62, 1510–1537. 10.1080/00206814.2019.1658230
4
BebbingtonM. S.CroninS. J. (2011). Spatio-temporal Hazard Estimation in the Auckland Volcanic Field, New Zealand, with a New Event-Order Model. Bull. Volcanol.73, 55–72. 10.1007/s00445-010-0403-6
5
BorehamF.CashmanK.RustA.HöskuldssonÁ. (2018). Linking Lava Flow Morphology, Water Availability and Rootless Cone Formation on the Younger Laxá Lava, NE Iceland. J. Volcanol. Geotherm. Res.364, 1–19. 10.1016/j.jvolgeores.2018.08.019
6
CarlosW. G.GrossJ. E.JamilS.Dela CruzC. S.DambyD.TamE. (2018). Volcanic Eruptions and Threats to Respiratory Health. Am. J. Respir. Crit. Care Med.197, P21–P22. 10.1164/rccm.19712P21
7
CasR. A. F.WrightJ. V. (1987). “Appendix 1: Methods Used in Studying Modern Pyroclastic Deposits,” in Volcanic Successions Modern and Ancient: A Geological Approach to Processes, Products and Successions (London: Chapman & Hall), 469–478.
8
CashmanK. V.CroninS. J. (2008). Welcoming a Monster to the World: Myths, Oral Tradition, and Modern Societal Response to Volcanic Disasters. J. Volcanol. Geotherm. Res.176, 407–418. 10.1016/j.jvolgeores.2008.01.040
9
ChevrelM. O.BaratouxD.HessK.-U.DingwellD. B. (2014). Viscous Flow Behavior of Tholeiitic and Alkaline Fe-Rich Martian Basalts. Geochimica Cosmochimica Acta124, 348–365. 10.1016/j.gca.2013.08.026
10
ChevrelM. O.GuilbaudM.-N.SiebeC. (2016). The ∼AD 1250 Effusive Eruption of El Metate Shield Volcano (Michoacán, Mexico): Magma Source, Crustal Storage, Eruptive Dynamics, and Lava Rheology. Bull. Volcanol.78, 1–28. 10.1007/s00445-016-1020-9
11
CollisonW. H. (1915). in The Wake of the War Canoe : A Stirring Record of Forty Years’ Successful Labour, Peril & Adventure Amongst the Savage Indian Tribes of the Pacific Coast, and the Piratical Head-Hunting Haidas of the Queen Charlotte Islands (London: Service & Co.).
12
ConnollyJ. (2014). Drowning: The Exit Problem. Ijare8, 73–25. 10.25035/ijare.08.01.08
13
CorsaroR. A.CristofoliniR.PatanèL. (1996). The 1669 Eruption at Mount Etna: Chronology, Petrology and Geochemistry, with Inferences on the Magma Sources and Ascent Mechanisms. Bull. Volcanol.58, 348–358. 10.1007/s004450050144
14
CousensB. L.BevierM. L. (1995). Discerning Asthenospheric, Lithospheric, and Crustal Influences on the Geochemistry of Quaternary Basalts from the Iskut-Unuk Rivers Area, Northwestern British Columbia. Can. J. Earth Sci.32, 1451–1461. 10.1139/e95-117
15
DietterichH. R.DownsD. T.SteltenM. E.ZahranH. (2018). Reconstructing Lava Flow Emplacement Histories with Rheological and Morphological Analyses: the Harrat Rahat Volcanic Field, Kingdom of Saudi Arabia. Bull. Volcanol.80, 1–23. 10.1007/s00445-018-1259-4
16
EdwardsB. R. (1997). Field Kinetic, and Thermodynamic Studies of Magmatic Assimilation in the Northern Cordilleran Volcanic Province, Northwestern British Columbia. Canada: The University of British Columbia.
17
EdwardsB. R.RussellJ. K. (2000). Distribution, Nature, and Origin of Neogene-Quaternary Magmatism in the Northern Cordilleran Volcanic Province, Canada. Geol. Soc. Am. Bull.112, 1280–1295. 10.1130/0016-7606(2000)112<1280:dnaoon>2.0.co;2
18
EdwardsB. R.RussellJ. K. (1999). Northern Cordilleran Volcanic Province: A Northern Basin and Range?Geol27, 243–246. 10.1130/0091-7613(1999)027<0243:NCVPAN>2.3.CO;2
19
ElliotR. L.KochR. D.RobinsonS. W. (1981). Age of Basalt Flows in the Blue River Valley, Bradfield Canal Quadrangle. In the U.S. Geological Survey of Alaska, Accomplishments during 1979. U.S. Geological Survey Circular823-B: B115–B116.
20
EvenchickC. A.MustardP. S.GreigC. J.McMechanM. E.RitceyD. H.SmithG. T.et al (2008). Geology. Nass River: British Columbia.
21
FavalliM.ChiricoG. D.PapaleP.PareschiM. T.BoschiE. (2009). Lava Flow Hazard at Nyiragongo Volcano, D.R.C. Bull. Volcanol.71, 363–374. 10.1007/s00445-008-0233-y
22
FoshagW. F.GonzalezJ. R. (1956). Birth and Development of Paricutin Volcano Mexico. U. S. Geol. Surv. Bull.965, 355–489.
23
GalloR. (2018). History and Dynamics of Explosive Volcanism at Tseax Cone, British Columbia. Canada: University of British Columbia.
24
Global Volcanism Program (2021) Weekly Volcanic Activity. Report, 19 May-25 May 2021 2021. Report on Nyiragongo (DR Congo).
25
GudmundssonA.OskarssonN.GronvoldK.SaemundssonK.SigurdssonO.StefanssonR.et al (1992). The 1991 Eruption of Hekla, Iceland. Bull. Volcanol.54, 238–246. 10.1007/bf00278391
26
GuilbaudM.-N.SelfS.ThordarsonT.BlakeS. (2005). Morphology, Surface Structures, and Emplacement of Lavas Produced by Laki, A.D. 1783-1784. Geol. Soc. Am. Spec. Pap.396, 81–102. 10.1130/0-8137-2396-5.81
27
HamiltonC. W.ThordarsonT.FagentsS. A. (2010). Explosive Lava-Water Interactions I: Architecture and Emplacement Chronology of Volcanic Rootless Cone Groups in the 1783-1784 Laki Lava Flow, Iceland. Bull. Volcanol.72, 449–467. 10.1007/s00445-009-0330-6
28
HansonG. (1924). Reconnaissance between Skeena River and Stewart. Ottawa: B.C.
29
HarderM.RussellJ. K. (2006). Thermal State of the Upper Mantle beneath the Northern Cordilleran Volcanic Province (NCVP), British Columbia, Canada. Lithos87, 1–22. 10.1016/j.lithos.2005.05.002
30
HarrisA. J. L.DehnJ.CalvariS. (2007). Lava Effusion Rate Definition and Measurement: A Review. Bull. Volcanol.70, 1–22. 10.1007/s00445-007-0120-y
31
HasenakaT.CarmichaelI. S. E. (1985). The Cinder Cones of Michoacán-Guanajuato, Central Mexico: Their Age, Volume and Distribution, and Magma Discharge Rate. J. Volcanol. Geotherm. Res.25, 105–124. 10.1016/0377-0273(85)90007-1
32
HasenakaT. (1994). Size, Distribution, and Magma Output Rate for Shield Volcanoes of the Michoacán-Guanajuato Volcanic Field, Central Mexico. J. Volcanol. Geotherm. Res.63, 13–31. 10.1016/0377-0273(94)90016-7
33
HauksdottirS. (1992). Petrography, Geochemistry and Petrogenesis of the Iskut-Unuk Rivers Volcanic Centres, Northwestern British Columbia. Canada: The University of British Columbia.
34
HeadJ. W.WilsonL. (1989). Basaltic Pyroclastic Eruptions: Influence of Gas-Release Patterns and Volume Fluxes on Fountain Structure, and the Formation of Cinder Cones, Spatter Cones, Rootless Flows, Lava Ponds and Lava Flows. J. Volcanol. Geotherm. Res.37, 261–271. 10.1016/0377-0273(89)90083-8
35
HicksonC. J.EdwardsB. R. (2001). “Volcanoes and Volcanic Hazards,”. A Synthesis Geol. Hazards Can. Editor BrooksG. R. (Bulletin: Geological Survey of Canada), 548, 145–181. 10.4095/212217
36
HigginsM. D. (2009). The Cascadia Megathrust Earthquake of 1700 May Have Rejuvenated an Isolated Basalt Volcano in Western Canada: Age and Petrographic Evidence. J. Volcanol. Geotherm. Res.179, 149–156. 10.1016/j.jvolgeores.2008.10.016
37
HonK.KauahikauaJ.DenlingerR.MackayK. (1994). Emplacement and Inflation of Pahoehoe Sheet Flows: Observations and Measurements of Active Lava Flows on Kilauea Volcano, Hawaii. Geol. Soc. Am. Bull.106, 351–370. 10.1130/0016-7606(1994)106<0351:eaiops>2.3.co;2
38
HulmeG.FielderG. (1977). Effusion Rates and Rheology of Lunar Lavas. Philos. Trans. R. Soc. A Math. Phys. Eng. Sci.285, 227–234. 10.1098/rsta.1977.0059
39
HydroB. C. (1981) Geothermal Exploration of the Aiyansh-Terrace Area, Report No. SE 8123.
40
JacksonL. E.StevensW. (1992). A Recent Eruptive History of Volcano Mountain, Yukon Territory. Curr. Res. Part A, Cordill. Pac. Margin92, 33–39. 10.4095/132784
41
JonesT. J.Le MoigneY.RussellJ. K.Williams-JonesG.GiordanoD.DingwellD. B. (2022). Inflated Pyroclasts in Proximal Fallout Deposits Reveal Abrupt Transitions in Eruption Behaviour. Nat. Commun.10.1038/s41467-022-30501-6
42
JonesT. J.HoughtonB. F.LlewellinE. W.ParchetaC. E.HöltgenL. (2018). Spatter Matters - Distinguishing Primary (Eruptive) and Secondary (Non-eruptive) Spatter Deposits. Sci. Rep.8, 1–12. 10.1038/s41598-018-27065-1
43
JonesT. J.LlewellinE. W. (2021). Convective Tipping Point Initiates Localization of Basaltic Fissure Eruptions. Earth Planet. Sci. Lett.553, 116637. 10.1016/j.epsl.2020.116637
44
KereszturiG.NémethK.CroninS. J.Agustín-FloresJ.SmithI. E. M.LindsayJ. (2013). A Model for Calculating Eruptive Volumes for Monogenetic Volcanoes - Implication for the Quaternary Auckland Volcanic Field, New Zealand. J. Volcanol. Geotherm. Res.266, 16–33. 10.1016/j.jvolgeores.2013.09.003
45
KeszthelyiL.ThordarsonT. (2000) Rubbly Pahoehoe: a Previously Undescribed but Widespread Lava Type Transitional between Aa and Pahoehoe. In: Meeting of the Geological Society of America Abstracts with Program. 26 October 2020-30 October 2020.
46
KeszthelyiL.ThordarsonT.SelfS. (2001) Rubbly Pahoehoe: Implication for Flood Basalt Eruptions and Their Atmospheric Effects. In: American Geophysical Union Fall Meeting Abstracts. 20April, San Francisco, USA.
47
KilburnC. R. J.LopesR. M. C. (1994). A Model for Forecasting Lava Flow Lengths. Abstract of the 25th Lunar and Planetary Science Conference. March 14–18, 1994. Houston, TX, 805.
48
KilburnC. R. J. (2004). Fracturing as a Quantitative Indicator of Lava Flow Dynamics. J. Volcanol. Geotherm. Res.132, 209–224. 10.1016/S0377-0273(03)00346-9
49
KnudsonJ. G.KatzD. L. (1958). Fluid Dynamics, Heat Transfer. New York(US): McGraw-Hill.
50
KomorowskiJ-C.TedescoD.KaserekaM.AllardP. (2003). The January 2002 Flank Eruption of Nyiragongo Volcano (Democratic Republic of Congo): Chronology, Evidence for a Tectonic Rift Trigger, and Impact of Lava Flows on the City of Goma. Acta Vulcanol.15, 27–62.
51
Le MoigneY.VigourouxN.RussellJ. K.Williams-JonesG. (2022). Magmatic Origins and Storage Conditions for the Historic Eruption of Tseax Volcano, British Columbia, Canada. Chem. Geol.588, 120648. 10.1016/j.chemgeo.2021.120648
52
Le MoigneY.Williams-JonesG.RussellK.QuaneS. (2020). Physical Volcanology of Tseax Volcano, British Columbia, Canada. J. Maps16, 363–375. 10.1080/17445647.2020.1758809
53
LipmanP. W.BanksN. G. (1987). A’a Flow Dynamics, 1984 Mauna Loa Eruption. U. S. Geol. Surv. Prof. Pap.1350, 1527–1567.
54
LowdonJ. A.RobertsonI. M.BlakeW. (1971). Geological Survey of Canada Radiocarbon Dates XI. Radiocarbon13, 255–324. 10.1017/s0033822200008456
55
LuhrJ. F.CarmichaelI. S. E. (1985). Jorullo Volcano, Michoacán, Mexico (1759-1774): The Earliest Stages of Fractionation in Calc-Alkaline Magmas. Contr. Mineral. Pet.90, 142–161. 10.1007/bf00378256
56
MantheiC. D.DuceaM. N.GirardiJ. D.PatchettP. J.GehrelsG. E. (2010). Isotopic and Geochemical Evidence for a Recent Transition in Mantle Chemistry beneath the Western Canadian Cordillera. J. Geophys. Res.115, 1–19. 10.1029/2009jb006562
57
MasseW. B.BarberE. W.PiccardiL.BarberP. T. (2007). Exploring the Nature of Myth and its Role in Science. Geol. Soc. Lond. Spec. Publ.273, 9–28. 10.1144/gsl.sp.2007.273.01.02
58
MattoxT. N.ManganM. T. (1997). Littoral Hydrovolcanic Explosions: A Case Study of Lava-Seawater Interaction at Kilauea Volcano. J. Volcanol. Geotherm. Res.75, 1–17. 10.1016/S0377-0273(96)00048-0
59
McCullaghJ. B. (1918). Ignis. A Parable of the Great Lava Plain in the Valley of “Eternal Bloom”, Nass River. Aiyansh, B.C: British Columbia.
60
MiyamotoH.PappK. R. (2004). Rheology and Topography Control the Path of a Lava Flow: Insight from Numerical Simulations over a Preexisting Topography. Geophys. Res. Lett.31, 2–5. 10.1029/2004GL020626
61
NealC. A.BrantleyS. R.AntolikL.BabbJ. L.BurgessM.CallesK.et al (2019). The 2018 Rift Eruption and Summit Collapse of Kīlauea Volcano. Science80, 367–374. 10.1126/science.aav7046
62
NémethK.KereszturiG. (2015). Monogenetic Volcanism: Personal Views and Discussion. Int. J. Earth Sci. Geol. Rundsch)104, 2131–2146. 10.1007/s00531-015-1243-6
63
Nisga’a Tribal Council (2004). Laxmihl. New Aiyansh.
64
Nisga’a Tribal Council, B.C. Parks Committee (1997). Anhluut’ukwsim Laxmihl Angwinga’asanskwhl Nisga’a: Nisga’a Memorial Lava Bed Park Master Plan. Canada: British Columbia.
65
PedenA. E.FranklinR. C.LeggatP. A. (2016). Fatal River Drowning: The Identification of Research Gaps through a Systematic Literature Review. Inj. Prev.22, 202–209. 10.1136/injuryprev-2015-041750
66
PedersenG. B. M.HöskuldssonA.DürigT.ThordarsonT.JónsdóttirI.RiishuusM. S.et al (2017). Lava Field Evolution and Emplacement Dynamics of the 2014-2015 Basaltic Fissure Eruption at Holuhraun, Iceland. J. Volcanol. Geotherm. Res.340, 155–169. 10.1016/j.jvolgeores.2017.02.027
67
PetersonD. W.TillingR. I. (1980). Transition of Basaltic Lava from Pahoehoe to Aa, Kilauea Volcano, Hawaii: Field Observations and Key Factors. J. Volcanol. Geotherm. Res.7, 271–293. 10.1016/0377-0273(80)90033-5
68
PinkertonH.SparksR. S. J. (1978). Field Measurements of the Rheology of Lava. Nature276, 383–385. 10.1038/276383a0
69
PinkertonH.WilsonL. (1994). Factors Controlling the Lengths of Channel-Fed Lava Flows. Bull. Volcanol.56, 108–120. 10.1007/bf00304106
70
PioliL.ErlundE.JohnsonE.CashmanK.WallaceP.RosiM.et al (2008). Explosive Dynamics of Violent Strombolian Eruptions: The Eruption of Parícutin Volcano 1943-1952 (Mexico). Earth Planet. Sci. Lett.271, 359–368. 10.1016/j.epsl.2008.04.026
71
PolandM. P.OrrT. R.KauahikauaJ. P.BrantleyS. R.BabbJ. L.PatrickM. R.et al (2016). The 2014-2015 Pāhoa Lava Flow Crisis at Kīlauea Volcano, Hawai'i: Disaster Avoided and Lessons Learned. Gsat26, 4–10. 10.1130/GSATG262A.1.4
72
PurssellT. (1993). "Gitwinksihlkw Bridge Foundation Design Summary Report," in Ministry of Transportation and Highways, North West Region, Province of British Columbia. File M52-45-2998.
73
Ramírez-UribeI.SiebeC.ChevrelM. O.FisherC. T. (2021). Rancho Seco Monogenetic Volcano (Michoacán, Mexico): Petrogenesis and Lava Flow Emplacement Based on LiDAR Images. J. Volcanol. Geotherm. Res.411, 107169. 10.1016/j.jvolgeores.2020.107169
74
RhétyM.HarrisA. J. L.VilleneuveN.GurioliL.MedardE.ChevrelO.et al (2017). A comparison of cooling-limited and volume-limited flow systems: Examples from channels in the Piton de la Fournaise April 2007 lava-flow field. Geochem. Geophys Geosystems18, 3270–3291. 10.1002/2017GC006839
75
RichardsonP.KarlstromL. (2019). The Multi-Scale Influence of Topography on Lava Flow Morphology. Bull. Volcanol.81. 10.1007/s00445-019-1278-9
76
RikerJ. M.CashmanK. V.KauahikauaJ. P.MontierthC. M. (2009). The Length of Channelized Lava Flows: Insight from the 1859 Eruption of Mauna Loa Volcano, Hawai'i. J. Volcanol. Geotherm. Res.183, 139–156. 10.1016/j.jvolgeores.2009.03.002
77
RobertsM. C.McCuaigS. J. (2001). Geomorphic Responses to the Sudden Blocking of a Fluvial System: Aiyansh Lava Flow, Northwest British Columbia. Can. Geogr.45, 319–323. 10.1111/j.1541-0064.2001.tb01492.x
78
RodenG. I. (1967). On River Discharge into the Northeastern Pacific Ocean and the Bering Sea. J. Geophys. Res.72, 5613–5629. 10.1029/jz072i022p05613
79
RumpfM. E.LevE.WysockiR. (2018). The Influence of Topographic Roughness on Lava Flow Emplacement. Bull. Volcanol.80. 10.1007/s00445-018-1238-9
80
SmithI. E. M.NémethK. (2017). Source to Surface Model of Monogenetic Volcanism: A Critical Review. Geol. Soc. Lond. Spec. Publ.446, 1–28. 10.1144/SP446.14
81
SolanaM. C.KilburnC. R. J.Rodriguez BadiolaE.AparicioA. (2004). Fast emplacement of extensive pahoehoe flow-fields: the case of the 1736 flows from Montaña de las Nueces, Lanzarote. J. Volcanol. Geotherm. Res.132, 189–207. 10.1016/S0377-0273(03)00345-7
82
Sutherland BrownA. (1969). Aiyansh Lava Flow, British Columbia. Can. J. Earth Sci.6, 1460–1468. 10.1139/e69-149
83
StasiukM. V.HicksonC. J.MulderT. (2003). The Vulnerability of Canada to Volcanic Hazards. Nat. Hazards28, 563–589. 10.1023/A:1022954829974
84
SumnerJ. M.BlakeS.MatelaR. J.WolffJ. A. (2005). Spatter. J. Volcanol. Geotherm. Res.142, 49–65. 10.1016/j.jvolgeores.2004.10.013
85
SwansonD. A. (1973). Pahoehoe Flows from the 1969-1971 Mauna Ulu Eruption, Kilauea Volcano, Hawaii. Geol. Soc. Am. Bull.84, 615–626. 10.1130/0016-7606(1973)84<615:PFFTMU>2.0.CO;2
86
SymonsD. T. A. (1975). Age and Flow Direction from Magnetic Measurements on the Historic Aiyansh Flow, British Columbia. J. Geophys. Res.80, 2622–2626. 10.1029/jb080i017p02622
87
TazieffH. (1977). An Exceptional Eruption: Mt. Niragongo, Jan. 10th, 1977. Bull. Volcanol.40, 189–200. 10.1007/BF02596999
88
ThordarsonT.SelfS. (1993). The Laki (Skaftar Fires) and Grimsvotn Eruptions in 1783?1785. Bull. Volcanol.55, 233–263. 10.1007/BF00624353
89
ThorkelsonD. J.MadsenJ. K.SluggettC. L. (2011). Mantle Flow through the Northern Cordilleran Slab Window Revealed by Volcanic Geochemistry. Geology39, 267–270. 10.1130/G31522.1
90
ThorkelsonD. J.TaylorR. P. (1989). Cordilleran Slab Windows. Geol17, 833–836. 10.1130/0091-7613(1989)017<0833:csw>2.3.co;2
91
ValentineG. A.GreggT. K. P. (2008). Continental Basaltic Volcanoes - Processes and Problems. J. Volcanol. Geotherm. Res.177, 857–873. 10.1016/j.jvolgeores.2008.01.050
92
van der HeydenP.WoodsworthG. J.SnyderL. D. (2000). “Reconnaissance Geological Mapping in Southwest Nass River Map Area, British Columbia. Current Research 2000-A6,” in Current Research 2000-A6 (Ontario: Geological Survey of Canada), 9.
93
VergniolleS.ManganM. T. (2000). “Hawaiian and Strombolian Eruptions,” in The Encyclopedia of Volcanoes. SigurdssonH.HoughtonB. F.McNuttS. R.. Editors (Netherland: Elsevier), 447–461.
94
WalkerG. P. L. (1991). Structure, and Origin by Injection of Lava under Surface Crust, of Tumuli, ?lava Rises?, ?lava-Rise Pits?, and ?lava-Inflation Clefts? in Hawaii. Bull. Volcanol.53, 546–558. 10.1007/BF00298155
95
Williams-JonesG.BarendregtR. W.RussellJ. K.Le MoigneY.EnkinR. J.GalloR. (2020). The Age of the Tseax Volcanic Eruption, British Columbia, Canada. Can. J. Earth Sci.57, 1238–1253. 10.1139/cjes-2019-0240
96
Williams-JonesG.RymerH. (2015). “Hazards of Volcanic Gases,” in The Encyclopedia of Volcanoes (Netherland: Elsevier), 985–992. 10.1016/b978-0-12-385938-9.00057-2
97
WilsonA. M.KelmanM. C. (2021). Assessing the Relative Threats from Canadian Volcanoes. Geol. Surv. Can. Open File8790. 10.4095/328950
98
WoodsworthG. J.AndersonR. G.ArmstrongR. L.StruikL. C.HeydenP. v. d. (1991). “Plutonic Regimes,” in Geology of the Cordilleran Orogen in Canada. Editors GabrielseH.YorathC. J. (Colorado(UK): The Geological Society of America), 491–531. 10.1130/dnag-gna-g2.491
99
WuorinenV. (1978). Age of Aiyansh Volcano, British Columbia. Can. J. Earth Sci.15, 1037–1038. 10.1139/e78-111
Summary
Keywords
monogenetic volcanism, lava flow, eruption dynamics, indigenous knoweldge, Tseax volcano, Canada
Citation
Le Moigne Y, Williams-Jones G, Vigouroux N and Russell JK (2022) Chronology and Eruption Dynamics of the Historic∼1700 CE Eruption of Tseax Volcano, British Columbia, Canada. Front. Earth Sci. 10:910451. doi: 10.3389/feart.2022.910451
Received
01 April 2022
Accepted
26 May 2022
Published
22 June 2022
Volume
10 - 2022
Edited by
Alison Hollomon Graettinger, University of Missouri–Kansas City, United States
Reviewed by
Karen Fontijn, Université libre de Bruxelles, Belgium
Marco Brenna, University of Otago, New Zealand
Updates
Copyright
© 2022 Le Moigne, Williams-Jones, Vigouroux and Russell.
This is an open-access article distributed under the terms of the Creative Commons Attribution License (CC BY). The use, distribution or reproduction in other forums is permitted, provided the original author(s) and the copyright owner(s) are credited and that the original publication in this journal is cited, in accordance with accepted academic practice. No use, distribution or reproduction is permitted which does not comply with these terms.
*Correspondence: Yannick Le Moigne, ylemoign@sfu.ca
This article was submitted to Volcanology, a section of the journal Frontiers in Earth Science
Disclaimer
All claims expressed in this article are solely those of the authors and do not necessarily represent those of their affiliated organizations, or those of the publisher, the editors and the reviewers. Any product that may be evaluated in this article or claim that may be made by its manufacturer is not guaranteed or endorsed by the publisher.