 Gareth H. Rogers
 Louise B. Hamdy
 Amy L. McGarry1
 David P. Gold
- 1CGG, Conwy, United Kingdom
- 2CGG, Llandudno, United Kingdom
Microplastic is a significant global problem. The rapid screening of environmental matter is highly beneficial to the efficient detection, analysis and mapping of microplastic pollution, however many current laboratory techniques to test samples are time-consuming and often involve hazardous chemicals. SEM-based automated mineralogy (AM) is a uniquely powerful tool for quantifying chemical, mineral and textural properties for a wide-range of sample types. This paper presents an attempt to use AM to identify and quantify microplastic within a heterogeneous surrounding matrix using QEMSCAN® (Quantification and Evaluation of Minerals by Scanning Electron Microscopy). Here, the standard AM processes are adapted to develop an entirely new methodology, involving the use of a novel mounting medium for sample preparation and the building of a Species Identification Protocol (SIP) using polymer standards. The results show potential, although challenges include the over-quantification of plastic and differentiation from natural matter. Additional challenges relate to limitations regarding the particular AM system used, which places restrictions on methodology, but which may be overcome with newer systems. This study indicates that, with further refinement, AM may have future potential as a high-throughput, cost-effective, initial screening step to identify highly microplastic-polluted areas and accelerate research into establishing solutions.
Introduction
Automated mineralogy (AM) is a highly diverse analytical tool that, as well as its more common applications within geological analysis, has also been used to study a variety of materials including spent lithium ion battery powders (Vanderbruggen et al., 2021), sewage sludge ash (Guhl et al., 2020), and soil samples: for the identification of particulate trace evidence in forensic investigations (Pirrie et al., 2009), and for studying the partitioning of metal(loid)s in topsoil affected by mining (Tuhý et al., 2020). AM has also found application in the evaluation of the toxicity of airborne particulate matter (Williamson et al., 2013; Elmes, 2021). Due to the effectiveness of AM to differentiate and identify micron-sized particles, even within a surrounding media, it is highly attractive for identifying solid pollutants in complex environmental matrices.
Microplastic pollution is a growing issue of concern worldwide, with particles in the millimeter and sub-millimeter range being detected in many diverse host materials including marine (Cauwenberghe et al., 2013) and river sediments (Klein et al., 2015), terrestrial and agricultural soils (Corradini et al., 2019), animal (Abbasi et al., 2018) and plant tissues (Li et al., 2020), as well as suspended within aquatic ecosystems (Wenya et al., 2019) and in the air column (Abbasi et al., 2019). Indeed, so ubiquitous is plastic pollution, that it may be considered a stratigraphic “technofossil” marker of the Anthropocene (Zalasiewicz et al., 2016). Increasing public awareness has prompted governmental efforts to address the issue, resulting in a legally binding global plastic treaty, an agreement between 175 countries to end plastic pollution, recently formalised at the United Nations Environment Assembly (UNEA) in Nairobi (Vaughan, 2022).
Preventing plastic—and microplastic in particular—from entering and polluting an environment is an enormous and multifaceted challenge, not least since it requires greater understanding of its provenance and behaviour. Distinguishing a highly polluted sample generally involves the separation of microplastic particles from the matrix to produce a concentrated specimen for analysis. Separation techniques often include a combination of methods including: picking particles by hand under a light microscope (Felismino et al., 2021), sieving (Jaafar et al., 2020), density separation using a highly concentrated salt solution (Coppock et al., 2017), and oleophilic separation techniques using oil and water (Mani et al., 2019; Lechthaler et al., 2020), possibly aided by freezing (Scopetani et al., 2020). To aid the identification of particles, they may be stained with dyes such as Nile Red, and illuminated under UV (Tamminga et al., 2017), or blue or green light (Maes et al., 2017; Kaile et al., 2020). In instances where the plastic particles are difficult to remove from surrounding organic matter, such as investigations on plant rich sediments or animal carcasses, it may be necessary to digest the matter through the use of Fenton's reagent (Tagg et al., 2017), potassium hydroxide solution (Dehaut et al., 2016) or via enzymatic digestion (Cole et al., 2014). These processes can be considerably involved, reducing the efficiency of microplastic research, therefore it is preferable to be highly selective as to which samples get fully processed this way. They require harmful chemicals, are prone to contamination and, overall, are not conducive towards a rapid throughput analytical workflow to establish highly microplastic-polluted materials. Therefore, there is a growing demand in the microplastic research community for more advanced methods that can provide quantitative and objective information on a large number of samples with relatively reduced cost, risk and time compared to current methods.
The identification of microplastic depends significantly on the ability to recognize size and shape, as well as chemical and spectral data. Beyond exposing the presence of microplastics, their physical characteristics are highly relevant to interpreting their history and their potential impact on an ecosystem. The shape of microplastic particles is associated with the fragmentation process and how long the material has been in a marine environment: smooth edges can suggest a longer residence time and more angular fragments with sharper edges may be indicative of more recent pollution or of the breakup of larger pieces (Doyle et al., 2011; Hidalgo-Ruz et al., 2012). Furthermore, in a body of water, the time for microplastic particles to settle on the underlying sediment is affected by their shape as well as density, therefore also affecting their lateral transport (Chubarenko et al., 2016). When considering the direct danger to fauna, the size and shape of microplastics are fundamental as there is a higher chance of ingestion of smaller particles and more angular geometries may be more difficult to excrete (Meng et al., 2020).
Due to the effectiveness of AM techniques to highlight, identify and quantify recognized shapes or particles, AM has the potential to play a revolutionizing role in the detection and study of microplastics in contaminated environments. Further refinement and the overcoming of certain limiting factors is necessary, however the advantages are many. Key benefits include a generally straightforward and safe sample preparation involving drying and sieving of the material and setting directly into a mounting medium which is ground for analysis. It is also a rapid and non-destructive technology which is unbiased with regards to operator, thus enabling widescale comparison of results. Another advantage is that particle mapping enables the study of unique shapes that may be quantified and integrated into machine learning models to offer ever greater insight into microplastic characteristics (Cowger et al., 2020). Furthermore, the analysis of microplastic within the matrix would enable the study of how the particles behave in situ, and their interactions and affinities for other particles.
Naturally, the drawback of analysing carbon-based particles is that for effective imaging, it is necessary to ensure sufficient contrast in backscatter coefficient between the targeted particle and the mounting medium. Therefore, the traditional use of a predominantly carbon-based organic resin as the mounting medium renders this sample preparation method impractical to identify particles that are also primarily carbon, such as plastic. However, the analysis of various carbonaceous solids by AM techniques has previously been reported. One common solution is to mount the sample in carnauba wax, as has been conducted by Matsuoka et al. in examining the composition of mineral matter in coal (Matsuoka et al., 2002). O’Brien et al. (2011) have also analysed coal in this way, by setting the carnauba wax sample within a ring of epoxy resin to improve the strength of the block and obtain a smoother polished surface. Alternatively, the halogenation of epoxy resin has been employed as a means of changing its average atomic number and chemical identity to better differentiate carbon materials. Rahfeld and Gutzmer, 2017 produced an iodized epoxy by the addition of 15 wt% iodoform to the resin in order to mount black shale-hosted ore deposits for kerogen identification and quantification. This enabled the imaging and differentiation of the organic matter and inorganic minerals from the iodized resin. However, it was found that there was systematic under representation of the overall carbon content by roughly 50%, which was attributed to very thin kerogen bands under 1 μm being undetected (Rahfeld and Gutzmer, 2017).
Plastic itself has been listed as an identified phase by an AM study of office dust captured on tape (Tonzetic et al., 2006). This technique may be practicable to analyse fine particulate matter from a very low mass dust sample, however identifying plastic particles from a heterogeneous and densely populated sample such as sediment would require a different approach. Secondly, for accurate EDS data collection using existing analysing systems it is preferable to polish the sample to a flat surface, which would require the sample be mounted in a solid block.
The ultimate advantage of using AM for microplastic research is that it may be used as a preliminary screening tool to enable the rapid identification and quantification of microplastic pollution over a relatively large geographical area, such as a stretch of coastline. This would be of huge benefit in terms of understanding the scale of pollution and interpreting the sources and transport mechanisms of microplastic. AM can offer insight into particle size, shape and behavior within a matrix, giving an initial assessment of the threat posed by these particles. Being non-destructive, the sample may be further imaged using optical or SEM microscopy to analyse for textural appearance. The technique may also potentially be utilised in combination with integrated spectroscopic analysis, e.g., Raman or Fourier-transform infrared spectroscopy (FTIR). This combined approach could highlight particles of interest and identify the specific type of plastic detected.
Additionally, AM can be conducted using lab-based “static” SEMs, or transportable “field” SEMs. For static systems, more precise data can be obtained and a higher standard of sample preparation is required such that approximately 50 samples may be analysed every 2-days. Oil and gas exploration has employed transportable SEMs housed within a typical car trailer equipped with sample preparation facilities. These set-ups may potentially produce results for 108 analyses per day, (with shift working) (Ly, 2018). For microplastic analyses in environmental samples, transportable SEM systems could drastically reduce the turnaround time for results by analysing samples on-site.
In this work, we present an attempt to create an AM workflow for the rapid screening of microplastics using Quantitative Evaluation of Minerals by Scanning Electron Microscopy (QEMSCAN®). Using a calcium sulphate hemihydrate cement in place of epoxy resin, we utilise a new sample preparation method in combination with the building of a Species Identification Protocol (SIP) using polymer standards. With improvements to better refine the differentiation between plastic and natural organic matter, and to overcome limitations regarding the particular AM system used here, this approach shows it may be possible to apply AM as a method of rapid screening of environmental samples for microplastic pollution.
Materials and methods
Sample preparation
The new methodology utilises a non-carbon binder to mount the samples for analysis. A calcium sulphate hemihydrate cement is prepared by combining Crystacal R Hard Strength Casting Plaster (Crystacal) with distilled water in an approximately 3:1 mass ratio. The cement is mixed with the sample material in a 30 mm diameter cylindrical polypropylene mould to fully encase the material. The sample is allowed to dry and solidify, and the bottom face is subsequently ground until smooth to 15 μm. Once dry again, the finished surface is coated with copper, rather than more commonly used carbon, to avoid introducing additional carbon to the samples.
Following initial trials, a blind test scenario was conducted to gauge the effectiveness of using QEMSCAN® to detect microplastic in nine model experiments. Sample blocks were prepared, composed of mixtures of microplastics, mineral (sand) and natural matter (herein referred to as “organic”) in varying ratios as outlined in Table 1 and in shown Supplementary Figure S1.
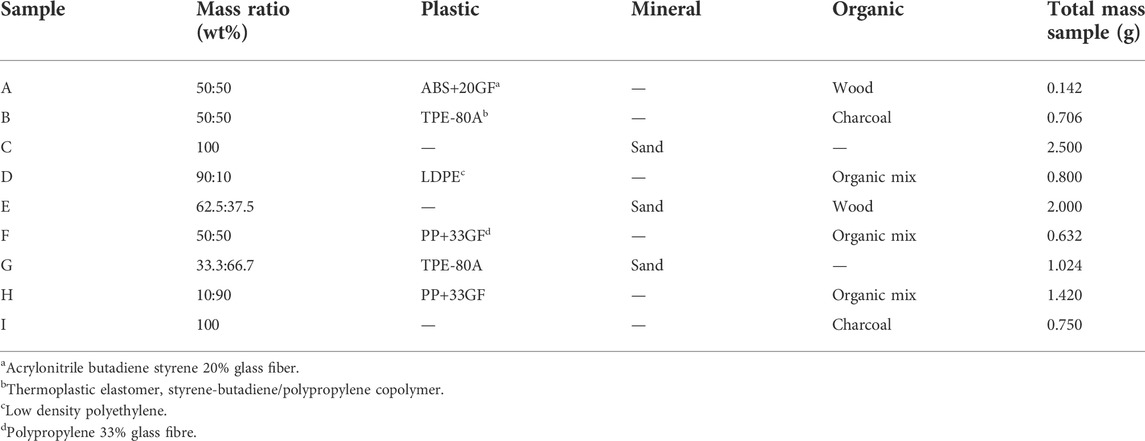
TABLE 1. Composition of test samples A–I.
SEM set-up and QEMSCAN processing
Samples were analysed using a Thermo Fisher Scientific Quanta 650F scanning electron microscope fitted with two Bruker ASX XFlash 5030 SDD Energy Dispersive Spectrometers (EDS), a Back-Scattered Electron detector (BSE), a Secondary Electron detector (SE), and Bruker eSpirit 1.9 EDS microanalysis software. Experimental conditions are listed in Supplementary Table S1. The instrument set-up for QEMSCAN® was significantly adapted compared to common mineralogical applications in order to enable the mapping of regions of high carbon concentration which may indicate the presence of plastic. A typical QEMSCAN® analysis usually applies a “backscatter” (BSE) cutoff such as 25 RGB within the iMeasure software, meaning only areas of the sample with an RGB value higher than 25 are subjected to EDS X-ray acquisition and epoxy resin is ignored. Firstly, this prevents the electron beam at high keV (typically 15–25 keV) from staying too long on regions of epoxy and acquiring X-rays, which risks outgassing and beam contamination. Secondly, it enables the mounting medium to be identified and excluded from quantification and processing in post-acquisition data manipulation. For this study, the BSE cutoff was set to zero so that X-rays would be acquired from all points on the sample surface. Thus, the amount of mounting medium could be quantified and manipulated in post-processing, and no carbon-based material would be excluded regardless of its backscatter RGB value.
An accelerating voltage of 15 keV was used, which was not preferable given issues of outgassing and beam contamination, but the Quanta 650F does not allow QEMSCAN® operation below 15 keV as no element standards are available for the beam voltage and hardware configuration. The pulse throughput of the detectors was set at 90,000 cps to enable an optimised X-ray spectrum peak for carbon. Samples were analysed in high vacuum using a beam current of 1.7 nA. Approximately 90% of each 30 mm diameter sample surface was analysed at a 50 μm scanning resolution producing approximately 250,000 EDS measurements per sample with each measurement corresponding to a 50 μm pixel in the resulting false-colour images.
Two sequential tests were performed. Test 1 (T1) was entirely blind and used an EDS acquisition count rate of 500 cps—significantly lower than is common practice for QEMSCAN® analysis, (usually 1,000–3,000 cps). Since the BSE cutoff was set to zero, every 50 μm point within the analysis area would undergo X-ray acquisition. Therefore, 500 cps was selected in an attempt to reduce the overall acquisition time per sample. For Test 2 (T2), an acquisition count rate of 1,000 cps was used to help improve the results.
Prior to running the analyses, new “Species Identification Protocols” (SIPs) were made within the iExplorer software. These were constructed using the peak intensity method to acquire EDS spectral data of standards prepared from a wide range of common plastic and organic materials. Standards were set in Crystacal blocks, coated with Cu, and analysed as per the experimental conditions applied during QEMSCAN® analysis. The overall purpose of acquiring the standards was to collect a wide range of representative spectra and relative elemental concentration data that could broadly be grouped as “plastics” and “organics”, and then utilise the software to identify SIP entries that were overlapping and so could not be distinguished from one-another. SIP 1 contains 230 spectral peak intensity definitions as shown in Supplementary Table S2. Following T1, T2 was undertaken using a revised version of SIP 1 (SIP 2) as shown in Supplementary Table S3.
The SIPs were used during QEMSCAN® analysis to classify the raw data, and following completion of the analyses, data was grouped and displayed on particle maps using a simplified secondary list in the iDiscover software package. For T1, the particle maps show pixels classified as mineral, organic, plastic or undistinguished organic/plastics, (Supplementary Figure S2). The quantified mounting medium was subtracted from the dataset so the remaining materials were normalised to 100%. The final data output involved an additional normalisation to display only pixels classified as being mineral, organic or plastic, removing the undistinguished organics/plastics category. For T2 no organics/plastics category was defined, only the mounting medium was subtracted from the dataset.
Results
The final particle map images from T1 and T2 are presented in Figures 1, 2. The sample composition (by % mass) is presented in Supplementary Table S4, with the raw data for % area coverage (mineral/organic/plastic) for T1 and T2. The data is directly compared in Figure 3.
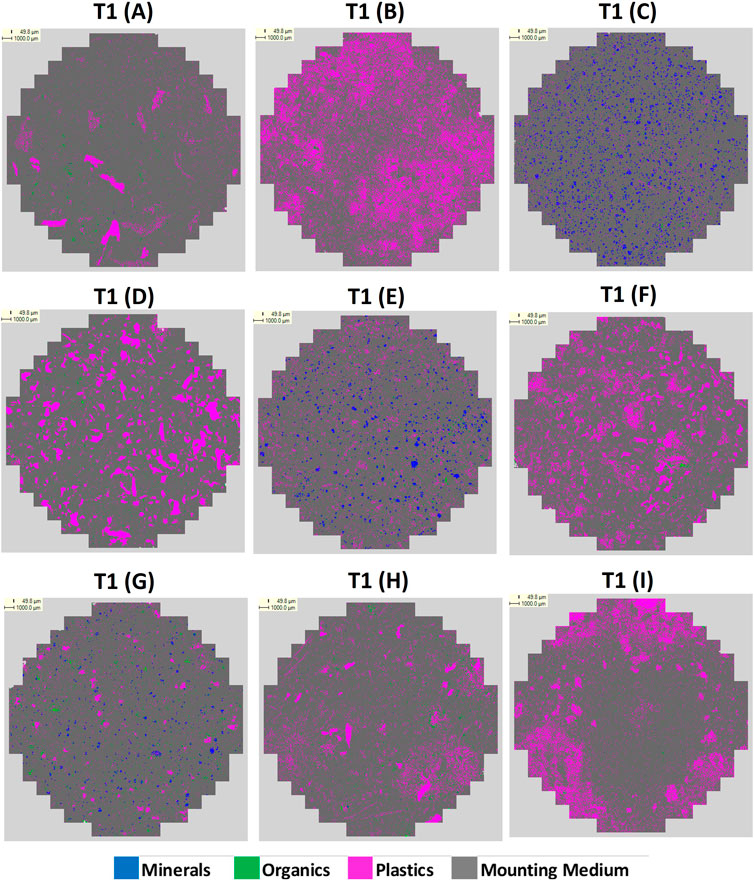
FIGURE 1. Particle map images for T1, samples A–I.
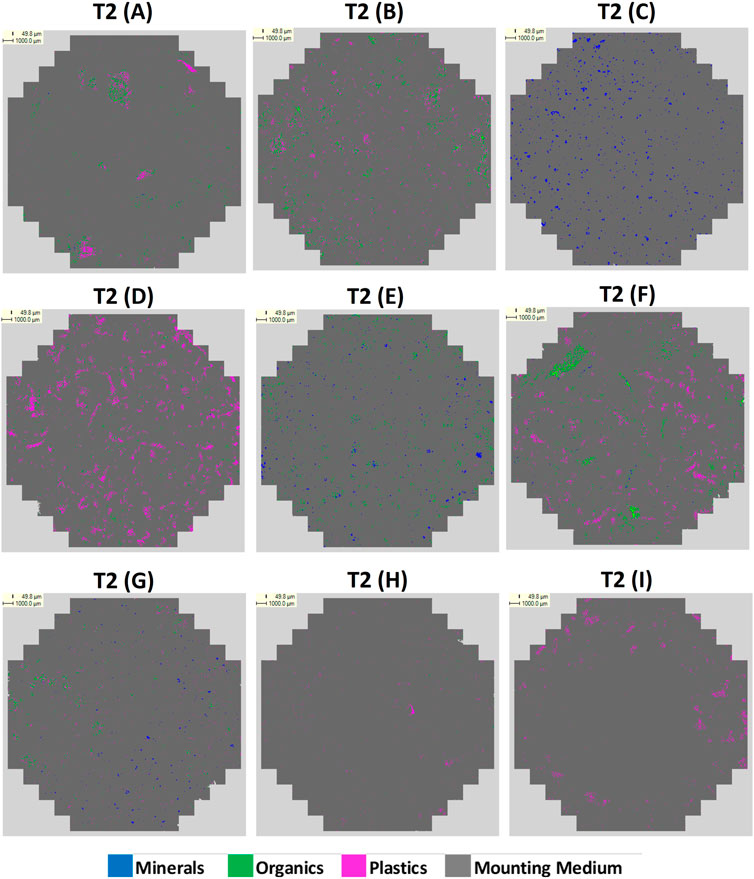
FIGURE 2. Particle map images for T2, samples A–I.
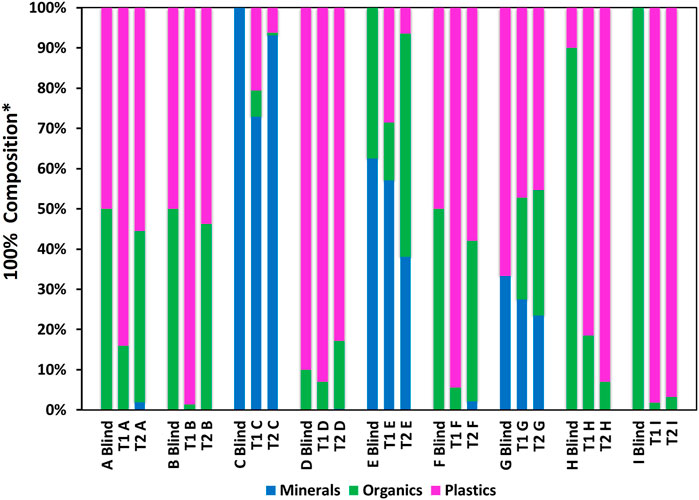
FIGURE 3. Composition comparison of A–I for T1 and T2. *% Mass composition of samples (A–I Blind), compared to % area coverage in particle map images (100% normalised).
Discussion
This study was an attempt to create an AM workflow for the rapid screening of microplastics using QEMSCAN® by applying a new sample preparation and analytical methodology. As can be seen in in Figure 3, the technique shows variable success in identifying samples’ compositions. In general, mineral content within C, E and G was fairly well identified in both T1 and T2. In C, where mineral comprised 100% mass of the sample, T1 recorded 72.9% coverage (normalised) as mineral, incorrectly assigning 27.1% to organics and plastics. T2 improved on this, assigning 93.1% as mineral, however, T1 returned a more accurate result for mineral content in E and G. A factor that could impact on this is poor grinding of the mounting medium, resulting in poor electron and X-ray take-off angles that may have favored lighter elements (e.g., C and O can both be present within minerals, and O is present in the final mounting medium composition).
The most significant difficulty is in differentiating between plastic and organic matter. T1 significantly over-classified plastic in A, B, F and H, mis-assigning 34.1%, 48.7%, 44.5% and 71.5% organic material respectively, and for E, which contained no plastic, identified 28.6% plastic. T2 improved on the results for A, B and F drastically, recording plastics coverage to within 5.5%, 3.8% and 7.9% of the % mass, respectively. Although T2 still detected plastic in E, it reduced to 6.4% coverage. For T1, the most accurate result was for D, for which only 3.0% organic material was mis-assigned as plastic. This was slightly better than for T2 in which plastic was under reported, with 7.2% coverage mis-assigned as organic and mineral. Interestingly, T1 and T2 gave similar results for G, both under reporting plastic and minerals and assigning 25.3% and 31.2% coverage as organics, respectively, despite the sample not containing organics. Results for H, and I were not good in either test. Plastic was over assigned by 71.5% in I and 98.2% in H for T1, and 83.0% in I, and 96.8% in H. Organics were significantly under reported in I for both tests. Overall however, this investigation has demonstrated that moderate alterations to the methodology, including the application of a revised SIP, and increasing the EDS acquisition count rate to 1000, has largely provided relatively improved, if still imperfect identification of plastic and organic matter in T2.
The poor classification for materials is most likely related to the inherent difficulty in distinguishing plastics and organics using this type of SEM method. The Crystacal mounting medium also presents an issue in that it is not ideal for forming a perfectly polished surface finish, potentially resulting in the misleading electron and X-ray take-off angles. Additionally, since it retains some porosity on preparation of the blocks, this may exacerbate the samples’ susceptibilities to cross-contamination during the grinding stage. Overall, the Crystacal used here is not optimal for the purpose of mounting the samples and must be further addressed to improve the technique.
Crystacal was selected primarily for its chemical distinction from plastic, i.e., carbon-free, and for its greater density than that of most plastics used here. It proves a moderately effective binder to mount macro- and microplastic particles. The blocks were ground to a 15 μm smooth surface finish, however, air bubbles formed within the block or plucking of solid material from the surface can result in regions being out-of-focus. The Crystacal has a particle size of <60 μm (85% <32 μm) (Formula, 2015). Below the 32 μm range is comparable to the smaller dimensions of microplastics of interest that can be imaged by μ-FTIR (Yang et al., 2021), and lies in the lower range of the dimensions of natural materials such as silt, sawdust, coal and clay (Engineering ToolBox, 2005). Given that some proportion of the Crystacal particles can be larger than some of the sample particles themselves, it is desirable to use a material of consistently smaller particle size to fully penetrate and bind a heterogeneous environmental material.
Additional prototype samples have been prepared and tested outside of this study, and zinc phosphate, a common dental cement, has proven an effective mounting material both in terms of its hardness, lower porosity and amenability to grinding and polishing. Zinc phosphate is also chemically distinct from plastic and natural organics and may also possess favorable BSE density properties that would enable further refinement of the method by re-incorporating RGB backscatter cutoff values, (i.e., 0–255 RGB). Although zinc phosphate would introduce phosphorous—present in natural organic matter and potentially complicating discrimination of these phases—the likely benefit in better identifying plastic may nonetheless be achieved. If the maximum RGB brightness of plastic and organic material could be determined from standards acquired under optimal preparation and operating conditions, it may be possible to establish a threshold, such as 40–255 RGB, where any particles above, say, 40 RGB are ignored for the purposes of X-ray data acquisition, if the RGB brightness of plastic and organic were lower than this. This could exclude the mounting medium from analysis, together with any other particles not of interest, such as minerals, provided the mounting medium also had an RGB brightness greater than 40 RGB. This would enable a faster analysis time per sample as less X-ray data would be acquired.
While developing the methodology for the QEMSCAN® analysis and SIP, additional tests were attempted where rather than setting the backscatter cutoff to zero and measuring everything in the sample regardless of RGB brightness, a higher backscatter cutoff was applied. Unfortunately however, it wasn’t possible to utilise this in the current study, as preliminary tests showed issues of plastic particles being affected by sample charging which increased their brightness to a level comparable to denser materials, so clearly erroneous. To prevent this, a lower accelerating voltage could theoretically be used, however the current system is limited as it does not allow operation of QEMSCAN® at less than 15 keV, presenting an unavoidable limitation in the setup. Indeed, the SIP editor has no option to select an accelerating voltage less than 15 keV when creating SIP entries—attempting to run analyses at 10 keV or less results in warnings that data would be inaccurate due to the hardware and beam voltage configuration of the system causing the software Spectral Analysis Engine to be unavailable. Testing was also undertaken in advance of the study comparing SIP performance using both a relative elemental concentration methodology, versus an elemental peak intensity methodology, with the latter being found to be more successful in producing a SIP with fewer overlapping organic/plastic entries. For this reason, the peak intensity method was used for creation of the SIP.
The primary elements of interest in the detection of plastics and organics in general are C and O, and these have respective Kα1 spectral emission lines of 277 eV and 525 eV, respectively. In theory, their detection in EDS could be obtained with an accelerating voltage as low as 1,050 eV (Thompson, 2000). The QEMSCAN® system used in this study has been in operation since 2009, and the software is now dated. Newer automated mineralogical systems enable much more flexibility in terms of operation and the method of EDS spectrum-matching. A route to progress in this method, therefore, is likely to lie in the use of such systems, applying accelerating voltages between 1–10 keV, and comparing the results acquired using high-vacuum, low-vacuum and environmental SEM modes of operation. A further challenge encountered during this study is the extremely time-consuming method of SIP creation on traditional QEMSCAN® systems—another area where newer automated mineralogical systems have made improvements.
Another important point to consider in this experiment is that here we compare % mass composition of the samples to % area coverage in the particle maps. In the SIPs, compiled by collecting QEMSCAN® data on standard plastics and organic materials, the density of each reference is entered as equal to that of carbon. Recalculation of the data collected on A–I, based on the correct densities, would provide a more accurate measurement and comparison of the samples’ compositions. As indicated in Supplementary Table S5, the plastics featured in the samples have a range of densities between 0.92 g/cm3 for LDPE to 1.19 g/cm3 for ABS + 20GF. For samples with comparable high carbon content, information such as density may be exploited for better differentiation. However, for this study, correctly utilising this data would also require consideration of elemental deportment within particles identified as being plastic and organic. The peak intensity method of analysis used here doesn’t enable this feature of QEMSCAN® post acquisition data manipulation, which is confined to the relative concentration method of SIP building. Given the difficulties encountered when attempting to build a SIP based on relative concentrations, here again, utilisation of a different, and likely more modern AM system would enable the method to be progressed further.
This study was an attempt to develop an AM workflow to screen for microplastics in environmental samples using QEMSCAN® through the application of a new sample preparation and analytical methodology. The results are not presented as a concluded study since, as is apparent, many challenges remain in the differentiation between natural and synthetic carbon-based materials. However, these obstacles are not necessarily insurmountable. A greater level of refinement may be achievable, be this through a combination of using an alternative mounting medium; a substitute coating material; the use of different AM systems and better-optimised SEM set-up conditions; and an improved polymer SIP methodology.
Ultimately the results show that it is possible to adapt QEMSCAN® to provide a first assessment of microplastic content in a heterogeneous environmental-type sample. The methodology is rapid, cost-effective and is a non-destructive process, enabling further imaging analysis of the prepared sample, and it may even be adapted for application in the field. This not only underlines how uniquely valuable and diverse a field AM is, but that it could become a true asset in the monitoring and eventual control of microplastic pollution.
Data availability statement
The original contributions presented in the study are included in the article/Supplementary Material, further inquiries can be directed to the corresponding author.
Author contributions
GHR, ALM and DPG contributed to conceptualization of method, GHR and LBH contributed to conceptualization of experiment, GHR and ALM contributed to sample preparation methodology development, LBH contributed to sample preparation, GHR contributed to experimental development, GHR contributed to data acquisition, GHR and LBH contributed to data analysis and manuscript preparation.
Funding
This research is funded by CGG.
Conflict of interest
Authors GHR, LBH, ALM, and DPG are employed by CGG. CGG has a pending patent on a new methodology for the preparation, detection and analysis of synthetic organic polymers including microplastics using automated mineralogy techniques, as described in this paper.
The authors declare that there are no other commercial or financial relationships that could be construed as a potential conflict of interest.
Publisher’s note
All claims expressed in this article are solely those of the authors and do not necessarily represent those of their affiliated organizations, or those of the publisher, the editors and the reviewers. Any product that may be evaluated in this article, or claim that may be made by its manufacturer, is not guaranteed or endorsed by the publisher.
Supplementary material
The Supplementary Material for this article can be found online at: https://www.frontiersin.org/articles/10.3389/feart.2022.915155/full#supplementary-material
References
Abbasi, S., Keshavarzi, B., Moore, F., Turner, A., Kelly, F. J., Dominguez, A. O., et al. (2019). Distribution and potential health impacts of microplastics and microrubbers in air and street dusts from Asaluyeh County, Iran. Environ. Pollut. 244, 153–164. doi:10.1016/j.envpol.2018.10.039
Abbasi, S., Soltani, N., Keshavarzi, B., Moore, F., Turner, A., and Hassanaghaei, M. (2018). Microplastics in different tissues of fish and prawn from the Musa Estuary Persian Gulf. Chemosphere 205, 80–87. doi:10.1016/j.chemosphere.2018.04.076
Cauwenberghe, L. V., Vanreusel, A., Mees, J., and Janssen, C. R. (2013). Microplastic pollution in deep-sea sediments. Environ. Pollut. 182, 495–499. doi:10.1016/j.envpol.2013.08.013
Chubarenko, I., Bagaev, A., Zobkov, M., and Esiukova, E. (2016). On some physical and dynamical properties of microplastic particles in marine environment. Mar. Pollut. Bull. 108 (1), 105–112. doi:10.1016/j.marpolbul.2016.04.048
Cole, M., Webb, H., Lindeque, P. K., Fileman, E. S., Halsband, C., and Galloway, T. S. (2014). Isolation of microplastics in biota-rich seawater samples and marine organisms. Sci. Rep. 4 (1), 4528. doi:10.1038/srep04528
Coppock, R. L., Cole, M., Lindeque, P. K., Queiros, A. M., and Galloway, T. S. (2017). A small-scale, portable method for extracting microplastics from marine sediments. Environ. Pollut. 230, 829–837. doi:10.1016/j.envpol.2017.07.017
Corradini, F., Meza, P., Eguiluz, R., Casado, F., Huerta-Lwanga, E., and Geissen, V. (2019). Evidence of microplastic accumulation in agricultural soils from sewage sludge disposal. Sci. Total Environ. 671, 411–420. doi:10.1016/j.scitotenv.2019.03.368
Cowger, W., Gray, A., Christiansen, S. H., DeFrond, H., Deshpande, A. D., Hemabessiere, L., et al. (2020). Critical review of processing and classification techniques for images and spectra in microplastic research. Appl. Spectrosc. 74 (9), 989–1010. doi:10.1177/0003702820929064
Dehaut, A., Cassone, A. L., Frere, L., Hermabessiere, L., Himber, C., Rinnert, E., et al. (2016). Microplastics in seafood: Benchmark protocol for their extraction and characterization. Environ. Pollut. 215, 223–233. doi:10.1016/j.envpol.2016.05.018
Doyle, M. J., Watson, W., Bowlin, N. M., and Sheavly, S. B. (2011). Plastic particles in coastal pelagic ecosystems of the Northeast Pacific ocean. Mar. Environ. Res. 71 (1), 41–52. doi:10.1016/j.marenvres.010.10.001
Elmes, M. (2021). “The characterisation of airborne particulate matter by automated mineralogy: The potential of the mineral liberation analyser for the monitoring of mine-derived emissions,” in School of Earth and environmental Sciences (Brisbane, Australia: University of Queensland).
Engineering ToolBox (2005). Particle size. Available at: https://www.engineeringtoolbox.com/particle-sizes-d_934.html (Accessed Jan 21, 2022).
Felismino, M. E. L., Helm, P. A., and Rochman, C. M. (2021). Microplastic and other anthropogenic microparticles inwater and sediments of Lake Simcoe. J. Gt. Lakes. Res. 47 (1), 180–189. doi:10.1016/j.jglr.2020.10.007
Formula, S.-G. (2015). CRYSTACAL R arts & decoration / interior design. Available at: https://www.mbfgfiles.co.uk/datasheets/crystacal_r_tech.pdf.
Guhl, A. C., Greb, V. G., Schulz, B., and Bertau, M. (2020). An improved evaluation strategy for ash analysis using scanning electron microscope automated mineralogy. Minerals 10 (5), 484. doi:10.3390/min10050484
Hidalgo-Ruz, V., Gutow, L., Thompson, R. C., and Thiel, M. (2012). Microplastics in the marine environment: A review of the methods used for identification and quantification. Environ. Sci. Technol. 46 (6), 3060–3075. doi:10.1021/es2031505
Jaafar, N., Musa, S. M., Azfaralariff, A., Mohamed, M., Yusoff, A. H., and Lazim, A. M. (2020). Improving theefficiency of post-digestion method in extracting microplastics from gastrointestinal tract and gills of fish. Chemosphere 260, 127649. doi:10.1016/j.chemosphere.2020.127649
Kaile, N., Lindivat, M., Elio, J., Thuestad, G., Crowley, Q. G., and Hoell, I. A. (2020). Preliminary results from detection of microplastics in liquid samples using flow cytometry. Front. Mar. Sci. 7 (856). doi:10.3389/fmars.2020.552688
Klein, S., Worch, E., and Knepper, T. P. (2015). Occurrence and spatial distribution of microplastics in river shore sediments of the rhine-main area in Germany. Environ. Sci. Technol. 49 (10), 6070–6076. doi:10.1021/acs.est.5b00492
Matsuoka, K., Rosyadi, E., and Tomita, A. (2002). Mode of occurrence of calcium in various coals. Fuel 81 (11), 1433–1438. doi:10.1016/s0016-2361(02)00062-5
Lechthaler, S., Hildebrandt, L., Stauch, G., and Schuttrumpf, H. (2020). Canola oil extraction in conjunction with a plastic free separation unit optimises microplastics monitoring in water and sediment. Anal. Methods 12 (42), 5128–5139. doi:10.1039/d0ay01574a
Li, L., Luo, Y., Li, R., Zhou, Q., Peijnenburg, W. J. G. M., Yin, N., et al. (2020). Effective uptake of submicrometre plastics by crop plants via a crack-entry mode. Nat. Sustain. 3 (11), 929–937. doi:10.1038/s41893-020-0567-9
Ly, C. V. (2018). Advanced cuttings analysis to predict geomechanical properties, in SPE/EAGE Workshop: The Future of Geomechanics in Brown Fields and Unconventionals, Abu Dhabi, UAE, 2–3 May 2018 EAGE.
Maes, T., Jessop, R., Wellner, N., Haupt, K., and Mayes, A. G. (2017). A rapid-screening approach to detect and quantify microplastics based on fluorescent tagging with Nile Red. Sci. Rep. 7 (1), 44501–44510. doi:10.1038/srep44501
Mani, T., Frehland, S., Kalberer, A., and Burkhardt-Holm, P. (2019). Using castor oil to separate microplastics from four different environmental matrices. Anal. Methods 11 (13), 1788–1794. doi:10.1039/c8ay02559b
Meng, Y., Kelly, F. J., and Wright, S. L. (2020). Advances and challenges of microplastic pollution in freshwater ecosystems: A UK perspective. Environ. Pollut. 256, 113445. doi:10.1016/j.envpol.2019.113445
O’Brien, G., Gu, Y., Adair, B., and Firth, B. (2011). The use of optical reflected light and SEM imaging systems to provide quantitative coal characterisation. Miner. Eng. 24 (12), 1299–1304. doi:10.1016/j.mineng.2011.04.024
Pirrie, D., Power, M. R., Rollinson, G. K., Wiltshire, P. E. J., Newberry, J., and Campbell, H. E. (2009). “Automated SEMEDS (QEMSCAN®) mineral analysis in forensic soil investigations: Testing instrumental reproducibility,” in Criminal and environmental soil forensics. Editors K. Ritz, L. Dawson, and D. Miller (Dordrecht, Netherlands: Springer), 411–430.
Rahfeld, A., and Gutzmer, J. (2017). MLA-based detection of organic matter with iodized epoxy resin—an alternative to carnauba. J. Minerals Mater. Charact. Eng. 5 (4), 198–208. doi:10.4236/jmmce.2017.54017
Sajjad, A., Soltani, N., Keshavarzi, B., Moore, F., Turner, A., and Hassanaghaei, M. (2018). Microplastics in different tissues of fish and prawn from the Musa Estuary, Persian Gulf. Chemosphere 205, 80–87. doi:10.1016/j.chemosphere.2018.04.076
Scopetani, C., Chelazzi, D., Mikola, J., Leinio, V., Heikkinen, R., Cincinelli, A., et al. (2020). Olive oil-based method for the extraction, quantification and identification of microplastics in soil and compost samples. Sci. Total Environ. 733, 139338. doi:10.1016/j.scitotenv.2020.139338
Tagg, A., Harrison, J. P., Ju-Nam, Y., Sapp, M., Bradley, E. L., Sinclair, C. J., et al. (2017). Fenton's reagent for the rapid and efficient isolation of microplastics from wastewater. Chem. Commun. 53 (2), 372–375. doi:10.1039/c6cc08798a
Tamminga, M., Hengstmann, E., and Fischer, E. K. (2017). Nile red staining as a subsidiary method for microplastic quantification: A comparison of three solvents and factors influencing application reliability. J. Earth Sci. Environ. Stud. 2, 165–172. doi:10.25177/JESES.2.2.1
Thompson, A. (2000). Electron binding energies in electron volts. Available at: https://xdb.lbl.gov/Section1/Periodic_Table/O_Web_data.htm (Accessed April 7, 2022).
Tonzetic, I., Butcher, A. R., Cropp, A. F., and Pudmenzky, C. (2006). Automated SEM analysis (measurement & characterisation) of dust using QEMSCAN. in 2nd Aerosol Workshop. Brisbane. July 5, 2006.
Tuhý, M., Hrstka, T., and Ettler, V. (2020). Automated mineralogy for quantification and partitioning of metal(loid)s in particulates from mining/smelting-polluted soils. Environ. Pollut. 266, 115118. doi:10.1016/j.envpol.2020.115118
Vanderbruggen, A., Gugala, E., Blannin, R., Bachmann, K., Serna-Guerrero, R., and Rudolph, M. (2021). Automated mineralogy as a novel approach for the compositional and textural characterization of spent lithium-ion batteries. Miner. Eng. 169, 106924. doi:10.1016/j.mineng.2021.106924
Vaughan, A. (2022). Countries agree to end plastic pollution in ambitious global treaty. Available at: https://www.newscientist.com/article/2310115-countries-agree-to-end-plastic-pollution-in-ambitious-global-treaty/ (Accessed March 24, 2022).
Wenya, L., Su, L., Craig, N. J., Du, F., Wu, C., and Shi, H. (2019). Comparison of microplastic pollution in different water bodies from urban creeks to coastal waters. Environ. Pollut. 246, 174–182. doi:10.1016/j.envpol.2018.11.081
Williamson, B. J., Rollinson, G., and Pirrie, D. (2013). Automated mineralogical analysis of PM10: New parameters for assessing PM toxicity. Environ. Sci. Technol. 47 (11), 5570–5577. doi:10.1021/es305025e
Yang, L., Zhang, Y., Kang, S., Wang, Z., and Wu, C. (2021). Microplastics in soil: A review on methods, occurrence, sources, and potential risk. Sci. Total Environ. 780, 146546. doi:10.1016/j.scitotenv.2021.146546
Keywords: microplastic, QEMSCAN®, sediment screening, mounting medium, species identification protocol, EDS, automated mineralogy, SEM
Citation: Rogers GH, Hamdy LB, McGarry AL and Gold DP (2022) Microplastic rapid screening method development using automated mineralogy. Front. Earth Sci. 10:915155. doi: 10.3389/feart.2022.915155
Received: 07 April 2022; Accepted: 01 September 2022;
Published: 21 September 2022.
Edited by:
Iris Buisman, University of Cambridge, United KingdomReviewed by:
Takao Ueda, National Institute of Advanced Industrial Science and Technology (AIST), JapanLuciana Dini, Sapienza University of Rome, Italy
Miloš Miler, Geological Survey of Slovenia, Slovenia
Copyright © 2022 Rogers, Hamdy, McGarry and Gold. This is an open-access article distributed under the terms of the Creative Commons Attribution License (CC BY). The use, distribution or reproduction in other forums is permitted, provided the original author(s) and the copyright owner(s) are credited and that the original publication in this journal is cited, in accordance with accepted academic practice. No use, distribution or reproduction is permitted which does not comply with these terms.
*Correspondence: Gareth H. Rogers, R2FyZXRoLnJvZ2Vyc0BjZ2cuY29t