 Luuk van Agtmaal
 Ylona van Dinther
 Ernst Willingshofer
 Liviu Matenco
- 1Department of Earth Sciences, Utrecht University, Utrecht, Netherlands
- 2Department of Earth Sciences, Institute of Geophysics, Swiss Federal Institute of Technology (ETH Zurich), Zurich, Switzerland
When continents collide, the arrival of positively buoyant continental crust slows down subduction. This collision often leads to the detachment of earlier subducted oceanic lithosphere, which changes the subsequent dynamics of the orogenic system. Recent studies of continental collision infer that the remaining slab may drive convergence through slab roll-back even after detachment. Here we use two-dimensional visco-elasto-plastic thermo-mechanical models to explore the conditions for post-collisional slab steepening versus shallowing by quantifying the dynamics of continental collision for a wide range of parameters. We monitor the evolution of horizontal mantle drag beneath the overriding plate and vertical slab pull to show that these forces have similar magnitudes and interact continuously with each other. We do not observe slab rollback or steepening after slab detachment within our investigated parameter space. Instead, we observe a two-stage elastic and viscous slab rebound process lasting tens of millions of years, which is associated with slab unbending and eduction that together generate orogenic widening and trench shift towards the foreland. Our parametric studies show that the initial length of the oceanic plate and the stratified lithospheric rheology exert a key control on the orogenic evolution. When correlated with previous studies our results suggest that post-detachment slab rollback may only be possible when minor amounts of continental crust subduct. Among the wide variety of natural scenarios, our modelling applies best to the evolution of the Central European Alps. Furthermore, the mantle drag force may play a more important role in continental dynamics than previously thought. Finally, our study illustrates that dynamic analysis is a useful quantitative framework that also intuitively explains observed model kinematics.
1 Introduction
1.1 Background
Zones of continental collision are impressive agents of plate tectonics on Earth (Dewey and Bird, 1970; Doglioni et al., 2007; Jolivet et al., 2018). Understanding the formation, evolution and dynamics of collisional orogens is important, for instance because they are often the only record of the subduction history (e.g. Celaˆl Şengör, 1990). In a societal context, a better understanding of the processes involved in continental collision allows for a better assessment of natural hazards, including those associated with seismicity (Hubbard et al., 2016; Dal Zilio et al., 2018; Michel et al., 2021).
Based on a wealth of geological and geophysical data from natural examples, many processes and parameters involved in continental collision have been studied through both analogue and numerical modelling. For example, the degree of rheological coupling between crust and mantle influences the geometry and strain partitioning within collisional orogens (Ellis, 1996; Royden, 1996; Brun, 2002; Erdős et al., 2021), while the lateral decoupling across the plate interface determines where active deformation occurs (Faccenda et al., 2009; Willingshofer and Sokoutis, 2009; Luth et al., 2010; Willingshofer et al., 2013). Lateral contrasts in crustal strength at the onset of collision also influence orogen geometry, strain partitioning and deformation style (Liao and Gerya, 2017; Vogt et al., 2017; Vogt et al., 2018). However, these studies often use constant kinematic boundary conditions which might complicate explaining the kinematics of the system. For this reason, the dynamics (i.e., relative importance of driving forces) of collisional systems are less understood. Although the dynamics of subduction and slab detachment in a collisional context have been addressed by a large number of researchers (e.g. Baumann et al., 2010; Duretz et al., 2012; Duretz and Gerya, 2013; Schellart and Moresi, 2013), few studies quantify internal forces in their models (Dal Zilio et al., 2020; Candioti et al., 2021; Suchoy et al., 2021).
1.2 Slab rollback orogeny model and the Central Alps
Building on the inspirational work of Argand (1916), the Central Alps are traditionally considered as a classical collisional orogen where plate convergence is accommodated by the formation of a double-vergent orogen, in response to “head on” collision of the European downgoing plate with the Adriatic overriding plate (e.g. Schmid et al., 1996). In contrast, orogens that are controlled by subduction processes and associated slab dynamics and mantle flow display one single vergence, as well documented in the Mediterranean realm (e.g. Jolivet et al., 2003; Matenco et al., 2010; Faccenna et al., 2014; Van Hinsbergen et al., 2020; Király et al., 2021) and in the Andes, the classic subduction orogen (e.g. Barazangi and Isacks, 1979). Recently, Schlunegger and Kissling (2015) and Kissling and Schlunegger (2018) developed a new conceptual model for orogenesis in the Central Alps, referred to as the “slab rollback orogeny model (SRO)”. The SRO model assigns a prominent role to the vertical pull of the European slab during collision.
In particular, the SRO model emphasises the role of vertical forces in continental collision by distinguishing between three distinct stages (Figure 1). First, negatively buoyant oceanic lithosphere subducts beneath a continental plate. As subduction progresses, the slab pull force builds up, driven by increasing volumes of cold oceanic lithosphere, whose density exceeds that of the hotter surrounding mantle. The second stage starts with the arrival of continental crust at the subduction zone (Figure 1B). As the positively buoyant continental crust subducts, the net slab pull force decreases, and consequently subduction slows down and may ultimately stop. This gives the slab time to interact with the surrounding asthenosphere, allowing intra-slab tensional stresses to build up. Eventually the slab detaches and sinks deeper into the mantle. Slab detachment marks the start of the final, third stage (Figure 1C). The SRO model proposes that after slab detachment the remaining slab still provides enough slab pull to drive convergence between the continental plates, as inferred for the Central Alps (Schlunegger and Kissling, 2015; Kissling and Schlunegger, 2018; Dal Zilio et al., 2020). This assumption is based on a number of observations in the Central Alps, primarily the isostatic disequilibrium between an exceptionally thick crustal root of ∼60 km and a local, low mean surface elevation in the order of 2 km (Kissling, 1993). In fact, the thick crust would require twice the observed mean surface topography (Schlunegger and Kissling, 2015).
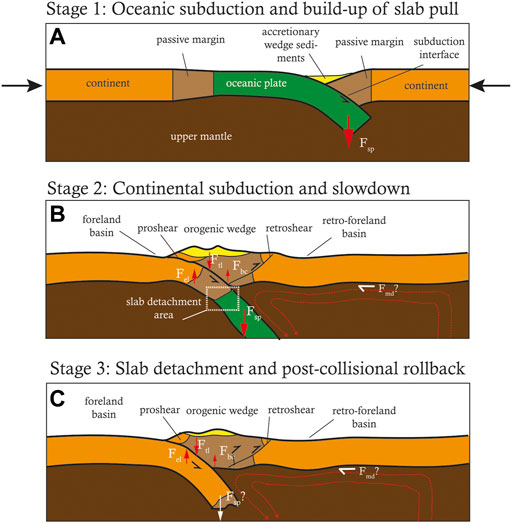
FIGURE 1. Conceptual illustration of the three stages of the slab rollback orogeny model, that is: (A) oceanic subduction, formation of an accretionary wedge. (B) Continental subduction, subduction slowdown ultimately leading to slab detachment. (C) Slab detachment followed by slab rebound, post-collisional slab rollback, and trench shift towards the foreland. General mantle flow patterns are drawn in red. Arrows are not to scale. Symbols: Fsp: slab pull, Fel: elastic bending resistance, Ftl: topographic gravitational loading, Fbc: buoyancy force of the light crustal root, Fmd: mantle drag beneath the overriding plate.
Key characteristics of the Central Alps further include (Schlunegger and Kissling, 2015; Kissling and Schlunegger, 2018) 1) indentation of Adriatic lower crust into the Central Alps orogenic wedge (Schmid et al., 1996), 2) a highly active retroshear in a double-vergent orogenic wedge, resulting in strong retrograde metamorphism, 3) subduction of Eurasian lower crust (and hence a deep Moho), 4) decoupling of the Eurasian upper crust from the lower crust, and 5) an orogenic wedge consisting mostly of upper crustal material. Tomographic images reveal a current position of the (continental) European slab at 100–250 km depth (Lippitsch et al., 2003; Mitterbauer et al., 2011; Sun et al., 2019; Paffrath et al., 2021). Furthermore, focal mechanism analysis shows that the retro-foreland basin of the Central Alps (i.e., the Po Basin) is under compression (Deichmann, 1992; Di Bucci and Angeloni, 2013; Singer et al., 2014). Finally, GPS measurements show that Adria (Africa) is still moving towards Europe at low rates of ∼ 2–5 mm/yr (Calais et al., 2002; D’Agostino et al., 2008; Métois et al., 2015), which is much less than the ∼7.9 mm/yr average advance rate for the Cenozoic as calculated from tectonic reconstructions (Dewey et al., 1989; Schmid et al., 1996; Handy et al., 2010). The subduction hinge is estimated to have retreated away from the Eurasian plate at ∼ 20 mm/yr in the Paleocene, and ∼10 mm/yr in the Eocene (Pfiffner, 2016).
1.3 Present work
Here we aim to assess the role and relative importance of vertical slab pull and horizontal mantle drag beneath the overriding plate. While slab pull may dominate in early stages, the question is whether the portion of a slab remaining after detachment is able to sustain convergence, or that mantle drag is an important driver of plate motions (Conrad and Lithgow-Bertelloni, 2002; Alvarez, 2010; Faccenna et al., 2013; Sternai et al., 2016; Jolivet et al., 2018). The post-collisional slab dynamics suggested by the SRO model remains not well understood, because the remaining slab is mostly continental and therefore positively buoyant. However, if some oceanic lithosphere is still attached, the net buoyancy might be enough to drive slab rollback or steepening. The idea is intriguing and requires more detailed investigation under a wide range of parameters. To analyse this problem, we run and analyse 2D thermomechanical visco-elasto-plastic lithospheric-scale numerical simulations of dynamic continental collision. We quantify the slab pull and mantle drag forces over time to assess the dynamics of continental collision in the context of the SRO model. The quantification method and accompanying post-processing scripts are described in Appendix A and available on GitHub. Our numerical simulations and the associated parametric studies target a number of critical variables and processes that are analysed in more details, such as the initial ocean length, Peierls creep, and lithospheric mantle friction.
2 Methods
2.1 Numerical methods
The simulation results were obtained using the widely used 2D geodynamic code I2ELVIS (Gerya and Yuen, 2007) with inertia activated, i.e. the seismo-thermo-mechanical version (van Dinther et al., 2013a; van Dinther et al., 2013b; van Dinther et al., 2014). This code solves the conservation of mass, momentum and energy (see Supplementary Material) on a fully staggered, Eulerian grid using a conservative finite difference scheme combined with a Lagrangian marker-in-cell technique (Gerya and Yuen, 2003). The equations are solved under assumption of flow in an incompressible medium and the extended Boussinesq approximation, i.e., only buoyancy-driven changes in density are taken into account, as are the energy contributions of adiabatic, shear, and latent heating (Christensen and Yuen, 1985; Gerya and Yuen, 2003). We refer to Gerya and Yuen (2007) for a more detailed description of the code.
2.2 Rheology
We assume that the deformation of different lithologies is governed by a visco-elasto-plastic rheology. At every time step and on each Lagrangian marker, time-dependent stress and density are calculated and interpolated to the Eulerian nodes (Gerya, 2019). The total (deviatoric) strain rate is composed of a viscous, an elastic and a plastic component:
The components are calculated according to (Gerya and Yuen, 2007)
Here ηeff indicates the effective viscosity (Eq. 8) and G represents the elastic shear modulus, which relates deviatoric stresses (σij′) to (deviatoric) strain rates (
The plastic yield strength is calculated following 2D Drucker-Prager plasticity and depends on cohesion C, static friction μ, the pore fluid pressure ratio Pf/Ps defined as fluid pressure Pf over solid pressure Ps, and pressure P or mean stress according to
Viscous deformation (effective viscosity ηeff) incorporates both diffusion and dislocation creep and is given by the harmonic average of both creep mechanisms
where the viscosities defined by different creep mechanisms are given by
Here, Ad is the pre-exponential factor, n is the stress exponent, and Ea and Va are the activation energy and volume, respectively, and R=8.314 J K−1 mol−1 is the universal gas constant. These parameters are experimentally determined and set for each lithology (Table 1). The threshold stress from diffusion to dislocation creep τtr is set to 30 kPa (Turcotte and Schubert, 2002), which ensures mainly dislocation creep is active. In the case of model peierls (Table 2), Peierls creep is added in series to the calculation of ηeff in (Eq. 8). This plastic deformation mechanism is active in olivine in the lithospheric mantle under high-pressure, low-temperature (HP/LT) conditions (Evans and Goetze, 1979; Katayama and Karato, 2008). It limits the plastic strength of the mantle lithosphere, and is given by
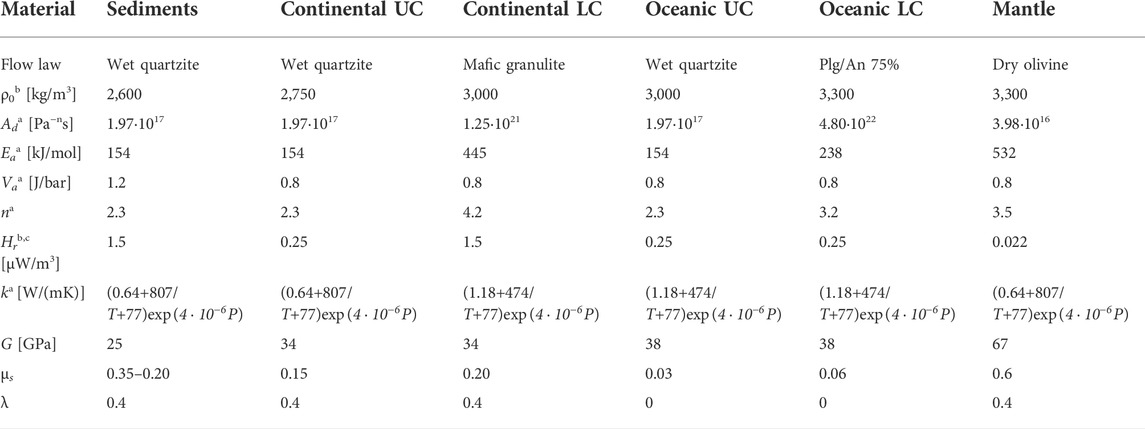
TABLE 1. Rheological parameters used for the reference model. All materials have an isobaric heat capacity Cp of 1000 J/(kg K), thermal expansion α=3⋅10–5 K−1 and isothermal compressibility β=10–5 MPa−1 a Ranalli, (1995);b Turcotte and Schubert, (2002);c Rudnick and Fountain, (1995).
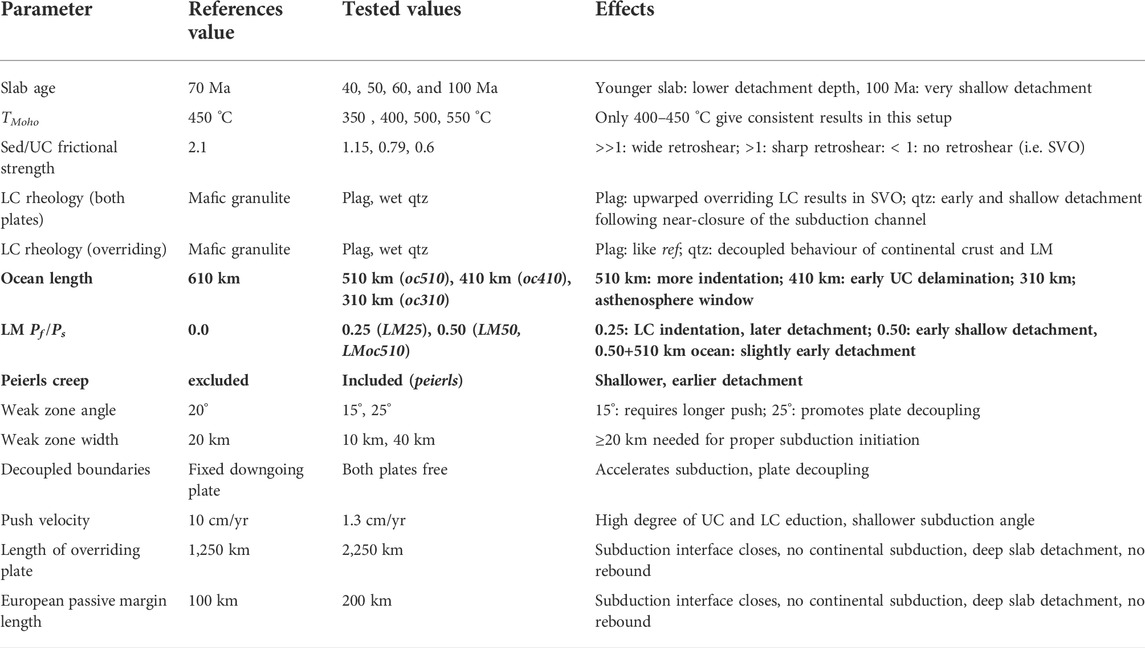
TABLE 2. Summary of all tested parameters and their effects with respect to the reference results. The parameters discussed in detail are written in bold. Abbreviations: SVO: single-vergent orogen, qtz: quartzite, sed/UC frictional strength: ratio between brittle strength of sediments over upper continental crust at 10 MPa, LC: lower crust, LM: lithospheric mantle.
The experimentally determined values for the material parameter APeierls and the maximum plastic strength σPeierls are 10−4.4 Pa−2s−1 and 9.1 GPa, respectively (Evans and Goetze, 1979). The exponents p and q are shape-and geometry-dependent parameters that are assumed to be 1 and 2 (Dal Zilio et al., 2020).
2.3 Model setup
The 2D numerical experiments were carried out in a 3,000 × 800 km2 domain, resolved using an irregular grid of 1785 × 509 nodes. The maximum horizontal resolution of 500 m is applied between 800 ≤ x < 1,500 km and a medium-resolution zone of 2 km grid spacing is present from 1,500 ≤ x < 1850 km. A 10 km grid spacing is defined in the leftmost (0 < x < 700 km) and rightmost (1900 < x < 3,000 km) domains of the model. The resolution changes gradually between these regions. In the vertical direction, the resolution varies smoothly from 500 m (0 ≤ y ≤ 100 km) via 1 km (103 ≤ y < 300 km) to 5 km (345 ≤ y ≤ 800 km). The temporal resolution in the thermomechanical models is 1 kyr. The side boundaries have free slip boundary conditions, while the lower boundary is open in a similar way as the modelling setups of for instance Faccenda et al. (2008) or Vogt et al. (2018).
The reference model consists of two continents separated by a 610 km long oceanic plate (Figure 2), similar to the setup of Dal Zilio et al. (2020). The continents are composed of 20 km of felsic upper crust and 15 km of strong, mafic granulite lower crust (Table 1). The oceanic crust consists of 2 km of basaltic upper crust and 8 km of gabbroic lower crust. A 20–22 km thick layer of low-density, low-viscosity, “sticky air” is present above the crust. The interface between air and crust is used to automatically calculate topography (Schmeling et al., 2008). Erosion and sedimentation are implemented using an instantaneous approach, i.e., material above a threshold level (10 km in our simulations) is converted into air, and water/air below 2 km depth is converted into layers of sediment. The continental geotherm initially has two linear segments, from 0°C at the surface to 450°C at the Moho, and on to 1,344°C at the lithosphere-asthenosphere boundary. Below this depth, temperature increases with an adiabatic gradient of 0.5°C/km. The oceanic lithosphere follows the temperature profile for a slab age of 70 Ma and a thermal diffusivity of 10−6 m2/s given in the half space cooling model (Turcotte and Schubert, 2002). The lateral boundaries of the model domain are insulating.
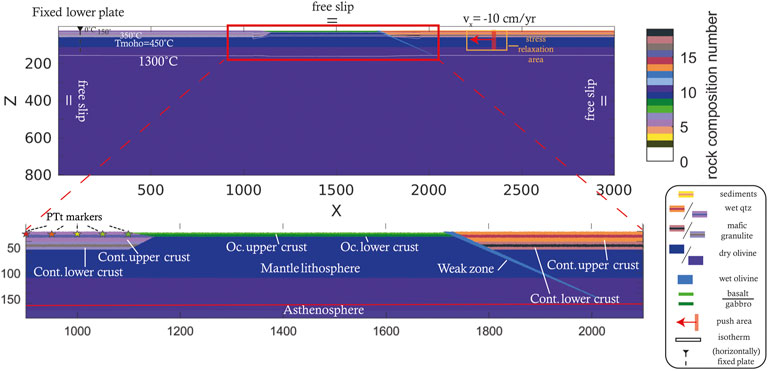
FIGURE 2. Illustration of the setup used in this study showing boundary conditions, lithological stratification and isotherms. Note that the length of the oceanic plate is varied in one of the parameter studies. Initial convergence of 10 cm/yr is applied in the red box around x = 2,300 km until 500 km of convergence has been accommodated. Stress changes are relaxed in the area indicated by the orange box around the push area to avoid artificial stresses. Finally, the initial position of five markers in the downgoing plate, used for pressure, temperature and time tracking are shown with stars.
To initiate subduction and convergence, a semi-dynamic approach (e.g. Duretz et al., 2011; van Dinther et al., 2013b; Dal Zilio et al., 2020) is applied. Such a method consists of an initial or kinematic stage in which convergence is prescribed as a boundary condition to initiate subduction. In the present study, the right continental plate is pushed toward the left at a rate of 10 cm/yr for the first 5 Myr, such that 500 km of convergence has been accommodated at the end of the initial stage (similar to e.g. Duretz et al., 2011). From this point onwards, the geodynamic system is solely driven by internal forces without externally applied kinematic boundary conditions. The high push velocity is justified, because sensitivity tests did not show major differences between 5 and 10 cm/yr. A run at 1.3 cm/yr showed similar model dynamics as well, although eduction (i.e., buoyancy-driven decoupling and flow of continental crust from the downgoing plate, Andersen et al., 1991) is more efficient (Table 2). The viscosity in the push area is increased, and stresses around it are relaxed, to minimise artificial deformation (Figure 2). Furthermore, a low viscosity zone is implemented at the right model boundary to allow the advancing plate to decouple from the lateral boundary. This low-viscosity boundary condition is not applied on the left side of the model box to simulate a fixed downgoing plate, e.g., mimicking a stable downgoing European plate (e.g. Dewey et al., 1989; Torsvik et al., 2012).
3 Results and analysis
3.1 Reference model
3.1.1 0–5 Myr stage 1: Kinematic stage
During this first stage (Figure 1A), most of the oceanic lithosphere subducts beneath the overriding plate (Figures 3A,B, Supplementary Movies S1, S2). Sediments that were deposited on the ocean floor during the simulation are scraped off and incorporated into a large accretionary wedge-type structure that developed by predominant foreland-directed thrust imbrication (Figures 3A,B). Furthermore, pop-down structures developed near the trench due to the basal friction between the wedge and the downgoing plate against the rapidly advancing overriding plate, which acts like a back-stop. The slab dip is initially constant, but increases rapidly from 33 to 58° between 4.5 and 5.0 Myr due to a stage of back-thrusting and thickening of the accretionary wedge, which accommodates part of the convergence velocity and decreases the subduction velocity (Supplementary Movies S1, S2). During this kinematic stage, the tracked upper crustal markers are steadily buried (i.e., along a prograde burial path) (Figure 4A).
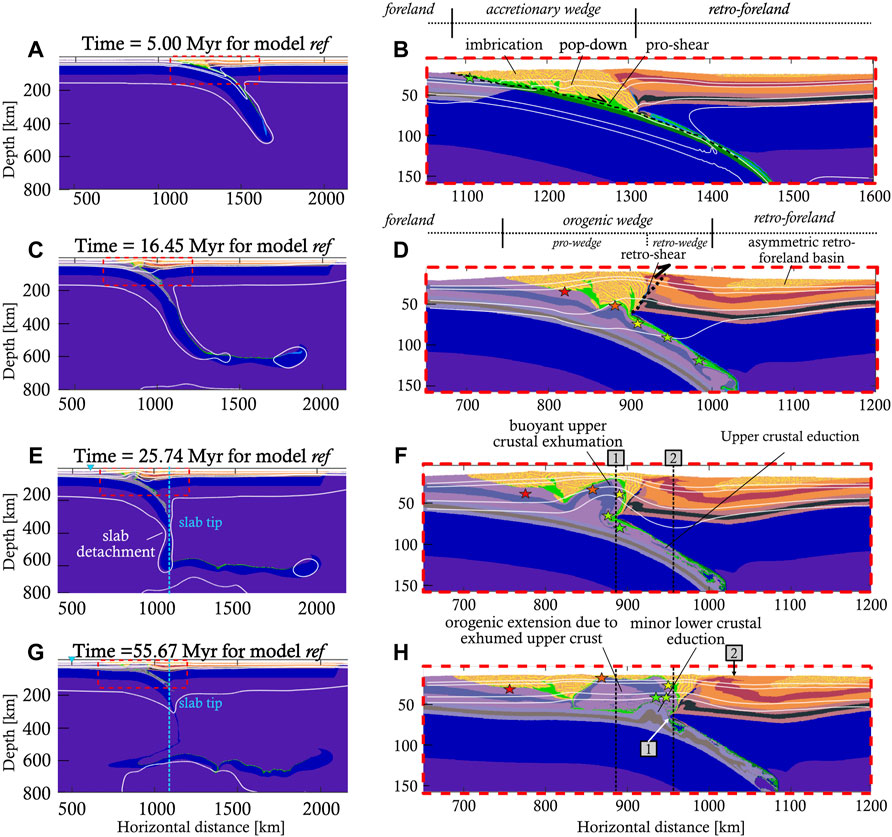
FIGURE 3. Four snapshots of the reference model at key stages of its development, showing rock composition and isotherms (100 C, 150 C, 350 C, 450 and 1300 C). In addition, PTt marker positions are shown in the same fashion as in Figure 2 (A,B) During the initial stage, imbricate thrusts develop, as well as pop-down structures. Prescribed oceanic subduction has just been switched off. A single-vergent orogen has developed. (C,D) After continental collision followed by a stage of trench shift towards the foreland, the orogen is now double-vergent. The retroshear and asymmetric retro-foreland basin are indicated. The first signs of upper crustal eduction are visible. (E,F) The oceanic slab has detached, resulting in slab rebound and unbending. The upper crust has almost fully educted from the subduction channel and is now exhuming, pushing the overlying material up and to the sides. [1] and [2] denote the plate boundary and the retro-wedge deformation front, respectively. The trench position is indicated with a blue triangle (G,H) The model has reached a quasi-steady state. The buoyant upper continental crust forms the core of the orogen. Some lower crust has started to exhume along the retroshear as well, but it is too dense to exhume further. No post-detachment slab rollback takes place, but the overriding plate has retreated by ∼60 km at depth [1] and ∼70 km at the surface [2].
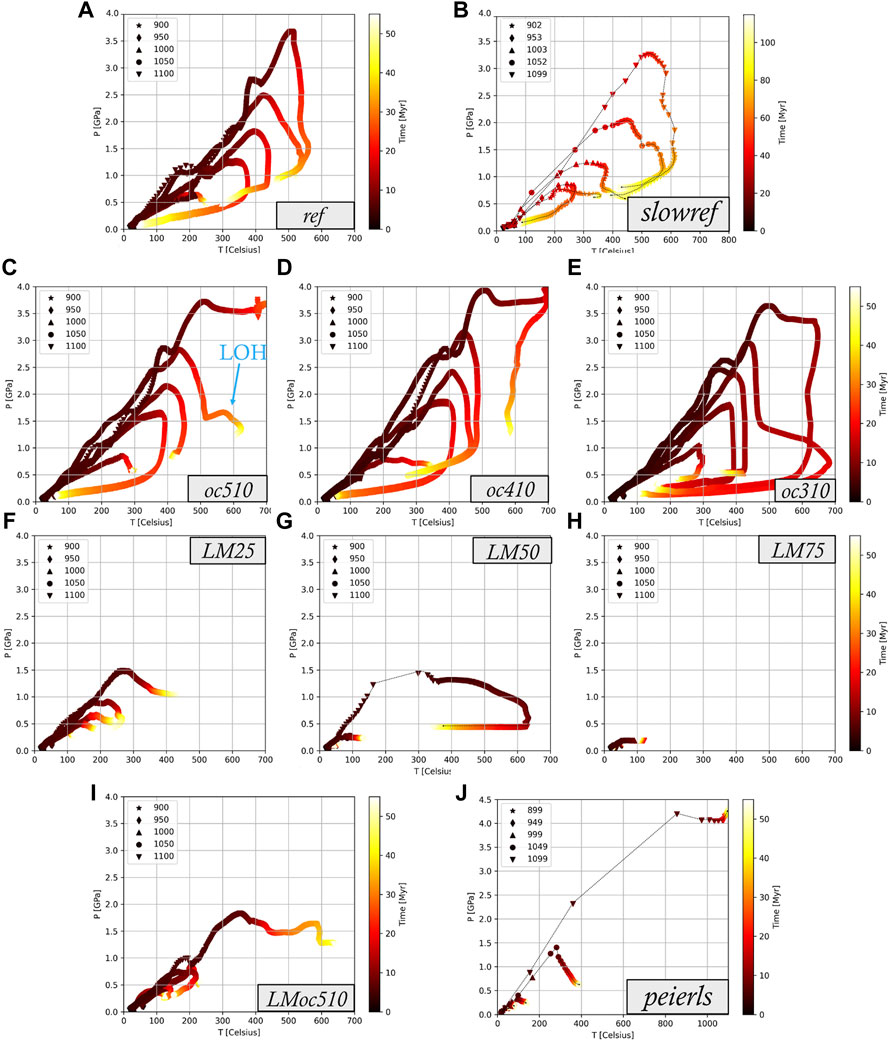
FIGURE 4. Pressure, Temperature, time (PTt) paths of models (A) ref, (B) slowref, (C) oc510, (D) oc410, (E) oc310, (F) LM25, (G) LM50, (H) LM75, (I) LMoc510, and (J) peierls (Table 2). The paths follow five markers initially located at positions x= 900–1,100 km buried >2 km deep in the continental upper crust (initial position in legend). Model oc510 shows a late orogenic heating (LOH). Models that show early and shallow slab detachment show an immature burial-exhumation cycle (LM50, LM75, peierls). PTt paths for models peierls and slowref were extracted after the model run while the others were continuously tracked. Also note the different temperature and pressure axes for model peierls and the different time axis for model slowref.
3.1.2 5–20 Myr stage 2: Collision and trench shift towards the foreland
During slab steepening, significant poloidal mantle flow is generated around the tip of the slab, initiating a counter-clockwise convection cell in the mantle wedge above the slab (Supplementary Figure S1A). Mantle is dragged down with the downgoing plate until flow rises beneath the overriding plate and moves back into the mantle wedge generating corner flow. The vertical gradient of horizontal velocity generates a strong traction beneath the overriding plate, dragging it along. This results in a significant trench-ward drag force beneath the overriding plate (positive mantle drag in Figure 6B). Therefore, the overriding plate advances rapidly as soon as the kinematic boundary condition is released at the end of the first stage. During this advance, the orogenic wedge is emplaced on the subducting continental plate (Figures 3A–D, see also Supplementary Movies S2). The frictional resistance across the pro-shear to this emplacement allows the development of a double-vergent orogenic wedge, characterised by a retroshear separating the pro-wedge from the retro-wedge (Figures 3C,D). In addition, the vertical gradient of horizontal displacement in the overriding plate results in an asymmetric retro-foreland basin. During the emplacement of the orogenic wedge, the slab pull passes its peak magnitude (in the order of −1.6*1014 N/m, Figure 6A). What follows is a period of slow slab area growth coeval with slab heating. This leads to a net weakening of slab pull (Figure 6A), because the decrease in density contrast due to slab heating plays a more important role than the slow increase in area during this period. As a consequence of slow subduction and trench retreat, the mantle drag force beneath the overriding plate slowly decreases as well (Figure 6B). Finally, heating of rocks inside the subduction channel allows the upper continental crust to educt (i.e., decouple and flow upwards) from the subducting, rheologically more heat resistant lower crust. This eduction of upper crust is clearly visible in the PTt path as an onset of retrograde marker motions, i.e., exhumation (Figure 4A).
3.1.3 20–25 Myr stage 3: Slab detachment
Around t ∼ 22.5 Myr, the mantle drag force beneath the overriding plate switches from towards the trench (i.e., positive) to away from the trench (i.e., negative) (Figure 6B). The overriding plate comes to a halt, before moving to the right from t ∼ 23 Myr onwards (Supplementary Movies S2). This is a result of the eduction of the upper crust of the downgoing plate in the subduction channel (Supplementary Figure S1B). The exhuming upper crust accumulates in the core of the orogen, uplifting the overlying wedge units. The orogen then becomes gravitationally unstable and starts to collapse. The previous stage of little active deformation concludes with the onset of gradual slab necking at t ∼ 22.5 Myr (i.e., coinciding with the switch of mantle drag direction). Around t ∼ 25 Myr, the oceanic slab segment detaches from the continental slab segment at a depth of ∼350 km (Figure 3E).
3.1.4 25–56 Myr: Post-detachment
An immediate response of the slab to the decreased slab pull is visible (Figures 5, Figure 6A, see also Supplementary Movies S1): the slab initially unbends relatively rapidly due to elastic rebound. Subsequently, slower viscous unbending is driven by the net positive buoyancy of the slab and continues for at least 30 Myr after detachment (Figures 3E,F, Figure 5, Figure 6A, Supplementary Movies S2). The buoyant rise of the slab squeezes the subduction channel, enhancing decoupling and buoyant flow of the upper crust from the subducting continent (Supplementary Movies S2). This process is often referred to as eduction (sensu Andersen et al., 1991). The educted continental crust is exhumed by shear reversal along the subduction channel and accumulates in the core of the orogen (Figures 3E–H). Some crustal material is still displaced along the retroshear (Figure 3F). The positively buoyant crustal material induces tensional stresses and extension in the central part of the orogenic wedge (Supplementary Figure S1B) above the exhumed crustal material by eduction, resulting in overall orogenic widening. This orogenic widening is associated with both trench retreat (i.e. the trench shifts towards the foreland) and overriding plate retreat, defined as a movement of the plate boundary (denoted by [1]), towards the hinterland (Figures 3E–H). Even though the elastic rebound of the previous stage uplifted the orogen to about 8 km peak elevation (3.4 km averaged from trench to edge of retro-foreland basin, Supplementary Figure S2B), the subsequent post-detachment orogenic widening flattens the peak topography to ∼4 km and the average topography to 2.9 km (Supplementary Figure S1B). Due to the onset of gradual eduction of continental lower crust, the slab pull force becomes negative again around t ∼ 450 Myr (Figure 6A), while the mantle drag experiences a broad, negative peak (Figure 6B) as asthenosphere replaces the educted lower crust. However, the slab pull is not strong enough to induce slab rollback. Instead, the slab remains stable while the overriding plate continues to retreat at rates decaying to <1 mm/yr at t ∼ 55 Myr. No slab rollback is observed, due to the weak slab pull that is countered by a mantle drag away from the trench (Supplementary Movies S1, Figures 3, Figure 6). Instead, the slab remains in a stable position while the trench shifts to the foreland by ∼100 km due to the orogenic widening (Figures 3E–H, Supplementary Figure S2B, Supplementary Movies S2).
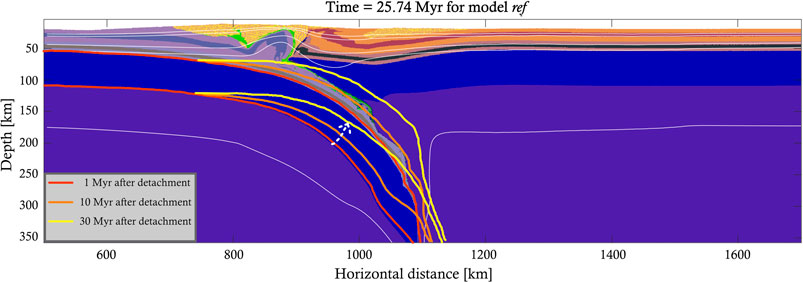
FIGURE 5. Illustration of the post-detachment slab rebound and unbending for the reference model. The slab contours at 1, 10 and 30 Myr after detachment are drawn in red, orange and yellow, respectively. The general slab motion is illustrated with a dashed white arrow.
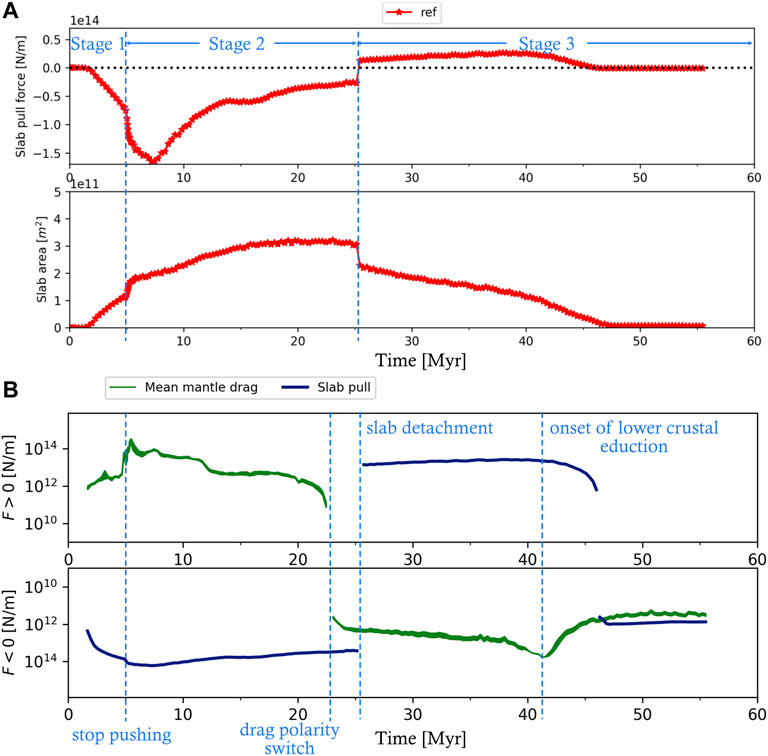
FIGURE 6. Temporal evolution of the most important forces in the model, calculated following the procedure outlined in Appendix A (A) Slab pull (top) and slab area (bottom). Peak slab pull is reached around t = 7.0 Myr, but peak slab area is reached right before slab detachment, which is indicated by a jump in both quantities. From 45 Myr onwards, slab pull is around 1012 N/m. (B) Evolution of the mean mantle drag force beneath the overriding plate. Slab pull is drawn for reference. The top panel displays the positive values, while the bottom panel depicts negative values. Positive values represent trenchward mantle drag and upward slab pull, and vice versa for the negative values. Note the log scale on the y axis.
3.2 Parameter studies
3.2.1 Ocean length
Oceanic plate length, like oceanic slab age, directly influences the amount of negatively buoyant material present in the subduction zone, and hence the slab pull magnitude. We ran three models with increasingly shorter oceanic plates compared to the 610 km in the reference model (510 km (model oc510), 410 km (model oc410) and 310 km (model oc310), Table 2).
The subduction and collision dynamics do not change drastically for model oc510 (Figure 7C). Especially stage 1 and 2 are very similar (Supplementary Movies S3, Figures 8A–D). Since continental material enters the subduction zone about 350 kyr earlier, the peak slab pull is reached earlier as well, yet its magnitude is similar (Figures 7A,C, Supplementary Figure S3, −1.45 * 1014 N/m compared to −1.6 * 1014 N/m). In addition, the retroshear forms earlier, facilitating more efficient displacement of crustal rocks from the lubricated subduction channel upwards. This exhumation process decouples part of the overriding upper crust from its corresponding lower crust. As a result, the overriding lower crust can indent the core of the orogen more deeply (Figures 8A–D, Supplementary Movies S3). Slab detachment occurs at t ∼ 24.5 Myr, very similar to the reference model. In the post-detachment stage, the same slab rebound and unbending process occurs as in the reference model. However, the lower crust of the downgoing plate does not start to educt in the final stage (Supplementary Movies S2 and Supplementary Figure S3). The final orogenic geometry resembles the reference model, including the surface topography. The orogen is ∼100 km wider leading to a trench shift towards the foreland of 140 km since detachment while the overriding plate moved towards the retro-foreland (Supplementary Figure S2A,B).
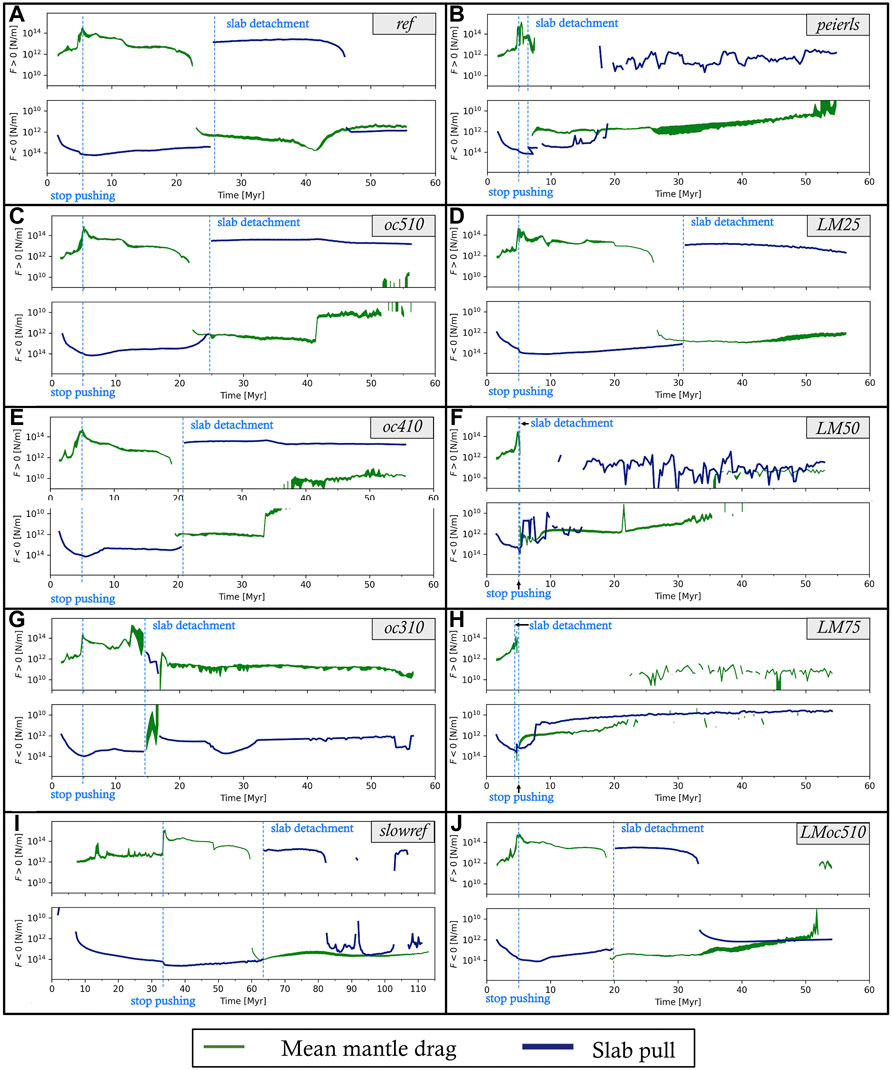
FIGURE 7. Force quantification figures for the reference model (A), the oceanic length (C,E,G) and lithospheric mantle friction (D,F,H,J) parameter studies, as well as the Peierls creep (B) and slow-collision parameter (I) studies. The moment of push release and that of slab detachment are indicated on each panel. See text for further information. Note the different time axis of model slowref.
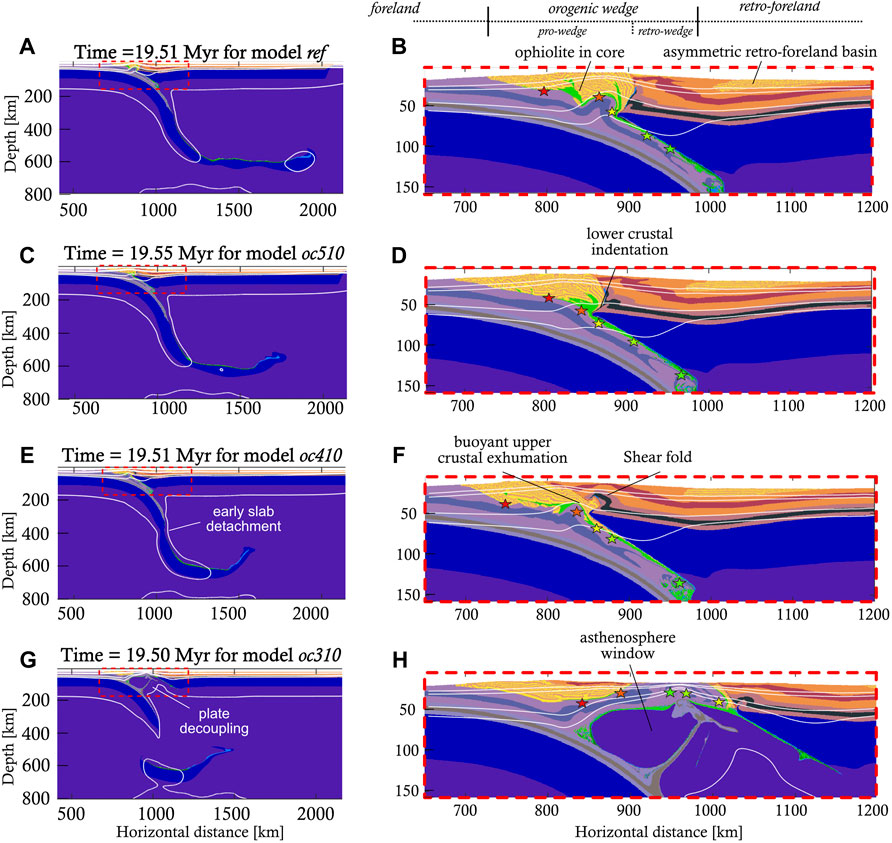
FIGURE 8. Intermediate results of the initial ocean length parameter study (Table 2), showing the differences already present at this stage. Rock composition and isotherms (100 C, 150 C, 350 C, 450 and 1300 C) are displayed and PTt markers are depicted with the usual stars. A 510 km ocean leads to more indentation of the orogen by the overriding lower crust and mantle lithosphere compared to the reference model which has a 610 km long ocean panels (C,D) compared to panels (A,B). A 410 km long ocean leads to earlier slab detachment and a shallower retro-foreland basin. Additionally, the tip of the overriding plate has been folded into an antiformal structure (E,F). When the ocean is even shorter, the plates quickly decouple (G,H).
In models oc410 and oc310) several significant differences in orogenic evolution arise. While kinematically stage 1 is similar to the reference model, the dynamic signature (i.e., force evolution) clearly shows lower and earlier achieved peak slab pull magnitude due to a shorter oceanic slab (Figures 7E,G, Supplementary Figure S3). For such short oceanic plates, convergence is still imposed in these models when the continents collide. This disturbs the dynamic signature, such that mantle drag cannot accelerate the overriding plate. Test runs showed that without continued pushing after 300 km, an initial ocean length of 310 km is not enough to sustain subduction, but 410 km is enough. Nonetheless, for short ocean lengths the accretionary wedge does not evolve into a double-vergent orogenic wedge, since no retroshear develops. There is significantly lower shear resistance at the subduction interface, because almost all the frictionally weak, lubricating oceanic crust (Table 1) subducts (Figures 8E–H). Therefore, the entire upper crustal layer decouples from the downgoing plate and educts, allowing the overriding plate to slide off the weak subduction interface. This happens most strongly in model oc310, where the plates decouple (Figures 8G,H) and slab pull stays negative for the whole simulation (Figure 7G). Despite this, the PTt paths of the tracked upper crustal markers are still remarkably similar to the reference model (Figures 4A,D,E).
In summary, very short (smaller than ∼400 km) oceanic plates tend to produce single-vergent orogens in this setting, while longer plate lengths are more likely to produce double-vergent orogens.
3.2.2 Peierls creep
The activation of Peierls creep weakens the mantle lithosphere of especially the downgoing plate at depth by approximately 30% (Auzemery et al., 2020) by limiting its yield stress. It is also active in the overriding plate (e.g. Duretz et al., 2011), but it has limited effects there. The activation of Peierls creep significantly influences the evolution of the orogen in the peierls model (Table 2), such that it cannot be readily subdivided into the three stages defined in Figure 1. There is no stage 2 (trench shift towards the foreland and slab heating), because the slab detaches much earlier and at shallower depth (t ∼ 6.3 Myr at 120 km depth, Supplementary Movies S4). The reduced maximum yield stress is reached in less time, so necking, tearing, and detachment occur sooner and at shallower depths (Supplementary Figure S4). Therefore, earlier detachment is an expected consequence of the stress limiting (Duretz et al., 2011). In addition, the early, shallow slab detachment leads to a steady decrease in driving force magnitudes (Figure 7B).
After slab detachment, the rapidly subducted slab starts to unbend and educt, uplifting the orogenic wedge. Simultaneously, the overriding plate slowly slides off of the downgoing plate along the lubricated subduction interface. This generates significant extension throughout the orogen, which is largely accommodated by reactivation of the thrust faults in the pro-wedge as normal faults. The normal faults are rotated and tilted to gentler dip angles as extension progresses (Supplementary Movies S4). Extension continues until the end of the simulation at t ∼ 55 Myr.
3.2.3 Lithospheric mantle friction
The frictional strength of the mantle lithosphere is often kept constant in geodynamic modelling studies, even though it makes up a significant portion of the lithosphere and thus of its strength. Our reference model assumes a dry mantle lithosphere (i.e., Pf/ Ps = 0, as suggested in e.g. Yardley and Valley, 1997; Burov, 2011; Massonne, 2016), such that it is effectively 10 times as strong (frictionally) as the continental crust (Table 2). We explore the impact of higher pore fluid pressures (Pf/Ps = 0.25 (model LM25) and 0.50 (model LM50) on continental collision dynamics (Table 2). This leads to effective friction coefficients of 0.42 and 0.24, respectively, which have also been suggested for natural mantle lithosphere (Zhong and Watts, 2013).
In model LM25 the peak forces and force evolution are quite similar to those of the reference model, but with important kinematic differences. The slab detaches 5 Myr later (∼30 vs ∼ 25 Myr, Figures 7A,D, Figure 9), after which the slab pull force remains positive instead of negative (Figures 7D, Figure 9). The frictional strength contrast reduction of 25% along the subduction interface increases the coupling between the downgoing and overriding plates. Moreover, the overriding plate bends more strongly, which initiates a positive feedback between burial and sedimentation, resulting in a deeper, narrower retro-foreland basin (Figures 10B,D, Supplementary Movies S6). Subsequently, the deeper lithospheric mantle scrapes off a large portion of oceanic crust during the kinematic stage, which forms a dense core beneath the orogen (Figure 10D). In turn, this dense orogenic core inhibits deep subduction of the uppermost continental crust, as well as subsequent exhumation of upper/lower continental crust along the retroshear (Figure 4F). The dense ophiolitic core also decouples the upper crust from the lower crust in the overriding plate. The topography does not flatten after detachment (Supplementary Figure S2C), because necking is slower and the elastic response is weaker, hence the uplift and orogenic widening following detachment are only minor.
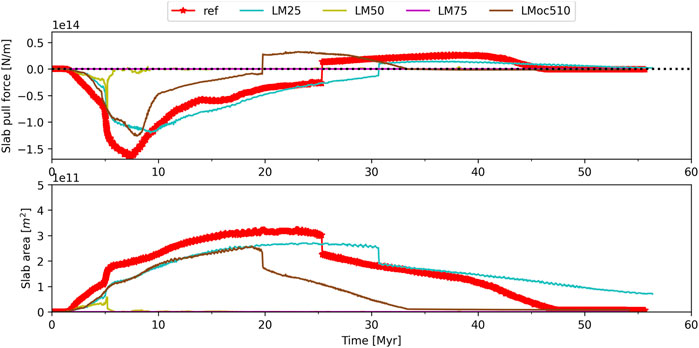
FIGURE 9. Temporal evolution of slab pull and slab area for the reference model and varying degrees of frictionally weakened lithospheric mantle (25, 50, 75, and 50% in combination with a 510 km ocean). 50% weakening or more results in slab detachment immediately after the push is stopped. Interestingly, combining 50% weakening with a slightly shorter ocean does not lead to premature slab detachment.
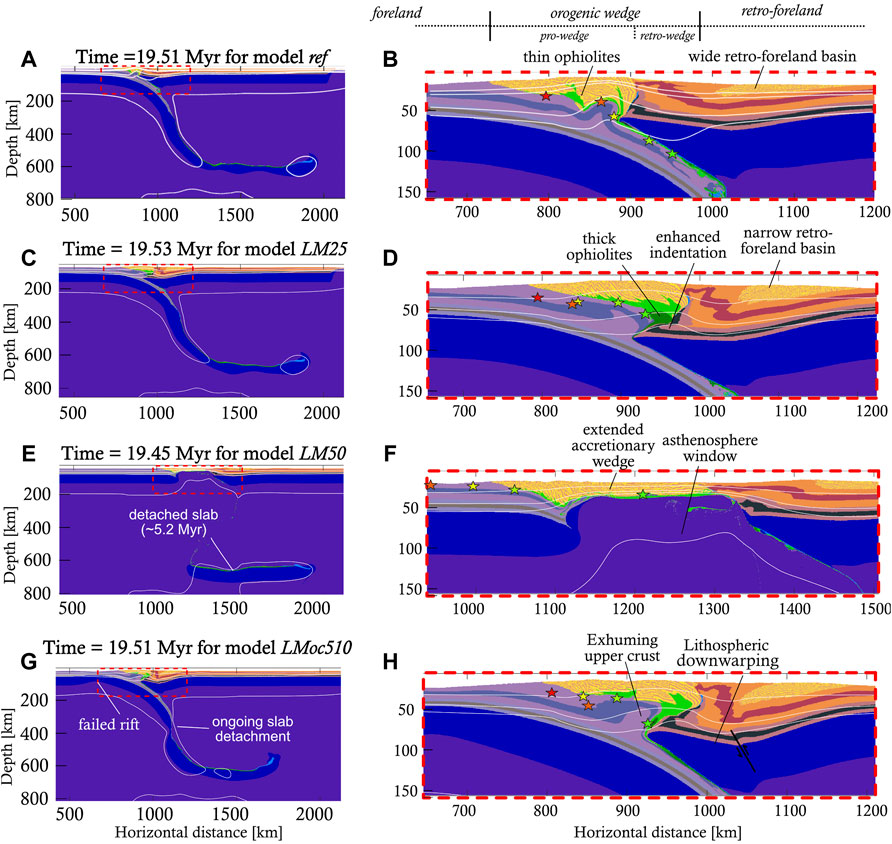
FIGURE 10. Inter-model comparison of the compositional evolution between models (A,B) ref, (C,D) LM25, (E,F) LM50, and (G,H) LMoc510 during stage 2 (Figure 1), illustrating the key role of lithospheric mantle frictional strength in subduction and collision dynamics. A very weak lithospheric mantle (model LM50) results in premature slab detachment and rifting, but not if combined with a slightly shorter ocean (LMoc510).
In model LM50 the significantly weakened lithospheric mantle results in slab detachment around t ∼ 5.17 Myr, at a depth of ∼50 km (Figure 9, Figure 10E,F) before a mature, double-vergent orogen has formed through a large rupture along the subduction interface, similar as described by Duretz et al. (2011). However, when a 50% weakened lithospheric mantle is combined with a 510 km long initial ocean (i.e., model LMoc510, 100 km shorter than the reference model), the downgoing plate does not detach at shallow levels. Instead, it leads to a significant amount of lower crustal indentation (Figures 10G,H). The slab detaches 5 Myr earlier than in the reference model (Figure 9). Compared to model LM25, the lithospheric mantle of the overriding plate bends more deeply, and part of the overriding plate is downwarped (Figure 10H).
The frictional strength of the lithospheric mantle thus strongly influences the burial-exhumation cycles of the downgoing plate, the timing of slab detachment and the subsequent topographic response. Moreover, reducing the frictional strength reduces the minimum wavelength of deformation in the lithospheric mantle.
3.2.4 Other parameters
The impact of numerous other parameters was explored and key outcomes are summarized (Table 2). Among them, the lower crustal rheology of the overriding plate has a stronger control on orogen geometry than that of the downgoing plate. An intermediate (plagioclase/anorthite 75%, Table 1) to strong (mafic granulite, Table 1) overriding lower crust results in a double-vergent orogen. For the downgoing plate, lower crustal subduction requires an intermediate to strong lower crustal rheology. The ratio between the frictional strength of sediments and that of the upper crust plays an important role during subduction initiation, either resulting in an upward-tilted (promoting single-vergent orogen formation) or downward-tilted (favouring a double-vergent orogen) tip of the overriding plate at the onset of collision (Table 2). A slow collision model (slowref) resulted in full eduction of the upper continental crust before slab detachment (Supplementary Figure S5A, Supplementary Movies S5) and almost full lower crustal eduction following slab detachment, which allows the overriding plate to revert its indented position (Supplementary Figure S5, Supplementary Movies S5). This is accompanied by significant lithospheric eduction (i.e., exhumation of the slab itself) and results in a very narrow, locked subduction interface (Supplementary Figure S5B, Supplementary Movies S5).
Furthermore, the effect of a long overriding plate was investigated with the “reflong” model (Table 2), where the horizontal model domain was increased by 1,000 km to 4,000 km. The overriding plate in this model is ∼2,250 km long instead of ∼1,250 km. During the initial stages of collision, the lithospheric mantle of the longer overriding plate locks the subduction process and the formation of an oceanic suture, preventing further continental subduction (Supplementary Figure S6C,D, Supplementary Movies S7). Therefore, no significant positively buoyant crust enters the subduction zone. The slab detaches at large depth (∼350 km) at around t ∼ 21 Myr, i.e., 4 Myr earlier than in the reference model (Supplementary Movies S1, S7). Due to the lack of positively buoyant material, the large detachment depth, and the subvertical slab position, there is no slab rebound after detachment and the model rapidly reaches a situation where tectonics ceases to be an important driver. This final tectonic quiescence is also reflected in the dynamics (Supplementary Figure S6C,D), which display a large (∼-1014 N/m), negative slab pull and a 3 orders of magnitude weaker mantle drag. The latter is prone to changing flow direction due to its low magnitude and interaction with decoupling remnant oceanic crust (Supplementary Movies S7). This subduction channel cut-off and subsequent semi-steady state is also observed in the thineur model (Supplementary Figure S6E,F), in which the “European” downgoing plate has twice as long passive margins as in the reference model (Table 2). Neither of these two models display any post-detachment slab rollback.
4 Discussion
4.1 Lower crustal indentation
Deep geophysics, including reflection and refraction seismic data, constraining the deep structure of the Central Alps, have been interpreted to portray indentation of the overriding plate lower crust into the orogenic wedge (Schmid et al., 1996; Rosenberg and Kissling, 2013; Rosenberg et al., 2015). This process leads to the emplacement of the stacked orogenic upper crust on top of the indenting downgoing plate lower crust, which in turn overlies the subducting lower crust and upper mantle of the downgoing plate (see for example plate 1 in Schmid et al., 1996). This complex geometry calls for a strong lower crust of the overriding plate, which contrasts with simple rheological models for continental crust where the lower crust is often assumed to be weaker than the upper crust (e.g. Brace and Kohlstedt, 1980; Okaya et al., 1996; Tesauro et al., 2009).
Our modelling shows that indentation by the lower crust of the overriding plate is only rarely observed, despite its strong mafic granulite rheology (Table 1). We find that lower crustal indentation occurs in two different scenarios. The first scenario involves a lower crust that behaves as a rigid indenter, for which the lower crust needs to have an intermediate to strong (e.g. plagioclase or mafic granulite) rheology. This scenario is in agreement with previous findings (Gerbault and Willingshofer, 2004; Vogt et al., 2018). We observe that this scenario of indentation is most effective when the lithospheric mantle of the overriding plate is dragged down during stage 1 (Supplementary Movies S2, S7, Figures 10A–D). The highest amount of indentation through this “active” mode of indentation is observed in model LM25 (Supplementary Movies S6, Figures 10D, Figure 11J), which also shows the highest degree of intra-crustal decoupling and burial of the retro-foreland basin. Here, indentation occurs during the collision stage (latest stage 1, early stage 2 in Figure 1), where the accretionary wedge evolves into a double-vergent orogenic wedge. In many of our other parameter studies (not shown here) the lower crust of the overriding plate barely indents the core of the orogen.
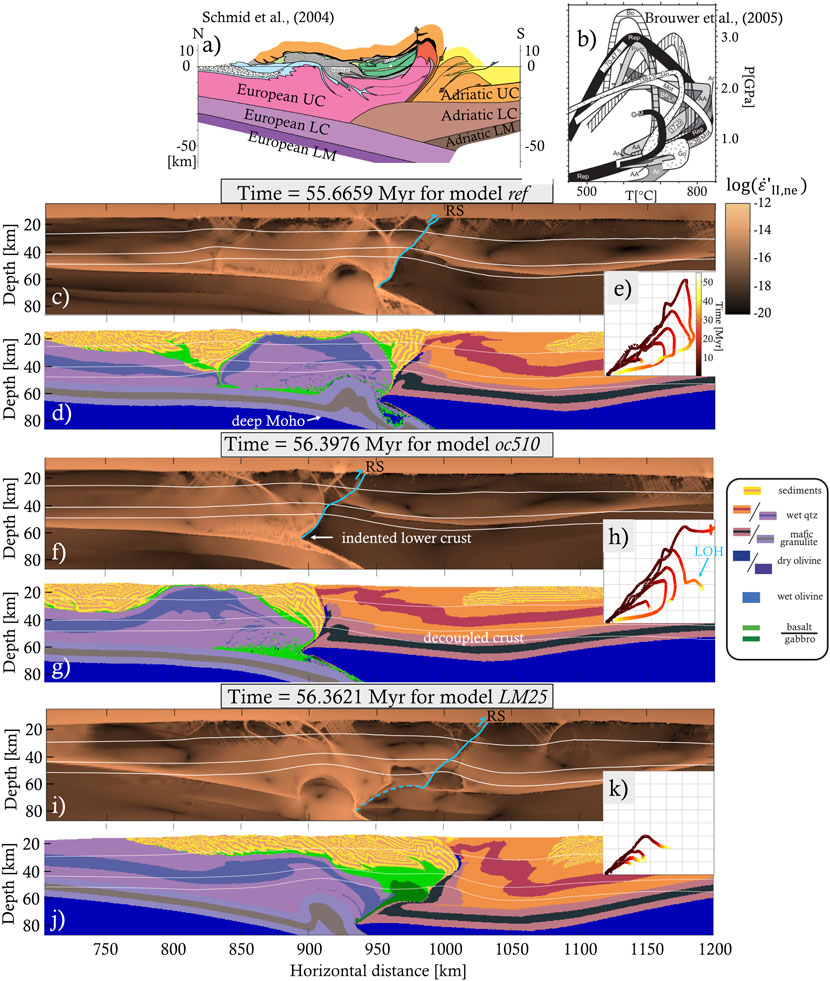
FIGURE 11. Comparison of a cross-section through the Central Alps (A), modified from Schmid et al. (2004a), with composition and visco-plastic strain rate fields of models (C,D) ref, (F,G) oc510 and (I,J) LM25 (Table 2) at t ∼ 56 Myr. Miniature PTt paths are shown for the models (E,H,K, see Figure 4) and for the Central Alps ((B) modified from Brouwer et al. (2005)). The trace of the retroshear (RS) is indicated in each model.
Another scenario that leads to indentation takes place during the second and third stages (Figures 1B,C) of the model evolution. The positively buoyant, decoupled continental crust of the downgoing plate rises and flows back along the subduction channel, concentrates in the core of the orogen and uplifts the overlying units. This eduction mechanism generates orogenic widening in our models similarly to what has been described by other authors (Andersen et al., 1991; Duretz et al., 2011; Porkoláb et al., 2021). In our results this widening is more visible in the upper crustal levels, while the lower crust records lower amounts of shear reversal along the subduction plane, resulting in differential displacement between upper and lower crust. Therefore, the lower crust attains an “indented” position without actively indenting the core of the orogen, in a similar way as described for the Central Alps by Laubscher (1990), and Schmid et al. (1996). This “passive” mode of indentation is best observed in e.g. model oc510 (Supplementary Movies S3, Figure 8D) and to a lesser extent in the reference model (Supplementary Movies S2, Figures 3D,F,H).
4.2 Slab rollback orogeny model evaluation
4.2.1 Slab detachment
The oceanic slab detaches from the downgoing plate under all parameters studied, usually at the rheological contrast between the passive margin and oceanic plate. Detachment at the passive margin is in agreement with many previous studies (e.g. Baumann et al., 2010; Baes et al., 2011; Duretz et al., 2012; Magni et al., 2012; Duretz and Gerya, 2013), which have interpreted the lateral strength contrast and crustal thickness variability at the continent-ocean transition to facilitate a localization of strain and deformation. The extensional strain from both the slab bending and the downward pull by the heavy oceanic slab is sufficient to initiate viscous necking or plastic tearing in this location (cf. Broerse et al., 2019). When the slab detaches and sinks into the mantle, it induces strong poloidal mantle flows, which interact with the orogen and take several tens of Myrs to equilibrate. The detachment depth varies from ∼48 to ∼600 km in our models, which is the same range observed also by the above-cited slab detachment studies (Supplementary Figure S8). Slab detachment occurs in clusters at < 200 km and >300 km depths (Supplementary Figure S8). The cluster of deep detachments mainly experiences viscous slab necking, which takes between ∼1.5 and 7.0 Myr. Our models in the cluster of shallow detachments (i.e., red diamonds in Supplementary Figure S8) experience very rapid detachment (tens to a few hundred kyr) along a plastic shear zone. Both modes are also found in previous work (e.g. Sacks and Secor, 1990; Duretz et al., 2012). Duretz et al. (2012) observe that detachment through shearing is favoured when the slab dip is intermediate (35–70°). In our results shallow detachment occurs when Peierls creep is activated, when the slab is young (50 Ma) or when the lithospheric mantle is very weak (model LM50). If detachment happens through slow necking (model LM25, Supplementary Figure S2C) the orogen remains higher than when necking is faster (e.g. models ref, oc510 in Supplementary Figure S2).
4.2.2 Post-detachment slab rollback
None of our modelled scenarios have resulted in either slab rollback or slab steepening after slab detachment. Instead, the slab usually rebounds upwards due to the net positive buoyancy resulting from the subducted lower crust (Figures 5, Figure 7). The slab does not rebound when no continental crust subducts (e.g. models reflong, thineur, Table 2, Supplementary Figure S6) or when slab necking is slower than ∼5 Myr (model LM25). Slab rebound and subsequent long-lasting slab unbending lead to eduction, which is accompanied by gravitational collapse and accumulation of exhumed crustal units in the core of the orogen. Together these processes drive orogenic widening in our models that leads to an observed trench shift towards the foreland of up to ∼140 km (Supplementary Figure S2).
To instead obtain the slab steepening observed in the study of Dal Zilio et al. (2020) testing the slab rollback orogeny model, the remaining slab after detachment needs to be negatively buoyant. Negative buoyancy needs to be achieved by limiting the subduction of buoyant continental crust. Crustal subduction can be limited by a slab detachment shortly after continental collision, and when the lithospheric mantle of the overriding plate blocks crustal subduction. A comparison with the study of Dal Zilio et al. (2020) suggests that slab detachment needs to occur at the moment when 100–150 km of subduction after continental collision has occurred. Such early slab detachment at depths deeper than the passive margin would put tight constraints on the parameters that govern the strength of the downgoing plate. For instance, the continental crust would have to be stronger both frictionally and ductile, such that it resists subduction more readily. This effect is in agreement with the main differences of our model with respect to Dal Zilio et al. (2020), where a colder crust and lithosphere (a Moho temperature of 350°C compared to our 450°C) and a higher crustal friction are used. Furthermore, the plastic strength of the oceanic slab can be lowered through changes in parameters governing Peierls creep (Eq. 11), its friction, and pore fluid pressure ratio (Table 1). In addition, a lack of slab rollback may be attributed to a relatively short overriding plate, making the overriding plate more prone to move in response to changes in the stress state (e.g. Butterworth et al., 2012). However, our reflong model did not show post-detachment slab rollback either (Supplementary Figure S6C,D, Supplementary Movies S7). Finally, slab rollback might be facilitated by transmission of slab pull along the trench from surrounding areas where the slab has not detached yet (Duretz and Gerya, 2013), which is not accounted for by our 2D models.
4.2.3 Mantle drag
Our modelling shows that slab pull often remains positive after slab detachment for tens of millions of years, while mantle drag provides a comparable force (Figure 7). This indicates that slab pull alone cannot explain the kinematics of the collisional system. For example, the peak mantle drag generated by slab steepening in stage 1 is strong enough to emplace the orogen on top of the downgoing plate (e.g., Figure 3). Furthermore, the eduction of deeply subducted lower crust from the downgoing plate is recognisable as a broad peak in the mantle drag evolution due to asthenosphere replacing the crust (e.g. Figure 6B). The mantle drag magnitude often remains significant compared to slab pull even during stages 2 and 3. This is illustrated in Supplementary Figure S7, where the ratio of slab pull over the mantle drag is plotted over time for models ref, oc510 and LM25. This ratio evolution can be compared with the results obtained by Candioti et al. (2021), who used the same ratio to explain crustal deformation patterns. Our observed ratio varies significantly over several orders of magnitude and is not able to explain the observed crustal deformation style (Supplementary Figure S7). This could be caused by differences in model setup and quantification methods. For example, Candioti et al. (2021) apply constant boundary velocities and use a narrower model domain (1,600 vs 3,000 km). In addition, they quantify mantle drag only on the model sides, while it is most important in the mantle wedge area in our study.
Since in most of our models neither slab pull nor mantle drag is dominant in the second and third stage (Figures 1, 3, 7), neither can be used individually to explain the behaviour of the orogen. It is the interaction between them that is most helpful in explaining the kinematics (see Section 3.1). Therefore, we propose that mantle drag could provide a useful addition to the slab rollback orogeny model.
4.3 Central Alps discussion
Our results are best applicable to the evolution of the Alps in their central sector, illustrated by the evolution of the well-studied NFP20 east transect (Figure 11A e. g. Schmid et al., 1996; Schmid et al., 2004a among others). The Central Alpine section is also the section for which the SRO model was originally proposed (Schlunegger and Kissling, 2015; Kissling and Schlunegger, 2018; Dal Zilio et al., 2020). A comparison of our models ref, oc510 and LM25 to the tectonic interpretation of this transect (Figure 11) shows numerous similarities in terms of kinematics, retroshear exhumation and indentation, as well as burial and exhumation mechanisms. The crustal thickening creates similar Moho depth geometries that reach 60–70 km beneath the orogen. The overall evolution shows significant initial burial followed by large-scale exhumation of the downgoing plate crustal material by its incorporation in the orogen and retroshear thrusting. The centrally exhumed area separates a zone of significant deformation of sediments, originally deposited on the European margin and the adjacent ocean in the fore-shear domain (foreland basin and neighbouring accretionary wedge), from highly deformed and exhumed sediments deposited originally over the oceanic and Adriatic domain in the retroshear zone (Figures 11C–G). However, the central area shows more symmetric exhumation and our models do not show far-travelled Adriatic nappes, as interpreted for the NFP20 east profile (compare Figure 11A with Figures 11D,G,J). The entire overriding plate crust is coupled by the deformation, resulting in significant exhumation in the footwall of the retroshear in a similar fashion as the post-Eocene (mostly post-Oligocene) exhumation of the Adriatic crust in the Central Alps (e.g. Rosenberg et al., 2015 among others). While models ref and oc510 show only retroshear exhumation and coupling of the overriding plate crust (Figures 11C–G), model LM25 shows an initial retroshear exhumation, followed by active indentation of the overriding plate lower crust (Figures 11I,J). The latter model is more realistic in terms of Central Alps structure evolution where the Eocene-Oligocene accretion, continental collision and retroshear exhumation along the Insubric line was followed by a post-Oligocene Adriatic indentation, although the exact age of the indentation is still debated (see discussion in Laubscher, 1990; Schmid et al., 1996; Schmid et al., 2004a; Rosenberg et al., 2015; Rosenberg et al., 2018). However, this latter LM25 profile shows less exhumation than the NFP 20 east transect and is more similar with the NFP20 west profile (compare with Figures 3B,C in Schmid et al., 2004a). Most models show burial and exhumation curves that are similar with existing Alps PTt paths (e.g. Brouwer et al., 2005) containing high-pressure-low-temperature events during metamorphism, although peak PT conditions are underestimated in model LM25 (Figure 4F, Figure 11K). In particular model oc510 shows peak pressures and temperatures that are fairly similar to the ones observed in the Central Alps (Figures 4C, 11B,E). The similarity continues further in more detail, for instance the marker starting at x = 1,050 km shows late orogenic heating (LOH, Figure 11H), which is fairly similar to the interpretation of the Lepontine gneisses in the Central Alps (Brouwer et al., 2004). The average surface topography is 2.9 km for model ref, 3.0 km for model oc510 and 3.7 km for model LM25 (Supplementary Figure S2), which is in between isostatically balanced predictions and observations (e.g. Kissling, 1993). All our models predict the formation of a thick-skinned thrust wedge that affect sediments deposited far in the Adriatic hinterland (i.e., the retro-foreland basin), in a similar fashion to what is observed in the Southern Alps and their Po Plain foredeep (e.g. Pfiffner, 2016).
Our models simulate a significant slab rebound and eduction after detachment through initial elastic deformation followed by viscous unbending over tens of millions of years (Figure 5). Analysis of the final stress fields shows that the retro-wedge is under compression, but most of the retro-foreland is not (Supplementary Figure S9), which is not in agreement with observations in the Southern Alps and their foredeep where the shortening continues at present (e.g. Di Bucci and Angeloni, 2013). In our models the compression in the orogen is induced by the upper crust of the downgoing plate that accumulates within the orogen during eduction and subsequent gravitational collapse (Supplementary Figure S1B). The compression in the orogen is not transferred past the retro-wedge into the retro-foreland. Moreover, the extension in the Central Alps was parallel to the orogen, connected with the mechanics of the adjacent Western and Eastern Alps, driven by the 3D processes of oroclinal bending and lateral extrusion (Ratschbacher et al., 1991; Mancktelow, 1992; Schmid et al., 1996; Schmid and Kissling, 2000; Pfiffner, 2016), which are not available in our models due to their inherent 2D limitations. Furthermore, the topography of models is exaggerated (by 0.9–1.7 km, Supplementary Figure S2) when compared to nature, which may induce an additional component of extension driven by an increased gravitational potential. Despite these shortcomings, our modelling shows that an orogen such as the Alps requires eduction associated with extension in a theoretical cylindrical version. Such extension is orogen-perpendicular in our models, but in nature it is orogen-parallel driven by the non-cylindrical 3D processes of oroclinal bending and lateral extrusion, which in fact are the result of the interaction with the orogens located at the terminations of the Alps, i.e. the Apennines and Carpathians (e.g. Ratschbacher et al., 1991; Schmid et al., 2013; Schmid et al., 2017; Király et al., 2021).
In context of the Adria-Europe collision, the downgoing plate was not completely oceanic, but characterised by a wide, thinned continental margin, which contained a continental fragment, i.e. the Briançonnais microcontinent (Dewey et al., 1989; Stampfli et al., 1998; Schmid et al., 2004a; Handy et al., 2010; Pfiffner, 2016). It is generally accepted that the lower crust of the thinned passive margin and the Briançonnais fragment have been subducted together with the lithospheric mantle (Schmid et al., 2004a; Pfiffner, 2016). However, due to the implementation of an instantaneous erosion/sedimentation mechanism in our models, the sediment thickness on the oceanic domain is likely overestimated, partly compensating for this deficit of positively buoyant material. A qualitative comparison of the area of the orogenic wedge of the NFP20 East cross-section with the reference model shows that wedge areas and partitioning between upper crust, sediments and lower crusts are similar (Supplementary Figure S10), thus exerting buoyancy forces of similar magnitude on the system. However, we acknowledge that including a continental sliver may affect the timing and intensity of slab steepening (Brun and Faccenna, 2008), which together with poloidal mantle flow may be expected to slow down subduction. Peak slab pull and mantle drag would likely be reduced. Future studies could significantly benefit from further investigating the influence of the Briançonnais microcontinent on the subduction system.
The unbending and simultaneous eduction in our models (sensu Andersen et al., 1991) generate uplift and widening of the orogen, exert shear and normal strain on the subduction channel, and hence promote a rheological decoupling of upper and lower crustal rocks from the downgoing plate. Moreover, even when the slab pull attains (minor) negative values in the final stages of model evolution, it is still insufficient to induce slab rollback, as discussed above. Particularly, for the Central Alps its present-day convergence may be driven by more complex (three-dimensional) processes, such as the 3D kinematics, rotation and lateral escape associated with the Adriatic indentation, while significant oroclinal processes affected its western sector during the final phases of post-collisional evolution (Schmid et al., 2004a; Rosenberg et al., 2015).
4.4 Model limitations
The main limitation of our study is the absence of changes in the third, along-strike direction. This was necessary in order to accurately study the dynamics of this system at a high enough resolution for many different parameters. However, orogen-parallel deformation is often relevant and particularly for the Central Alps since 8 Ma (Handy et al., 2010; Krstekanić et al., 2020; Van Hinsbergen et al., 2020; Király et al., 2021). Not accounting for orogen-parallel deformation 1) overestimates topography (Gerbault and Willingshofer, 2004), 2) eliminates 3D processes from causing lower crustal indentation (e.g. Schmid and Kissling, 2000), and 3) may also explain the absence of post-detachment convergence (see Section 4.2). Besides the orogen-parallel extension discussed above, comparing our two-dimensional models to two-dimensional cross-sections neglects the right-lateral displacement along the Peri-Adriatic fault system. This means that the Adriatic margin captured in our cross-sections was located further to the east at the time of collision (Schmid et al., 1996; Pfiffner, 2016). Finally, the lack of a third dimension means that we do not account for toroidal mantle flow, which dominates during slab steepening and rollback (e.g. Schellart and Moresi, 2013). However, due to the limited post-detachment trench retreat and/or slab rollback in our study, toroidal flow is expected to have only minor effects (e.g. a slightly weaker mantle drag).
Several processes in our modelling are absent or simplified, including melting leading to volcanism (e.g. Faccenda et al., 2008; Faccenda et al., 2009) and grain size evolution (Bercovici and Ricard, 2014; Schierjott et al., 2020). Furthermore, our simplified erosion and sedimentation implementation that instantaneously removes/deposits material above/below prescribed topographic levels ignores sediment transport (e.g. Garzanti et al., 2007; Garzanti and Malusà, 2008) . However, despite the relatively high erosion level (10 km above mountain area) most models show a modest to large extent of exhumation (Figure 4). The relatively high (∼3 km on average) final topography may be reduced by implementing erosion and sedimentation more accurately (as done in e.g. Malatesta et al., 2013).
5 Conclusion
We quantify continental collision dynamics in two-dimensional thermomechanical models to investigate the partitioning between slab pull and mantle drag in Alpine-style orogens under a wide range of parameters. We find that neither slab pull nor mantle drag by itself is able to explain the orogenic evolution. Our detailed comparison between the vertical slab pull and horizontal mantle drag demonstrates that these forces are in fact of similar magnitude during large parts of an orogenic cycle and interact with each other. We observe no post-detachment slab rollback or steepening in the wide parameter space explored here.
Our parameter studies show that continental collision dynamics are most strongly influenced by initial length and age of the oceanic plate, the activation of the Peierls creep mechanism, the frictional strength of the lithospheric mantle, and the lower crustal rheology of the overriding plate. These parameters affect the depth and timing of slab detachment, which dictates the post-detachment evolution of the orogenic system. Other parameters, such as convergence rate, rather influence the style of crustal deformation and burial-exhumation cycle and not the evolution of the mantle drag and slab pull forces.
The results of this study illustrate the need for quantitative analysis in numerical modelling studies. Especially in two dimensions it is straightforward to quantify forces (Appendix A). Force quantification in dynamic numerical models of continental collision allows for a more intuitive analysis of modelling results. Instead of ascribing kinematic events in the model to other motions in the model, we should use more complete quantification exemplified here to explain kinematics of the subduction-collision cycle. Moreover, it is a useful tool in the comparison of modelling results to forces acting in natural systems.
Data availability statement
Essential raw data used to make key figures are freely available at https://doi.org/10.5281/zenodo.6784339. Other raw data generated and analysed for this study will be made available by the authors on request. Post-processing scripts, the compiled model source code, initialisation files and force quantification data will be made available on www.github.com/LvAprograms/vanAgtmaaletal-2022-frontiers.
Author contributions
YD and LA conceptualised and designed the study. All authors contributed to the model setup. LA ran and analysed the models under the supervision of YD. LA wrote and ran force quantification post-processing scripts and PTt tracking/extraction algorithms. LA wrote the manuscript and all authors revised the manuscript.
Funding
ETH Zürich library: covers open access publication fees.
Acknowledgments
We warmly thank ETH Zürich for giving LA the time to write this manuscript based on his MSc thesis, since it was not part of his PhD work in the ETH+ project BECCY. In particular, we thank Taras Gerya and Luca dal Zilio for their codes. We acknowledge the very useful corrections and suggestions for improvement of Adrian Pfiffner and two reviewers that have significantly improved the quality of our research.
Conflict of interest
The authors declare that the research was conducted in the absence of any commercial or financial relationships that could be construed as a potential conflict of interest.
Publisher’s note
All claims expressed in this article are solely those of the authors and do not necessarily represent those of their affiliated organizations, or those of the publisher, the editors and the reviewers. Any product that may be evaluated in this article, or claim that may be made by its manufacturer, is not guaranteed or endorsed by the publisher.
Supplementary material
The Supplementary Material for this article can be found online at: https://www.frontiersin.org/articles/10.3389/feart.2022.916189/full#supplementary-material
References
Alvarez, W. (2010). Protracted continental collisions argue for continental plates driven by basal traction. Earth Planet. Sci. Lett. 296 (3–4), 434–442. doi:10.1016/j.epsl.2010.05.030
Andersen, T. B., Jamtveit, B., Dewey, J. F., and Swensson, E. (1991). Subduction and eduction of continental crust: Major mechanisms during continent-continent collision and orogenic extensional collapse, a model based on the south Norwegian Caledonides. Terra 3 (3), 303–310. doi:10.1111/j.1365-3121.1991.tb00148.x
Auzemery, A., Willingshofer, E., Yamato, P., Duretz, T., and Sokoutis, D. (2020). Strain localization mechanisms for subduction initiation at passive margins. Glob. Planet. Change 195, 103323. doi:10.1016/j.gloplacha.2020.103323
Baes, M., Govers, R., and Wortel, R. (2011). Subduction initiation along the inherited weakness zone at the edge of a slab: Insights from numerical models. Geophys. J. Int. 184 (3), 991–1008. doi:10.1111/j.1365-246X.2010.04896.x
Barazangi, M., and Isacks, B. L. (1979). Subduction of the Nazca plate beneath Peru: Evidence from spatial distribution of earthquakes. Geophys. J. Int. 57 (3), 537–555. doi:10.1111/j.1365-246X.1979.tb06778.x
Baumann, C., Gerya, T. V., and Connolly, J. A. (2010). Numerical modelling of spontaneous slab breakoff dynamics during continental collision. Geol. Soc. Lond. Spec. Publ. 332 (1), 99–114. doi:10.1144/sp332.7
Bercovici, D., and Ricard, Y. (2014). Plate tectonics, damage and inheritance. Nature 508 (7497), 513–516. doi:10.1038/nature13072
Brace, W. F., and Kohlstedt, D. L. (1980). Limits on lithospheric stress imposed by laboratory experiments. J. Geophys. Res. 85 (B11), 6248–6252. doi:10.1029/JB085iB11p06248
Broerse, T., Norder, B., Govers, R., Sokoutis, D., Willingshofer, E., and Picken, S. J. (2019). New analogue materials for nonlinear lithosphere rheology, with an application to slab break-off. Tectonophysics 756, 73–96. doi:10.1016/j.tecto.2018.12.007
Brouwer, F., Burri, T., Engi, M., and Berger, A. (2005). “Eclogite relics in the central Alps: PT - evolution, Lu-Hf ages and implications for formation of tectonic mélange zones,” in Schweizerische mineralogische und petrographische mitteilungen, 85, 147–174.
Brouwer, F., Van De Zedde, D., Wortel, M., and Vissers, R. (2004). Late-orogenic heating during exhumation: Alpine PTt trajectories and thermomechanical models. Earth Planet. Sci. Lett. 220 (1–2), 185–199. doi:10.1016/s0012-821x(04)00050-0
Brun, J.-P. (2002). Deformation of the continental lithosphere: Insights from brittle-ductile models. Geol. Soc. Lond. Spec. Publ. 200 (1), 355–370. doi:10.1144/GSL.SP.2001.200.01.20
Brun, J.-P., and Faccenna, C. (2008). Exhumation of high-pressure rocks driven by slab rollback. Earth Planet. Sci. Lett. 272 (1), 1–7. doi:10.1016/j.epsl.2008.02.038
Burov, E. B. (2011). Rheology and strength of the lithosphere. Mar. Petroleum Geol. 28 (8), 1402–1443. doi:10.1016/j.marpetgeo.2011.05.008
Butterworth, N. P., Quevedo, L., Morra, G., and Müller, R. D. (2012). Influence of overriding plate geometry and rheology on subduction. Geochem. Geophys. Geosyst. 13 (6). doi:10.1029/2011GC003968
Calais, E., Nocquet, J.-M., Jouanne, F., and Tardy, M. (2002). Current strain regime in the western Alps from continuous global positioning system measurements, 1996–2001. Geol. 30 (7), 651–654. doi:10.1130/0091-7613(2002)030<0651:csritw>2.0.co;2
Candioti, L. G., Duretz, T., Moulas, E., and Schmalholz, S. M. (2021). Buoyancy versus shear forces in building orogenic wedges. Solid 12 (8), 1749–1775. doi:10.5194/se-12-1749-2021
Celaˆl Şengör, A. M. (1990). plate tectonics and orogenic research after 25 years: A tethyan perspective. Earth-Science Rev. 27 (1), 1–201. doi:10.1016/0012-8252(90)90002-D
Christensen, U. R., and Yuen, D. A. (1985). Layered convection induced by phase transitions. J. Geophys. Res. 90 (B12), 10291–10300. doi:10.1029/JB090iB12p10291
Conrad, C. P., and Lithgow-Bertelloni, C. (2002). How mantle slabs drive plate tectonics. Science 298 (5591), 207–209. doi:10.1126/science.1074161
D’Agostino, N., Avallone, A., Cheloni, D., D’Anastasio, E., Mantenuto, S., and Selvaggi, G. (2008). Active tectonics of the Adriatic region from GPS and earthquake slip vectors. J. Geophys. Res. 113 (B12), B12413. doi:10.1029/2008JB005860
Dal Zilio, L., Kissling, E., Gerya, T., and van Dinther, Y. (2020). Slab rollback orogeny model: A test-of-concept. Geophys. Res. Lett. 47, e2020GL089917. doi:10.1029/2020gl089917
Dal Zilio, L., van Dinther, Y., Gerya, T. V., and Pranger, C. C. (2018). Seismic behaviour of mountain belts controlled by plate convergence rate. Earth Planet. Sci. Lett. 482, 81–92. doi:10.1016/j.epsl.2017.10.053
Deichmann, N. (1992). Structural and rheological implications of lower-crustal earthquakes below northern Switzerland. Phys. Earth Planet. Interiors 69 (3), 270–280. doi:10.1016/0031-9201(92)90146-M
Dewey, J. F., and Bird, J. M. (1970). Mountain belts and the new global tectonics. J. Geophys. Res. 75 (14), 2625–2647. doi:10.1029/JB075i014p02625
Dewey, J. F., and Burke, K. (1974). Hot spots and continental break-up: Implications for collisional orogeny. Geol. 2 (2), 57. doi:10.1130/0091-7613(1974)2<57:HSACBI>2.0.CO;2
Dewey, J. F., Helman, M., Knott, S., Turco, E., and Hutton, D. (1989). Kinematics of the Western mediterranean. Geol. Soc. Lond. Spec. Publ. 45 (1), 265–283. doi:10.1144/gsl.sp.1989.045.01.15
Di Bucci, D., and Angeloni, P. (2013). Adria seismicity and seismotectonics: Review and critical discussion. Mar. Petroleum Geol. 42, 182–190. doi:10.1016/j.marpetgeo.2012.09.005
Doglioni, C., Carminati, E., Cuffaro, M., and Scrocca, D. (2007). Subduction kinematics and dynamic constraints. Earth-Science Rev. 83 (3), 125–175. doi:10.1016/j.earscirev.2007.04.001
Duretz, T., and Gerya, T. (2013). Slab detachment during continental collision: Influence of crustal rheology and interaction with lithospheric delamination. Tectonophysics 602, 124–140. doi:10.1016/j.tecto.2012.12.024
Duretz, T., Gerya, T. V., and May, D. A. (2011). Numerical modelling of spontaneous slab breakoff and subsequent topographic response. Tectonophysics 502 (1–2), 244–256. doi:10.1016/j.tecto.2010.05.024
Duretz, T., Schmalholz, S., and Gerya, T. (2012). Dynamics of slab detachment. Geochem. Geophys. Geosyst. 13 (3), 2453. doi:10.1029/2011gc004024
Ellis, S. (1996). Forces driving continental collision: Reconciling indentation and mantle subduction tectonics. Geol. 24 (8), 699–702. doi:10.1130/0091-7613(1996)024<0699:fdccri>2.3.co;2
Erdős, Z., Huismans, R. S., Faccenna, C., and Wolf, S. G. (2021). The role of subduction interface and upper plate strength on back-arc extension: Application to mediterranean back-arc basins. Tectonics 40 (8), e2021TC006795. doi:10.1029/2021TC006795
Evans, B., and Goetze, C. (1979). The temperature variation of hardness of olivine and its implication for polycrystalline yield stress. J. Geophys. Res. 84 (B10), 5505–5524. doi:10.1029/jb084ib10p05505
Faccenda, M., Gerya, T. V., and Chakraborty, S. (2008). Styles of post-subduction collisional orogeny: Influence of convergence velocity, crustal rheology and radiogenic heat production. Lithos 103 (1–2), 257–287. doi:10.1016/j.lithos.2007.09.009
Faccenda, M., Minelli, G., and Gerya, T. (2009). Coupled and decoupled regimes of continental collision: Numerical modeling. Earth Planet. Sci. Lett. 278 (3–4), 337–349. doi:10.1016/j.epsl.2008.12.021
Faccenna, C., Becker, T. W., Auer, L., Billi, A., Boschi, L., Brun, J. P., et al. (2014). Mantle dynamics in the mediterranean. Rev. Geophys. 52 (3), 283–332. doi:10.1002/2013RG000444
Faccenna, C., Becker, T. W., Conrad, C. P., and Husson, L. (2013). Mountain building and mantle dynamics. Tectonics 32 (1), 80–93. doi:10.1029/2012TC003176
Garzanti, E., Doglioni, C., Vezzoli, G., and Andò, S. (2007). Orogenic belts and orogenic sediment provenance. J. Geol. 115 (3), 315–334. doi:10.1086/512755
Garzanti, E., and Malusà, M. G. (2008). The Oligocene Alps: Domal unroofing and drainage development during early orogenic growth. Earth Planet. Sci. Lett. 268 (3), 487–500. doi:10.1016/j.epsl.2008.01.039
Gerbault, M., and Willingshofer, E. (2004). Lower crust indentation or horizontal ductile flow during continental collision? Tectonophysics 387 (1–4), 169–187. doi:10.1016/j.tecto.2004.06.012
Gerya, T. V. (2019). Introduction to numerical geodynamic modelling. 2nd ed. Cambridge, United Kingdom: Cambridge University Press. doi:10.1017/9781316534243
Gerya, T. V., and Yuen, D. A. (2003). Characteristics-based marker-in-cell method with conservative finite-differences schemes for modeling geological flows with strongly variable transport properties. Phys. Earth Planet. Interiors 140 (4), 293–318. doi:10.1016/j.pepi.2003.09.006
Gerya, T. V., and Yuen, D. A. (2007). Robust characteristics method for modelling multiphase visco-elasto-plastic thermo-mechanical problems. Phys. Earth Planet. Interiors 163 (1), 83–105. doi:10.1016/j.pepi.2007.04.015
Handy, M. R., Schmid, S. M., Bousquet, R., Kissling, E., and Bernoulli, D. (2010). Reconciling plate-tectonic reconstructions of Alpine Tethys with the geological-geophysical record of spreading and subduction in the Alps. Earth-Science Rev. 102 (3–4), 121–158. doi:10.1016/j.earscirev.2010.06.002
Hubbard, J., Almeida, R., Foster, A., Sapkota, S. N., Bürgi, P., and Tapponnier, P. (2016). Structural segmentation controlled the 2015 Mw 7.8 Gorkha earthquake rupture in Nepal. Geology 44 (8), 639–642. doi:10.1130/G38077.1
Jolivet, L., Faccenna, C., Becker, T., Tesauro, M., Sternai, P., and Bouilhol, P. (2018). Mantle flow and deforming continents: From India-asia convergence to pacific subduction. Tectonics 37 (9), 2887–2914. doi:10.1029/2018TC005036
Jolivet, L., Faccenna, C., Goffé, B., Burov, E., and Agard, P. (2003). Subduction tectonics and exhumation of high-pressure metamorphic rocks in the Mediterranean orogens. Am. J. Sci. 303 (5), 353–409. doi:10.2475/ajs.303.5.353
Krstekanić, N., Matenco, L., Toljić, M., Mandic, O., Stojadinovic, U., and Willingshofer, E. (2020). Understanding partitioning of deformation in highly arcuate orogenic systems: Inferences from the evolution of the Serbian Carpathians. Glob. Planet. Change 195, 103361. doi:10.1016/j.gloplacha.2020.103361
Katayama, I., and Karato, S. (2008). Low-temperature, high-stress deformation of olivine under water-saturated conditions. Phys. Earth Planet. Interiors 168 (3–4), 125–133. doi:10.1016/j.pepi.2008.05.019
Király, Á., Funiciello, F., Capitanio, F. A., and Faccenna, C. (2021). Dynamic interactions between subduction zones. Glob. Planet. Change 202, 103501. doi:10.1016/j.gloplacha.2021.103501
Kissling, E. (1993). Deep structure of the Alps—what do we really know? Phys. Earth Planet. Interiors 79 (1), 87–112. doi:10.1016/0031-9201(93)90144-X
Kissling, E., and Schlunegger, F. (2018). Rollback orogeny model for the evolution of the Swiss Alps. Tectonics 37 (4), 1097–1115. doi:10.1002/2017tc004762
Laubscher, H. P. (1990). “Deep seismic data from the central Alps: Mass distributions and their kinematics,” in Mémoires de La Société Géologique de France, 156, 335–343.
Liao, J., and Gerya, T. (2017). Partitioning of crustal shortening during continental collision: 2-D thermomechanical modeling. J. Geophys. Res. Solid Earth 122 (1), 592–606. doi:10.1002/2016jb013398
Lippitsch, R., Kissling, E., and Ansorge, J. (2003). Upper mantle structure beneath the Alpine orogen from high-resolution teleseismic tomography. J. Geophys. Res. 108 (B8), 2376. doi:10.1029/2002jb002016
Luth, S., Willingshofer, E., Sokoutis, D., and Cloetingh, S. (2010). Analogue modelling of continental collision: Influence of plate coupling on mantle lithosphere subduction, crustal deformation and surface topography. Tectonophysics 484 (1–4), 87–102. doi:10.1016/j.tecto.2009.08.043
Magni, V., van Hunen, J., Funiciello, F., and Faccenna, C. (2012). Numerical models of slab migration in continental collision zones. Solid 3 (2), 293–306. doi:10.5194/se-3-293-2012
Malatesta, C., Gerya, T., Crispini, L., Federico, L., and Capponi, G. (2013). Oblique subduction modelling indicates along-trench tectonic transport of sediments. Nat. Commun. 4 (1), 2456. doi:10.1038/ncomms3456
Mancktelow, N. S. (1992). Neogene lateral extension during convergence in the Central Alps: Evidence from interrelated faulting and backfolding around the Simplonpass (Switzerland). Tectonophysics 215 (3), 295–317. doi:10.1016/0040-1951(92)90358-D
Massonne, H.-J. (2016). Hydration of the lithospheric mantle by the descending plate in a continent–continent collisional setting and its geodynamic consequences. J. Geodyn. 96, 50–61. doi:10.1016/j.jog.2015.06.006
Matenco, L., Krézsek, C., Merten, S., Schmid, S., Cloetingh, S., and Andriessen, P. (2010). Characteristics of collisional orogens with low topographic build-up: An example from the Carpathians. Terra 22 (3), 155–165. doi:10.1111/j.1365-3121.2010.00931.x
Métois, M., D’Agostino, N., Avallone, A., Chamot-Rooke, N., Rabaute, A., Duni, L., et al. (2015). Insights on continental collisional processes from GPS data: Dynamics of the peri-Adriatic belts. J. Geophys. Res. Solid Earth 120 (12), 8701–8719. doi:10.1002/2015JB012023
Michel, S., Jolivet, R., Rollins, C., Jara, J., and Dal Zilio, L. (2021). Seismogenic potential of the main himalayan thrust constrained by coupling segmentation and earthquake scaling. Geophys. Res. Lett. 48 (13), e2021GL093106. doi:10.1029/2021GL093106
Mitterbauer, U., Behm, M., Brückl, E., Lippitsch, R., Guterch, A., Keller, G. R., et al. (2011). Shape and origin of the East-Alpine slab constrained by the ALPASS teleseismic model. Tectonophysics 510 (1–2), 195–206. doi:10.1016/j.tecto.2011.07.001
Okaya, N., Cloetingh, S., and Mueller, St. (1996). A lithospheric cross-section through the Swiss Alps-II. Constraints on the mechanical structure of a continent-continent collision zone. Geophys. J. Int. 127 (2), 399–414. doi:10.1111/j.1365-246X.1996.tb04729.x
Paffrath, M., Friederich, W., Schmid, S. M., and Handy, M. R. (2021). amp; the AlpArray and AlpArray-Swath D Working GroupImaging structure and geometry of slabs in the greater Alpine area – a P-wave travel-time tomography using AlpArray Seismic Network data. Solid 12 (11), 2671–2702. doi:10.5194/se-12-2671-2021
Pfiffner, O. A. (2016). Basement-involved thin-skinned and thick-skinned tectonics in the Alps. Geol. Mag. 153 (5–6), 1085–1109. doi:10.1017/S0016756815001090
Porkoláb, K., Duretz, T., Yamato, P., Auzemery, A., and Willingshofer, E. (2021). Extrusion of subducted crust explains the emplacement of far-travelled ophiolites. Nat. Commun. 12 (1), 1499. doi:10.1038/s41467-021-21866-1
Ratschbacher, L., Frisch, W., Linzer, H.-G., and Merle, O. (1991). Lateral extrusion in the eastern Alps, PArt 2: Structural analysis. Tectonics 10 (2), 257–271. doi:10.1029/90TC02623
Rosenberg, C. L., Berger, A., Bellahsen, N., and Bousquet, R. (2015). Relating orogen width to shortening, erosion, and exhumation during Alpine collision. Tectonics 34 (6), 1306–1328. doi:10.1002/2014tc003736
Rosenberg, C. L., and Kissling, E. (2013). Three-dimensional insight into Central-Alpine collision: Lower-plate or upper-plate indentation? Geology 41 (12), 1219–1222. doi:10.1130/g34584.1
Rosenberg, C. L., Schneider, S., Scharf, A., Bertrand, A., Hammerschmidt, K., Rabaute, A., et al. (2018). Relating collisional kinematics to exhumation processes in the Eastern Alps. Earth-Science Rev. 176, 311–344. doi:10.1016/j.earscirev.2017.10.013
Royden, L. (1996). Coupling and decoupling of crust and mantle in convergent orogens: Implications for strain partitioning in the crust. J. Geophys. Res. 101 (B8), 17679–17705. doi:10.1029/96JB00951
Rudnick, R. L., and Fountain, D. M. (1995). Nature and composition of the continental crust: A lower crustal perspective. Rev. Geophys. 33 (3), 267–309. doi:10.1029/95RG01302
Sandiford, M., Coblentz, D., and Schellart, W. P. (2005). Evaluating slab-plate coupling in the Indo-Australian plate. Geology 33 (2), 113–116.
Schellart, W. P., and Moresi, L. (2013). A new driving mechanism for backarc extension and backarc shortening through slab sinking induced toroidal and poloidal mantle flow: Results from dynamic subduction models with an overriding plate. J. Geophys. Res. Solid Earth 118 (6), 3221–3248. doi:10.1002/jgrb.50173
Sacks, P. E., and Secor, D. T. (1990). Delamination in collisional orogens. Geol. 18 (10), 999. doi:10.1130/0091-7613(1990)018<0999:DICO>2.3.CO;2
Schierjott, J. C., Thielmann, M., Rozel, A. B., Golabek, G. J., and Gerya, T. V. (2020). Can grain size reduction initiate transform faults?—insights from a 3-D numerical study. Tectonics 39 (10), e2019TC005793. doi:10.1029/2019TC005793
Schlunegger, F., and Kissling, E. (2015). Slab rollback orogeny in the Alps and evolution of the Swiss Molasse basin. Nat. Commun. 6, 8605. doi:10.1038/ncomms9605
Schmeling, H., Babeyko, A. Y., Enns, A., Faccenna, C., Funiciello, F., Gerya, T., et al. (2008). A benchmark comparison of spontaneous subduction models—towards a free surface. Phys. Earth Planet. Interiors 171 (1), 198–223. doi:10.1016/j.pepi.2008.06.028
Schmid, S. M., Fügenschuh, B., Kissling, E., and Schuster, R. (2004a). Tectonic map and overall architecture of the Alpine orogen. Eclogae Geol. Helv. 97 (1), 93–117. doi:10.1007/s00015-004-1113-x
Schmid, S. M., Kissling, E., Diehl, T., van Hinsbergen, D. J. J., and Molli, G. (2017). Ivrea mantle wedge, arc of the Western Alps, and kinematic evolution of the Alps–Apennines orogenic system. Swiss J. Geosci. 110 (2), 581–612. doi:10.1007/s00015-016-0237-0
Schmid, S. M., Kissling, E., and Schuster, R. (2004b). Transects IV, V and VI: The Alps and their foreland, 108–114.
Schmid, S. M., and Kissling, E. (2000). The arc of the Western Alps in the light of geophysical data on deep crustal structure. Tectonics 19 (1), 62–85. doi:10.1029/1999TC900057
Schmid, S. M., Pfiffner, O.-A., Froitzheim, N., Schönborn, G., and Kissling, E. (1996). Geophysical-geological transect and tectonic evolution of the Swiss-Italian Alps. Tectonics 15 (5), 1036–1064. doi:10.1029/96tc00433
Schmid, S. M., Scharf, A., Handy, M. R., and Rosenberg, C. L. (2013). The tauern window (eastern Alps, Austria): A new tectonic map, with cross-sections and a tectonometamorphic synthesis. Swiss J. Geosci. 106 (1), 1–32. doi:10.1007/s00015-013-0123-y
Schönborn, G. (1992). “Kinematics of a transverse zone in the southern Alps, Italy,” in Thrust tectonics (Springer), 299–310.
Singer, J., Diehl, T., Husen, S., Kissling, E., and Duretz, T. (2014). Alpine lithosphere slab rollback causing lower crustal seismicity in northern foreland. Earth Planet. Sci. Lett. 397, 42–56. doi:10.1016/j.epsl.2014.04.002
Stampfli, G. M., Mosar, J., Marquer, D., Marchant, R., Baudin, T., and Borel, G. (1998). Subduction and obduction processes in the Swiss Alps. Tectonophysics 296 (1), 159–204. doi:10.1016/S0040-1951(98)00142-5
Sternai, P., Avouac, J.-P., Jolivet, L., Faccenna, C., Gerya, T., Becker, T. W., et al. (2016). On the influence of the asthenospheric flow on the tectonics and topography at a collision-subduction transition zones: Comparison with the eastern Tibetan margin. J. Geodyn. 100, 184–197. doi:10.1016/j.jog.2016.02.009
Suchoy, L., Goes, S., Maunder, B., Garel, F., and Davies, R. (2021). Effects of basal drag on subduction dynamics from 2D numerical models. Solid 12 (1), 79–93. doi:10.5194/se-12-79-2021
Sun, W., Zhao, L., Malusà, M. G., Guillot, S., and Fu, L.-Y. (2019). 3-D Pn tomography reveals continental subduction at the boundaries of the Adriatic microplate in the absence of a precursor oceanic slab. Earth Planet. Sci. Lett. 510, 131–141. doi:10.1016/j.epsl.2019.01.012
Tesauro, M., Kaban, M. K., and Cloetingh, S. A. P. L. (2009). How rigid is Europe’s lithosphere? Geophys. Res. Lett. 36 (16), L16303. doi:10.1029/2009GL039229
Torsvik, T. H., Van der Voo, R., Preeden, U., Mac Niocaill, C., Steinberger, B., Doubrovine, P. V., et al. (2012). Phanerozoic polar wander, palaeogeography and dynamics. Earth-Science Rev. 114 (3), 325–368. doi:10.1016/j.earscirev.2012.06.007
Turcotte, D. L., and Schubert, G. (2002). Geodynamics. Cambridge, United Kingdom: Cambridge University Press.
van Dinther, Y., Gerya, T., Dalguer, L. A., Corbi, F., Funiciello, F., and Mai, P. M. (2013a). The seismic cycle at subduction thrusts: 2. Dynamic implications of geodynamic simulations validated with laboratory models. JGR. Solid Earth 118 (4), 1502–1525. doi:10.1029/2012jb009479
van Dinther, Y., Gerya, T. V., Dalguer, L. A., Mai, P. M., Morra, G., and Giardini, D. (2013b). The seismic cycle at subduction thrusts: Insights from seismo-thermo-mechanical models. J. Geophys. Res. Solid Earth 118 (12), 6183–6202. doi:10.1002/2013JB010380
van Dinther, Y., Mai, P. M., Dalguer, L., and Gerya, T. (2014). Modeling the seismic cycle in subduction zones: The role and spatiotemporal occurrence of off-megathrust earthquakes. Geophys. Res. Lett. 41 (4), 1194–1201. doi:10.1002/2013gl058886
Van Hinsbergen, D. J., Torsvik, T. H., Schmid, S. M., Maţenco, L. C., Maffione, M., Vissers, R. L., et al. (2020). Orogenic architecture of the Mediterranean region and kinematic reconstruction of its tectonic evolution since the Triassic. Gondwana Res. 81, 79–229. doi:10.1016/j.gr.2019.07.009
Vogt, K., Matenco, L., and Cloetingh, S. (2017). Crustal mechanics control the geometry of mountain belts. Insights from numerical modelling. Earth Planet. Sci. Lett. 460, 12–21. doi:10.1016/j.epsl.2016.11.016
Vogt, K., Willingshofer, E., Matenco, L., Sokoutis, D., Gerya, T., and Cloetingh, S. (2018). The role of lateral strength contrasts in orogenesis: A 2D numerical study. Tectonophysics 746, 549–561. doi:10.1016/j.tecto.2017.08.010
Willingshofer, E., and Sokoutis, D. (2009). Decoupling along plate boundaries: Key variable controlling the mode of deformation and the geometry of collisional mountain belts. Geology 37 (1), 39–42. doi:10.1130/g25321a.1
Willingshofer, E., Sokoutis, D., Luth, S. W., Beekman, F., and Cloetingh, S. (2013). Subduction and deformation of the continental lithosphere in response to plate and crust-mantle coupling. Geology 41 (12), 1239–1242. doi:10.1130/G34815.1
Wilson, J. T. (1966). Did the atlantic close and then Re-open? Nature 211 (5050), 676–681. doi:10.1038/211676a0
Yardley, B. W. D., and Valley, J. W. (1997). The petrologic case for a dry lower crust. J. Geophys. Res. 102 (B6), 12173–12185. doi:10.1029/97JB00508
Appendix A Dynamic analysis
Two main forces are quantified in this research, on which the dynamic analysis is based. The first force, i.e. viscous drag along the base of the overriding plate, acts in the horizontal direction. It is referred to here as drag or mantle drag force. The second force, i.e. slab pull, acts in the vertical direction which is the expression of density differences of the subducting slab with respect to its surroundings. These forces are monitored over time so they can be linked to the kinematic evolution of the models and to examine their relative dominance.
Mantle drag is calculated here by integrating the product of the vertical gradient of horizontal velocity and the effective viscosity along the base of the overriding plate:
Since both the velocity gradient and the effective viscosity are characterised by sharp variations along the base of the overriding plate, drag force is calculated between 2 km below and above the prescribed lithosphere-asthenosphere boundary of 140 km beneath the surface (e.g. 160 km on the y axis of the figures). The calculation depths are 138.25, 139.25, 140.25 and 141.25 km. Subsequently, the mean, maximum and minimum drag are averaged along the base of the overriding plate at each depth level. In the resulting figures we show the variation between these depths as shaded areas for the mean mantle drag magnitude, which looks like a thick line if the mantle drag does not vary significantly between the integration depths (Figure A1). Slab pull switches polarity during slab detachment, while mantle drag switches polarity prior to that, for example when eduction starts. We also find that a very weak (around 1010–1011 N/m) mantle drag in a stationary orogenic system may often switch direction (e.g. Figure 6H).
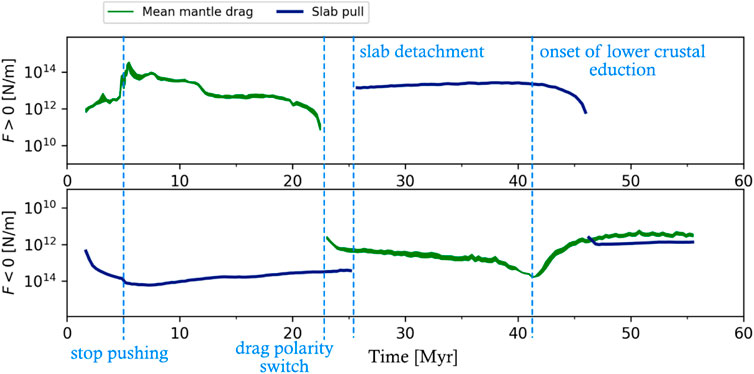
FIGURE A1. recycling of Figure 6B as a guide to the text.
Slab pull corresponds to the gravitational acceleration multiplied with the surface integral of lateral density variation:
Where
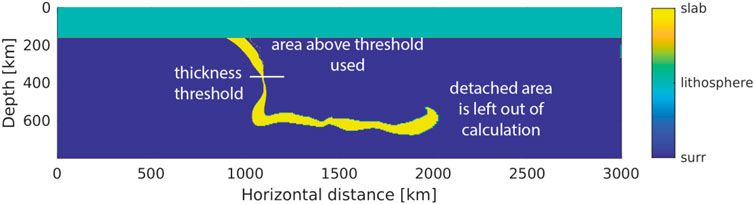
FIGURE A2. Slab identification of the slab pull calculation program for the reference model. The algorithm excludes everything below the necking level (which no longer has lithospheric temperatures) where the slab detaches, and everything above the lithosphere-asthenosphere boundary at a depth of 140 km. The resulting force estimate provides reasonable size estimates (e.g., Sandiford et al., 2005), despite these approximations.
Keywords: subduction, continental collision, force quantification, dynamic models, numerical modelling, mantle drag, slab pull
Citation: van Agtmaal L, van Dinther Y, Willingshofer E and Matenco L (2022) Quantifying continental collision dynamics for Alpine-style orogens. Front. Earth Sci. 10:916189. doi: 10.3389/feart.2022.916189
Received: 08 April 2022; Accepted: 25 July 2022;
Published: 29 September 2022.
Edited by:
Manuele Faccenda, Università Padova, ItalyReviewed by:
Ana M. Negredo, Complutense University of Madrid, SpainMarta Neres, Portuguese Institute for Sea and Atmosphere (IPMA), Portugal
O. Adrian Pfiffner, University of Bern, Switzerland
Copyright © 2022 van Agtmaal, van Dinther, Willingshofer and Matenco. This is an open-access article distributed under the terms of the Creative Commons Attribution License (CC BY). The use, distribution or reproduction in other forums is permitted, provided the original author(s) and the copyright owner(s) are credited and that the original publication in this journal is cited, in accordance with accepted academic practice. No use, distribution or reproduction is permitted which does not comply with these terms.
*Correspondence: Luuk van Agtmaal, bHV1ay52YW5hZ3RtYWFsQGVyZHcuZXRoei5jaA==