 Qiwei Fan1,2
 Botao Zhou1,2*
- 1Collaborative Innovation Center on Forecast and Evaluation of Meteorological Disasters/Key Laboratory of Meteorological Disaster, Ministry of Education/Joint International Research Laboratory of Climate and Environment Change, Nanjing University of Information Science and Technology, Nanjing, China
- 2School of Atmospheric Sciences, Nanjing University of Information Science and Technology, Nanjing, China
Temperature is a most important indicator for climate change. However, compared to surface air temperature, relatively less attention has been shown to the upper-tropospheric temperature (UTT). Given that the Asian-Pacific UTT plays a remarkable role in the climate system, its future change deserves great attention. In this study, based on the Coupled Model Intercomparison Project phase 6 (CMIP6) simulations, the fidelity of 30 CMIP6 models on the Asian-Pacific UTT patterns was evaluated and their future changes under the scenarios of the Shared Socioeconomic Pathway (SSP) 2–4.5 and 5–8.5 were projected. The evaluation indicates that the CMIP6 models have a good capacity to reproduce the climatology and interannual variability of seasonal UTT during 1965–2014, with the multi-model ensemble mean (MME) outperforming individual models. The observed seesaw oscillation between the Asian UTT and the North Pacific UTT during four seasons, named Asian-Pacific Oscillation (APO), is also well performed. The MME projects a similar spatial change under both scenarios in the second half of the 21st century, with lager changes in magnitude under SSP5-8.5 than under SSP2-4.5. Compared to 1965–2014, during 2050–2099, spring, summer and autumn UTTs are projected to cool (warm) in a widespread area of Asia (the North Pacific). The projected winter UTT decreases in East Asia and most of the North Pacific. In addition, an increased interannual variability of seasonal UTT is anticipated particularly in the mid-low latitudes of the Asian-Pacific sector. The APO phenomenon is expected to still be dominant in the future climate, but its intensity (interannual variability) tends to weaken (enlarge) in each season as compared to the current.
Introduction
Upper-tropospheric temperature (UTT) change in Asia and surrounding oceans has been documented to exert pronounced impacts on climate variations. For instance, the East Asian UTT cooling in spring may cause a decrease of precipitation in South China (Xin et al., 2006; Xin et al., 2008). During the summer time, the UTT cooling trend from 1950 to 2000 in East Asia contributes to the “southern flood and northern drought” pattern via weakening the East Asian summer monsoon (EASM) (Yu et al., 2004), and its recent reversal favors the intensification of the EASM (Zhao et al., 2015). The winter mode characterized by the positive (negative) UTT centered in southern China (Mongolia) tends to decrease precipitation in southern China and increase surface air temperature in the southeastern Tibet Plateau (Jiang et al., 2013). The East Asian UTT also significantly affects changes of the tropical Pacific sea surface temperature (SST) (Nan et al., 2009; Zhang and Zhou, 2012, 2015). The UTT variability in Asia has been identified to change harmoniously with that in the North Pacific, which exhibits a seesaw oscillation and is referred to as the Asian-Pacific Oscillation (APO, Zhao et al., 2007). Abnormal variation of this oscillation pattern can result in significant anomalies in atmospheric circulations and climate, such as the precipitation in East Asia (Zhao et al., 2007; Zhao et al., 2008; Zhou and Zhao, 2010; Zhao et al., 2012; Fang et al., 2014; Hua et al., 2019; Si et al., 2019; Lin et al., 2021), the frequency of tropical cyclone in the western North Pacific (Zhou et al., 2008), and the SST in the North Pacific (Zhao et al., 2010; Zhou et al., 2010; Wang and Chen, 2017).
Considering significant roles of the Asian-Pacific UTT in the climate system, its potential change in a future warmer world deserves great attention. Climate models and emission scenarios, coordinated by the Coupled Model Intercomparison Project (CMIP), are essential for the projection of future climate. Some CMIP3 and CMIP5 studies indicated that the potential behavior of future changes of the Asian-Pacific UTT differs from that in surface temperature (Sun and Ding, 2011; Dai et al., 2013; Ma and Yu, 2014; Zhou, 2016; Zhou and Xu, 2017; Zhou et al., 2018). Contrary to the warming of surface temperatures (IPCC, 2013), the summer upper-tropospheric thermal contrast between Asia and the Pacific is projected to weaken under warmer scenarios (Sun and Ding, 2011; Zhou, 2016; Zhou et al., 2018).
However, those CMIP3 and CMIP5 studies only focused on the summer situation. In addition, compared with the CMIP3 and CMIP5, the current CMIP6 models behave more complicated physical processes and higher spatial resolutions (Eyring et al., 2016; Simpkins, 2017; Stouffer et al., 2017; Tebaldi et al., 2021), and show some improvements in the simulation of historical climate (e.g., Chen et al., 2020; Ha et al., 2020; Jiang et al., 2020; Yang et al., 2021). Meanwhile, a set of new scenarios named Shared Socioeconomic Pathways (SSPs) is developed for climate projection under the CMP6 framework (O’Neill et al., 2016; Gidden et al., 2019). Two questions arise naturally: 1) How well do the state-of-the-art CMIP6 models capture the observed Asian-Pacific UTT pattern? 2) How will the Asian-Pacific UTT pattern change under the SSP scenarios? This study, following the previous studies and extending summer season to four seasons, is aimed to address these issues.
Data and Methods
Monthly air temperature outputs from 30 CMIP6 models (Table 1) for the historical simulation (1965–2014) and the SSP2-4.5 and SSP5-8.5 scenarios (2050–2099) are employed in this study. SSP5-8.5 (SSP2-4.5) is featured with a peak of radiation forcing at 8.5 (4.5) W m−2 by 2100, following the pathway of a high (a moderate) socioeconomic development (O’Neill et al., 2016; Gidden et al., 2019). More details can be referred to the website https://www.wcrp-climate.org/wgcm-cmip. The NCEP/NCAR reanalysis data (Kalnay et al., 1996) are applied as observation (OBS) for the evaluation of model performance. Because the horizontal resolutions vary among different models, we use the bilinear interpolation to remap all the data to a 1 ° × 1 ° grid.
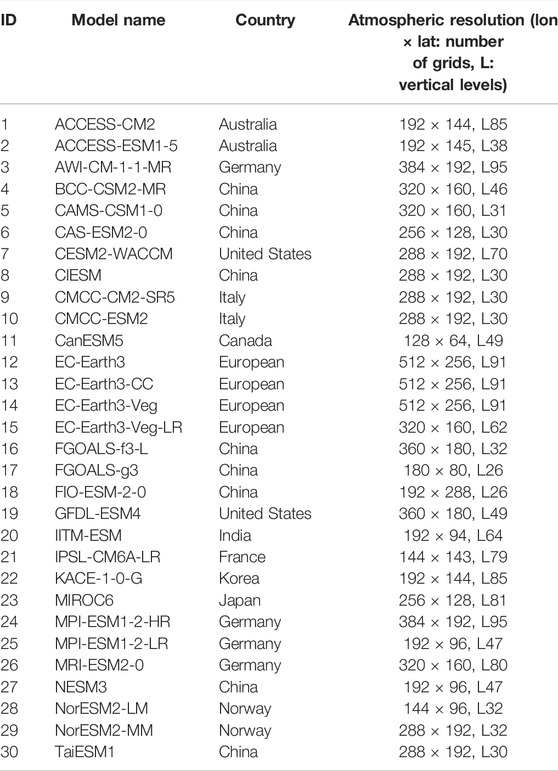
TABLE 1. Information about the CMIP6 models used in this study.
This study mainly focuses on the climatology and interannual variability of seasonal UTT. The UTT is defined as the temperature averaged in the upper troposphere (300–200 hPa), in which the zonal mean is removed. We use standard deviation (SD) to represent interannual variability. December-January-February (DJF), March-April-May (MAM), June-July-August (JJA) and September-October-November (SON) are, in turn, defined as winter, spring, summer and autumn. The arithmetic average of 30 models is defined as the multi-model ensemble mean (MME), and the Student’s t-test is adopted for the statistical significance.
Evaluation of Model Performance
Climatology
Figure 1 shows the Taylor diagrams for the climatology of seasonal UTT during 1965–2014 over the Asian-Pacific region (0°-60°N, 30°E-90°W; 61 × 241 grids) to quantify each model’s performance. With reference to the observation in each season, all the root mean square errors (RMSEs) of individual models are lower than 0.75; all the SCCs are larger than 0.75 and higher above 0.90 for most models; the standard deviation ratios vary from 0.5 to 1.25 for spring UTT and from 0.75 to 1.25 for the UTT of the other three seasons. These results suggest that the CMIP6 models have a good capacity in capturing the climatologic pattern of seasonal UTT. Compared to individual models, the MME simulation is noted to have a higher SCC and a lower RMSE, implying better performance of the MME than individual models. Specifically, the SCCs between the MME simulation and the observation are 0.97, 0.98, 0.98 and 0.99 (significant at the 99.9% level) for spring, summer, autumn and winter UTT, respectively. Their respective RMSEs in the MME simulation are 0.31, 0.22, 0.21 and 0.18.
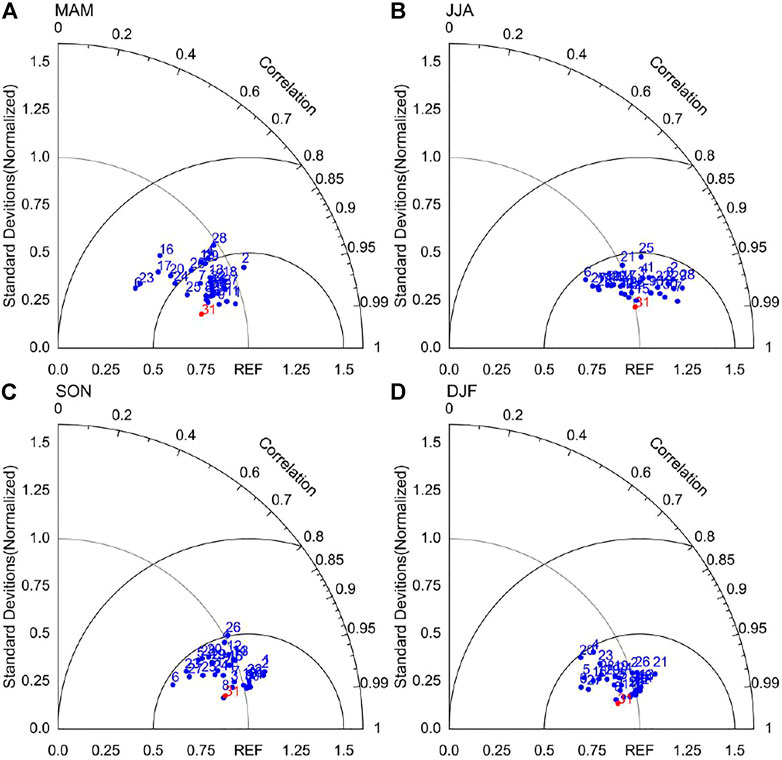
FIGURE 1. Taylor diagram of (A) spring, (B) summer, (C) autumn and (D) winter UTT over the Asian-Pacific sector during 1965–2014. Numbers 1–30 represent the individual models (see Table 1 for which model each number indicates). Number 31 represents MME. REF indicates the NCEP/NCAR reanalysis and acts as the reference point.
The climatological distributions of seasonal UTT from the observation and the MME simulation are further plotted (Figure 2). A general resemblance can be clearly seen. In spring (Figures 2A, E), positive values cover the southwest-northeast oriented region from the mid-low latitudes of Asia to the high latitudes of the North Pacific, with negative values residing on the either flank. The positive and negative centers are located in East Asia and the eastern Pacific, respectively. In summer (Figures 2B, F), the positives in the Eurasian continent and the negatives in the central-eastern Pacific are most dominant. The climatological distribution of autumn UTT (Figures 2C, G) is similar to that in spring. In winter (Figures 2D, H), compared to the autumn season, the negatives in northeastern Asia expand southward and the positive center moves eastward to the western Pacific. Also, the negatives in the Pacific shift eastward slightly.
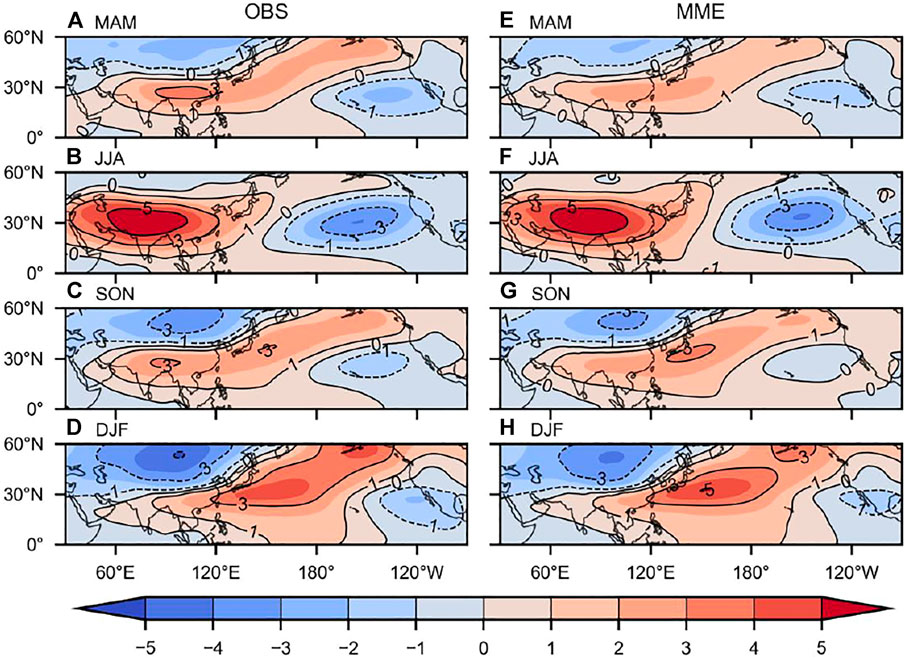
FIGURE 2. Climatological distribution of (A,E) spring, (B,F) summer, (C,G) autumn and (D,H) winter UTT (unit: °C) during 1965–2014 from (A–D) NCEP/NCAR reanalysis and (E–H) MME simulation.
Through the empirical orthogonal function (EOF) analysis, Zhao et al. (2007); Zhao et al. (2008) highlighted a seesaw oscillation in the UTT variability over the Asian-Pacific sector (i.e., APO), which features a warming of the Asian UTT accompanied with a cooling of the North Pacific UTT and vice versa. Accordingly, the EOF analysis for seasonal UTT in the observation and the MME simulation was conducted. Shown in Figures 3A–D, the first leading pattern (EOF1) of spring, summer, autumn and winter UTT in the observation, explaining 32, 24, 33 and 41% of their respective total variance, clearly displays a seesaw structure in the Asian-Pacific region. These oscillation features can be reasonably reproduced by the MME simulation (Figures 3E–H). The MME simulated EOF1 pattern from spring to winter accounts for 34, 31, 37 and 35% of the total variance, respectively. Their corresponding spatial correlations with the observed EOF1 patterns are 0.92, 0.84, 0.92, and 0.91, all higher than the 99.9% significance level.
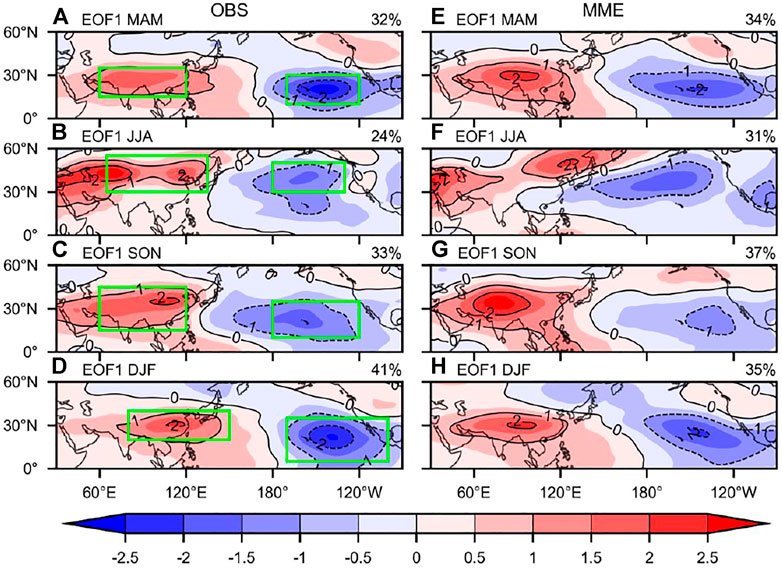
FIGURE 3. EOF1 (×0.01) mode of (A,E) spring, (B,F) summer, (C,G) autumn and (D,H) winter UTT during 1965–2014 from (A–D) NCEP/NCAR reanalysis and (E–H) MME simulation. Green boxes in (A–D) are used to define APO index.
Following Zhao et al. (2007), we refer to the location of positive (negative) center shown in Figure 3 and then define the regional mean UTT as AI (PI) index to measure the variation of the Asian (the North Pacific) UTT. The APO index is calculated as the AI minus the PI. The definition for four seasons is shown as follows:
IAPO-MAM = UTT(15°-35°N,60°-120°E)–UTT(10°-30°N,170°-120°W)
IAPO-JJA = UTT(30°-55°N,65°-135°E)–UTT(30°-50°N,180°-130°W)
IAPO-SON = UTT(15°-45°N,60°-120°E)–UTT(10°-35°N,180°-120°W)
IAPO-DJF = UTT(20°-40°N,80°-150°E)–UTT(5°-35°N,170°-100°W)
where the left-hand side of each equation represents the APO index for each season and the first (second) term on the right-hand side indicates the corresponding AI (PI) index.Figure 4 shows the observed and simulated AI-PI correlations for the period of 1965–2014. The observed correlations (represented by the number 32) are −0.85 in spring, −0.62 in summer, −0.73 in autumn and −0.83 in winter. All the correlations are above the 99.9% significance level, again demonstrating the inverse linkage of the Asian UTT to the North Pacific UTT. Such an inverse relationship in four seasons can be well simulated by the CMIP6 models. For the MME simulation (represented by the number 31), the seasonal AI-PI correlations from spring to winter are, in turn, −0.80, −0.57, −0.74 and −0.81, also higher than the 99.9% significance level and close to the observation.
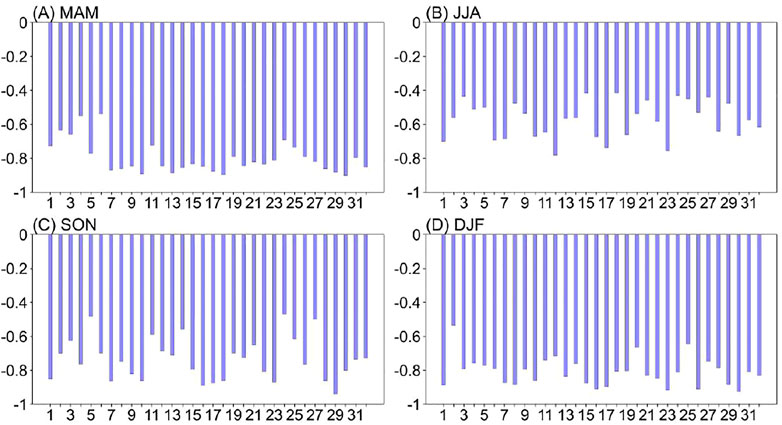
FIGURE 4. AI-PI correlations in (A) spring, (B) summer, (C) autumn and (D) winter during 1965–2014. Numbers 1–30 represent the individual models (see Table 1 for which model each number indicates). Number 31 and 32 represent MME and observation, respectively.
Interannual Variability
Figure 5 displays the Taylor diagrams for the simulated seasonal interannual variability of UTT over the Asian-Pacific region. Most models show a SCC value of above 0.75 in four seasons, with the RMSE less than 0.75. Seasonally, the best performance is shown for winter SD. Also, the MME simulation generally outperforms its ensemble members for all seasons. For the MME simulation, the SCCs in spring, summer, autumn and winter are 0.86, 0.89, 0.88 and 0.90 (significant at the 99.9% level), and the RMSEs are 0.51, 0.46, 0.49 and 0.45, respectively. The MME simulated SD distributions in four seasons, which are similar to the observation, exhibit large interanual variability (SD exceeding 0.6) in Asia and the central-eastern Pacific (Figure 6). These results illustrates that the MME performs well in capturing the interannual variability of the Asian-Pacific UTT.
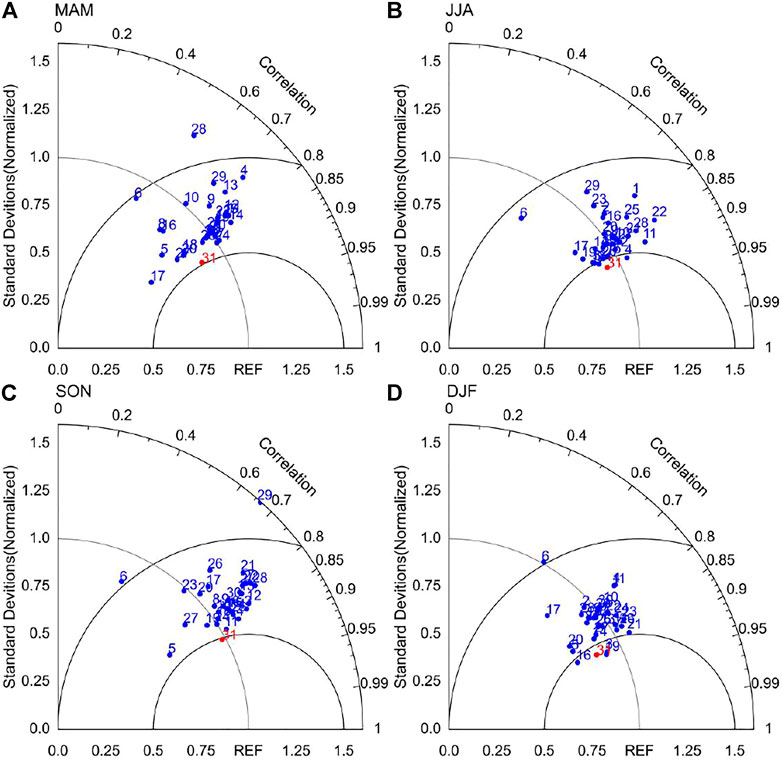
FIGURE 5. Same as in Figure 1, but for (A) spring, (B) summer, (C) autumn and (D) winter UTT standard deviation during 1965–2014.
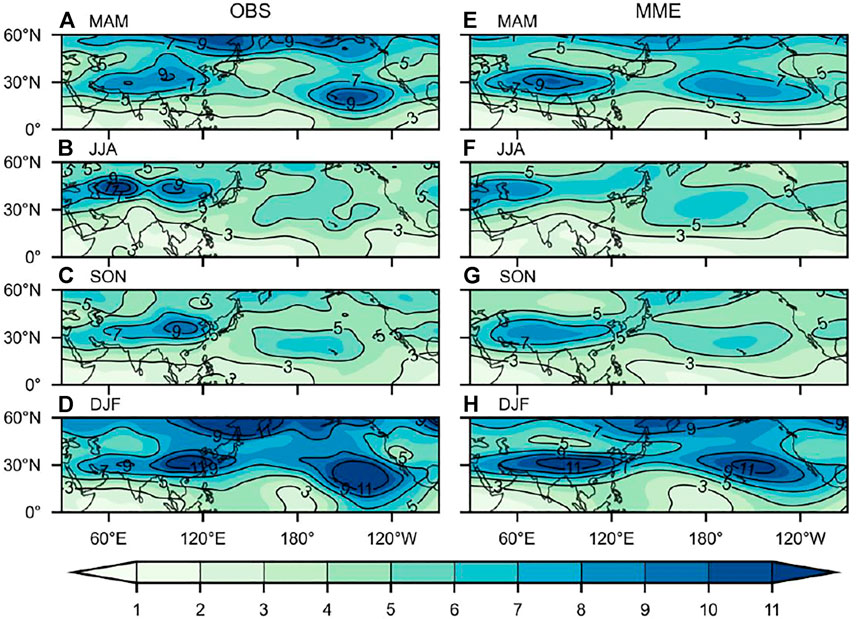
FIGURE 6. Spatial distribution of standard deviation (unit: 10–1°C) of (A,E) spring, (B,F) summer, (C,G) autumn and (D,H) winter UTT during 1965–2014 from (A–D) NCEP/NCAR reanalysis and (E–H) MME simulation.
In brief, the MME shows a good capacity to reproduce the climatology and interannual variability of seasonal UTT in the Asian-Pacific sector. The APO pattern in each season can also be well captured. All of these provide a basis for using the MME to project their future changes.
Projected Changes
Climatology
Figure 7 presents the MME projected seasonal UTT anomalies during 2050–2099 (relative to 1965–2014) under the scenarios of SSP2-4.5 and SSP5-8.5. The anomalous patterns for the two scenarios are similar in each season. However, the changes in magnitude are larger under SSP5-8.5 than that under SSP2-4.5, due to stronger external forcing imposed on the models. In spring (Figures 7A, E), significant negative anomalies are dominant in a widespread region of Asia and significant positive anomalies are pronounced in large areas of the North Pacific. Such an anomalous pattern generally opposites to the current climatological UTT distribution (Figure 2E), indicating a weakening of the upper-tropospheric thermal difference between the Asian continent and the North Pacific in a warmer scenario. Decreases in UTT over most Eurasia are projected in summer (Figures 7B, F). In comparison, the projected UTT increases in the North Pacific with an exception that a decrease of UTT occurs over the eastern Pacific. In combination with Figure 2F, the projected change in summer UTT hints that the UTT centers at current climate will shift eastward in the future climate, in addition to a weakening of the upper-tropospheric thermal difference between Asia and the North Pacific. This finding conforms to the CMIP5 result (Zhou, 2016). The case for the projected change of autumn UTT (Figures 7C, G) approximates that for spring UTT. In winter (Figures 7D, H), decreases in UTT are projected to occur in East Asia and the North Pacific except some parts of the western and eastern Pacific where an increase of UTT is projected.
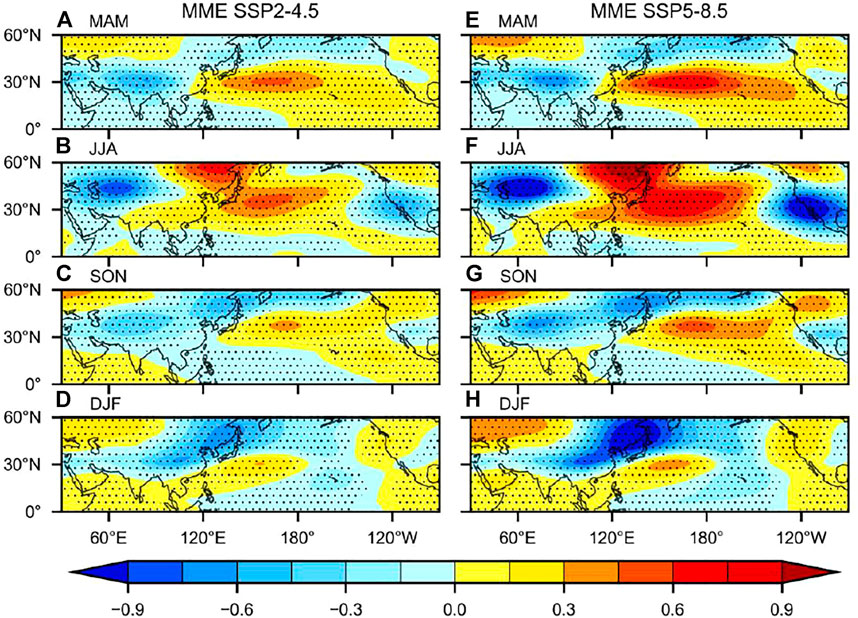
FIGURE 7. MME projected changes of (A,E) spring, (B,F) summer, (C,G) autumn and (D,H) winter UTT (unit: °C) during 2050–2099 relative to 1965–2014 under (A–D) SSP2-4.5 and (E–H) SSP5-8.5. Regions above the 95% significance level are dotted.
We further calculated the AI-PI correlations in both scenarios. Figure 8 illustrates that the AI and PI projected from all the CMIP6 models are negatively correlated in each season. The MME projected spring, summer, autumn and winter AI-PI correlations under SSP2-4.5 (SSP5-8.5) are −0.81 (−0.82), −0.57 (−0.57), −0.77 (−0.77) and −0.84 (−0.83), respectively, all of which exceed the 99.9% significance level. It suggests that current out-of-phase relationship in the Asian-Pacific UTT (i.e., APO pattern) will still exist in a warmer world.
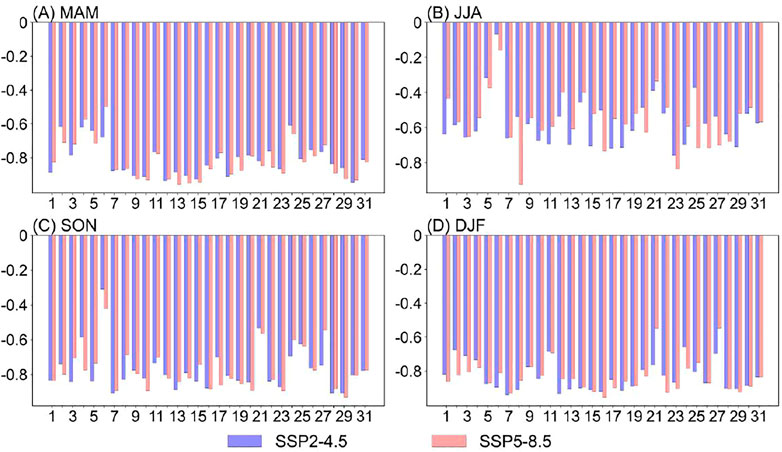
FIGURE 8. AI-PI correlations in (A) spring, (B) summer, (C) autumn and (D) winter during 2050–2099 under SSP2-4.5 and SSP5-8.5. Numbers 1–30 represent individual models (see Table 1 for which model each number indicates). Number 31 represents MME.
Changes of the APO intensity for SSP2-4.5 and SSP5–8.5 during the second half of the 21st century are displayed in Figure 9. During 2050–2099 relative to 1965–2014, the change of APO intensity projected by individual models from spring to winter under SSP2-4.5 (SSP5-8.5) is in the range of −1.33–0.34°C (−1.75–0.29°C), −0.94–0.33°C (−0.93–0.55°C), −0.91–0.47°C (−1.22–0.31°C) and −0.61–0.43°C (−0.97–0.61°C), respectively. The MME projected spring, summer, autumn and winter APO intensity decreases by 0.42°C, 0.13°C, 0.27°C and 0.15°C under SSP2-4.5, and further to 0.55°C, 0.19°C, 0.39°C and 0.25°C under SSP5-8.5, respectively. In other words, with reference to current climate, the APO intensity tends to weaken by 19.9% (26.1%) in spring, 2.5% (3.7%) in summer, 31.8% (45.9%) in autumn and 11.4% (18.9%) in winter over the course of the second half of the 21st century under SSP2-4.5 (SSP5-8.5).
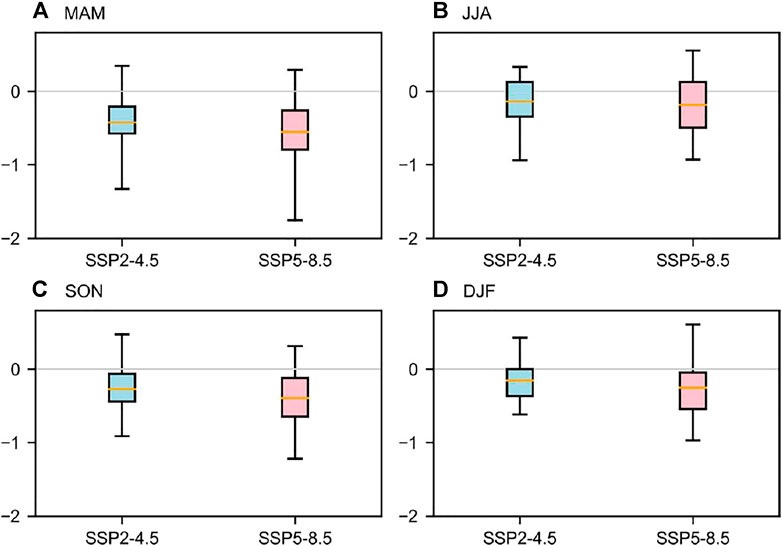
FIGURE 9. Projected changes of (A) spring, (B) summer, (C) autumn and (D) winter APO during 2050–2099 relative to 1965–2014 under SSP2-4.5 (blue) and SSP5-8.5 (pink). Boxes indicate the interquartile model spread (25th and 75th quantiles) with the horizontal line indicating the MME and the whiskers showing the ensemble range.
Interannual Variability
To examine future changes of the UTT interannual variability, we plotted the MME simulated SD ratio between 2050–2099 and 1965–2014 (Figure 10). The distribution of SD ratio under SSP2-4.5 and SSP5-8.5 resembles each other in each season, showing an increase of interannual variability over most of the Asian-Pacific sector, particularly over the mid-low latitudes in the future. Due to stronger external forcing, the projected changes in SD under SSP5-8.5 are greater than that under SSP2-4.5. Seasonally, the projected greatest increase of SD occurs in winter.
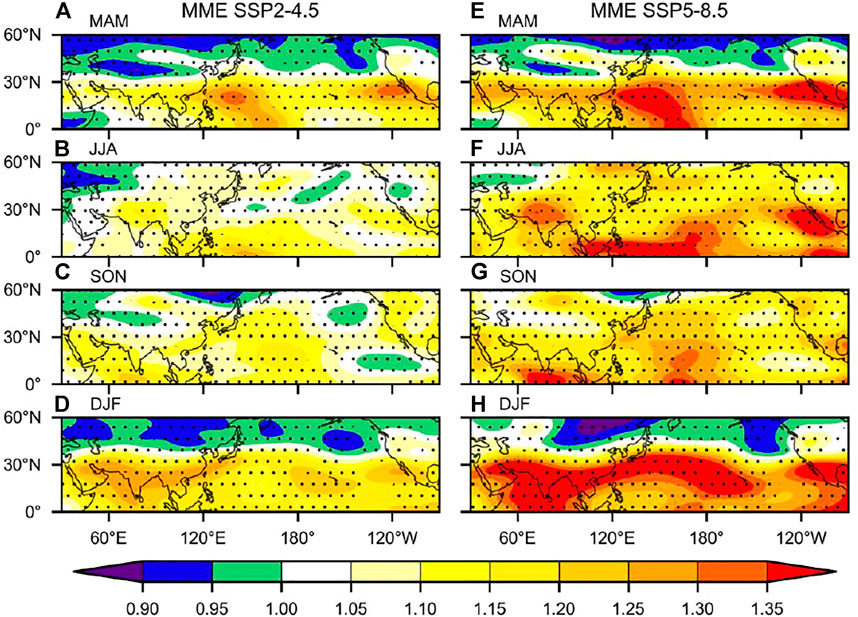
FIGURE 10. Ratio of MME projected UTT standard deviation during 2050–2099 under (A–D) SSP2-4.5 and (E–H) SSP5-8.5 to that during 1965–2014 in (A,E) spring, (B,F) summer, (C,G) autumn and (D,H) winter. Regions above the 95% significance level are dotted.
Accordingly, the MME projected interannual variability of APO is enhanced in four seasons, with larger enhancement under SSP5-8.5 than under SSP2-4.5 (Figure 11). During 2050–2099 under SSP5-8.5 (SSP2-4.5), the MME projects a percentage increase of 25% (13%), 13% (1%), 16% (8%) and 31% (21%), respectively, for the SD of spring, summer, autumn and winter APO. Large inter-model spreads are also noted in the projection of APO interannual variability. Moreover, the model spread becomes wider under SSP5-8.5 as compared to that under SSP2-4.5. For SSP5-8.5, the largest model spread is found for the SD of summer APO, which ranges from a decrease of 28% to an increase of 193%, followed by the SD of winter APO, ranging from a decrease of 17% to an increase of 122%. The largest model spread for the SD of summer APO mainly results from the CIESM projection which shows considerably greater change as compared to other models. The model spreads for the SD of spring and autumn APO are in the range of −31%–88% and −30%–58%, respectively. For SSP2-4.5, the projected percentage changes in the SD of spring, summer, autumn and winter APO are −32%–61%, −33%–37%, −41%–42% and −15%–89%, respectively.
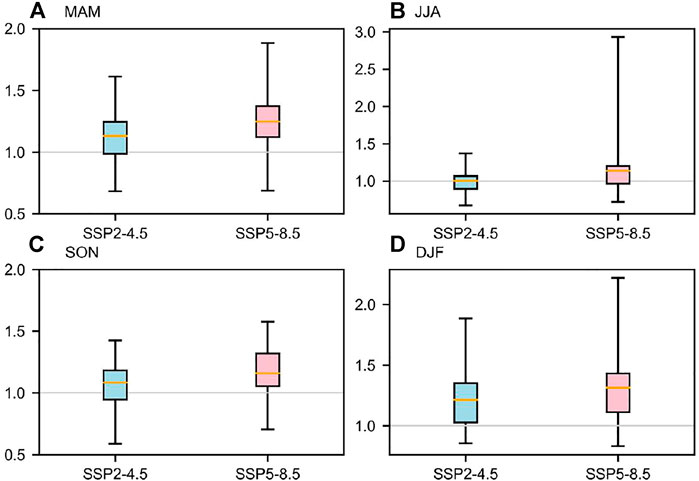
FIGURE 11. Same as Figure 9, but for the projected ratio of APO standard deviation in (A) spring, (B) summer, (C) autumn and (D) winter.
Conclusion
The performance of 30 CMIP6 models in the simulation of the Asian-Pacific seasonal UTT, including the climatology, the interannual variability and the APO pattern during 1965–2014, was evaluated in this study. Based on the evaluation, their changes under SSP2-4.5 and SSP5-8.5 over the course of the second half of the 21st century were further projected. The main findings are summarized below:
1) The evaluation results show that the CMIP6 models perform well in reproducing the observed climatology and interannual variability of seasonal UTT pattern in the Asian-Pacific sector. The MME outperforms individual models with a higher SCC and lower RMSE. The MME simulated climatological distribution of seasonal UTT, including the position of warm and cold centers and the north-south migration from spring to winter, well resembles the observation. The simulated SD pattern with large interanual variability over Asia and the central-eastern Pacific is broadly comparable to the observation. The observed APO pattern in four seasons can also be captured.
2) The MME projects that future changes in the UTT climatology and interannual variability are spatially similar for the two scenarios, however, the magnitudes of changes under SSP5-8.5 are larger than that under SSP2-4.5. During 2050–2099 relative to 1965–2014, spring, summer and autumn UTTs are projected to fall in larger areas of Asia and rise in most of the North Pacific, signifying a weakening of the upper-tropospheric thermal contrast between the two regions. The winter UTT is projected to decrease in East Asia and the North Pacific except that an increase of UTT occurs over some parts of the western and the eastern Pacific. The projected UTT interannual variability increases in four seasons particularly over the mid-low latitudes of the Asian-Pacific sector.
3) The MME projects that current APO phenomenon still exists in the future climate. However, a weakening of APO intensity and an enlargement of its interannual variability are anticipated. The changes in magnitude under SSP5-8.5 are greater than that under SSP2-4.5. For SSP5-8.5, the projected weakening of APO intensity is the highest in autumn, and that during the summer time is the lowest. The largest increase of APO interannual variability is projected in winter, and the projected smallest increase occurs in summer.
Data Availability Statement
The original contributions presented in the study are included in the article, further inquiries can be directed to the corresponding author.
Author Contributions
BZ designed and supervised the research; QF performed data analysis. QF and BZ prepared the manuscript.
Funding
This research was supported by the National Natural Science Foundation of China (42025502).
Conflict of Interest
The authors declare that the research was conducted in the absence of any commercial or financial relationships that could be construed as a potential conflict of interest.
Publisher’s Note
All claims expressed in this article are solely those of the authors and do not necessarily represent those of their affiliated organizations, or those of the publisher, the editors and the reviewers. Any product that may be evaluated in this article, or claim that may be made by its manufacturer, is not guaranteed or endorsed by the publisher.
Acknowledgments
We acknowledge the World Climate Research Program’s Working Group on Coupled Modeling and thank the climate modeling groups for producing and sharing their model outputs.
References
Chen, H., Sun, J., Lin, W., and Xu, H. (2020). Comparison of CMIP6 and CMIP5 Models in Simulating Climate Extremes. Sci. Bull. 65, 1415–1418. doi:10.1016/j.scib.2020.05.015
Dai, A., Li, H., Sun, Y., Hong, L. C., LinHo, L., Chou, C., et al. (2013). The Relative Roles of Upper and Lower Tropospheric Thermal Contrasts and Tropical Influences in Driving Asian Summer Monsoons. J. Geophys. Res. Atmos. 118, 7024–7045. doi:10.1002/jgrd.50565
Eyring, V., Bony, S., Meehl, G. A., Senior, C. A., Stevens, B., Stouffer, R. J., et al. (2016). Overview of the Coupled Model Intercomparison Project Phase 6 (CMIP6) Experimental Design and Organization. Geosci. Model Dev. 9, 1937–1958. doi:10.5194/gmd-9-1937-2016
Fang, K., Davi, N., and D'Arrigo, R. (2014). A Reconstruction of the Asia-Pacific Oscillation Index for the Past 1500 Years and its Association with the Asian Summer Monsoon. Int. J. Climatol. 34, 2505–2514. doi:10.1002/joc.3856
Gidden, M. J., Riahi, K., Smith, S. J., Fujimori, S., Luderer, G., Kriegler, E., et al. (2019). Global Emissions Pathways under Different Socioeconomic Scenarios for Use in CMIP6: A Dataset of Harmonized Emissions Trajectories through the End of the Century. Geosci. Model Dev. 12, 1443–1475. doi:10.5194/gmd-12-1443-2019
Ha, K. J., Moon, S., Timmermann, A., and Kim, D. (2020). Future Changes of Summer Monsoon Characteristics and Evaporative Demand over Asia in CMIP6 Simulations. Geophys. Res. Lett. 47, e2020GL087492. doi:10.1029/2020GL087492
Hua, W., Lin, Z., Wang, X., and Fan, G. (2019). Weakening Relationship between East Asian Summer Monsoon and Asian-Pacific Oscillation after 1990s. Adv. Meteorology 2019, 1–9. doi:10.1155/2019/6012301
IPCC (2013). Climate Change 2013: The Physical Science Basis. Contribution of Working Group I to the Fifth Assessment Report of the Intergovernmental Panel on Climate Change. Cambridge, UK and New York: Cambridge University Press.
Jiang, X., Yang, S., Li, Y., Ke, Z., Li, J., and Hu, H. (2013). Dominant Modes of Wintertime Upper-Tropospheric Temperature Variations over Asia and Links to Surface Climate. J. Clim. 26, 9043–9060. doi:10.1175/JCLI-D-12-00774.1
Jiang, D., Hu, D., Tian, Z., and Lang, X. (2020). Differences between CMIP6 and CMIP5 Models in Simulating Climate over China and the East Asian Monsoon. Adv. Atmos. Sci. 37, 1102–1118. doi:10.1007/s00376-020-2034-y
Kalnay, E., Kanamitsu, M., Kistler, R., Collins, W., Deaven, D., Gandin, L., et al. (1996). The NCEP/NCAR 40-year Reanalysis Project. Bull. Amer. Meteor. Soc. 77, 437–471. doi:10.1175/1520-0477(1996)077<0437:tnyrp>2.0.co;2
Lin, Z., Zhu, J., Hua, W., and Fan, G. (2021). Impact of the August Asian-Pacific Oscillation on Autumn Precipitation in Central Eastern China. Asia-Pacific J. Atmos. Sci. 57, 181–190. doi:10.1007/s13143-020-00187-1
Ma, J., and Yu, J.-Y. (2014). Paradox in South Asian Summer Monsoon Circulation Change: Lower Tropospheric Strengthening and Upper Tropospheric Weakening. Geophys. Res. Lett. 41, 2934–2940. doi:10.1002/2014GL059891
Nan, S., Zhao, P., Yang, S., and Chen, J. (2009). Springtime Tropospheric Temperature over the Tibetan Plateau and Evolutions of the Tropical Pacific SST. J. Geophys. Res. 114, D10104. doi:10.1029/2008JD011559
O'Neill, B. C., Tebaldi, C., Van Vuuren, D. P., Eyring, V., Friedlingstein, P., Hurtt, G., et al. (2016). The Scenario Model Intercomparison Project (ScenarioMIP) for CMIP6. Geosci. Model Dev. 9, 3461–3482. doi:10.5194/gmd-9-3461-2016
Si, D., Zhao, P., and Wang, M. (2019). Inter‐decadal Change of the Middle‐upper Tropospheric Land-Sea Thermal Contrast in the Late 1990s and the Associated Northern Hemisphere Hydroclimate. Int. J. Climatol. 39, 3271–3281. doi:10.1002/joc.6017
Simpkins, G. (2017). Progress in Climate Modelling. Nat. Clim. Change 7, 684–685. doi:10.1038/nclimate3398
Stouffer, R. J., Eyring, V., Meehl, G. A., Bony, S., Senior, C., Stevens, B., et al. (2017). CMIP5 Scientific Gaps and Recommendations for CMIP6. Bull. Am. Meteorol. Soc. 98, 95–105. doi:10.1175/BAMS-D-15-00013.1
Sun, Y., and Ding, Y. (2011). Responses of South and East Asian Summer Monsoons to Different Land-Sea Temperature Increases under a Warming Scenario. Chin. Sci. Bull. 56, 2718–2726. doi:10.1007/s11434-011-4602-0
Tebaldi, C., Debeire, K., Eyring, V., Fischer, E., Fyfe, J., Friedlingstein, P., et al. (2021). Climate Model Projections from the Scenario Model Intercomparison Project (ScenarioMIP) of CMIP6. Earth Syst. Dynam. 12, 253–293. doi:10.5194/esd-12-253-2021
Wang, L., and Chen, L. (2017). Interannual Variation of the Asian-Pacific Oscillation. Dyn. Atmos. Oceans 77, 17–25. doi:10.1016/j.dynatmoce.2016.10.009
Xin, X., Yu, R., Zhou, T., and Wang, B. (2006). Drought in Late Spring of South China in Recent Decades. J. Clim. 19, 3197–3206. doi:10.1175/JCLI3794.1
Xin, X., Li, Z., Yu, R., and Zhou, T. (2008). Impacts of Upper Tropospheric Cooling upon the Late Spring Drought in East Asia Simulated by a Regional Climate Model. Adv. Atmos. Sci. 25, 555–562. doi:10.1007/s00376-008-0555-x
Yang, X., Zhou, B., Xu, Y., and Han, Z. (2021). CMIP6 Evaluation and Projection of Temperature and Precipitation over China. Adv. Atmos. Sci. 38, 817–830. doi:10.1007/s00376-021-0351-4
Yu, R., Wang, B., and Zhou, T. (2004). Tropospheric Cooling and Summer Monsoon Weakening Trend over East Asia. Geophys. Res. Lett. 31, L22212. doi:10.1029/2004GL021270
Zhang, L., and Zhou, T. (2012). The Interannual Variability of Summer Upper-Tropospheric Temperature over East Asia. J. Clim. 25, 6539–6553. doi:10.1175/JCLI-D-11-00583.1
Zhang, L., and Zhou, T. (2015). Decadal Change of East Asian Summer Tropospheric Temperature Meridional Gradient Around the Early 1990s. Sci. China Earth Sci. 58, 1609–1622. doi:10.1007/s11430-015-5117-3
Zhao, P., Zhu, Y., and Zhang, R. (2007). An Asian-Pacific Teleconnection in Summer Tropospheric Temperature and Associated Asian Climate Variability. Clim. Dyn. 29, 293–303. doi:10.1007/s00382-007-0236-y
Zhao, P., Chen, J., Xiao, D., Nan, S., Zou, Y., and Zhou, B. (2008). Summer Asian-Pacific Oscillation and its Relationship with Atmospheric Circulation and Monsoon Rainfall. Acta Meteorol. Sin. 22, 455–471.
Zhao, P., Cao, Z., and Chen, J. (2010). A Summer Teleconnection Pattern over the Extratropical Northern Hemisphere and Associated Mechanisms. Clim. Dyn. 35, 523–534. doi:10.1007/s00382-009-0699-0
Zhao, P., Wang, B., and Zhou, X. (2012). Boreal Summer Continental Monsoon Rainfall and Hydroclimate Anomalies Associated with the Asian-Pacific Oscillation. Clim. Dyn. 39, 1197–1207. doi:10.1007/s00382-012-1348-6
Zhao, S., Li, J., Yu, R., and Chen, H. (2015). Recent Reversal of the Upper-Tropospheric Temperature Trend and its Role in Intensifying the East Asian Summer Monsoon. Sci. Rep. 5, 11847. doi:10.1038/srep11847
Zhou, B.-T., and Xu, Y. (2017). CMIP5 Analysis of the Interannual Variability of the Pacific SST and its Association with the Asian-Pacific Oscillation. Atmos. Ocean. Sci. Lett. 10, 138–145. doi:10.1080/16742834.2017.1260427
Zhou, B. (2016). The Asian-Pacific Oscillation Pattern in CMIP5 Simulations of Historical and Future Climate. Int. J. Climatol. 36, 4778–4789. doi:10.1002/joc.4668
Zhou, B., Cui, X., and Zhao, P. (2008). Relationship between the Asian-Pacific Oscillation and the Tropical Cyclone Frequency in the Western North Pacific. Sci. China Ser. D-Earth Sci. 51, 380–385. doi:10.1007/s11430-008-0014-7
Zhou, B., Zhao, P., and Cui, X. (2010). Linkage between the Asian-Pacific Oscillation and the Sea Surface Temperature in the North Pacific. Chin. Sci. Bull. 55, 1193–1198. doi:10.1007/s11434-009-0386-x
Zhou, B., Xu, Y., and Shi, Y. (2018). Present and Future Connection of Asian-Pacific Oscillation to Large-Scale Atmospheric Circulations and East Asian Rainfall: Results of CMIP5. Clim. Dyn. 50, 17–29. doi:10.1007/s00382-017-3579-z
Keywords: CMIP6, evaluation and projection, upper-tropospheric temperature, climatology, interannual variability
Citation: Fan Q and Zhou B (2022) Upper-Tropospheric Temperature Pattern Over the Asian-Pacific Region in CMIP6 Simulations: Climatology and Interannual Variability. Front. Earth Sci. 10:917660. doi: 10.3389/feart.2022.917660
Received: 11 April 2022; Accepted: 29 April 2022;
Published: 26 May 2022.
Edited by:
Dabang Jiang, Institute of Atmospheric Physics (CAS), ChinaReviewed by:
Zhiping Tian, Institute of Atmospheric Physics (CAS), ChinaDong Chen, Institute of Atmospheric Physics (CAS), China
Copyright © 2022 Fan and Zhou. This is an open-access article distributed under the terms of the Creative Commons Attribution License (CC BY). The use, distribution or reproduction in other forums is permitted, provided the original author(s) and the copyright owner(s) are credited and that the original publication in this journal is cited, in accordance with accepted academic practice. No use, distribution or reproduction is permitted which does not comply with these terms.
*Correspondence: Botao Zhou, emhvdWJ0QG51aXN0LmVkdS5jbg==