 Jinchao Wang
 Chuanying Wang1
- 1State Key Laboratory of Geomechanics and Geotechnical Engineering, Institute of Rock and Soil Mechanics, Chinese Academy of Sciences, Wuhan, China
- 2Emergency Surveying and Mapping Support Center, Hubei Provincial Department of Natural Resources, Wuhan, China
In order to improve the accuracy and efficiency of deep in-situ stress measurement, based on the wall collapse in deep borehole, a deep borehole in-situ stress measurement method based on multi-array ultrasonic scanning technology is proposed in this paper. The solution idea of using the combination of multiple elements for borehole contour scanning is put forward, and a multi-array ultrasonic scanning technology suitable for fine horizontal section scanning of deep geological borehole contour is formed. Through the analysis of the calculation principle of hole wall caving method and the derivation of multi-array element ultrasonic scanning solution algorithm, a multi-array ultrasonic scanning device is developed by using the effective fusion of multi-array ultrasonic full waveform scanning signals and the reconstruction of horizontal section contour. The measurement method of in-situ stress in deep borehole combined with hole wall caving method is studied. Finally, the feasibility and accuracy of this method are verified by physical experiments. The results show that: the effective fusion of multi-array ultrasonic full waveform scanning signals and horizontal section contour reconstruction can break through the limitations of conventional in borehole probe placement and in borehole medium sound velocity calibration, and improve the fine reconstruction and accurate measurement of 360° wall shape. The multi-array ultrasonic scanning technology can obtain the borehole shape data at any borehole depth, and then obtain the three-dimensional shape measurement of borehole wall, which can provide a new technical means for the three-dimensional detection of borehole wall and in-situ stress measurement.
Introduction
With the increasing scale and depth of rock engineering, the problems of rock mechanics are diversified and complex, which puts forward higher requirements for the discipline of rock mechanics. It is necessary to further carry out basic theoretical research, improve and develop theoretical methods and test means, so as to better solve the problems of rock engineering. In situ stress is the natural stress that exists in the Earth’s crust and is not disturbed by engineering. It is also known as the initial stress, absolute stress or original rock stress of rock mass. In a broad sense, it also refers to the stress in the Earth’s body. It includes stresses caused by geothermal, gravity, changes in the Earth’s rotation speed and other factors. Initial in-situ stress, absolute stress or original rock stress are important factors affecting the stability of rock mass surrounding rock. They are not only the main controlling factors affecting the mechanical behavior of rock mass, but also one of the main force sources causing rock mass deformation and failure. The reasons for the formation of in-situ stress are complex and diverse. It is generally believed that it is the result of the self weight of rock mass and the development of previous tectonic movements of the Earth plate. At the same time, it is also affected by the environment in which it occurs, such as lithology, topography, faults and fractures. In situ stress is an important basic data for the stability design of mining, power station, tunnel and other projects, and it is also one of the most important factors to consider in the excavation design and stability analysis of underground space. Therefore, in situ stress parameters have become very important in the excavation of deep underground projects (Bai et al., 2018; Ji 2009; Sun et al., 2020; Wang and Wang 2017).
With the deepening of seismic exploration and mining engineering research, the Ministry of oil and gas exploration and scientific research will continue to point to more and more important targets. At present, deep in-situ stress measurement mainly adopts hydraulic fracturing, hole wall caving method and differential strain method based on core measurement. Various methods have advantages and disadvantages (Han et al., 2018). Among them, borehole wall caving method is to analyze the magnitude and direction of in-situ stress according to the caving characteristics of borehole wall rock. Borehole caving analysis, as a part of comprehensive stress estimation, has become a routine work of continental deep drilling plan (Amadei and Stephansson, 1986; Zoback et al., 1985). In 1964, R. Leeman found the phenomenon of hole wall breakage in the drilling of gold mine at a depth of 2000 m in South Africa, and had the trend of collapse in the dominant direction. He pointed out that this collapse was the result of compressive stress, which opened the precedent of in-situ stress measurement by hole wall caving method (Leeman, 1964). D. I. Gough and J. S. bell studied the mechanical mechanism of hole wall collapse, pointed out that this is the result of rock shear fracture caused by stress concentration around the hole wall, and elaborated the principle of in-situ stress measurement of hole wall collapse method (Gough and Bell 1982). Therefore, the key of hole wall caving method is how to correctly observe the parameters of hole wall caving, such as orientation, shape, width and depth, and then infer the magnitude and direction of horizontal principal stress.
Ultrasonic borehole television is one of the commonly used hole wall caving measurement methods. It uses the principle of ultrasonic scanning imaging to reconstruct the hole wall image. By analyzing the image, it can roughly judge the shape, orientation, width and other parameters of the caving position. Through these parameters, the direction of horizontal principal stress can be calculated, but this method still belongs to hole wall plane imaging, and there is a certain error in judging the hole wall caving phenomenon, Moreover, the depth of hole wall collapse cannot be measured (Deng et al., 2011; Schuette et al., 2010; Uhlmann and Sammler 2010). At the same time, the probe in the hole usually swings, resulting in the probe not centered, which affects the ultrasonic imaging effect. In view of the above problems, this paper proposes a multi-array element ultrasonic scanning technology, which makes full use of the scanning data of the borehole wall obtained by multiple ultrasonic transducer arrays, weakens the signal interference caused by the non centering of the probe, provides the imaging quality of the horizontal section contour of the borehole wall, and realizes the high-precision measurement of the borehole contour. Multi-array ultrasonic scanning technology can not only measure the orientation and width of hole wall collapse, but also measure the depth and borehole shape of hole wall collapse. The measurement results can be used for in-situ stress calculation of hole wall collapse method. Theoretically, the rock mass stress measurement method proposed in this paper will not be limited by the measurement depth. It will provide a new method and way for in-situ stress measurement, especially deep in-situ stress measurement, and can fully meet the needs of in-situ stress measurement of deep rock mass in Continental Scientific Drilling Program.
Multi-array ultrasonic scanning technology
Multi-array ultrasonic scanning system
According to the hardware structure of multi-array element ultrasonic scanning system, it mainly includes probe, transmission cable, depth encoder, cable winch, orifice support, integrated control box, communication cable, computer, etc. The probe is used to acquire the contour information of the hole wall in the borehole, and the transmission cable is used to realize the data communication between the ground and underground in real time. The probe is vertically suspended in the borehole through the transmission cable, and the depth encoder is placed at the borehole orifice and fixed on the orifice support. The encoder is used to record the detection depth in real time. The transmission cable passes through the depth encoder and is connected with the cable winch to realize the lifting or lowering of the optical fiber cable through the cable winch. The transmission cable is connected to the integrated control box to complete the coding and interpretation of the signal. The signal is transmitted through the communication cable and enters the computer to realize the real-time processing, display and storage of data. The structural diagram of the scanning system is shown in Figure 1A. The probe is the core component of the whole system. The probe is mainly composed of data transmission converter, core control unit, rotating power unit, multi-array transducer and electronic compass. The structural composition diagram of the probe is shown in Figure 1B.
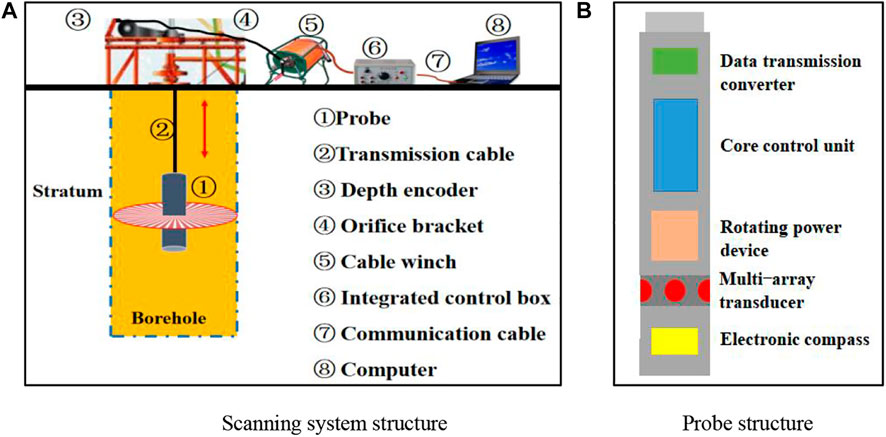
FIGURE 1. System structure.
Multi-array ultrasonic scanning technology realizes the high-precision measurement of borehole contour by making full use of the borehole wall scanning data obtained by multiple ultrasonic transducers. The basic working principle of this technology: Firstly, the multi-array element ultrasonic probe is lowered to a certain height in the borehole. Driven by the transmitting device, the multi-array element ultrasonic probe transmits ultrasonic waves to the rock wall of the borehole along the direction of various probes, and the multi-channel ultrasonic signals propagate in the fluid medium in the borehole. When the ultrasonic signal is transmitted to the borehole wall, acoustic reflection will occur at the borehole wall due to the obvious difference in the acoustic impedance of the medium inside and outside the rock wall. The receiving device of the multi-array ultrasonic probe obtains the ultrasonic reflection signal received in the corresponding direction. Then, the acoustic electric signal conversion device inside the probe converts the received acoustic signal into an electrical signal and uploads it to the ground data processing and storage device. The data processing and storage device forms the acoustic image corresponding to the borehole wall according to the characteristics of the ultrasonic wave. The rotating device drives the multi-array ultrasonic probe to rotate a certain angle in a step-by-step way to realize the horizontal circumferential rotation. Through 360° step, the full section contour scanning of the borehole at the same height can be realized. At the same time, with the cooperation of the up and down movement of the cable, the full hole acoustic scanning of the drilling hole can be carried out. Finally, the ultrasonic scanning data on different borehole walls can be synthesized and processed by different azimuth transducers, and finally the ultrasonic related data on the whole borehole wall can be processed. Based on the 3D borehole scanning data, a series of parameters of hole wall contour features can be extracted. The schematic diagram of multi-array element ultrasonic vertical section scanning is shown in Figure 2A, and the schematic diagram of multi-array element ultrasonic horizontal section scanning is shown in Figure 2B.
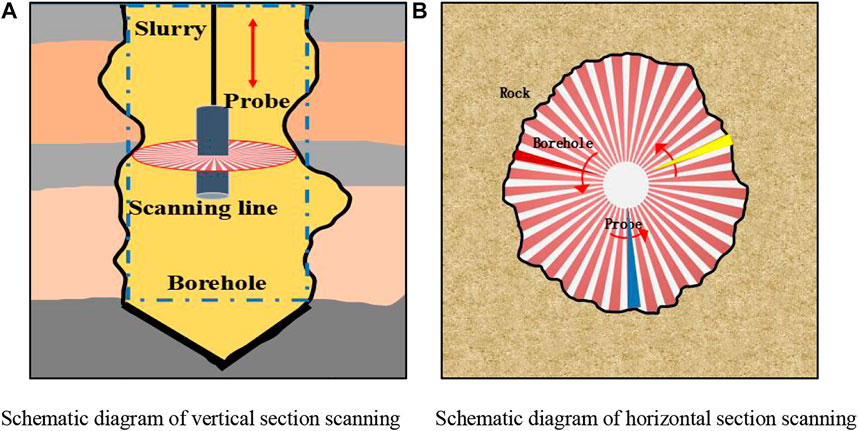
FIGURE 2. Schematic diagram of multi-array ultrasonic scanning principle.
Scanning model of borehole horizontal profile
The up and down movement of the multi-array ultrasonic scanning probe in the borehole is a free fall movement, and the borehole has the possibility of vertical inclination. The position of the probe in the borehole is usually in the position of the non borehole central axis. Therefore, it is necessary to establish a horizontal section scanning model according to the scanning data of the multi-array acoustic probe to determine the position relationship between the probe central position and the borehole. As shown in Figure 3, it is assumed that the borehole is an ideal standard circle before being affected by in-situ stress. Taking the central position of the multi-array ultrasonic scanning probe as the coordinate axis dot o, a plane coordinate system is established. The geographical east direction is taken as the positive direction of the x-axis and the geographical North direction is taken as the positive direction of the y-axis. The ideal drilling diameter of the cast-in-place pile is D, and the distance from the center of the transmitting surface of the probe to the central point of the circular ring is r. In the rectangular coordinate system, the central point of the borehole is o ', and its coordinates are expressed in (x', y'), the point closest to the vertical distance of the probe from the borehole is D1 (x1, y1), the corresponding ultrasonic array element on the probe is U1, and the distance between U1 and D1 is
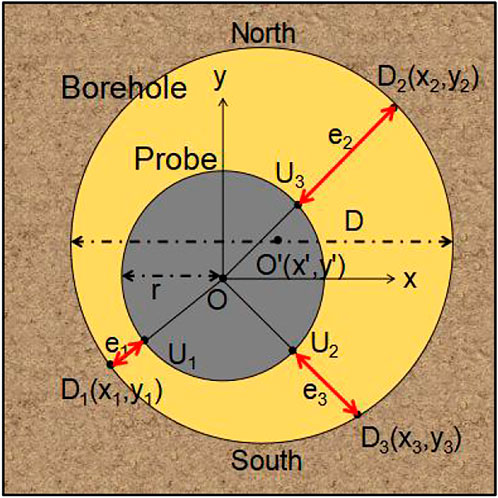
FIGURE 3. Schematic diagram of horizontal section scanning.
The corresponding relationship between the multi-array ultrasonic scanning probe and the borehole is as follows:
Since the multi-array ultrasonic scanning probe can effectively calculate the values of
Where, i = 1, 2, 3.
Through simultaneous Eqs 2, 3, the center coordinates (x ', y') of the borehole and the distance |O '| of the probe from the borehole center can be solved. The expression is:
The corresponding variable expression is:
The assumption of the horizontal profile scanning model is that the borehole is a standard circle, while the actual borehole wall is not a cylindrical surface in the strict sense, accompanied by local defects, such as borehole necking, local hole collapse, local hole expansion, local skew and so on. Therefore, during data analysis, it is necessary to search the standard circle of the data or tabulate the standard area, and the casing remaining in the borehole can be used as the calibration circle of the horizontal profile scanning model. Thus, the position of multi-array ultrasonic scanning probe in the borehole can be effectively determined, and the transmission SPPED of sound wave in the borehole can also be obtained. Its expression is:
Where DS is the diameter of the calibration circle, t1 is the arrival time of the first wave of the echo received by the ultrasonic array element U1, t2 is the arrival time of the first wave of the echo received by the ultrasonic array element U2, and R is the radius of the multi-array element ultrasonic scanning probe.
Reconstruction of horizontal profile of borehole
The contour reconstruction of the borehole can be realized independently through n multivariate scanning data
Where,
Multivariate data fusion map combines the acoustic scanning data of multi-array probe. It is necessary to normalize the multivariate data fusion map to obtain the maximum value
In situ stress measurement method of deep borehole
Based on the multi-array ultrasonic scanning technology, this paper combines the fine profile of the horizontal section of the deep borehole with the hole wall caving method to realize the in-situ stress measurement of the deep borehole and effectively improve the accuracy and efficiency of the in-situ stress measurement.
Basic principle of borehole in-situ stress measurement
Because the deep rock mass structure usually has high in-situ stress, and the depth of deep drilling is usually more than 1,000 m, the hole wall collapse is easy to occur in the deep part of drilling due to the action of high ground stress (Liu et al., 2010; Liu and Sun 2016; Wu et al., 2016). Borehole collapse refers to the phenomenon that the rock on the hole wall breaks and falls off under the action of high stress, as shown in Figure 4. Initially, only the maximum principal stress direction on the cross section of the borehole can be obtained. With the help of geophysical logging, deformation and failure mechanism of deep rock mass and laboratory test results, the stress can be estimated according to the collapse shape elements and the cohesion and internal friction angle of rock. The maximum horizontal principal stress direction of hole wall caving method is more accurate, but the calculation accuracy of stress value needs to be further improved. When there is no collapse in the borehole, the relevant in-situ stress information cannot be obtained. If the anisotropy or heterogeneity of rock is prominent, it will also bring great errors to the determination of ground stress value and orientation.
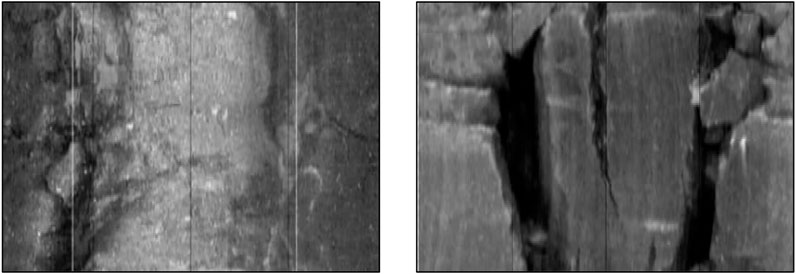
FIGURE 4. Borehole imaging of deep borehole wall collapse.
Because the multi-element ultrasonic scanning technology can not only measure the direction and width of borehole wall collapse, but also measure the borehole wall collapse depth and borehole shape, which can effectively reflect the collapse width and depth of borehole collapse area. Therefore, in order to obtain the width and depth of the borehole collapse area as shown in Figure 4, this paper first uses the multi-element ultrasonic scanning technology to scan the borehole horizontal section profile in the collapse area to form the horizontal section profile at a certain depth of the borehole, as shown in Figure 5A. Then, by scanning multiple horizontal sections of the borehole, the contour reconstruction of a specific area of the borehole can be realized, as shown in Figure 5B. Finally, through the extraction of contour feature points, the width and depth of the collapse area are calculated as shown in Figure 5C, providing data parameters for the methods described later. The specific borehole contour acquisition is the content of Chapter 2. Contour feature point extraction and data processing are analyzed and stated in detail in this chapter.
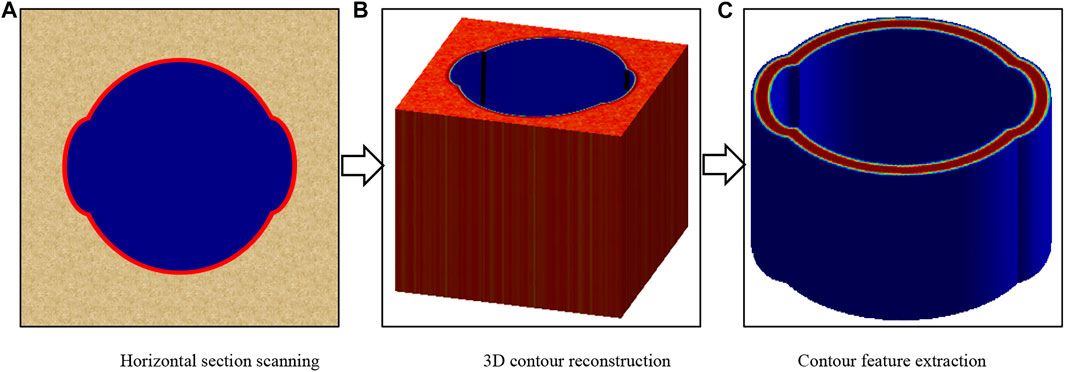
FIGURE 5. Schematic diagram for obtaining width and depth of borehole wall collapse area.
The mechanism of hole wall collapse is the rock compression shear failure caused by the stress concentration near the hole wall. This phenomenon occurs at the position with the maximum tangential stress, and the collapse direction is consistent with the direction of the minimum horizontal principal stress. Before drilling, the stress is in equilibrium. After drilling, the original rock stress balance around the borehole is destroyed. In order to maintain the balance, the stress on the borehole wall is redistributed. For a circular hole in an infinite, uniform and isotropic elastic thin plate, when it receives the maximum and minimum horizontal principal stress, the stress distribution near the hole wall can be solved according to Kirsch equation, and its expression is:
Where:
If ΔP becomes smaller,
Where:
Where: θ corresponds to the specific angle of point M. If the borehole wall collapse width θb is known, θ corresponds to the specific angle of point M can be solved according to Eq. 11. At this time, the tangential stress
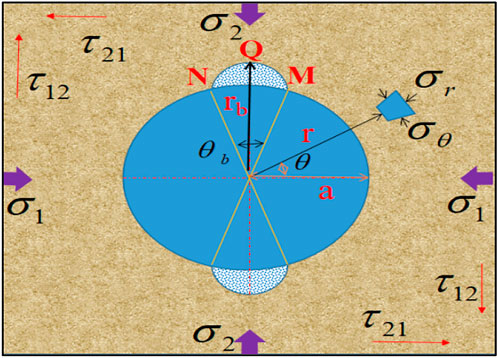
FIGURE 6. Schematic diagram of circumferential stress state of borehole cross section.
Experimental test and data processing
In order to verify the accuracy of multi-array ultrasonic scanning technology to obtain the width and depth of hole wall collapse, indoor physical simulation experiments were carried out for data processing and analysis. The equipment used in the physical simulation test experiment is the multi-element ultrasonic scanning equipment independently developed by Institute of Rock and Soil Mechanics, Chinese Academy of Sciences. The physical diagram of the equipment is shown in Figure 7A. The equipment has three ultrasonic array element transducers, and the frequency of the ultrasonic transducer is 1 MHz. The physical test object is the calibrated borehole after rock processing. Two symmetrical circular grooves are made in the standard circular borehole to simulate the deformation state of the borehole under external force. The diameter of the round hole of the test model is 120mm, the depth rb is 63mm, and the collapse width of the hole wall θb is 60°, rock bonding force
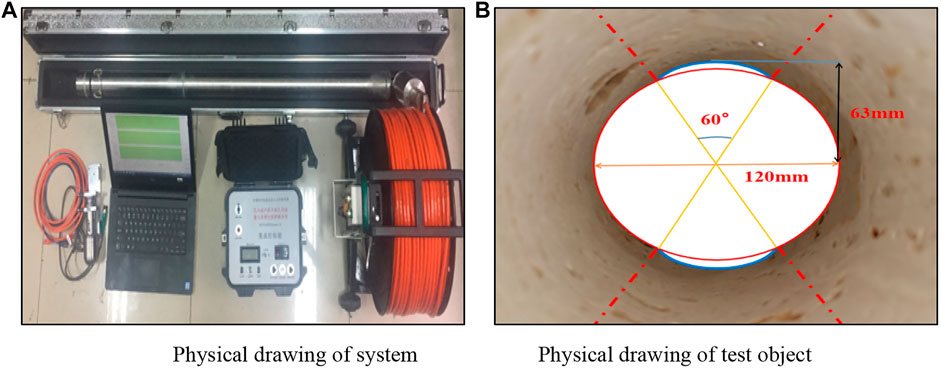
FIGURE 7. Indoor physical test.
The specific working steps of indoor physical test are as follows: fill the borehole with purified water, lower the probe into the borehole, and after the probe is lowered to the depth a in the borehole, the integrated control box will supply power and command control for the probe. The multi-array ultrasonic probe starts to scan the borehole horizontally. After receiving the rotation command from the control system, multiple ultrasonic transducers rotate in a step-by-step manner from the set orientation and rotate horizontally in a clockwise direction at every fixed angle. After each rotation to a fixed angle, multiple ultrasonic transmitting transducers transmit pulse signals to the rock wall surface for ultrasonic scanning of multiple rock wall scanning points. Multiple ultrasonic receiving transducers receive the reflected echo signal corresponding to the direction, and the parameters such as multiple transmission signals, echo signals, azimuth signals and control signals are transmitted to the ground system through the transmission cable. Then, the multi-element ultrasonic probe mechanically rotates a step angle and continues the above process until the 360° scanning of the whole horizontal section profile at the coverage depth A. After completing the horizontal profile scanning of the drilling profile at depth a, change the length of the transmission cable, and the transmission cable moves the probe upward to the depth of the test section B to realize the horizontal profile scanning at drilling depth B. Then, complete the full horizontal section contour scanning of the borehole at the borehole depth C. Finally, through computer data analysis and data processing, the contour fine reconstruction of multiple depth horizontal sections of borehole is realized. The schematic diagram of the test process is shown in Figure 8A, and the borehole contour scanning diagram of the horizontal section at depth B is shown in Figure 8B.
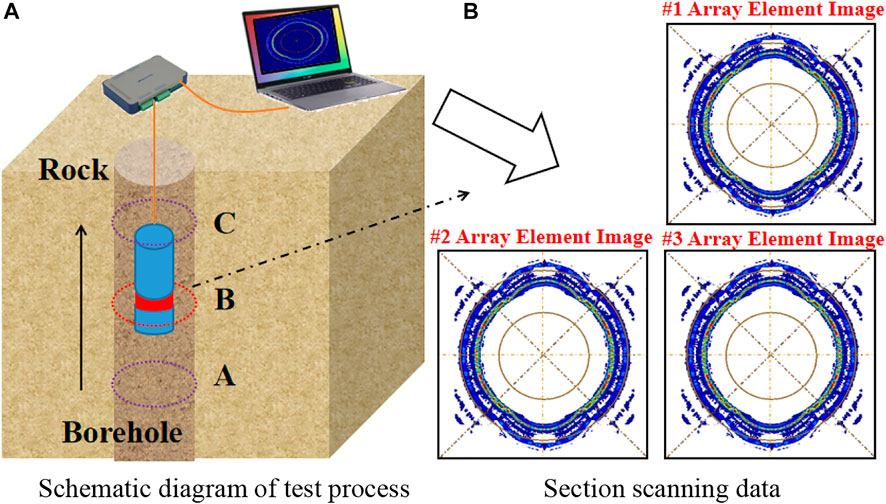
FIGURE 8. Test process and scanned image.
According to the borehole horizontal profile scanning model constructed in this paper, the data obtained by three ultrasonic array elements are synthesized, and the three scanned images of the same section are fused. The results are shown in Figure 9A. On the circumferential scanning image synthesized by multiple array elements, take the position of the probe determined by the multiple array metadata as the central origin, establish a plane rectangular coordinate system, and add several sound beam search scanning lines, as shown in Figure 9B, in which the number is N and the included angle between the sound beam search scanning lines is two Π/N. At depth B, the first wave detection distance of ultrasonic sound beam corresponding to the I sound beam search scanning line is Lh,i. In calculating the acoustic wave transmission time corresponding to Lh,i, the arrival time of the first wave is calculated according to the characteristics of relatively large energy of the first wave beam. In order to minimize the time of real-time operation of searching the maximum energy interval, the energy center convergence method is adopted. Firstly, at depth B, the ultrasonic beam w corresponding to the i beam search scan line is divided into four sub windows, the energy of each sub window is calculated, and then two are added and combined into three new sub windows. The sub window corresponding to the one with the largest energy in the new sub window is W ′, repeat the above iterative steps, and after the iteration is terminated, further move the sub window on the time axis to find a more accurate area with the largest energy value. According to the principle of energy center, the arrival time T of the first wave is:
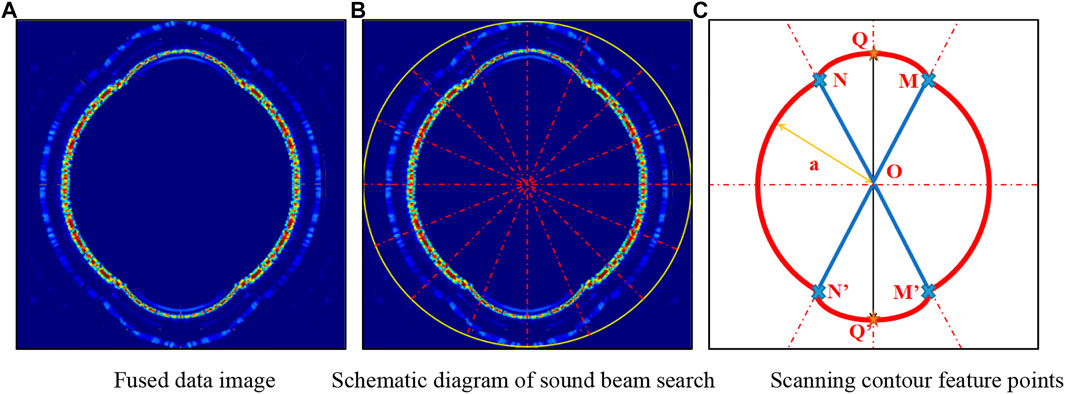
FIGURE 9. Scanned data image.
In the above formula,
In the above formula,
Calculation results and analysis
The stress
The solution is,
The solution is,
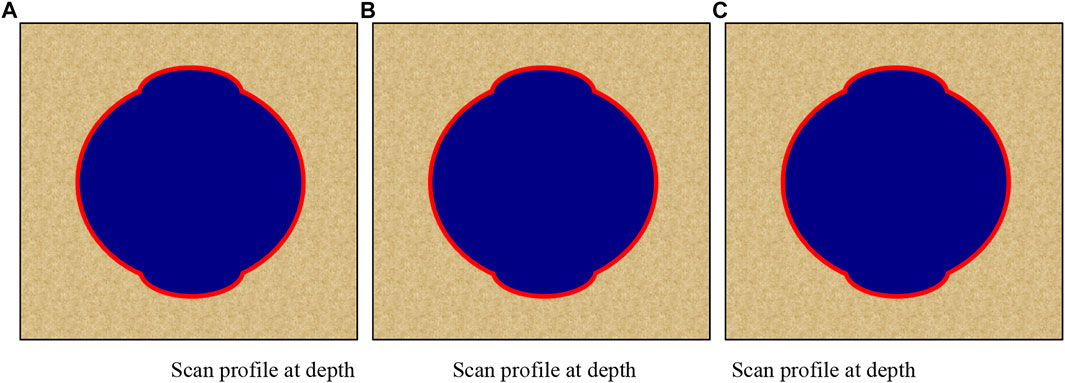
FIGURE 10. Scanning contour at different depths. (A) Scan profile at depth A. (B) Scan profile at depth B. (C) Scan profile at depth C.
In terms of quantitative analysis, the collapse width and depth of hole wall rock mass obtained at depths A, B and C are compared with the physical model. The comparison results of collapse width are shown in Figure 11A, and the comparison results of collapse depth are shown in Figure 11B. As can be seen from Figure 11A, the collapse width of boreholes at depths A, B and C is basically the same as that of the physical model. This is mainly because the equipment adopts high-resolution electronic azimuth compass, combined with multivariate data correction, and has high directional scanning characteristics, so that the starting and ending positions of collapse width can be accurately reflected. The consistency of multiple measurement results also verifies the repeatability reliability of this technology. It can be seen from Figure 11B that the borehole caving depth at depths A, B and C is basically the same, and is consistent with the size of the physical model, with occasional small deviation. This is mainly due to the accidental error in the process of acoustic signal acquisition. Combined with the multivariate data correction of this technology, the measurement accuracy of caving depth can be significantly improved, with an error of about 0.02%, which has little impact on in-situ stress measurement. The multiple measurement results of borehole collapse depth also verify the correctness and repeatability of this method.
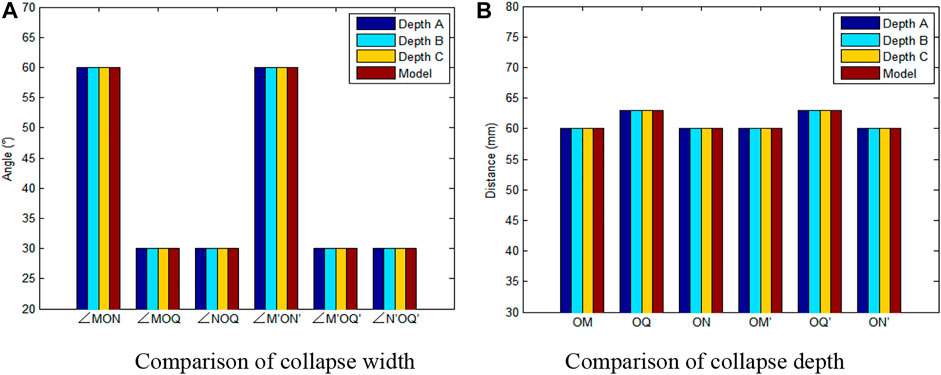
FIGURE 11. Comparison of collapse.
The horizontal section contours at depths A, B and C are interpolated and fitted to form a three-dimensional morphology image of the model, as shown in Figure 12A. From the Figure 12A, it can be seen that the characteristics of the model are consistent with the actual physical model. In order to verify the superiority of this method, the results of multi-array element processing in this paper are compared with the results of single array metadata. The results of single array metadata formation are shown in Figure 12B. From Figure 12B, it can be seen that the single array element scanning diagram can reflect certain scanning area features, but the influence of multiple echoes and interference waves is more prominent, so it is difficult to extract effective echo signals, resulting in low accuracy of each horizontal contour feature curve extracted, It can not realize the fine reconstruction of contour features, which verifies the superiority of multi-array ultrasonic scanning technology and method in this paper.
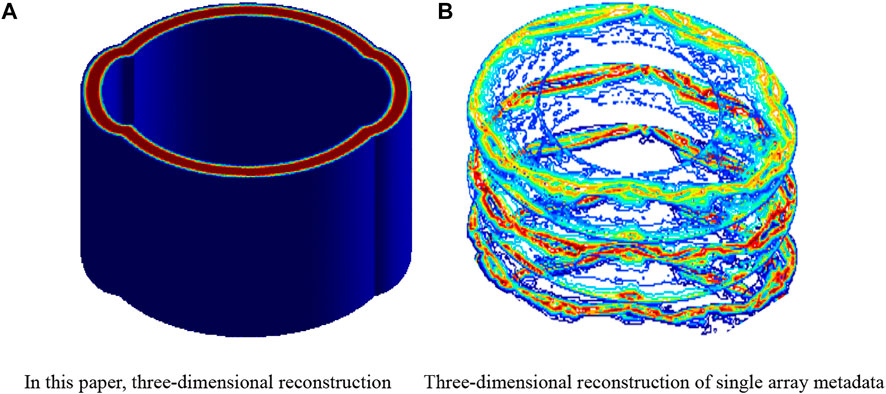
FIGURE 12. Comparison of three-dimensional reconstruction between this method and single array element method. (A) Three-dimensional morphology image. (B) Single array metadata formation.
In order to improve the accuracy and efficiency of deep in-situ stress measurement, based on multiple full waveform scanning signals obtained by multi-array element ultrasonic scanning equipment, a deep borehole in-situ stress measurement method based on multi-array element ultrasonic scanning technology is proposed. The advantage of multi-element ultrasonic scanning technology lies in the fine reconstruction of the horizontal section contour of the hole wall, which can realize the accurate measurement of the collapse width and depth of the hole wall, so that the method is feasible and accurate in theory. This technology also has some limitations. If there is no fluid medium in the borehole, the attenuation of ultrasonic signal in the air is very fast, and the ultrasonic transducer is difficult to effectively collect the reflected echo signal of the borehole wall. In addition, if the fluid medium in the borehole is uneven, the acoustic propagation characteristics of ultrasonic will also change, and the technical results of this method may have deviation. However, due to the use of multi-array signal, the number of ultrasonic array elements can be appropriately increased or data correction can be used to improve the accuracy of measurement results. In general, in the deep in-situ stress measurement, this technology uses geological drilling to scan the contour of the hole wall at different depths, effectively identify the collapse area of the hole wall, and estimate the in-situ stress size and direction at different positions of the deep formation in combination with the calculation method in this paper. Because this method can quickly calculate the horizontal in-situ stress of borehole rock mass at different depths, through the contour scanning of different depths, it can efficiently present the in-situ stress distribution of the whole borehole, realize the three-dimensional visualization of the in-situ stress distribution of the whole borehole, provide effective data support for deep underground engineering, and have a broad development space.
In addition, the key basis of this study is to assume that the collapse width and depth are related to stress, which requires accurate measurement of borehole deformation under pressure. In fact, the borehole shape is usually irregular, often accompanied by cracks, grains and other phenomena. Therefore, it is necessary to identify and distinguish the characteristics of borehole wall collapse caused by in-situ stress, so as to determine whether the borehole deformation is caused by stress. According to the mechanical mechanism analysis of borehole collapse ellipse formation, we summarize the characteristics of the collapse ellipse as follows: 1) The cross section of the borehole has an obvious long axis direction. The contour diameter of a small part of the area is obviously larger than the borehole diameter, while the contour diameter of most areas is close to or equal to the borehole diameter. 2) The elliptical borehole section has a certain length in depth. At different depths of the same borehole, the caving hole section is sometimes short, several meters or tens of meters, sometimes quite long, up to tens of meters or even hundreds of meters, but its long axis direction is basically unchanged. 3) For elliptical borehole sections formed by fault fracture zones and high angle natural fractures, because they are similar in shape on the well diameter curve, it is difficult to distinguish the true from the false. It is necessary to analyze them with the help of other technical means to divide the hole sections and eliminate them. In order to improve and solve this problem, relevant research will be further carried out in the follow-up research work to realize the collapse feature recognition under the complex geological borehole environment.
Conclusion
The main conclusions are as follows: 1) This technology can effectively overcome the influence of the transparency of the propagation medium in the borehole on the visualization of the borehole wall compared with the conventional technology. The horizontal profile scanning model of borehole can quantitatively calculate and analyze the collapse area caused by local in-situ stress; 2) The effective fusion of multi-array ultrasonic full waveform scanning signals and the reconstruction of horizontal section contour are adopted, which can break through the limitations of the conventional in hole probe that needs to be placed in the middle and the sound velocity calibration of the medium in the borehole, and improve the fine reconstruction and accurate measurement of 360° wall shape; 3) The multi-array element ultrasonic scanning technology can obtain the borehole shape data at any depth, which can realize the measurement of borehole wall three-dimensional shape. It has the feasibility of theory, method and technology in the borehole wall caving in-situ stress measurement, which can provide a new technical means for the three-dimensional detection of the borehole wall and in-situ stress measurement.
Data availability statement
The original contributions presented in the study are included in the article/supplementary material further inquiries can be directed to the corresponding author.
Author contributions
JW: Methodology, writing—review and editing. CW: Supervision. JH: Review. ZH, WZ, and YW: Investigation.
Funding
This work was supported by the National Natural Science Foundation for the Youth of China (Grant No.41902294); the Science and Technology Project of Hubei Provincial Department of Natural Resources (Grant No. ZRZY2022KJ08); the Systematic Project of Guangxi Key Laboratory of Disaster Prevention and Engineering Safety (Grant No.2019ZDK053).
Acknowledgments
The authors would like to express deep gratitude to the editors and reviewers for their valuable comments and suggestions that greatly improved this paper.
Conflict of interest
The authors declare that the research was conducted in the absence of any commercial or financial relationships that could be construed as a potential conflict of interest.
Publisher’s note
All claims expressed in this article are solely those of the authors and do not necessarily represent those of their affiliated organizations, or those of the publisher, the editors and the reviewers. Any product that may be evaluated in this article, or claim that may be made by its manufacturer, is not guaranteed or endorsed by the publisher.
References
Amadei, B., and Stephansson, O. (1986). Rock stress and its measurement, 1. London: Centek Publishers, 95–116. [S.l.].
Bai, X., Zhang, D.-m., Wang, H., Li, S.-j., and Rao, Z. (2018). A novel in situ stress measurement method based on acoustic emission kaiser effect: A theoretical and experimental study. R. Soc. open Sci. 5 (10), 181263. doi:10.1098/rsos.181263
Deng, Z., Yao, C., and Jia, Y. (2011). Application of ultrasonic detection to quality testing of super-deep foundation concrete cutoff wall. Water Resour. Hydropower Eng. 11 (42), 69–73. doi:10.13928/j.cnki.wrahe.2011.11.021
Gough, D. I., and Bell, J. S. (1982). Stress orientations from borehole wall fractures with examples from Colorado, east Texas, and northern Canada,east Texas,and northern Canada. Can. J. Earth Sci. 19 (7), 1358–1370. doi:10.1139/e82-118
Han, Z., Wang, C., and Zou, X. (2018). Application of borehole stereo pair imaging technology in borehole wall caving in-situ stress measurement. J. rock Mech. Eng. 37 (A02), 4177–4183. doi:10.13722/j.cnki.jrme.2017.1192
Ji, Z. (2009). Study on in-situ stress measurement method and engineering application. Mod. Min. 487 (11), 67–69. doi:10.13207/j.cnki.jnwafu.2011.06.007
Leeman, E. (1964). The measurement of stress in rock. J. South. Afr. Inst. Min. Metallurgy 65 (12), 656–664.
Liu, J., and Sun, J. (2016). Borehole wall collapse and control in shale gas well drilling. Drill. Fluid & Complet. Fluid 33 (3), 25–29. doi:10.1016/j.jngse.2016.06.017
Liu, X., Zheng, X., and Wang, Z. (2010). Study of the silicate fluid for prevention of borehole-wall collapse and its application to drilling in carbonaceous mudstone. Geol. Explor. 46 (5), 967–971. doi:10.1145/1836845.1836984
Schuette, W. H., Shawker, T. H., and Whitehouse, W. C. (2010). Television synchronization of a real time ultrasonic sector scanner. J. Clin. Ultrasound 6 (1), 16–18. doi:10.1002/jcu.1870060106
Sun, D., Chen, Q., Li, A.-w., and Yang, Y. (2020). Anelastic strain recovery in situ stress measurement method and its application prospect in underground mines. IOP Conf. Ser. Earth Environ. Sci. 570, 042021. doi:10.1088/1755-1315/570/4/042021
Uhlmann, E., and Sammler, C. (2010). Influence of coolant conditions in ultrasonic assisted grinding of high performance ceramics. Prod. Eng. Res. Devel. 4 (6), 581–587. doi:10.1007/s11740-010-0265-y
Wang, X., and Wang, J . (2017). 3D hydraulic fracturing in-situ stress measurement method in single borehole and its application. Bull. Inst. Crustal Dyn. 1, 170–177.
Wu, M., Mouyang, Q., and Gao, J. (2016). Discussion on the mud loss and borehole wall collapse prevention in horizontal drilling in Sulige gas field. Drill. Fluid & Complet. Fluid 33 (3), 46–50. doi:10.3696/j.issn.1001-5620.2016.03.009
Keywords: deep in-situ stress, multi-element ultrasound, hole wall profile, borehole survey, ultrasonic scanning
Citation: Wang J, Wang C, Huang J, Han Z, Zeng W and Wang Y (2022) In situ stress measurement method of deep borehole based on multi-array ultrasonic scanning technology. Front. Earth Sci. 10:933286. doi: 10.3389/feart.2022.933286
Received: 30 April 2022; Accepted: 27 June 2022;
Published: 12 August 2022.
Edited by:
Fengqiang Gong, Southeast University, ChinaReviewed by:
Wenzheng Yue, China University of Petroleum, ChinaAhmed Reda, Curtin University, Australia
Copyright © 2022 Wang, Wang, Huang, Han, Zeng and Wang. This is an open-access article distributed under the terms of the Creative Commons Attribution License (CC BY). The use, distribution or reproduction in other forums is permitted, provided the original author(s) and the copyright owner(s) are credited and that the original publication in this journal is cited, in accordance with accepted academic practice. No use, distribution or reproduction is permitted which does not comply with these terms.
*Correspondence: Jinchao Wang, amN3YW5nQHdocnNtLmFjLmNu