 Ning Su
 Yuanyuan Zhao
 Guodong Ding
 Weili Duan
- 1Key Laboratory of State Forestry Administration on Soil and Water Conservation, School of Soil and Water Conservation, Beijing Forestry University, Beijing, China
- 2Yanchi Research Station, School of Soil and Water Conservation, Beijing Forestry University, Beijing, China
Dryland ecosystem services (ESs) have been severely harmed by global environmental changes and increased human activities. To improve ESs, it is necessary to understand how they interact in drylands. In this study, we selected Ordos dryland, which is situated in northern China, as the study area to assess its four key ESs—food supply (FS), carbon storage (CS), water yield (WY), and habitat quality (HQ)—and to identify the hotspots of multiple ES supply. Furthermore, we studied the constraint effects between ESs in Ordos in 2000, 2010, and 2020 and used a spatial trade-off model to map the trade-off and synergy areas of ESs from 2000 to 2010 and from 2010 to 2020. The results indicated that all four ESs in Ordos increased significantly over the study period. The hotspots for the supply of multiple ESs also increased in areal extent during this period, and the state of the regional ecological environment continued to improve. The constraint effect between ESs showed that as the CS increased, its constraint effect on WY and FS decreased and then increased, whereas its constraint effect on HQ only decreased; as the WY increased, its constraint effect on HQ decreased and then increased, and its constraint effect on FS continued to decrease; as the FS increased, its constraint effect on HQ continued to increase. From the change in the area of ESs trade-offs and synergies, there was an increase in the area of positive synergy for four pairs of ESs in Ordos, which were CS-WY, CS-HQ, WY-HQ, and FS-HQ. These findings help in establishing a scientific foundation for the management and optimization of ESs in drylands.
1 Introduction
Drylands, which cover 41% of the global land area, are defined as places with an aridity index of less than 0.65 (Fu et al., 2021). Approximately 38% of the world’s population depends on ESs from drylands for their well-being and livelihoods, and 90% of these people belong to developing countries, where they may have limited alternative resources (Lu et al., 2018). Dryland ecosystem services (ESs) are vital for human well-being and sustainable global development (Lafortezza and Chen, 2016; Huang et al., 2020). With global environmental changes and intensified human activity, drylands and the ESs required by human societies are often at risk of land degradation and natural disasters (Safriel and Adeel, 2008; Li J et al., 2020). Recognizing the relationships between different ESs in drylands lays the groundwork for regional ES improvement. This would enable humans to utilize a particular type of ES, while considering the impact on other ESs. Thus, an optimal balance could be found to maximize the benefits of paired ESs while also ensuring a long-term supply of ESs in drylands. Therefore, we studied the relationship between ESs in drylands to provide a framework for improving people’s lives and ensure the sustainable development of drylands.
Currently, there are two major categories of methods for studying the interactions between ESs: spatial overlay analysis and statistical analysis (Yu and Hao, 2020). Spatial overlay analysis studies the spatial consistency of possible relationships between different ESs (Qiu et al., 2018). Deng et al. (2021), for example, used spatial overlay analysis to identify the spatial distribution of ESs’ relationships in the Xiangjiang River Basin, China, and found that synergistic interactions spatially dominated the ESs in the region. Spatial overlay analysis was realized using the GIS spatial display method, which is easy to operate and visualize. However, it is difficult to obtain quantitative relationships between the ESs.
Statistical analysis methods include correlation analysis, root mean square deviation (RMSD), and rose diagrams (Estoque et al., 2017; Yu and Hao, 2020). Correlation analysis, including Pearson’s and Spearman’s correlation analyses, is a widely used method for exploring relationships between different ESs. Scholars often define a relationship between two ESs with a positive correlation coefficient as a synergistic relationship, whereas the one with a negative correlation coefficient is referred to as a trade-off relationship (Bennett and Balvanera, 2007). Correlation analysis simplifies the relationships between ESs and exhibits a linear relationship. However, in many cases, the relationship between ESs is not a simple linear relationship but a nonlinear relationship caused by the combined action of multiple factors (Hao et al., 2017; Shen et al., 2020; Liu et al., 2021). When numerous datapoints are used, the scatter points’ distribution resembles clouds, and traditional correlation analysis methods cannot clarify these interactions between ESs. More recently, the constraint line method has proven to be suitable for identifying and studying nonlinear relationships between different ESs (Hao et al., 2017; Jiang et al., 2018; Hao et al., 2019; Qiao et al., 2019). The constraint line method, as opposed to the traditional correlation analysis method, more clearly reveals the relationship between the limiting and response variables in complex ecosystems under the combined effect of multiple factors, which provides a new way of studying the interaction process between different ESs (Liu and Wu, 2021).
Ordos City, located in a typical and representative dryland area in China, has an arid climate, low vegetation coverage, a vulnerable ecosystem, and poor resistance to external intervention (Zhao et al., 2017). Ordos City possesses the hinterland of Mu Us Sandy land, one of China’s most severely degraded land regions (Wu et al., 2015). Since the 1950s, the local government has worked to restore the degraded land and support ESs (Wang et al., 2022). Scholars conducted research on Ordos and found that the desertification process has obvious negative impacts on ESs, while ecological restoration practices such as aerial seeding help in improving regional ESs (Liu et al., 2018; Zhang et al., 2018; Zhou et al., 2020). These studies are essential for understanding ESs in Ordos. However, the relationships between ESs are mainly based on the correlation analysis method. The spatial patterns of the trade-offs and synergies of the ESs have also not been studied adequately.
Therefore, we analyzed the constraint effects between paired ESs and explored the geographical distribution and dynamic changes of trade-offs/synergistic relationships between paired ESs, so as to have a more comprehensive understanding of Ordos ESs. The main purpose of this study was to quantify the spatial and temporal patterns of key ESs [i.e., food supply (FS), carbon storage (CS), water yield (WY), and habitat quality (HQ)] in Ordos and to use the constraint line method to study the constraint effects between paired ESs, and to use a spatial overlay analysis method to study the spatial distribution of trade-offs and synergistic relationships between ESs. We focused on the following three issues: 1) how did the key regional ESs change in space and time from 2000 to 2020? 2) What are the constraint effects between key regional ESs? 3) How are the trade-offs and synergistic relationships between key regional ESs distributed spatially? The results of this study have great significance for the sustainable development and management of dryland ESs.
2 Methods
2.1 Study Area
Ordos City (37°35′-40°51N, 106°42′-111°27E) is situated in the southwestern part of Inner Mongolia Autonomous Region, China, and covers an area of 86,700 km2 (Figure 1). Ordos has a high altitude in the northwest and slopes down in the southeast, with the Yellow River alluvial plain region located to the north, a hill and gully region to the east, an undulating plateau region in the west, the Hobq Desert in the center, and Mu Us Sandy Land in the south. The climate in the region is temperate continental with the mean annual precipitation in the range of 300–400 mm, the mean annual temperature being 5.3–8.7°C, and an aridity index of 0.2–0.3 (Wu et al., 2017). The region is located in a transitional area from semi-arid to arid, from the wind-sand plateau to the Loess Plateau, and in the farming-pastoral region (Dong et al., 2019).
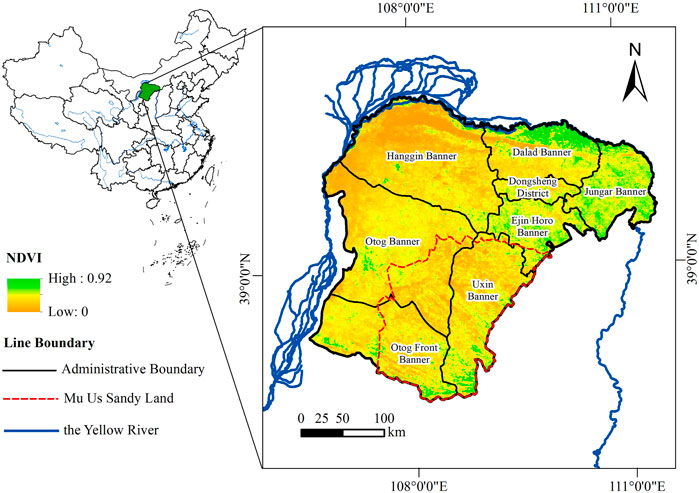
FIGURE 1. Location of the study area.
In 2020, the GDP of Ordos was RMB 353.37 billion (US$ 52.95 billion), accounting for one-fifth of that of the Inner Mongolia Autonomous Region, China, and 80% of which came from coal mining (Dong et al., 2019). The GDP per capita was RMB 164,100 (US$ 24,582.18), which is the highest in the Inner Mongolia Autonomous Region, China. With rapid economic development, wind erosion and increased land desertification have severely affected Ordos due to the dry environment and the destruction of land cover by resource exploitation. Land desertification, sandstorms, soil erosion, pasture degradation, and resource exploitation have rendered the region’s ecosystem very vulnerable. Therefore, the local government has implemented ecological restoration measures, such as grazing prohibition, the Natural Forest Protection Program, the Three-North Shelter Forest Program, and the establishment of ecological natural restoration areas (Zhao et al., 2017). At present, a more mature sandy land and desert control model has been developed, and a historical transformation of desertification from severe deterioration to overall containment has been achieved (Zhao et al., 2022).
2.2 Data
Using the Global Land 30 data product (http://www.globallandcover.com), we obtained land use/cover data for the years 2000, 2010, and 2020. This data product was created using mostly 30-m multispectral images from Landsat (United States) and HJ-1 (China) with a total accuracy of 85.72%, a kappa coefficient of 0.82 (Chen et al., 2015). It included ten land use/cover classes. To facilitate the assessment of ESs, we combined land cover types into six categories: cropland, woodland, grassland, water area, built-up land, and unused land (Figure 2). The yearly precipitation and potential evapotranspiration datasets were all from the National Earth System Science Data Center (http://www.geodata.cn), with a unit of 0.1 mm and a spatial resolution of 0.0083333°. Soil data was obtained from the Harmonized World Soil Database version 1.2 (https://www.fao.org/home/en/). The database contains data on soil type and root depth on a scale of 1:1,000,000 (Wieder et al., 2014). NDVI data were derived from China’s 1-km resolution yearly NDVI spatial distribution dataset (https://www.resdc.cn/). The yearly dataset was produced based on the monthly data at a SPOT/VEGETATION PROBA-V resolution of 1 km (http://www.vito-eodata.be). The data on administrative boundaries, roads, and rivers in the study area were at a scale of 1:1,000,000, and was provided by the National Geomatics Center of China (http://www.ngcc.cn/ngcc/). The socio-economic statistics data were obtained from the “Statistical Bulletin of National Economic and Social Development of Ordos City” and the “Statistical Yearbook of Ordos City.” The geographic data were unified to a spatial resolution of 30 m for this study.
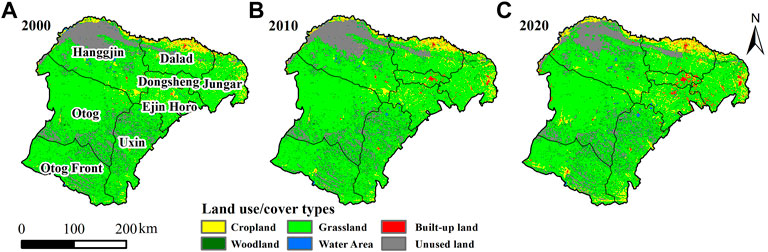
FIGURE 2. Land use/cover distribution in Ordos (A) 2000 (B) 2010 (C) 2020.
2.3 Quantification of ESs
Based on the natural conditions and socio-economic characteristics of the region, and previous studies related to ES assessment, we selected four ESs for assessment that were closely related to human well-being in the region (Jia et al., 2014; Wu et al., 2017; Lan et al., 2021). Specifically, these included FS, CS, WY, and HQ.
We spatially allocated the statistical data in the cells of a 30 × 30 m grid to assess the FS capacity of the region. Grain and meat production were allocated to cropland and grassland, respectively, according to NDVI (Li et al., 2012; Wu et al., 2017). The equation used is as follows:
where
We used the Integrated Valuation of Ecosystem Services and Tradeoffs (InVEST) model to assess the CS, WY, and HQ. The InVEST model theoretically considers the intrinsic ESs’ mechanisms and is currently a widely used tool for simulating ESs’ supply (Tallis et al., 2013). To assess CS, we obtained the carbon density data of different carbon pools from related studies (Liang et al., 2017; Zhao et al., 2019; Li et al., 2021b). Because precipitation significantly affects biomass and soil carbon density (Alam et al., 2013), we made corrections for biomass and soil carbon density based on precipitation. The equations were as follows:
where
The WY module in the InVEST model could be expressed as follows:
where
The assessment of HQ should establish threat sources according to the characteristics of the study area. Ordos City is seriously threatened by desertification. Meanwhile, the growth of built-up land will have a detrimental effect on the natural environment (Liu et al., 2021; Peng et al., 2022), and expanding croplands, which are semi-artificial environments, will also pose a threat to the ecosystem (Yang, 2021). Based on this, we set cropland, built-up land, and sandy land as threat sources. The principle of the HQ module in the InVEST model is as follows:
where
2.4 Identification of Hotspots With Multiple ESs’ Supply
To quantify the regional ESs’ supply capacity, we considered areas where FS, CS, WY, and HQ exceeded their annual averages as representative of hotspots for that type of ES supply (Wu et al., 2017). Category 0 represents non-hotspot areas (i.e., areas where all four ESs are below their own average for the year). Category I, II, and III service hotspots represent areas with one, two, and three ESs exceeding their average for the year, respectively. We used ArcGIS 10.2 for the spatial mapping of multiple ES supply hotspots.
2.5 Quantification of the Relationships Between ESs
2.5.1 Quantification of Constraint Effects Between Paired ESs
Different types of ESs have different physical quantities at the same location within a region. The physical quantity of one ES was used as the horizontal coordinate, and the physical quantity of the other ES was used as the vertical coordinate to obtain a scatter cloud in a two-dimensional coordinate department. Traditional regression and correlation analyses do not adequately explain the scatter in terms of ecological mechanisms and are not applicable to a study of the relationship between two variables that are distributed in such a scattered cloud. However, in a complex ecosystem with multiple factors acting together, the constraint line can indicate the limiting effect of the limiting variable on the response variable such that the response variable does not exceed a certain range (Webb, 1972). Therefore, we used the constraint line method to investigate the constraint effects between FS, CS, WY, and HQ in Ordos City for 2000, 2010, and 2020. Constraint lines were extracted in four ways: the parametric, scatter cloud grid, quantile regression, and quantile segmentation methods (Hao et al., 2016). The quantile segmentation method has a stronger statistical basis compared to the other three (Mills et al., 2009). Therefore, we utilized quantile segmentation to obtain the constraint lines. We first drew a scatter plot between two ESs, divided the x-axis into 100 groups equally according to their range of values, selected the 99% quantile of each group as the boundary points, and finally fit the extracted boundary points to obtain the constraint line. Combining previous research (Hao et al., 2017) and the results of this study, we categorized the common types of constraint effects between paired ESs into the following six types: hump-shaped, U-shaped, positive linear, negative linear, positive convex, and negative convex (Figure 3).
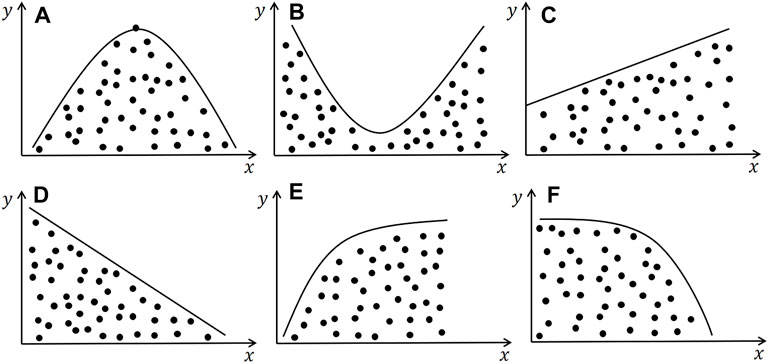
FIGURE 3. Types of constraint lines between ESs. (A) Hump-shaped curve; (B) U-shaped curve; (C) positive linear line; (D) negative linear line; (E) positive convex curve; (F) negative convex curve. (Modified from Lester et al., 2013; Hao et al., 2017).
2.5.2 Identification of Trade-off and Synergy Regions for ESs
The spatial trade-off model was used to analyze the spatial distribution of trade-offs and synergistic relationships among FS, CS, WY, and HQ in Ordos City from 2000 to 2010 and from 2010 to 2020. We calculated the difference in physical quantities of a certain ES between the start and end years at the same location. Based on the changes in the two different types of ESs at the same location, we determined the trade-off and synergy between the two at the location. The formula used is as follows:
where
3 Results
3.1 Spatiotemporal Patterns of Regional ESs
The ESs in Ordos showed obvious spatial heterogeneity, and all four ESs demonstrated an upward trend from 2000–2020 (Figure 4; Table 1). FS showed a spatial distribution pattern in which Ejin Horo, Jungar, and Dalad Banner were higher, and the rest of the regions were relatively lower, with the average FS in Ordos increasing by 171.97%. FS in Otog Front Banner increased the most, by 363.07%. CS showed a spatial distribution pattern in which the Hobq Desert and the Mu Us Sandy Land were lower, while the rest of the regions were relatively higher. The average CS in Ordos increased by 6.64% and that in Hanggin Banner increased the most, by 14.66%. WY had a progressive rise from west to east in terms of spatial distribution. The average WY in Ordos increased by 100.19% and that in Otog Banner increased the most, by 116.50%. The spatial distribution pattern of HQ was similar to that of CS. In the Hobq Desert and the Mu Us Sandy Land, both of them have many low values, but the difference was that HQ also had many low values around Dongsheng District, the main urban area. The average HQ in Ordos increased by 3.42% and that in Hanggin Banner increased the most, by 15.31%.
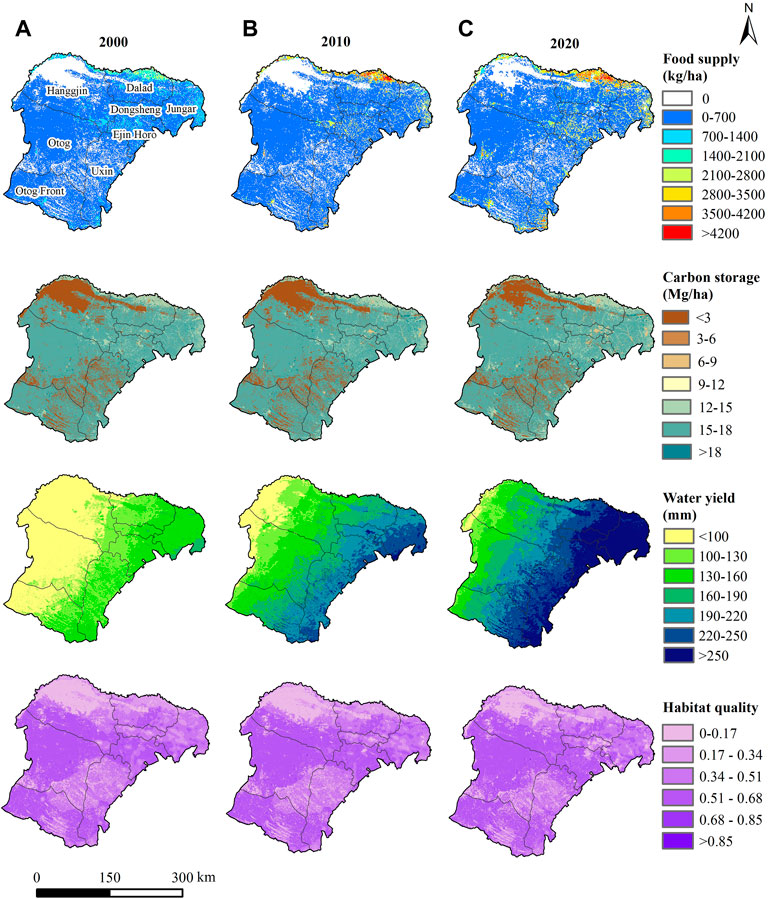
FIGURE 4. Spatial Distribution of ESs in Ordos (A) 2000 (B) 2010 (C) 2020.
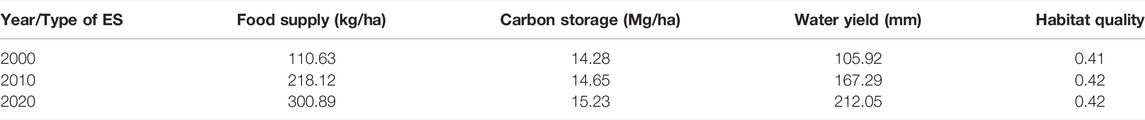
TABLE 1. Change in average ESs of Ordos from 2000 to 2020.
3.2 Spatiotemporal Patterns of Multiple ES Supply Hotspots
Among the multiple ES supply hotspots in Ordos, the area of Category II service hotspot was the largest, followed by Category III and Category I (Table 2). Category II service hotspots accounted for approximately half of the total land area in Ordos, which were mainly located in Otog Front and Otog Banner. Some of these categories in Otog Banner were transformed into Category III service hotspots, so the area of Category II service hotspots showed an overall downward trend from 2000 to 2010 and remained approximately unchanged from 2010 to 2020. Category III service hotspots was increasing continuously from 2000 to 2020, which were mostly found in the east of Ordos (Figure 5). Category I service hotspots had also been increasing continuously from 2000 to 2020, mainly located in the northeast of Hanggin Banner, and its land use/cover type was grassland near the edge of the Hobq Desert. The area of non-hotspots decreased continuously from 2000 to 2020, and most of them were found in the northwestern portion of the Hanggin Banner.
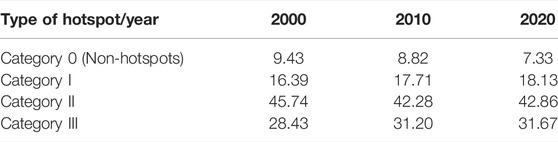
TABLE 2. Area proportion of each hotspot category in 2000, 2010, and 2020 (%).
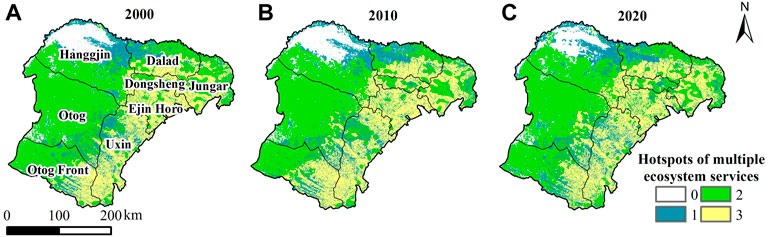
FIGURE 5. Hotspots of multiple ES supply in Ordos (A) 2000 (B) 2010 (C) 2020.
3.3 Constraint Effects Between Paired ESs
The constraint effects between paired ESs in Ordos were mainly expressed as positive convex, positive linear, hump-shaped, or U-shaped (Figure 6). The constraint effect of CS on HQ was positive convex and similar over the 3 years. With an increase in CS, the constraint effect on HQ gradually decreased, and HQ gradually increased. The constraint effect of WY on FS was positive linear. With an increase in WY, the constraint effect on FS gradually decreased, and FS gradually increased.
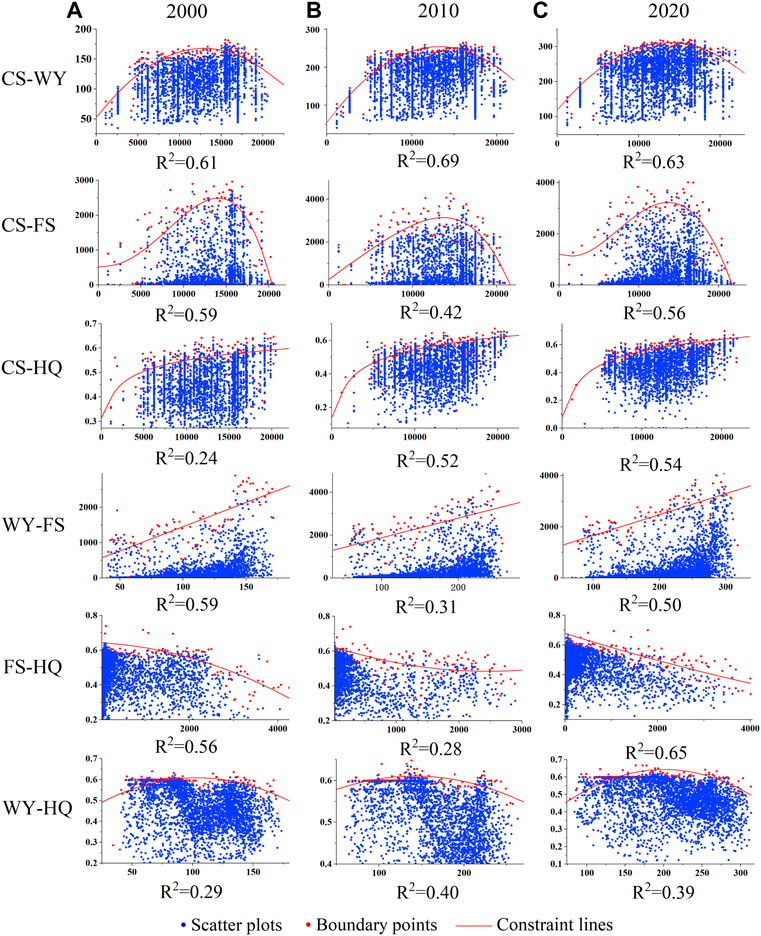
FIGURE 6. Constraint effects between paired ESs in Ordos (A) 2000 (B) 2010 (C) 2020.
The constraint effects of CS on WY and FS were hump-shaped and exhibited significant peaks. With an increase in CS, its constraint effect on WY and FS first decreased and then increased. The constraining effect of CS on WY and FS gradually decreased as the CS increased, until the CS exceeded thresholds, and the constraint effect on WY and FS gradually increased with the increase in CS. The constraint effect of WY on HQ was also hump-shaped but with relatively small ups and downs. With the increase in WY, its constraint effect on HQ first decreased and then increased; when WY did not exceed thresholds, its constraining effect on HQ gradually decreased as WY increased, and when WY exceeded thresholds, its constraint effect on HQ gradually increased with the increase in WY.
The constraint effect of FS on HQ was hump-shaped in 2000 and U-shaped in 2010 and 2020. Notably, the peaks of both the hump and U-shaped curves were insignificant and showed a significant downward trend overall. With an increase in FS, the constraint effect on HQ gradually increased, and HQ gradually decreased. The constraint effect of FS on HQ increased at the fastest rate in 2020.
3.4 Spatial Distribution of ES Trade-offs and Synergies in Different Periods
The relationship between CS and WY was mainly positive synergy from 2000 to 2010 (Figure 7), and the area of positive synergy covered 91.29% of Ordos; the area of positive synergy continued to expand from 2010 to 2020, and its area proportion reached 98.69%. The relationship between CS and FS was mainly positive synergy from 2000 to 2010, and the area proportion of positive synergy was 73.47%. The relationship between CS and FS in 2010–2020 was mainly expressed as a trade-off, with a trade-off area proportion of 64.27%, and the main land use/cover type of both trade-off and synergy areas was grassland. The area of the uncorrelated relationship between CS and HQ covered more than 80% of Ordos from 2000 to 2010, and the area of positive synergy accounted for 6.01%, mainly distributed in Hanggin Banner, which increased significantly from 2010 to 2020, with an area proportion of 46.64%. The increased areas were mainly distributed in Jungar, Otog, Ejin Horo, and Otog Front Banner, and the land use/cover type was primarily grassland.

FIGURE 7. Spatial distribution of ES trade-offs and synergies in Ordos from 2000 to 2020.
The relationship between WY and FS was mainly a positive synergy in 2000–2010 and a trade-off in 2010–2020. The relationship and changes between CS and FS were similar to those between WY and FS. From 2000 to 2010, the areas of trade-off, negative synergy, and positive synergy between FS and HQ accounted for 22.33, 10.45, and 6.15% of the total area in Ordos, respectively. From 2010 to 2020, the areas of trade-off and negative synergy decreased to 7.95 and 0.85%, respectively, and the area of positive synergy increased significantly to 24.86%, which was primarily concentrated in the area within Hanggin Banner, where unused land was converted to grassland.
From 2000 to 2010, the area of positive synergy between WY and HQ covered 22.18% of Ordos, mostly concentrated in the eastern part of Jungar and Hanggin Banner, and the area of trade-offs covered 5.42% of Ordos, mostly concentrated in the eastern part of Uxin Banner. From 2010 to 2020, the area proportion of positive synergy and trade-off increased to 24.00 and 14.73%, respectively. The positive synergy area was mainly at the edge of the Mu Us Sandy Land and Hobq Desert, and the trade-off area was mainly distributed around the urban area, with Dongsheng District as the core.
4 Discussion
4.1 How did ESs Change in Ordos?
All the four ESs in Ordos showed a general increase in the past 20 years. As a typical example of the drylands, one of the most serious environmental problems in Ordos is desertification, which is also the main threat to the regional ESs (Fang et al., 2022). However, many research studies have found that there is a reversal trend of desertification in Ordos, especially due to the large scales of ecological restoration in the past several decades (Guo et al., 2017; Liu et al., 2020). We will then discuss the specific drivers of the improvements of four ESs.
The FS in our study included grain supply and meat supply. The increase in grain supply may be related to the promotion of improved varieties, the improvement of farming techniques, and the improvement of soil nutrients (Chen et al., 2020). For meat production, more than 80% was contributed by beef and lamb production. The increase in meat production was the combined effect of the optimization of livestock structure, the introduction of superior breeds, and the popularization of new technologies (Miao et al., 2018).
The spatial distribution of CS is primarily determined by the land use/cover type distribution (Li et al., 2022), and is lower in sandy land and desert areas. In the process of ecological restoration, the areas of sandy land and desert were converted into grassland. In addition, regional precipitation has increased continuously, and there are positive correlations between precipitation and biomass carbon and soil carbon densities (Alam et al., 2013). Therefore, under the combined effect of land use/cover change and climate change, the CS in Uxin and Hanggin Banner, where Mu Us Sandy Land and Hobq Desert are located, increased by 5.66 and 14.65%, respectively, from 2000 to 2020.
The distribution pattern of WY was mainly determined by the uneven distribution of precipitation and land cover in Ordos. From 2000 to 2020, the increasing WY of Ordos could be explained by these two factors. There were large areas of grasslands restored from bare sandy lands and desert in Ordos. Zhang et al. (2022) found that in grassland areas, WY tended to increase with increasing vegetation coverage. This is a reason for the increase in WY. In addition, according to the metrological data of Ordos, we found that the precipitation showed an overall increasing trend from 2000 to 2020, with fluctuations in the process. Therefore, changes in precipitation are another reason for the increase in WY.
The enhancement of HQ, especially in Uxin and Hanggin Banner, was mainly related to the implementation of ecological restoration measures. With the implementation of various measures to prevent and control desertification, the total area of desert and sandy land in Ordos has decreased by 24.34% during the study period, and their threat to the surrounding habitats has also decreased.
With the increase of ESs in Ordos, we found that the area of Category III service hotspots has continued to grow, with most of the new areas concentrated in Uxin and Jungar Banner. The primary factor contributing to growth was the expansion of woodlands, which play an essential role in ESs supply (Marengo et al., 2018; Li et al., 2021b). The woodland areas of Uxin and Jungar Banner increased by 175.01 and 12.11%, respectively, between 2000 and 2020. Coupled with the control of the Mu Us Sandy Land, the ecological environment has been continuously improved, so Uxin and Jungar Banner have provided more types of ESs, which is consistent with previous findings that vegetation in the Mu Us Sandy Land (partly located in Uxin Banner) continued to recover, and the ESs generally increased (Zhao et al., 2022). The Category I service hotspot region was mostly concentrated in grassland along the edge of the Hobq Desert, and its area continued to decline from 2000 to 2010. This was consistent with the shrinking trend of the edge of the Hobq Desert with the ecological construction.
4.2 How did the ESs Affect Each Other?
A constraint relationship means that the limiting variable constrains the response variable to a certain range (Webb, 1972). The assumption of constraint line analysis is that in a multivariate system, the independent variable is the only active limiting factor, regardless of the influence of other variables. The aim of constraint analysis was to determine the maximum or minimum response, not the average response as in regression analysis (Cade and Noon, 2003). There are several types of constraint curves between ESs (Figure 3), and it is worth noting that some of the constraint curves may have thresholds (e.g., hump-shaped curve and U-shaped curve). The existence of a threshold implies a change in the direction of the synergy/trade-off between paired ESs. On the two sides of the threshold, the ecosystem structure, function, and services exhibit differences, and driven by climate change and/or irrational human activities, the ecosystems could be pushed from one side of the threshold to the other (Bestelmeyer et al., 2013).
The process of constraining ESs is complex and results from the combined effects of climate, vegetation, hydrology, and anthropogenic factors (Feng et al., 2021; Wang et al., 2022). In Ordos, land use type and vegetation coverage were closely related to the constraint effect between paired ESs. For CS and WY, a previous study found that when the grassland was in relatively low coverage, WY would increase with the growth of the coverage (Zhang et al., 2022). But in woodlands, vegetation transpiration and precipitation interception increase with the growth of vegetation coverage, which can lead to a decrease in WY (Feng et al., 2016). In addition, studies also showed that the CS would increase as the vegetation coverage grows (Lan et al., 2021). Therefore, the constraint effect of CS on WY showed a decreasing synergy in grassland, and when CS reached a threshold (i.e., transition from grassland to woodland), that gradually changed to an increasing trade-off. This is consistent with previous studies, such as a study by Jia et al. (2014) which found that WY gradually decreased with increasing CS in northern Shaanxi Province after the CS reached a threshold. The constraint effect of CS on FS was similar to its effect on WY. The FS of grassland was often higher than woodland (He et al., 2020). But the CS of woodland is higher. Therefore, after the CS reached the threshold, FS decreased as CS increased. For CS and HQ, the threat source of habitat (human-induced) will decrease with the recovery of vegetation, leading to a growth in HQ.
From the change in the area of ES trade-offs and synergies, there was an increase in the area of positive synergy for four pairs of ESs in Ordos, which were CS-WY, CS-HQ, WY-HQ, and FS-HQ (Figure 7). According to the aforementioned discussion, the restoration of vegetation in Ordos led to an increase in CS, WY, and HQ. Therefore, the area of positive synergy between the former three pairs was increasing. Some studies concluded for other regions that grain supply and HQ are trade-offs (Li Z et al., 2020; Zhang et al., 2020). In this study, FS includes both grain and meat production. Grain production by cropland reduced HQ, so FS and HQ are trade-offs in cropland areas (Li Z et al., 2020). But for the meat production by grassland, its increase was mainly caused by forage production increases, resulting from the ecological construction on sandy land and desert. This could reduce the threat to the surrounding habitat and improve HQ. Thus, FS and HQ are positively synergistic in ecologically restored grassland areas (Li et al., 2017).
4.3 Implications for Ecosystem Management
The results of this study can help to develop reasonable protection measures for ESs. First, we found that when CS exceeds a threshold value, its constraint effect on WY and FS will increase, which will cause the decline of both. Therefore, we should pay attention to the threshold in ecosystem management. Second, HQ and CS are affected by land use/cover distribution. Therefore, we suggest further controlling the sandy land and desert within Hanggin and Uxin Banner and returning the cropland located in unsuitable conditions to ecological land so as to improve regional CS and HQ. Third, vegetation restoration in grasslands was an important driver of improvement in ESs. Therefore, the restoration of grassland vegetation should be further strengthened in the future to achieve a better state of ESs. These findings may help to avoid unnecessary trade-off risks between ESs and aid the design of more environmentally-friendly management policies to improve ESs in Ordos and other drylands.
4.4 Limitations and Future Directions
There are a few limitations to this study that need to be addressed in the future. First, we selected four key ESs based on their ES importance and evaluation reliability. There were still limitations to quantify these ESs. For example, we allocated the statistical data on meat production according to NDVI in the space with relative research, but did not distinguish that from captive- or free-range livestock due to data limitations. Second, ESs such as wind erosion control service and cultural services were not evaluated due to the lack of long-term measurement data and surveys. Existing studies have mainly used the wind erosion model, such as the revised wind erosion equation, for the assessment of wind erosion control service and found that the FS and CS increased with the wind erosion modulus decline (Zhao et al., 2017). The assessment of cultural services is mostly evaluated based on a questionnaire (Cheng et al., 2019; Meng et al., 2020). Trade-offs between cultural services and provisioning services could also be detected (Turner et al., 2014). This is also a direction we will strengthen in future studies.
5 Conclusion
The ESs in Ordos City increased significantly from 2000 to 2020. In the eastern region, there are multiple hotspots of ES supply; the area of hotspots increased, and the regional ecological environment improved. Government-funded ecological restoration projects have contributed to the local revegetation and improvement of ESs. The constraint effect between ESs showed that as the CS increased, its constraint effect on WY and FS decreased and then increased, and its constraint effect on HQ continued to decrease. As the WY increased, its constraint effect on HQ decreased and then increased, and its constraint effect on FS continued to decrease; and as the FS increased, its constraint effect on HQ continued to increase. In terms of the regions where the trade-offs and synergies are distributed, four pairs of ESs develop toward positive synergies in Ordos: CS-WY, CS-HQ, FS-HQ, and WY-HQ.
Data Availability Statement
The original contributions presented in the study are included in the article/Supplementary Material; further inquiries can be directed to the corresponding authors.
Author Contributions
All the authors listed have made a substantial, direct, and intellectual contribution to the work and approved it for publication.
Funding
This study was supported by the National Natural Science Foundation of China (41971130) and the Fundamental Research Funds for Central Universities (PTYX202222 and PTYX202223).
Conflict of Interest
The authors declare that the research was conducted in the absence of any commercial or financial relationships that could be construed as a potential conflict of interest.
Publisher’s Note
All claims expressed in this article are solely those of the authors and do not necessarily represent those of their affiliated organizations, or those of the publisher, the editors, and the reviewers. Any product that may be evaluated in this article, or claim that may be made by its manufacturer, is not guaranteed or endorsed by the publisher.
Acknowledgments
The authors acknowledge the data support from the “National Earth System Science Data Center, National Science and Technology Infrastructure of China (http://www.geodata.cn).”
Supplementary Material
The Supplementary Material for this article can be found online at: https://www.frontiersin.org/articles/10.3389/feart.2022.937491/full#supplementary-material
References
Alam, S. A., Starr, M., and Clark, B. J. F. (2013). Tree Biomass and Soil Organic Carbon Densities across the Sudanese Woodland Savannah: A Regional Carbon Sequestration Study. J. Arid Environ. 89, 67–76. doi:10.1016/j.jaridenv.2012.10.002
Bennett, E. M., and Balvanera, P. (2007). The Future of Production Systems in a Globalized World. Front. Ecol. Environ. 5 (4), 191–198. doi:10.1890/1540-9295(2007)5[191:tfopsi]2.0.co;2
Bestelmeyer, B. T., Duniway, M. C., James, D. K., Burkett, L. M., and Havstad, K. M. (2013). A Test of Critical Thresholds and Their Indicators in a Desertification-Prone Ecosystem: More Resilience Than We Thought. Ecol. Lett. 16 (3), 339–345. doi:10.1111/ele.12045
Cade, B. S., and Noon, B. R. (2003). A Gentle Introduction to Quantile Regression for Ecologists. Front. Ecol. Environ. 1 (8), 412–420. doi:10.1890/1540-9295(2003)001[0412:agitqr]2.0.co;2
Chen, J., Chen, J., Liao, A., Cao, X., Chen, L., Chen, X., et al. (2015). Global Land Cover Mapping at 30m Resolution: A POK-Based Operational Approach. ISPRS J. Photogramm. Remote Sens. 103, 7–27. doi:10.1016/j.isprsjprs.2014.09.002
Chen, J., Zhou, Z., Chen, L., and Ding, T. (2020). Optimization of Regional Water-Energy-Food Systems Based on Interval Number Multi-Objective Programming: A Case Study of Ordos, China. Int. J. Environ. Res. Public Health 17 (20), 7508. doi:10.3390/ijerph17207508
Cheng, X., Van Damme, S., Li, L., and Uyttenhove, P. (2019). Evaluation of Cultural Ecosystem Services: A Review of Methods. Ecosyst. Serv. 37, 100925. doi:10.1016/j.ecoser.2019.100925
Dai, L., Li, S., Lewis, B. J., Wu, J., Yu, D., Zhou, W., et al. (2019). The Influence of Land Use Change on the Spatial-Temporal Variability of Habitat Quality between 1990 and 2010 in Northeast China. J. For. Res. 30 (6), 2227–2236. doi:10.1007/s11676-018-0771-x
Deng, C., Liu, J., Nie, X., Li, Z., Liu, Y., Xiao, H., et al. (2021). How Trade-Offs between Ecological Construction and Urbanization Expansion Affect Ecosystem Services. Ecol. Indic. 122, 107253. doi:10.1016/j.ecolind.2020.107253
Dong, T., Xiao, Y., Zhang, L., Xiao, Y., Zheng, H., and Ouyang, Z. (2019). Analysis of Driving Factors that Influence the Pattern and Quality of the Ecosystem in Ordos. Acta Eco Sin. 39 (2), 660–671. (in Chinese with English abstract). doi:10.5846/stxb201804080788
Estoque, R. C., Murayama, Y., and Myint, S. W. (2017). Effects of Landscape Composition and Pattern on Land Surface Temperature: An Urban Heat Island Study in the Megacities of Southeast Asia. Sci. Total Environ. 577, 349–359. doi:10.1016/j.scitotenv.2016.10.195
Fang, Z., Ding, T., Chen, J., Xue, S., Zhou, Q., Wang, Y., et al. (2022). Impacts of Land Use/Land Cover Changes on Ecosystem Services in Ecologically Fragile Regions. Sci. Total Environ. 831, 154967. doi:10.1016/j.scitotenv.2022.154967
Feng, C., Yang, L., and Han, L. (2021). Impacts of Climate Change on Blue and Green Water Resources in the Xiangjiang River Basin of the Yangtze River, China. Front. Earth Sci. 9, 677191. doi:10.3389/feart.2021.677191
Feng, X., Fu, B., Piao, S., Wang, S., Ciais, P., Zeng, Z., et al. (2016). Revegetation in China's Loess Plateau Is Approaching Sustainable Water Resource Limits. Nat. Clim. Change 6 (11), 1019–1022. doi:10.1038/nclimate3092
Fu, B., Stafford-Smith, M., Wang, Y., Wu, B., Yu, X., Lv, N., et al. (2021). The Global-DEP Conceptual Framework - Research on Dryland Ecosystems to Promote Sustainability. Curr. Opin. Environ. Sustain. 48, 17–28. doi:10.1016/j.cosust.2020.08.009
Guo, Q., Fu, B., Shi, P., Cudahy, T., Zhang, J., and Xu, H. (2017). Satellite Monitoring the Spatial-Temporal Dynamics of Desertification in Response to Climate Change and Human Activities across the Ordos Plateau, China. Remote Sens. 9 (6), 525. doi:10.3390/rs9060525
Hao, R., Yu, D., Sun, Y., and Shi, M. (2019). The Features and Influential Factors of Interactions Among Ecosystem Services. Ecol. Indic. 101, 770–779. doi:10.1016/j.ecolind.2019.01.080
Hao, R., Yu, D., Wu, J., Guo, Q., and Liu, Y. (2016). Constraint Line Methods and the Applications in Ecology. Chin. J. Plant Ecol. 40 (10), 1100–1109. (in Chinese with English abstract). doi:10.17521/cjpe.2016.0152
Hao, R., Yu, D., and Wu, J. (2017). Relationship between Paired Ecosystem Services in the Grassland and Agro-Pastoral Transitional Zone of China Using the Constraint Line Method. Agric. Ecosyst. Environ. 240, 171–181. doi:10.1016/j.agee.2017.02.015
He, J., Shi, X., Fu, Y., and Yuan, Y. (2020). Evaluation and Simulation of the Impact of Land Use Change on Ecosystem Services Trade-Offs in Ecological Restoration Areas, China. Land Use Policy 99, 105020. doi:10.1016/j.landusepol.2020.105020
Huang, Q., Yin, D., He, C., Yan, J., Liu, Z., Meng, S., et al. (2020). Linking Ecosystem Services and Subjective Well-Being in Rapidly Urbanizing Watersheds: Insights from a Multilevel Linear Model. Ecosyst. Serv. 43, 101106. doi:10.1016/j.ecoser.2020.101106
Jia, X., Fu, B., Feng, X., Hou, G., Liu, Y., and Wang, X. (2014). The Tradeoff and Synergy between Ecosystem Services in the Grain-For-Green Areas in Northern Shaanxi, China. Ecol. Indic. 43, 103–113. doi:10.1016/j.ecolind.2014.02.028
Jiang, C., Zhang, H., and Zhang, Z. (2018). Spatially Explicit Assessment of Ecosystem Services in China's Loess Plateau: Patterns, Interactions, Drivers, and Implications. Glob. Planet. Change 161, 41–52. doi:10.1016/j.gloplacha.2017.11.014
Lafortezza, R., and Chen, J. (2016). The Provision of Ecosystem Services in Response to Global Change: Evidences and Applications. Environ. Res. 147, 576–579. doi:10.1016/j.envres.2016.02.018
Lan, Z., Zhao, Y., Zhang, J., Jiao, R., Khan, M. N., Sial, T. A., et al. (2021). Long-Term Vegetation Restoration Increases Deep Soil Carbon Storage in the Northern Loess Plateau. Sci. Rep. 11 (1), 13758. doi:10.1038/s41598-021-93157-0
Lester, S. E., Costello, C., Halpern, B. S., Gaines, S. D., White, C., and Barth, J. A. (2013). Evaluating Tradeoffs Among Ecosystem Services to Inform Marine Spatial Planning. Mar. Policy 38, 80–89. doi:10.1016/j.marpol.2012.05.022
Li, H., Peng, J., Hu, Y., and Wu, W. (2017). Ecological Function Zoning in Inner Mongolia Autonomous Region Based on Ecosystem Service Bundles. Chin. J. Appl. Ecol. 28 (8), 2657–2666. (in Chinese with English abstract). doi:10.13287/j.1001-9332.201708.036
Li, J., Guo, Q., and Peng, J. (2012). Remote Sensing Estimation Model of Henan Province Winter Wheat Yield Based on MODIS Data. Ecol. Environ. Sci. 21, 1665–1669. (in Chinese with English abstract). doi:10.16258/j.cnki.1674-5906.2012.10.010
Li, J., Wang, Y., and Liu, L. (2020). Responses of the Terrestrial Ecosystem Productivity to Droughts in China. Front. Earth Sci. 8, 59. doi:10.3389/feart.2020.00059
Li, K., Cao, J., Adamowski, J. F., Biswas, A., Zhou, J., Liu, Y., et al. (2021a). Assessing the Effects of Ecological Engineering on Spatiotemporal Dynamics of Carbon Storage from 2000 to 2016 in the Loess Plateau Area Using the InVEST Model: A Case Study in Huining County, China. Environ. Dev. 39, 100641. doi:10.1016/j.envdev.2021.100641
Li, X., Guo, J., and Qi, S. (2021b). Forestland Landscape Change Induced Spatiotemporal Dynamics of Subtropical Urban Forest Ecosystem Services Value in Forested Region of China: A Case of Hangzhou City. Environ. Res. 193, 110618. doi:10.1016/j.envres.2020.110618
Li, X., Huang, C., Jin, H., Han, Y., Kang, S., Liu, J., et al. (2022). Spatio-Temporal Patterns of Carbon Storage Derived Using the InVEST Model in Heilongjiang Province, Northeast China. Front. Earth Sci. 10, 846456. doi:10.3389/feart.2022.846456
Li, Z., Cheng, X., and Han, H. (2020). Analyzing Land-Use Change Scenarios for Ecosystem Services and Their Trade-Offs in the Ecological Conservation Area in Beijing, China. Int. J. Environ. Res. Public Health 17 (22), 8632. doi:10.3390/ijerph17228632
Liang, Y., Liu, L., and Huang, J. (2017). Integrating the SD-CLUE-S and InVEST Models into Assessment of Oasis Carbon Storage in Northwestern China. PLoS One 12 (2), e0172494. doi:10.1371/journal.pone.0172494
Liu, L., and Wu, J. (2021). Ecosystem Services-Human Wellbeing Relationships Vary with Spatial Scales and Indicators: The Case of China. Resour. Conserv. Recycl. 172, 105662. doi:10.1016/j.resconrec.2021.105662
Liu, Q., Zhang, Q., Yan, Y., Zhang, X., Niu, J., and Svenning, J.-C. (2020). Ecological Restoration is the Dominant Driver of the Recent Reversal of Desertification in the Mu Us Desert (China). J. Clean. Prod. 268, 122241. doi:10.1016/j.jclepro.2020.122241
Liu, Q., Zhao, Y., Zhang, X., Buyantuev, A., Niu, J., and Wang, X. (2018). Spatiotemporal Patterns of Desertification Dynamics and Desertification Effects on Ecosystem Services in the Mu Us Desert in China. Sustainability 10 (3), 589. doi:10.3390/su10030589
Liu, R., Dong, X., Wang, X.-C., Zhang, P., Liu, M., and Zhang, Y. (2021). Study on the Relationship Among the Urbanization Process, Ecosystem Services and Human Well-Being in an Arid Region in the Context of Carbon Flow: Taking the Manas River Basin as an Example. Ecol. Indic. 132, 108248. doi:10.1016/j.ecolind.2021.108248
Lu, N., Wang, M., Ning, B., Yu, D., and Fu, B. (2018). Research Advances in Ecosystem Services in Drylands under Global Environmental Changes. Curr. Opin. Environ. Sustain. 33, 92–98. doi:10.1016/j.cosust.2018.05.004
Marengo, J. A., Souza, C. M., Thonicke, K., Burton, C., Halladay, K., Betts, R. A., et al. (2018). Changes in Climate and Land Use Over the Amazon Region: Current and Future Variability and Trends. Front. Earth Sci. 6, 228. doi:10.3389/feart.2018.00228
Meng, S., Huang, Q., Zhang, L., He, C., Inostroza, L., Bai, Y., et al. (2020). Matches and Mismatches between the Supply of and Demand for Cultural Ecosystem Services in Rapidly Urbanizing Watersheds: A Case Study in the Guanting Reservoir Basin, China. Ecosyst. Serv. 45, 101156. doi:10.1016/j.ecoser.2020.101156
Miao, L., Sun, Z., Cui, X., and Veuthey, J. (2018). Wake up “Boiling Frogs”: A Study on Animal Husbandry under Climate Change in Northern China. Environ. Earth Sci. 77 (12), 1–8. doi:10.1007/s12665-018-7639-4
Mills, A., Fey, M., Donaldson, J., Todd, S., and Theron, L. (2009). Soil Infiltrability as a Driver of Plant Cover and Species Richness in the Semi-Arid Karoo, South Africa. Plant Soil 320 (1), 321–332. doi:10.1007/s11104-009-9904-5
Peng, W., Zhang, Z., He, G., Liu, X., Wang, W., Cai, Y., et al. (2022). Integrating Potential Land Use Conflict into Ecological Security Pattern in Response to Land Use/Cover Changes at a County Scale in Yangtze River Delta, China. Front. Earth Sci. 10, 875433. doi:10.3389/feart.2022.875433
Qiao, J., Yu, D., Cao, Q., and Hao, R. (2019). Identifying the Relationships and Drivers of Agro-Ecosystem Services Using a Constraint Line Approach in the Agro-Pastoral Transitional Zone of China. Ecol. Indic. 106, 105439. doi:10.1016/j.ecolind.2019.105439
Qiu, J., Carpenter, S. R., Booth, E. G., Motew, M., Zipper, S. C., Kucharik, C. J., et al. (2018). Scenarios Reveal Pathways to Sustain Future Ecosystem Services in an Agricultural Landscape. Ecol. Appl. 28 (1), 119–134. doi:10.1002/eap.1633
Safriel, U., and Adeel, Z. (2008). Development Paths of Drylands: Thresholds and Sustainability. Sustain Sci. 3 (1), 117–123. doi:10.1007/s11625-007-0038-5
Shen, J., Li, S., Liang, Z., Liu, L., Li, D., and Wu, S. (2020). Exploring the Heterogeneity and Nonlinearity of Trade-Offs and Synergies Among Ecosystem Services Bundles in the Beijing-Tianjin-Hebei Urban Agglomeration. Ecosyst. Serv. 43, 101103. doi:10.1016/j.ecoser.2020.101103
Tallis, H., Ricketts, T., Guerry, A., Wood, S., Sharp, R., Nelson, E., et al. (2013). InVEST 2.5. 6 User’s Guide. Stanford, CA, USA: The Natural Capital Project.
Turner, K. G., Odgaard, M. V., Bøcher, P. K., Dalgaard, T., and Svenning, J.-C. (2014). Bundling Ecosystem Services in Denmark: Trade-Offs and Synergies in a Cultural Landscape. Landsc. Urban Plan. 125, 89–104. doi:10.1016/j.landurbplan.2014.02.007
Wang, C., Tang, C., Fu, B., Lü, Y., Xiao, S., and Zhang, J. (2022). Determining Critical Thresholds of Ecological Restoration Based on Ecosystem Service Index: A Case Study in the Pingjiang Catchment in Southern China. J. Environ. Manag. 303, 114220. doi:10.1016/j.jenvman.2021.114220
Webb, R. A. (1972). Use of the Boundary Line in the Analysis of Biological Data. J. Hortic. Sci. 47 (3), 309–319. doi:10.1080/00221589.1972.11514472
Wieder, W., Boehnert, J., Bonan, G., and Langseth, M. (2014). Regridded Harmonized World Soil Database V1. 2. ORNL DAAC Data set. doi:10.3334/ORNLDAAC/1247
Wu, J., Zhang, Q., Li, A., and Liang, C. (2015). Historical Landscape Dynamics of Inner Mongolia: Patterns, Drivers, and Impacts. Landsc. Ecol. 30 (9), 1579–1598. doi:10.1007/s10980-015-0209-1
Wu, W., Peng, J., Liu, Y., and Hu, Y. (2017). Tradeoffs and Synergies between Ecosystem Services in Ordos City. Prog. Geogr. 36 (12), 1571–1581. (in Chinese with English abstract). doi:10.18306/dlkxjz.2017.12.012
Yang, Y. (2021). Evolution of Habitat Quality and Association with Land-Use Changes in Mountainous Areas: A Case Study of the Taihang Mountains in Hebei Province, China. Ecol. Indic. 129, 107967. doi:10.1016/j.ecolind.2021.107967
Yu, D., and Hao, R. (2020). Research Progress and Prospect of Ecosystem Services. Adv. Earth Sci. 35 (8), 804. (in Chinese with English abstract). doi:10.11867/j.issn.1001-8166.2020.069
Zhang, L., Hong, G., Li, Z., Gao, X., Wu, Y., Wang, X., et al. (2018). Assessment of the Ecosystem Service Function of Sandy Lands at Different Times Following Aerial Seeding of an Endemic Species. Sustainability 10 (4), 902. doi:10.3390/su10040902
Zhang, Y., Zhang, B., Yao, R., and Wang, L. (2022). Temporal and Spatial Changes of Vegetation Coverage and Water Production in the Weihe River Basin from 2000 to 2020. J. Desert Res. 42 (2), 223–233. (in Chinese with English abstract). doi:10.7522/j.issn.1000-694X.2022.00018
Zhang, Z., Liu, Y., Wang, Y., Liu, Y., Zhang, Y., and Zhang, Y. (2020). What Factors Affect the Synergy and Tradeoff between Ecosystem Services, and How, from a Geospatial Perspective? J. Clean. Prod. 257, 120454. doi:10.1016/j.jclepro.2020.120454
Zhao, M., He, Z., Du, J., Chen, L., Lin, P., and Fang, S. (2019). Assessing the Effects of Ecological Engineering on Carbon Storage by Linking the CA-Markov and InVEST Models. Ecol. Indic. 98, 29–38. doi:10.1016/j.ecolind.2018.10.052
Zhao, M., Wang, Y., Liu, S., Zhong, P.-A., Liu, H., and Li, R. (2022). Correlation Assessment of NDVI and Land Use Dynamics with Water Resources for the Southern Margin of Mu Us Sandy Land, China. Environ. Sci. Pollut. Res. 29 (12), 17049–17061. doi:10.1007/s11356-021-16757-3
Zhao, Y., Wu, J., He, C., and Ding, G. (2017). Linking Wind Erosion to Ecosystem Services in Drylands: A Landscape Ecological Approach. Landsc. Ecol. 32 (12), 2399–2417. doi:10.1007/s10980-017-0585-9
Keywords: dryland, ecosystem services, constraint effect, trade-off, Ordos, China
Citation: Su N, Zhao Y, Ding G and Duan W (2022) Relationships Between Key Dryland Ecosystem Services: A Case Study in Ordos, China. Front. Earth Sci. 10:937491. doi: 10.3389/feart.2022.937491
Received: 06 May 2022; Accepted: 16 June 2022;
Published: 18 July 2022.
Edited by:
Qingxu Huang, Beijing Normal University, ChinaReviewed by:
Qian Cao, China University of Geosciences Wuhan, ChinaYu Tao, Nanjing Agricultural University, China
Xiao Sun, Chinese Academy of Agricultural Sciences (CAAS), China
Copyright © 2022 Su, Zhao, Ding and Duan. This is an open-access article distributed under the terms of the Creative Commons Attribution License (CC BY). The use, distribution or reproduction in other forums is permitted, provided the original author(s) and the copyright owner(s) are credited and that the original publication in this journal is cited, in accordance with accepted academic practice. No use, distribution or reproduction is permitted which does not comply with these terms.
*Correspondence: Yuanyuan Zhao, eXVhbnl1YW4wNDAyQGJqZnUuZWR1LmNu; Guodong Ding, ZGNoMTk5OUAyNjMubmV0