 Uju Shin
 Sang-Hun Park
 Yong-Ro Yun1
- 1Department of Atmospheric Sciences and Global Environmental Laboratory, Yonsei University, Seoul, South Korea
- 2Republic of Korea Air Force, Cheongju-si, South Korea
In this study, we investigated the synoptic features of the August 26–27, 2018 heavy rainfall episode, which was accompanied by a quasi-stationary front over the Korean peninsula, as well as its relationship with the climatological characteristics of the Western Pacific Subtropical High (WPSH), using reanalysis and observational data. Through a case study, we analyzed the synoptic environment and frontal structure of the heavy rainfall event by comparing it with a heavy rainfall event associated with a quasi-stationary front that occurred on June 26–27, 2018 (during the Changma period). The case study indicates that the environment and structure of the quasi-stationary fronts in both events exhibited common characteristic features: an extended WPSH and strong low-level winds along the western or northwestern edge of the WPSH and a northward tilted frontal structure. Although differences in the moisture transport path were observed (southwesterly for the Changma event and southerly for the August event), their contributions to maintaining the quasi-stationary fronts were comparable around the Korean peninsula. We further investigated the climatological characteristics of these two heavy rainfall episodes for a 30 year period (1990–2019). We identified heavy rainfall days similar to those of the case study using pattern correlations of the 850 hPa geopotential height anomaly. The occurrence frequencies for each period indicate that the environmental features of the Changma event can be regarded as the typical heavy rainfall environment during the Changma period, whereas the environmental features of the August event were not typical for heavy rainfall during August. The main difference between similar and different cases to the August event is the expansion of the WPSH. Analysis of the relationship between annual variations in the WPSH indices and the occurrence frequency of heavy rainfall days during each August period also indicates that heavy rainfall with a quasi-stationary front similar to the August event is closely related to WPSH expansion.
1 Introduction
A Changma front is a quasi-stationary front located over the Korean peninsula during the Changma period of the monsoon season, which typically occurs from the end of June to the middle of July. It has been well documented that a significant portion of the summertime precipitation over the Korean peninsula occurs during the Changma period (KMA, 2011). During this period, the Changma front develops along the boundary between the monsoon and continental or marine polar air masses, and its meridional location oscillates between southern Japan and the middle of the Korean peninsula. The front is elongated from China to Japan and is closely related to the Baiu (Japan) and Mei-Yu (China) fronts. Ninomiya and Akiyama, (1992) suggested that the structure of the front varies with longitude. The Baiu front (135–160°E) exhibits a typical polar front structure, with a deep baroclinic structure, while the Mei-Yu front (100–120°E) exhibits a shallow structure, in which the vertical vorticity is confined to the lower layer. The Changma front (120–135°E) is regarded as a transition zone between these two frontal structures.
The Changma front is characterized by a meridional moisture gradient instead of a temperature slope, as indicated by Ninomiya, (2000). The onset and withdrawal dates of the Changma period are determined by the meridional oscillations of the Changma front, which has been investigated by previous studies (e.g., Byun and Lee, 2002; Ha et al., 2005; Seo et al., 2011; Choi et al., 2012; Park et al., 2015). Seo et al. (2011) proposed criteria for determining the onset and withdrawal dates of the Changma period using factors such as the meridional gradient of equivalent potential temperature, 500 hPa geopotential height, and 200 hPa zonal wind. Based on these factors, the onset and withdrawal dates of the Changma period were defined as when the Changma front crosses 32.4°N in mid-June and 40°N in late July. Seo et al. (2011) also found that these favorable environmental factors retreat southward over the Korean peninsula during late August, even though such an occurrence is not considered as a part of the Changma period.
Compared to climatological research on the Changma period, few studies have been performed regarding heavy rainfall in August, despite late summer rainfall events being climatologically important over the Korean peninsula (e.g., Byun and Lee, 2002; Ha et al., 2007). Previous studies of heavy rainfall during August over the Korean peninsula have suggested that these episodes exhibit similar environmental conditions as those of heavy rainfall episodes during the Changma period (Lee and Cho, 2007). Both types of heavy rainfall episodes occur at the edge of the West Pacific Subtropical High (WPSH), and the warm moist air transported by the strong southwesterly winds plays a crucial role in the occurrence of heavy rainfall over the Korean peninsula. However, the detailed features of the synoptic pressure patterns that produce heavy rainfall during August differ slightly from those during the Changma period. Park et al. (2021) classified the synoptic weather patterns of the warm season’s heavy rainfall events in South Korea. They found that heavy rainfall events associated with the quasi-stationary frontal boundary between low and high, which is the typical heavy rainfall environment during the Changma period, occurred mainly during the first rainy period (late June to July). In contrast, synoptic environments associated with the extratropical cyclone from eastern China and local disturbances at the edge of the WPSH were observed frequently during the second rainy period (mid-August to mid-September), which differed from the typical heavy rainfall during the Changma period.
Climatologically, different characteristics also exist between heavy rainfall episodes in August and in the Changma period. First, heavy rainfall caused by the Changma front tends to occur regularly every year, whereas the August heavy rainfall episodes caused by a quasi-stationary front do not occur regularly because synoptic systems such as typhoons can substantially influence them (e.g., Kim et al., 2006; Byun and Lee, 2012; Cheung et al., 2018; Lee et al., 2021). Suzuki, (1967) reported that the amount of August rainfall in Japan was composed mainly of rainfall caused by thunderstorms and typhoons. Second, the Changma front is closely related to the Mei-Yu (China) and Baiu (Japan) fronts. The average onset and withdrawal dates for the Mei-Yu/Baiu fronts are June and July, respectively (Tomita et al., 2011). Therefore, determining the relationship between the quasi-stationary front in August and the Mei-Yu/Baiu fronts is difficult using climatological analyses.
During August 26–September 1, 2018, a record-breaking heavy rainfall episode occurred over the Korean peninsula, accompanied by a quasi-stationary front. During this episode, heavy rainfall occurred in a long-lasting quasi-stationary frontal zone without the presence of the propagating extratropical cyclone from eastern China. According to the Korean Ministry of the Interior and Safety, this heavy rainfall event resulted in three casualties and approximately $50 million in property damage (Ministry of the Interior and Safety, R. of K, 2018). The second-highest precipitation amount was recorded on August 26, 2018 among the station-averaged daily precipitation during August over the past 10 years, excluding precipitation due to the direct effects of typhoons (Lee et al., 2020). Therefore, in order to prepare for damage caused by this type of heavy rainfall, it is essential to understand the synoptic environments and climatological characteristics that can cause heavy rainfall over the Korean peninsula during August. It is also necessary to determine the similarities and differences with heavy rainfall that occurs during the Changma period. Therefore, this study addressed the following questions by comparing heavy rainfall events in August and during the Changma period: 1) Is there a difference between the synoptic environments of heavy rainfall that occurs during August and the Changma period? and 2) What is the main driver of heavy rainfall on the Korean peninsula during August?
To address these questions, we investigated the synoptic characteristics of the August heavy rainfall episode that was accompanied by a quasi-stationary front over the Korean peninsula. We also investigated the relationship of this episode with key synoptic-scale features using reanalysis and observational data. Section 2 documents the data and method used in this study. In Section 3, we examine the environment and frontal structure of heavy rainfall events during August 26–27, 2018 by comparing it with the Changma front that formed earlier in the year. The climatological characteristics of the August heavy rainfall are analyzed in Section 4. In addition, we examine the relationship between heavy rainfall episodes associated with the quasi-stationary front in August and the WPSH using three different WPSH indices. Finally, the summary and conclusions are provided in Section 5.
2 Data and Methods
2.1 Data and Classification of Heavy Rainfall
We used the European Centre for Medium-Range Weather Forecasts (ECMWF) Re-Analysis Interim (ERA-Interim; Dee et al., 2011) dataset at 6 h intervals with a 0.75° × 0.75° horizontal resolution. Observational data were obtained from the Korean Meteorological Administration (KMA), including upper-air observations, satellite data, and hourly rainfall amounts from Automatic Weather Stations (AWS) to analyze the synoptic environment and the vertical structure of the front. In addition, we used Automated Surface Observing System (ASOS) data obtained from the KMA to classify the heavy rainfall events.
We also investigated the environmental conditions during the Changma and August periods over a 30 years duration (1990–2019). We defined the Changma and August periods as June 20–July 19 and August 6–September 4, respectively, and classified each period into heavy and non-heavy rainfall days. Both periods were defined by analyzing the rainfall climatology as in Seo et al. (2011),, which exhibited two rainfall peaks during the Changma and August periods. We observed the same two peaks (Changma and August) in the ASOS rainfall data, extending its period to the past 30 years (Supplementary Figure 1). In this study, a heavy rainfall event is defined by the KMA as an event with 24 h rainfall accumulations >80 mm at a minimum of two ASOS stations. In order to investigate their relationship with the expansion of WPSH, 190 and 189 cases were statistically analyzed for the Changma and August periods, respectively.
We identified heavy rainfall days similar to those in the case study by calculating the pattern correlation of the 850 hPa geopotential height anomaly with the selected events in each period (i.e., events on June 26 and August 26, 2018). The pattern correlation was calculated in the 15°–45°N, 110°–160°E area, which adequately represents the synoptic-scale pressure pattern in East Asia.
2.2 Western Pacific Subtropical High Index
In this study, we selected three WPSH indices to examine the relationship between the expansion of the WPSH and the heavy rainfall episode in August over the Korean peninsula. The WPSH indices were calculated based on the indices proposed by Liu and Wu, (2004; LW index), Choi and Kim, (2019; CK index), and Riyu, (2002; LU index). Each of these indices diagnoses different variables, but their physical meanings represent similar WPSH behavior over East Asia.
To calculate the LW index, the analysis domain was modified for the purposes of this study. We first set an analysis domain as the area within 10°–45°N and 92°–155°E, and established a WPSH ridgeline at 500 hPa. The WPSH ridgeline is defined as a line that connects grids where the zonal wind speeds are zero and the meridional gradient of the zonal wind is positive. We then found the easternmost 5880 gpm point on the WPSH ridgeline in the domain. The longitude determined using this process was used as the westward extension longitude of the WPSH. Note that if the geopotential height of the grid point located at the right end of the WPSH ridge line is less than 5880 gpm, the westward extension longitude of the WPSH is treated as a missing value. The other two indices were calculated based on geopotential height anomalies instead of horizontal wind shear. The CK (Choi and Kim, 2019) index is defined as the averaged geopotential height anomaly values at 500 hPa for the area within 9°–32°N and 105°–150°E, while the LU (Riyu, 2002) index is averaged over the area within 30°–40°N and 120°–150°E at 850 hPa. For both indices, a positive (negative) anomaly indicates the strengthening (weakening) of the WPSH over East Asia.
3 Case Studies
In this study, we describe the characteristic features of two heavy rainfall events over the Korean peninsula that were accompanied by a quasi-stationary front. During the Changma event on June 26–27, 2018, the AWS rainfall amount over 36 h was over 100 mm in the southern part of the Korean peninsula, with the maximum rainfall exceeding 130 mm (Figure 1A). The surface weather chart from the KMA at 12:00 UTC on June 26, 2018 (Figure 1C) shows a typical pressure pattern during the Changma period (KMA, 2011), with the WPSH located southeast of the Korean peninsula and a migrating low-pressure system to the north of the peninsula. A strong pressure-gradient was located between the low-pressure system and the WPSH, and a quasi-stationary front extended from eastern China to the Korean peninsula. The satellite image obtained from the Communication, Ocean, and Meteorological Satellite (COMS) for 12:00 UTC on June 26 shows a wide cloud band that extended from eastern China to northern Japan along the quasi-stationary front, and convective clouds with cloud-top temperatures below −35°C (shaded in red) were located over the Korean peninsula (Figure 1E).
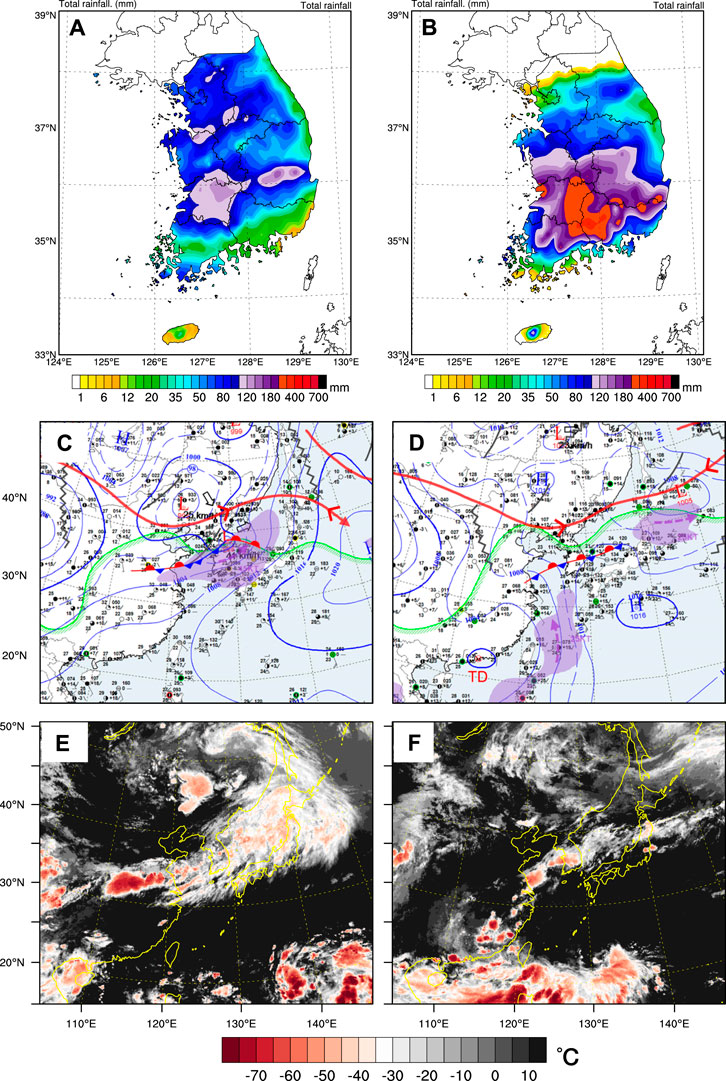
FIGURE 1. The upper panels show the 36 h accumulated rainfall amounts (mm) from (A) 15:00 UTC on June 25 to 03:00 UTC on June 27, 2018 and from (B) 15:00 UTC on August 25 to 03:00 UTC on August 27, 2018. The middle panels show surface weather charts obtained from the KMA at (C) 12:00 UTC on June 26, 2018 and (D) 12:00 UTC on August 26, 2018. The solid blue lines indicate the sea-level pressure (hPa), and the violet shadings represent the area with wind speed >25 knots. The text “TD” in (D) represents the tropical depression. The bottom panels are satellite images obtained from the Communication, Ocean, and Meteorological Satellite (COMS) at (E) 12:00 UTC on June 26, 2018 and (F) 12:00 UTC on August 26, 2018.
The other heavy rainfall event occurred on August 26–27, 2018 over the southern part of the Korean peninsula. During this event, precipitation exceeding 300 mm was observed on the southern Korean peninsula, with a maximum rainfall amount of ∼400 mm (Figure 1B). The surface weather chart at 12:00 UTC on August 26, 2018 (Figure 1D) shows that the WPSH was located southeast of the Korean peninsula, and a tropical depression (labeled TD) was located on the southern coast of China. A low-pressure system was located northeast of the Korean peninsula, and the trough extended from the center of the low-pressure system to the tropical depression. A strong pressure gradient was present east of Taiwan between the WPSH and the tropical depression. A quasi-stationary front extended east–west to the southern Korean peninsula at the northern end of this strong pressure gradient. In the satellite image (Figure 1F), the development of a narrow and intense cloud band is depicted along the quasi-stationary front over the southern Korean peninsula.
The considerable similarity between these two events is that heavy rainfall occurred in an environment in which the WPSH extended to the west, and that heavy rainfall occurred over the Korean peninsula due to convective systems that developed within a cloud band on a quasi-stationary front that extended from eastern China to the Korean peninsula. However, the low-pressure disturbances associated with the front exhibited different features during each event. In the Changma event, the quasi-stationary front developed in the vicinity of the strong pressure gradient between the WPSH and the synoptic-scale low to the north of the Korean peninsula. In contrast, in the August event, the strong pressure gradient occurred between the WPSH and a tropical depression to the south of Korea, and the quasi-stationary front developed at the northern end of the strong pressure gradient.
We further investigated the heavy rainfall environments using pressure level analyses from the ERA-Interim for the Changma (June 26, 2018) and August (August 26, 2018) events. The meteorological fields shown in Figure 2 represent the averages between 00:00 UTC and 12:00 UTC. The 850 hPa pressure chart for the Changma event indicates that the WPSH and the synoptic-scale low were located to the southeast and north of the Korean peninsula, respectively. A region with a strong height gradient was located between the WPSH and the synoptic-scale low, while strong westerly–southwesterly currents in this region transported warm and moist air toward the Korean peninsula. As a result, an area of high-θe air extended from China to the Korean peninsula. The quasi-stationary front (Figures 1C,E) developed in the strong θe gradient region (Figure 2A). In the 850 hPa pressure chart for the August event, a strong southerly flow was observed over the ocean between the WPSH and the tropical depression. Warm and moist air was transported from the East China Sea by the strong southerly flow, and a strong θe gradient extending from the eastern part of China to Japan, was located along the northern edge of the strong southerly flow (Figure 2B). The Changma and August events exhibited different transport paths for the warm and moist air. Owing to the synoptic pattern differences, the warm and moist air was transported by strong southerly wind in August, whereas the prevailing winds during the Changma event were southwesterly. However, these moisture transports supported maintaining both quasi-stationary fronts, thereby presenting common environmental features between the two cases. The strong low-level flow was located in the strong geopotential height gradient region, and the warm and moist air was transported toward the Korean peninsula. As warm and humid air was supplied, an area with a robust θe gradient appeared over the Korean peninsula and the quasi-stationary front developed in this region.
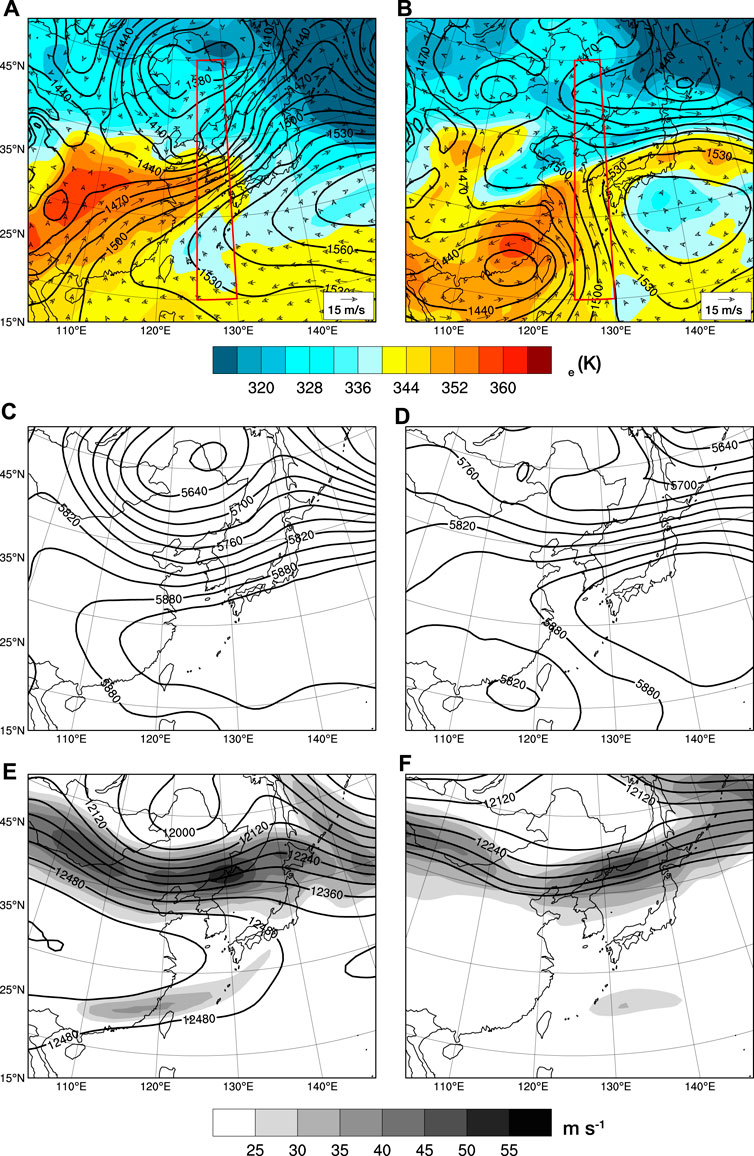
FIGURE 2. Isobaric level analyses for June 26 (left) and August 26, 2018 (right). (A,B) Geopotential heights (gpm, solid lines), equivalent potential temperatures (K, shaded), and wind vectors (ms−1, black arrows) at 850 hPa, (C,D) geopotential heights (gpm, solid lines) at 500 hPa, and (E,F) geopotential heights (gpm, solid lines) and isopachs (ms−1, shaded) at 200 hPa.
Similarities at low-level pressure fields were also apparent in the upper-level analysis. During both events, the 500 hPa pressure chart indicates that the WPSH was located southeast of the Korean peninsula, with the west end of the 5880 gpm contour extending into China (Figures 2C,D). At the northern edge of the WPSH, a strong geopotential height gradient was located over the Korean peninsula. In the 200 hPa pressure chart, the upper-level jet axis was located to the north of the Korean peninsula, and the Korean peninsula was located on the right side of the jet entrance (Figures 2E,F).
The vertical structures of the quasi-stationary fronts are shown in Figure 3, showing latitude-pressure cross-sections between 20°N and 50°N for both events. The values at each latitude are represented by averaged values between 125° and 130°E (i.e., red box in Figures 2A,B). Figure 3 shows vertical cross-sections of the θe, vertical velocity, and horizontal wind vectors during the Changma and August events. During both events, high-θe air below 700 hPa was located south of the Korean peninsula, while an area of low-θe air was located toward the northern Korean peninsula. This front, which is defined as the boundary between high- and low-θe air, was tilted steeply northward. A low-level strong southerly flow upstream of the front transported the high-θe air toward the Korean peninsula, which rose as it encountered the front. Previous studies of the Changma front (e.g., Sampe and Xie, 2010; Seo et al., 2011) have shown that its vertical structure is characterized by the northward tilt of the front from the lower to the upper troposphere. The typical structure of the Changma front was observed in both the Changma and August events.
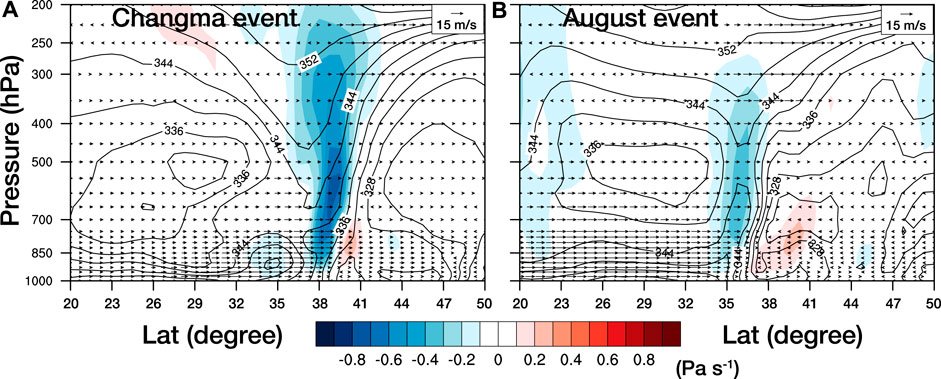
FIGURE 3. Vertical cross sections along latitudes for events on (A) June 26 and (B) August 26, 2018. All values at each latitude were calculated by averaging between 125° and 130°E (red boxes). The solid lines, shading, and arrows represent the equivalent potential temperatures (K), vertical velocities (Pa s−1), and horizontal wind vectors (ms−1), respectively.
Although the two case studies developed from different synoptic patterns, the environment and structure of the front for both events exhibited common characteristic features: an extended WPSH and strong low-level winds along the western or northwestern edge of the WPSH, and a northward tilting frontal structure. Differences were observed regarding the moisture transport path (southwesterly in the Changma event and southerly in the August event); however, their contributions to maintaining their respective quasi-stationary fronts around the Korean peninsula were comparable.
4 Heavy Rainfall Events in August and Climatology
There are climatological issues related to the characteristics of the heavy rainfall in August. As we discussed above, heavy rainfall caused by the Changma front tends to occur regularly every year, and the Changma front is closely related to the Mei-Yu (China) and Baiu (Japan) fronts. These characteristics are important factors that define the Changma front. Thus, the long-term climatological characteristics of the quasi-stationary front during both the Changma and August events should be considered.
Figure 4 shows the mean geopotential height field and equivalent potential temperatures at 850 hPa during heavy rainfall episodes from 1990 to 2019. During the Changma period (190 cases), the northwestern edge of the WPSH extended from southwestern China to the Korean peninsula and northern Japan. A synoptic disturbance was located northwest of the Korean peninsula and a stationary trough extended from the disturbance to the downstream region of the Tibetan Plateau (Figure 4A). These characteristic features during the Changma period are in agreement with those of the Changma event, as shown in the case study revealed in Figure 2A.
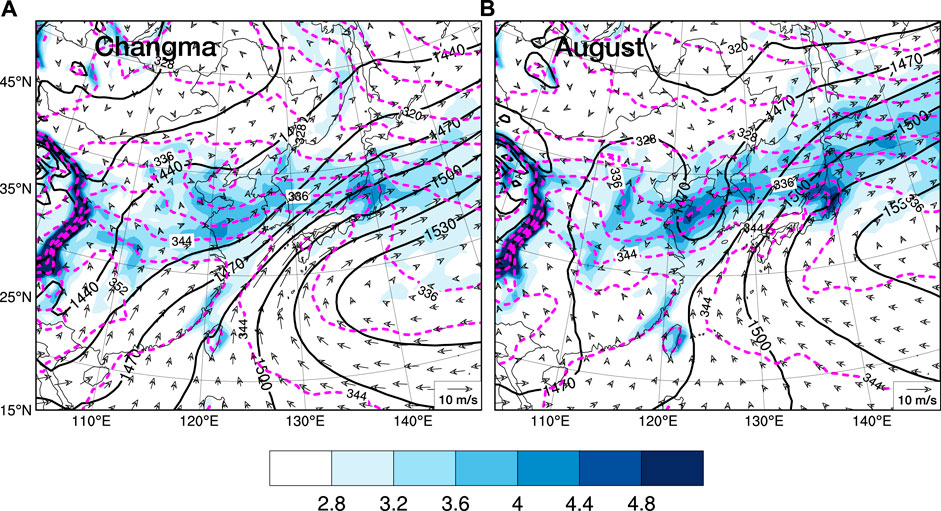
FIGURE 4. Geopotential heights (gpm, solid black lines), equivalent potential temperatures (K, dashed magenta lines), equivalent potential temperature gradients (K/100 km, shaded), and wind vectors (ms−1, black arrow) at 850 hPa for heavy rainfall days during the (A) Changma and (B) August periods.
The mean August synoptic field from 189 heavy rainfall events in Figure 4B indicates that the synoptic-scale ridge extended from the northwestern edge of the WPSH to eastern China. The western edge of the WPSH did not extend to southern China as in the Changma period, and a strong trough was located in the vicinity of Taiwan. The synoptic features of the mean August field differ from those of the mean Changma field, represented by the strong trough near Taiwan, the strong disturbance near the Korean peninsula, and the location of the synoptic cyclone northeast of the Korean peninsula. Note that the mean heavy rainfall environment during August (Figure 4B) does not match the August event in the case study precisely (Figure 2B). This may be due to the diversity of the synoptic environment that causes heavy rainfall during August, as documented by Park et al. (2021).
Considering the diversity of the heavy rainfall environment during August, we identified the heavy rainfall days in each period as similar pattern (SP) and different pattern (DP) cases by calculating the pattern correlation of the 850 hPa geopotential height anomaly with the selected August event (i.e., August 26, 2018). For comparison, the same analysis was performed on the Changma period using the selected Changma event (i.e., June 26, 2018). Figure 5A shows the change in the cumulative occurrence frequency of the SP cases according to the change in the pattern correlation threshold. For the Changma period, the cumulative occurrence frequency of the SP cases remained above 180 (95%) up to a pattern correlation threshold of 0.5 and retained values of 90 (47%) even at a pattern correlation threshold of 0.8. Unlike the Changma period, the cumulative occurrence frequency of the SP cases during August decreased rapidly with an increasing pattern correlation threshold. The cumulative occurrence frequencies of the SP cases during August were approximately 97 (51%) and 7 (4%) cases when the pattern correlation thresholds were 0.5 and 0.8, respectively. Notably, the occurrence frequencies of the SP cases during the two periods were quite different. The occurrence frequencies of the SP cases during both periods implies that the environmental features of the Changma event can be regarded as the typical heavy rainfall environment during the Changma period, while the environmental features of the August event cannot be regarded as typical for heavy rainfall during August. For example, the occurrence frequencies of the heavy rainfall days, SP cases, and DP cases when the pattern correlation threshold was assumed to be 0.5 (Figures 5B,C) indicate that, during the Changma period, SP cases occurred on 95% of the heavy rainfall days. In contrast, during August, only 51% of the heavy rainfall days were similar to the August event described above.
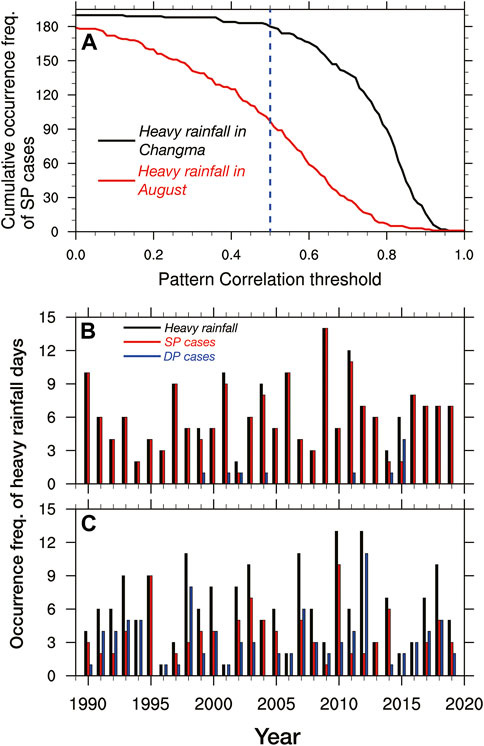
FIGURE 5. (A) Cumulative occurrence frequency of cases with similar patterns (SP) during the Changma period (June 20–July 19, black line) and August (August 6–September 4, red line) depending on the pattern correlation threshold. The dashed blue line indicates a pattern correlation threshold of 0.5. (B,C) Time series of the frequency of heavy rainfall days (black bars), cases with similar patterns (SP, red bars), and cases with different patterns (DP, blue bars) during the (B) Changma period and (C) August.
Since the SP and DP cases both exhibited similar occurrence frequencies during August, we examined the environmental features of the SP cases during August by comparing them with the DP cases. Days with a pattern correlation value greater than 0.5 were classified as SP cases (97), whereas those with values less than 0.5 were classified as DP cases (92). Figure 6 shows constant pressure charts for the SP and DP cases during August. The composite charts of the SP cases from Figure 6A exhibited environmental features that were consistent with those of the August event as shown in Figure 2B. In the 850 hPa pressure chart for the SP cases, the WPSH extended to China and the front (i.e., east–west line of the high θe gradient) was located at the northern end of the strong low-level southerly wind that flows toward the Korean peninsula along the western flank of the WPSH (Figure 6A). The expansion of the WPSH was also apparent in the 500 hPa pressure chart, and the upper-level jet axis was located north of the Korean peninsula (not shown). In the composite charts of the DP cases from Figures 6A,B low-pressure system was located over the Yellow Sea and the Korean peninsula that extended from the eastern part of China to the northern part of Japan, crossing the low-pressure system. Note that the synoptic trough and disturbances around Taiwan and the Korean peninsula revealed in Figure 4B were from DP cases during August, as shown in Figure 6B. The SP and DP cases exhibited considerable differences regarding the development of the front over the Korean peninsula. In the SP cases, the strong southerly or southwesterly wind along the western flank of the WPSH plays an important role in the front development, as in the heavy rainfall environment during the Changma period. In contrast, from DP cases (Figure 6B), the cyclonic circulation associated with the mesoscale low near the Korean peninsula was the main driver of heavy rainfall systems. By decomposing Figure 4B into Figures 6A,B, we found that these differences were strongly associated with the expansion of the WPSH. In the SP cases, the 1500 gpm and 1485 gpm contours extended further northwest than in the DP cases, while the northwestern edge of the WPSH extended to the southern part of the Korean peninsula.
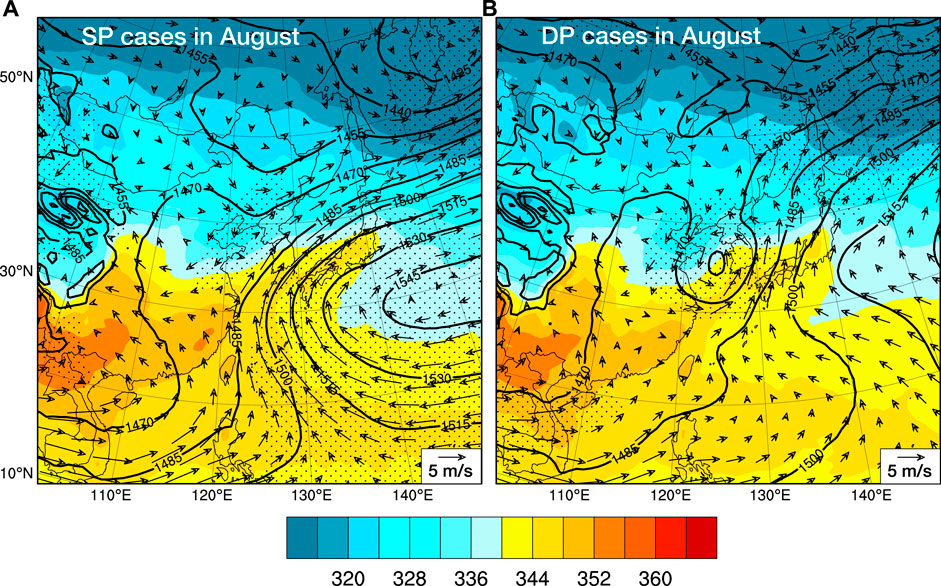
FIGURE 6. Composite geopotential height (gpm, solid lines), equivalent potential temperature (K, shaded), and wind vector (ms−1, arrows) fields at 850 hPa for (A) SP cases and (B) DP cases during August from 1990 to 2019. The dots indicate that the value is significant at the 95% confidence level.
The vertical structure of the SP cases during the Changma and August periods were similar to those of the case studies (Figure 3), although the fields were smoother than the case study events. Figures 7A,B show the vertical structure of the SP cases during the Changma and August periods, respectively. During both periods, high-θe air below 700 hPa was located south of the Korean peninsula, while an area of low-θe air was located north of the Korean peninsula in the layer between the surface and the upper troposphere (Figures 7A,B), as shown in the case studies (Figures 3A,B). Moreover, significant upward motion was observed over the region with a strong horizontal θe gradient.
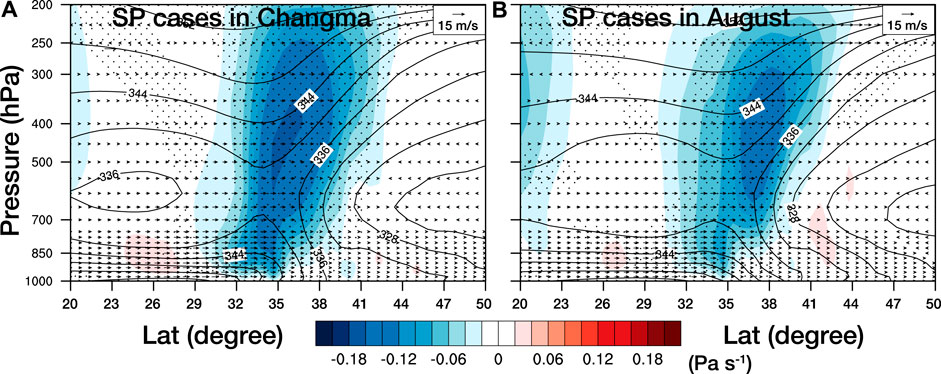
FIGURE 7. Same as Figure 3, but for the similar pattern (SP) cases during the (A) Changma period and (B) August from 1990 to 2019. Note that the magnitude of vertical motion is different from that shown in Figure 3. The dots indicate that the value is significant at the 95% confidence level.
Analyses of the SP cases during both the Changma and August periods demonstrate that they occurred in each period in an environment similar to those of the case study events. As mentioned above, this study was motivated to find favorable synoptic conditions for heavy rainfall events during August with a quasi-stationary front. Here, the environmental conditions of the SP cases in August suggest that similar heavy rainfall events can occur under certain synoptic conditions in which the WPSH extends northwestward. Therefore, based on the importance of the expansion of the WPSH for heavy rainfall development during August, we examined the relationship between the frequency of heavy rainfall days in August and the WPSH index for each year.
Figure 8 shows the annual variations in the WPSH indices for the August events. All of the indices were calculated during August of each year from 1990 to 2019. As shown in Figure 8A, the annual variations in the LW index indicate that the average longitude of the WPSH between 1990 and 2019 was ∼128.8°E. The mean extension longitude of the WPSH during years with three or more SP cases (red dashed) was ∼123.7°E, which is farther west than in other years (blue dashed line) at 137°E. For the other two WPSH indices, the mean values during years with (without) three or more SP cases had positive (negative) anomalies, and the differences between the red and blue dashed lines were 6.4 and 5.5 m for the CK and LU indices, as shown in Figures 8B,C, respectively.
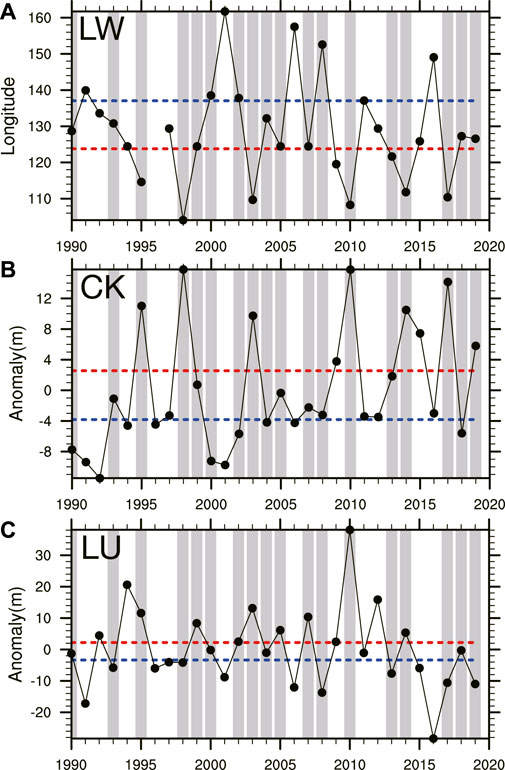
FIGURE 8. Annual variations in the westward extension of the WPSH: (A) LW (Liu and Wu, 2004), (B) CK (Choi and Kim, 2019), and (C) LU (Riyu, 2002) Indices. All indices were calculated during August of each year from 1990 to 2019. Thick gray bars indicate years with three or more SP cases. Red (blue) dashed lines indicate the mean values of years with (without) three or more SP cases.
The relationship between the WPSH indices and the annual occurrence frequencies of heavy rainfall days during August was also examined using the correlation coefficient (Figure 9). The LW index exhibited a negative correlation with heavy rainfall occurrence for the SP cases (0.56) in August, while the CK and LU indices exhibited positive correlations (0.47 and 0.58, respectively), as shown in Figures 9A–C. In contrast to the SP cases, the relationship between the WPSH indices and the heavy rainfall occurrence frequency for the DP cases exhibited a nearly random pattern, with correlation coefficients of 0.11, 0.01, and 0.19 for the LW (Figure 9D), CK (Figure 9E), and LU indices (Figure 9F), respectively. The annual variations in the WPSH indices and the annual occurrence frequencies of heavy rainfall days during August indicate that a strengthening of the WPSH is closely related to the occurrence of heavy rainfall for the SP cases, while it was unrelated to the occurrence of heavy rainfall for the DP cases.
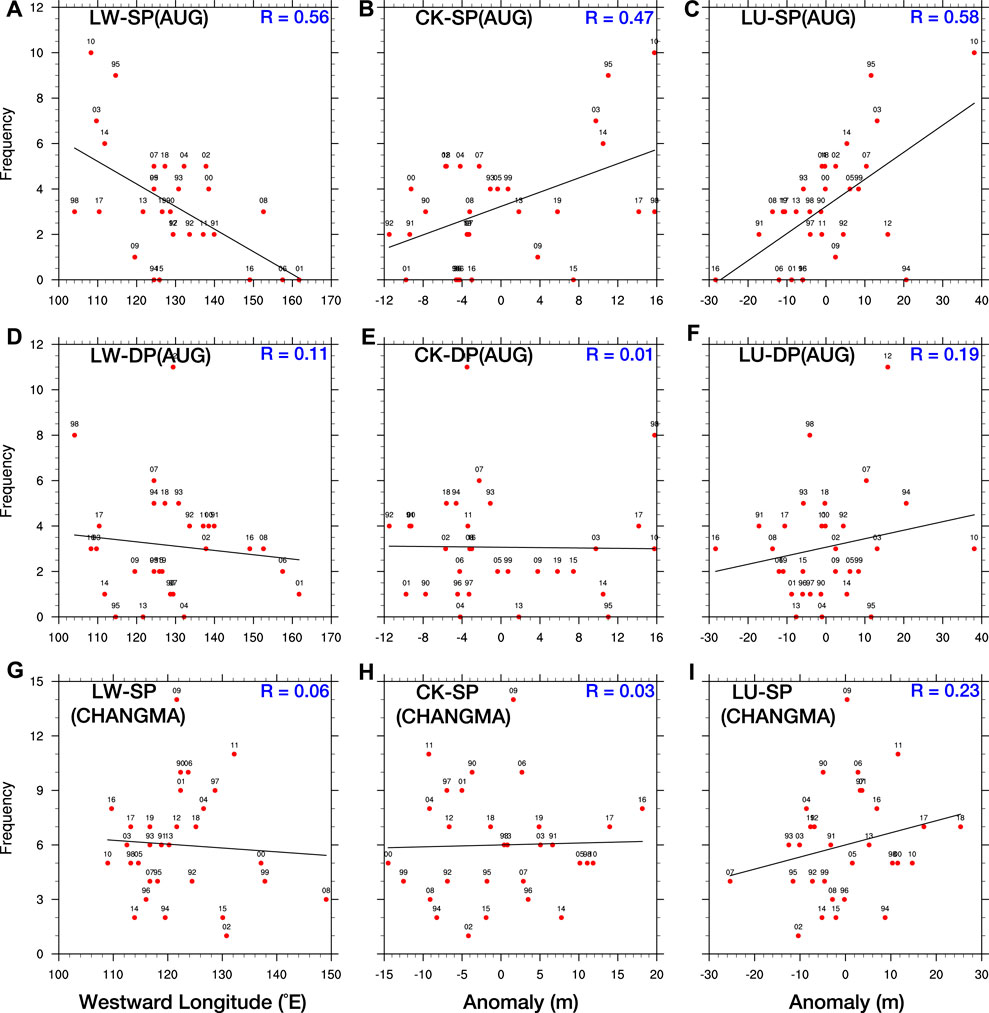
FIGURE 9. Correlation coefficients between the WPSH indices (left, middle, and right panels represent the LW, CK, and LU indices, respectively) and annual frequencies of (A–C) SP cases in August, (D–F) DP cases in August, and (G–I) SP cases during the Changma period from 1990 to 2019. Note that the results of the DP cases during the Changma period are not shown, as the total frequency was only 10 days during 1990–2019.
We also applied the above analysis to the Changma period. Figures 9G–I show the relationships between the WPSH indices and the occurrence frequency of the SP cases during the Changma period. The results for the DP cases during the Changma period have been excluded, as the total frequency of the DP cases was only 10 during 1990–2019, as shown in Figure 5A. For the SP cases during the Changma period, the correlation coefficients were 0.06, 0.03, and 0.23 for the LW (Figure 9G), CK (Figure 9H), and LU (Figure 9I) indices, respectively. These values were substantially smaller than the correlation coefficients for the SP cases in August (Figures 9A–C) and exhibited a nearly random pattern. During the Changma period, since the occurrence frequency of the SP cases occupied 95% of the heavy rainfall occurrences, we can conclude that the relationship between the annual variations in the WPSH and heavy rainfall occurrence is very weak, indicating that the expansion of WPSH is not a key feature of heavy rainfall over the Korean peninsula. Complicated development processes exist for the quasi-stationary front in the Changma period, such as the impact of the Tibetan Plateau (e.g., Hsu and Liu, 2003; Son et al., 2019; Seok and Seo, 2021) or large-scale diabatic heating effects (e.g., Yun et al., 2010; Jin et al., 2013). More detailed analysis of various aspects of heavy rainfall during the Changma period is beyond the scope of this study, and further research should be performed on this subject. In contrast, we found that heavy rainfall events that occurred in a similar synoptic environment as that of the August event were very closely related to WPSH expansion.
5 Summary and Conclusion
We investigated the relationships between heavy rainfall in August over the Korean peninsula and the climatological characteristics of the WPSH using reanalysis and observational data. Based on the two case studies, the synoptic environment and frontal structure during August 26–27, 2018 were compared with those of the heavy rainfall event during the Changma period. Furthermore, we investigated the climatological characteristics of heavy rainfall episodes during the Changma (190 cases) and August periods (189 cases) from 1990 to 2019.
The case studies indicate that the environment and structure of the quasi-stationary front for both events exhibited common characteristics: an expanded WPSH and strong low-level winds along the western or northwestern edge of the WPSH; and a northward tilting frontal structure. These characteristics are consistent with those of the Changma front, as defined by previous studies. However, the moisture transport path differed between the two events: moisture transport was mainly derived from the southwest in the Changma event, but was derived from the south in the August event. This difference is due to the synoptic pressure caused by the presence of the cyclonic system over the southern coast of China. However, the moisture transports supported maintaining both quasi-stationary fronts presenting common environmental features between the two cases.
We classified the heavy rainfall days during each period from 1990 to 2019 as SP and DP cases by calculating the pattern correlations with each period’s selected events. The occurrence frequency of the SP cases was dependent on the pattern correlation threshold for both periods, thereby indicating that the environmental features of the Changma event can be regarded as the typical heavy rainfall environment during the Changma period. In contrast, environmental features of the August 2018 event could not be regarded as the typical heavy rainfall environment during August, but accounted for half of the heavy rainfall during August when the pattern correlation threshold was 0.5.
A major difference between the SP and DP cases during August was the expansion and intensity of the WPSH. In the SP cases, the strong southerly or southwesterly winds along the western flank of the WPSH played an important role in the development of the front, as in the heavy rainfall environment during the Changma period. However, the cyclonic circulation associated with a mesoscale low near the Korean peninsula was the main driver of heavy rainfall systems. The environmental conditions in the SP cases indicate that heavy rainfall events similar to the August event in the case studies can occur under certain synoptic conditions in which the WPSH extends northwestward.
To examine the influence of the WPSH expansion on heavy rainfall during August over the Korean peninsula, we analyzed the relationships between the annual variations in three WPSH indices and the annual occurrence frequency of heavy rainfall days during August and the Changma period. The results indicate that heavy rainfall during August accompanied by a quasi-stationary front was very closely related to WPSH expansion.
This study focused on investigating the relationship between the heavy rainfall environment during August and the expansion of the WPSH. To better understand the characteristics of heavy rainfall during August, further research regarding the heavy rainfall environment with WPSH modulation (e.g., Yang and Li, 2020) and the environment considered in this study should be conducted. In addition, the influence of tropical cyclone activity on heavy rainfall during August should be addressed more clearly in future research.
Data Availability Statement
The original contributions presented in the study are included in the article/Supplementary Material, further inquiries can be directed to the corresponding author.
Author Contributions
US: Conceptualization, Analysis, Methodology, Software. S-HP: Conceptualization, Methodology, Writing–original draft, Supervision. Y-RY: Software, Data collection. CO: Software, Data collection, Analysis. All authors reviewed the final manuscript.
Funding
This research was supported by the Korea Meteorological Administration Research and Development Program (No. KMI 2020-01112).
Conflict of Interest
The authors declare that the research was conducted in the absence of any commercial or financial relationships that could be construed as a potential conflict of interest.
Publisher’s Note
All claims expressed in this article are solely those of the authors and do not necessarily represent those of their affiliated organizations, or those of the publisher, the editors and the reviewers. Any product that may be evaluated in this article, or claim that may be made by its manufacturer, is not guaranteed or endorsed by the publisher.
Supplementary Material
The Supplementary Material for this article can be found online at: https://www.frontiersin.org/articles/10.3389/feart.2022.940785/full#supplementary-material
References
Byun, H.-R., and Lee, D.-K. (2002). Defining Three Rainy Seasons and the Hydrological Summer Monsoon in Korea Using Available Water Resources Index. J. Meteorological Soc. Jpn. 80, 33–44. doi:10.2151/jmsj.80.33
Byun, K.-Y., and Lee, T.-Y. (2012). Remote Effects of Tropical Cyclones on Heavy Rainfall over the Korean Peninsula - Statistical and Composite Analysis. Tellus A Dyn. Meteorology Oceanogr. 64, 14983. doi:10.3402/tellusa.v64i0.14983
Cheung, H. M., Ho, C.-H., Jhun, J.-G., Park, D.-S. R., and Yang, S. (2018). Tropical Cyclone Signals on Rainfall Distribution during Strong vs. Weak Changma/Baiu Years. Clim. Dyn. 51, 2311–2320. doi:10.1007/s00382-017-4014-1
Choi, K.-S., Wang, B., and Kim, D.-W. (2012). Changma Onset Definition in Korea Using the Available Water Resources Index and its Relation to the Antarctic Oscillation. Clim. Dyn. 38, 547–562. doi:10.1007/s00382-010-0957-1
Choi, W., and Kim, K.-Y. (2019). Summertime Variability of the Western North Pacific Subtropical High and its Synoptic Influences on the East Asian Weather. Sci. Rep. 9, 7865. doi:10.1038/s41598-019-44414-w
Dee, D. P., Uppala, S. M., Simmons, A. J., Berrisford, P., Poli, P., Kobayashi, S., et al. (2011). The ERA-Interim Reanalysis: Configuration and Performance of the Data Assimilation System. Q.J.R. Meteorol. Soc. 137, 553–597. doi:10.1002/qj.828
Ha, K.-J., Jeon, E.-H., and Oh, H.-M. (2007). Spatial and Temporal Characteristics of Precipitation Using an Extensive Network of Ground Gauge in the Korean Peninsula. Atmos. Res. 86, 330–339. doi:10.1016/j.atmosres.2007.07.002
Ha, K.-J., Yun, K.-S., Jhun, J.-G., and Park, C.-K. (2005). Definition of Onset/Retreat and Intensity of Changma During the Boreal Summer Monsoon Season. J. Korean Meteor. Soc. 41, 927–942.
Hsu, H. H., and Liu, X. (2003). Relationship between the Tibetan Plateau Heating and East Asian Summer Monsoon Rainfall. Geophys. Res. Lett. 30, 30–33. doi:10.1029/2003GL017909
Jin, Q., Yang, X.-Q., Sun, X.-G., and Fang, J.-B. (2013). East Asian Summer Monsoon Circulation Structure Controlled by Feedback of Condensational Heating. Clim. Dyn. 41, 1885–1897. doi:10.1007/s00382-012-1620-9
Kim, J.-H., Ho, C.-H., Lee, M.-H., Jeong, J.-H., and Chen, D. (2006). Large Increase in Heavy Rainfall Associated with Tropical Cyclone Landfalls in Korea after the Late 1970s. Geophys. Res. Lett. 33, a–n. doi:10.1029/2006GL027430
Lee, J., Paz, I., Schertzer, D., Lee, D. I., and Tchiguirinskaia, I. (2020). Multifractal Analysis of Rainfall-Rate Datasets Obtained by Radar and Numerical Model: The Case Study of Typhoon Bolaven (2012). J. Appl. Meteorol. Climatol. 59, 819–840. doi:10.1175/JAMC-D-18-0209.1
Lee, T.-Y., and Cho, N.-S. (2007). “Variation and Characteristics of Heavy Rainfall in August over the Korean Peninsula,” in Autumn Metting KMS 8–10, 488–489.
Lee, T.-Y., Shin, U., and Park, S.-H. (2021). Atmospheric Structure for Convective Development in the Events of Cloud Clusters over the Korean Peninsula. Asia-Pacific J. Atmos. Sci. 57, 511–531. doi:10.1007/s13143-020-00211-4
Liu, Y., and Wu, G. (2004). Progress in the Study on the Formation of the Sumertime Subtropical Anticyclone. Adv. Atmos. Sci. 21, 322–342. doi:10.1007/BF02915562
Ministry of the Interior and Safety, R. of K (2018). Statistical Yearbook of Natural Disaster 2018. Sejong, Korea: Korean Ministry of the Interior and Safety.
Ninomiya, K., and Akiyama, T. (1992). Multi-scale Features of Baiu, the Summer Monsoon over Japan and the East Asia. J. Meteorological Soc. Jpn. 70, 467–495. doi:10.2151/jmsj1965.70.1B_467
Ninomiya, K. (2000). Large- and Meso-α-Scale Characteristics of Meiyu/Baiu Front Associated with Intense Rainfalls in 1-10 July 1991. J. Meteorological Soc. Jpn. 78, 141–157. doi:10.2151/jmsj1965.78.2_141
Park, C., Son, S.-W., Kim, J., Chang, E.-C., Kim, J.-H., Jo, E., et al. (2021). Diverse Synoptic Weather Patterns of Warm-Season Heavy Rainfall Events in South Korea. Mon. Weather Rev. 149, 3875–3893. doi:10.1175/MWR-D-20-0388.1
Park, H.-l., Seo, K.-H., and Son, J.-H. (2015). Development of a Dynamics-Based Statistical Prediction Model for the Changma Onset. J. Clim. 28, 6647–6666. doi:10.1175/JCLI-D-14-00502.1
Riyu, L. (2002). Indices of the Summertime Western North Pacific Subtropical High. Adv. Atmos. Sci. 19, 1004–1028. doi:10.1007/s00376-002-0061-5
Sampe, T., and Xie, S.-P. (2010). Large-Scale Dynamics of the Meiyu-Baiu Rainband: Environmental Forcing by the Westerly Jet. J. Clim. 23, 113–134. doi:10.1175/2009JCLI3128.1
Seok, S.-H., and Seo, K.-H. (2021). Sensitivity of East Asian Summer Monsoon Precipitation to the Location of the Tibetan Plateau. J. Clim. 34, 8829–8840. doi:10.1175/jcli-d-21-0154.1
Son, J. H., Seo, K. H., and Wang, B. (2019). Dynamical Control of the Tibetan Plateau on the East Asian Summer Monsoon. Geophys. Res. Lett. 46, 7672–7679. doi:10.1029/2019GL083104
Suzuki, E. (1967). A Statistical and Climatological Study on the Rainfall in Japan. Pap. Met. Geophy. 18, 103–181. doi:10.2467/mripapers1950.18.3_103
Tomita, T., Yamaura, T., and Hashimoto, T. (2011). Interannual Variability of the Baiu Season Near Japan Evaluated from the Equivalent Potential Temperature. J. Meteorological Soc. Jpn. 89, 517–537. doi:10.2151/jmsj.2011-507
Yang, S., and Li, T. (2020). Cause for Quasi-Biweekly Oscillation of Zonal Location of Western Pacific Subtropical High during Boreal Summer. Atmos. Res. 245, 105079. doi:10.1016/j.atmosres.2020.105079
Keywords: heavy rainfall, August rainfall, changma, quasi-stationary front, west pacific subtropical high index
Citation: Shin U, Park S-H, Yun Y-R and Oh C (2022) Synoptic Features of August Heavy Rainfall Episodes Accompanied By a Quasi-Stationary Front Over the Korean Peninsula and Its Relationship With the Western Pacific Subtropical High. Front. Earth Sci. 10:940785. doi: 10.3389/feart.2022.940785
Received: 10 May 2022; Accepted: 01 June 2022;
Published: 27 June 2022.
Edited by:
Bo Sun, Nanjing University of Information Science and Technology, ChinaReviewed by:
Chujie Gao, Hohai University, ChinaKang Xu, South China Sea Institute of Oceanology (CAS), China
Copyright © 2022 Shin, Park, Yun and Oh. This is an open-access article distributed under the terms of the Creative Commons Attribution License (CC BY). The use, distribution or reproduction in other forums is permitted, provided the original author(s) and the copyright owner(s) are credited and that the original publication in this journal is cited, in accordance with accepted academic practice. No use, distribution or reproduction is permitted which does not comply with these terms.
*Correspondence: Sang-Hun Park, cHNodW5AeW9uc2VpLmFjLmty