 Yuchun Ni
 Jiaxing Wei1,2*
 Qiyao Han
 Mingjuan Zhang
- 1Department of Landscape Architecture, Nanjing Agricultural University, Nanjing, China
- 2Key Laboratory of Landscaping, Ministry of Agriculture, Nanjing, China
In the past decades, rapid urbanization in China has dramatically transformed natural spaces into construction land, leading to serious degradation and supply–demand imbalance of ecosystem services (ESs). The identification of critical areas and ecological security patterns is crucial for balancing ESs and improving human well-being in rapidly urbanized regions. The purpose of this study was to establish a comprehensive assessment framework of ES supply–demand including provisioning, regulating, supporting, and cultural services, so as to provide theoretical support for the identification and refined management of regional critical areas. Taking a typical waterside area in Shanghai metropolitan area as an example, based on multi-source data and ES quantitative models, we used ecological supply–demand ratio and bivariate local indicators of spatial association to quantify the relationship and matching patterns of ES supply–demand, then explored the identification, protection, and restoration of ecologically critical areas at the regional scale. The results showed that: 1) the ES supply–demand relationship in the study area was quantitatively determined. The ecological supply–demand ratio was as follows: regulating > provisioning > supporting > cultural, in which the supply of supporting and cultural services was less than the demand, and the problem of the supply–demand mismatch is prominent; 2) we have identified 41 supply critical areas that require priority protection, with a total area of 206.79 km2 accounting for 9.65% of the total study area, showing a spatial pattern of more in the northwest and less in the southeast; 3) a total of 11 demand critical areas that need ecological restoration were identified, accounting for 31.43% of the 35 administrative towns in the study area, which are mainly distributed around three urban centers and a high-tech zone. The study is of great significance for the construction of regional ecological security patterns and rational ES allocation, and can provide a scientific framework for the ecological protection and restoration of critical areas around metropolises in developing countries.
1 Introduction
Ecosystem services (ESs) refer to the ecological benefits provided by an ecosystem (Daily, 1997; Dooley, 2005) that is indispensable for human well-being and subsistence (Mehring et al., 2018; Sannigrahi et al., 2019). With the process of rapid urbanization, high-intensity human activities and socio-economic development have caused drastic changes in land-use types that natural spaces have been squeezed by the gradual expansion of construction land (Delphin et al., 2016; Ghosh et al., 2021), resulting in serious degradation of ES capacity (Bongaarts, 2019). On the other hand, rising living standards have also led to a growing public demand for ESs that exceeds the supply and delivery capacity of ESs in neighboring regions (Hanes et al., 2017). The quantity and quality of supply and demand show increasingly large imbalances and contradictions in time and space scales, triggering a series of ecological risks that threaten urban ecological security (Wei et al., 2017; Lu et al., 2019). The protection of critical natural spaces with important ecological functions and the rational allocation of ES supply–demand has become an urgent challenge globally.
The last decade has seen increasing efforts to incorporate sustainability of ES provision into land management objectives and decisions on spatial priorities (Perrings et al., 2011). Building ecological security patterns to connect fragmented patches and allocate interregional ESs has become one of the most important strategies to improve the urban resilience to ecological risks and ES supply capacity (Xu et al., 2018; Koellner et al., 2019), especially in developing countries with population explosions and environmental degradation (Nel et al., 2017; Serra-Llobet and Hermida, 2017). However, it is uneconomical and difficult to a certain extent to directly increase the area of ecological land or connectivity among ES supply areas to some extent in the metropolitan and suburb areas with limited natural resources and dense construction land (Hyman and Leibowitz, 2000). Indeed, mismatches between the supply and high demand of ESs are a common phenomenon in rapidly urbanized areas (Zhai et al., 2020). To maximize the benefit gained from limited resources, identifying existing critical areas of high supply and demand and their interaction relationship can effectively and efficiently enable ES theory to be applied to the practice of local ecological conservation and restoration policies. Therefore, how to scientifically and accurately evaluate the association and spatial distribution of ESs and target their management becomes a key way to achieve sustainable provision and deployment of ESs and promote a balance between supply and demand.
Quantitative assessment of supply and demand is the focus and difficulty of ES research (Robinson et al., 2013). The current policies such as ecological red lines (Chen D. S. et al., 2021) and protected areas (Vieira et al., 2019) in some developing countries are precisely the assessment result of the spatial distribution of ESs to determine the space prohibited from development and construction or the conservation priority, ensuring the integrity of critical ecosystems and the effective ES supply. Thus, many scholars have conducted extensive research on the supply, demand, flows, trade-offs, and synergies of ESs (Burkhard et al., 2012; Peng et al., 2017). Most of the research studies initially focused on the ES supply, and as more attention has been paid to the role of ESs for human well-being, there have been an increasing number of articles examining the supply and demand at multiple scales (Gissi et al., 2015; Wei et al., 2017). However, in terms of assessment methods, most studies on ESs are biased toward the assessment of ES supply with the relatively systematic quantitative calculation models (Fu et al., 2017; Liu et al., 2019), while studies on the ES demand assessment are more fragmented, failing to form a generalized method that can be promoted. The assessment mainly includes three modes as follows: 1) ecosystem service value equivalent assessment based on the market theory. ES supply and demand are calculated with reference to the value equivalency table and then modified for site conditions (Xie et al., 2015). Because the value of each ES is greatly affected by market fluctuations, measuring it from an economic perspective can result in large regional errors (Morri et al., 2014; Castillo-Eguskitza et al., 2018). 2) Biophysical indicators calculation. The ES evaluation indicator system is constructed by selecting model formulas according to the principle of the ecological process, such as RUSLE, InVEST, RWEQ, and SWAT, and then spatially mapped based on remote sensing to characterize the assessment results (Li X. et al., 2021; Jiang et al., 2021). But this method is difficult to obtain complex and high-accuracy data, and the model types may be incomplete. 3) The expert participation method. By inviting experts in the relevant fields to conduct questionnaires and scores, the ES supply and demand of different land-use types are assessed (Hainz-Renetzeder et al., 2015; Liao et al., 2021). But it is obvious that this method is limited in accuracy due to subjective factors such as the expert preference and the understanding of the study area.
Previous studies usually choose one of the aforementioned methods to quantify the ESs, which primarily focuses on the supply of the ecosystem while ignoring the corresponding demand indicators (Xu et al., 2016). Actually, both the supply side and demand side should be taken into consideration in ES assessments, although the demand side lacks a widely accepted evaluation model. One approach is to shift attention from supply and focus on demand relative to the available supply, calculating the consumption of services to estimate the actual demand of stakeholders (Yahdjian et al., 2015). However, using only generalized models to calculate services without corrections means that it is difficult to obtain accurate evaluation results when the site has unique environmental characteristics or is very different from previous studies (Sherrouse et al., 2011; Cortinovis et al., 2021), resulting in insufficient guidance for identifying critical areas of ecological protection in practical applications. Furthermore, most ES assessment frameworks list and evaluate each type of service separately (Cortinovis and Geneletti, 2020), but the exploration of the supply–demand relationship among multiple ES categories in different spatial units is still limited (Chen L. et al., 2021). In recent years, some scholars have applied bivariate local indicators of spatial association (LISA) to reveal the spatial correlation between two variables specific to a scale (Tao and Thill, 2020; Chen et al., 2022). Hence, we attempted to use LISA to map the matching patterns of ES supply–demand, identifying important areas where ESs can be sustainably supplied.
Due to rapid urban expansion and economic development, environmental degradation and ecological risks are quite typical in China, especially in metropolis and surrounding rural areas like Beijing, Shanghai, and Guangzhou (Tao et al., 2016). To address the environmental crisis, the Chinese government has introduced pilot policies of ecological conservation based on interregional coordination (Peng et al., 2020), with the aim of driving the long-term sustainable development of the entire metropolitan suburb through ecological restoration practices in the suburbs around the cities. Hence, taking a typical waterside area, the ecological development demonstration area in Shanghai metropolitan area as an example, this study constructed a new composite assessment framework of ES supply–demand, quantitatively evaluated four ES types, and then explored the relationship and matching pattern of supply and demand, which will serve as a significant basis for the construction of regional ecological security pattern and the allocation of ecological resources in the future. The objectives of this study are to: 1) build a comprehensive ES assessment framework for the supply and demand; 2) quantify the surplus degree of different ESs and identify ecologically critical areas based on the matching patterns of supply–demand; 3) propose land zoning suggestions of protection, restoration, and management based on critical areas.
2 Materials and methods
2.1 Study area and data processing
Shanghai metropolitan area is one of the most developed and the most urbanized regions with a distinctive water–land environment in China (Shi and Zhou, 2009) (Figure 1A). The study area is a typical waterside suburb at the junction of Jiangsu, Zhejiang, and Shanghai (30°45′–31°17′E and 120°21′–121°19′N), whose administrative divisions include Qingpu, Wujiang, and Jiashan, covering an area of 2,143 km2 (Figure 1B). With flat terrain, densely covered lakes and rivers, and abundant waterside village settlements, the study area provides necessary ESs for the Shanghai metropolitan area and is an important ecological buffer for the transition from Taihu Lake to rapidly urbanized areas (Huang et al., 2021).
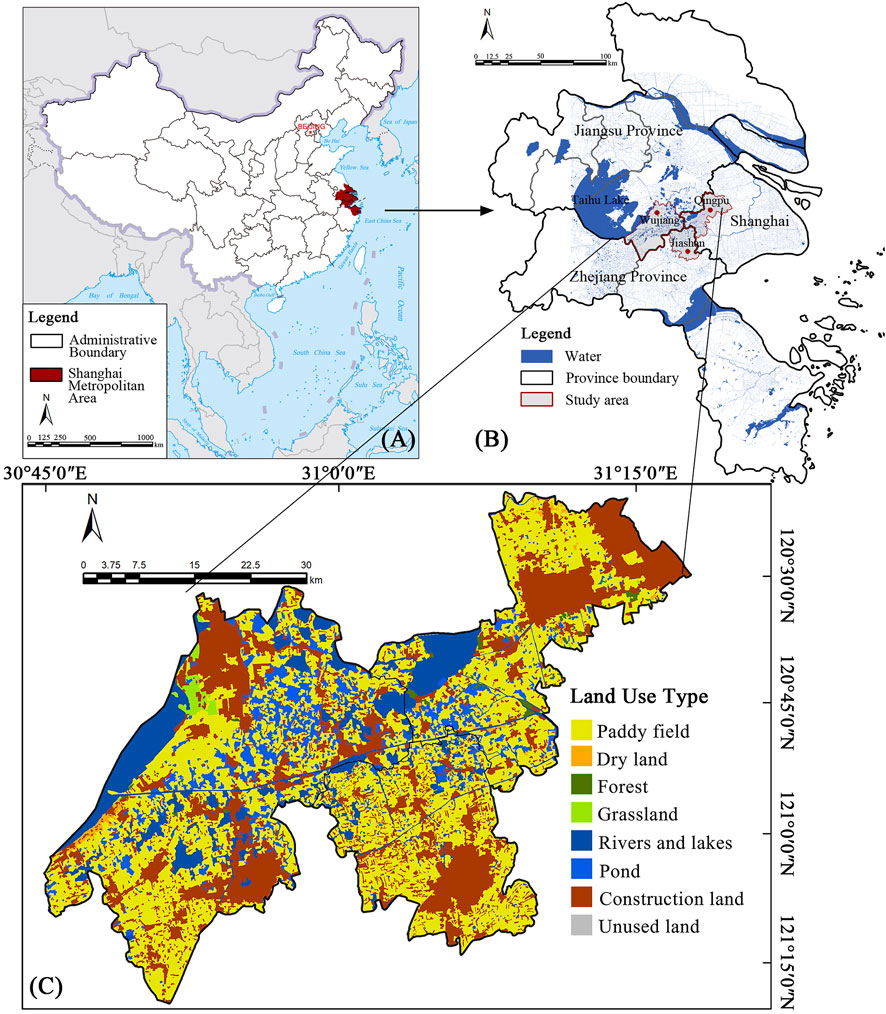
FIGURE 1. Geographical location of the study area. (A) Geographical location of Shanghai metropolitan area. (B) Location map of the study area. (C) Land-use type of the study area.
With the population growth, economic development, and rapid urban expansion (Zhang et al., 2008), the proportion of construction land in the study area has been increasing from 12.27% to 29.42% over the past 18 years, resulting in the severe loss of the traditional water network (Yin et al., 2011; National Bureau of Statistics of China, 2015), which still accounts for 20.45% of the total area (Figure 1C). Meanwhile, typical ecological risks caused by the extensive economic development mode in small-town clusters should be mitigated urgently, such as ecological patches fragmentation, lower landscape connectivity, serious flood disasters (Zhou et al., 2014), increased pollution emission (Wang et al., 2018), and wetland environment degradation (Ai et al., 2015; Xu et al., 2016). These environmental problems have become key factors restricting the economic development and destroying the distribution of ecological spaces in the study area.
The spatial datasets required for the ES supply and demand were selected based on the environmental characteristics of the study area, which are divided into two categories of biophysical data and socio-economic data, with a total of 13 spatial or statistical datasets (Table 1). All data were obtained from publicly accessible databases, whereas a few statistical datasets need to be spatially processed. In addition, the required information on the extent of nature reserves and cultural heritage sites was obtained through government documents (Supplementary Table S1). For the data sources with inconsistent original resolutions, they were uniformly interpolated and refined to a resolution of 30 m × 30 m in the subsequent calculation process. The latest version of some data available is 2015, and socio-economic data vary greatly from year to year. Therefore, in order to reduce the uncertainty of the results caused by the temporal and spatial errors among the aforementioned indicators of ES supply and demand assessment, the data of 2015 were used uniformly for the study, except for some biophysical data with few changes. The data (including population density data, point of interest data, and road map.) that did not need to be put into the evaluating formulas were standardized to a value between 0 and 1 for the subsequent assessment, while the other data were directly used in the calculation. All the raw image data were processed using the ArcGIS 10.7 platform for projection correction and boundary cropping.
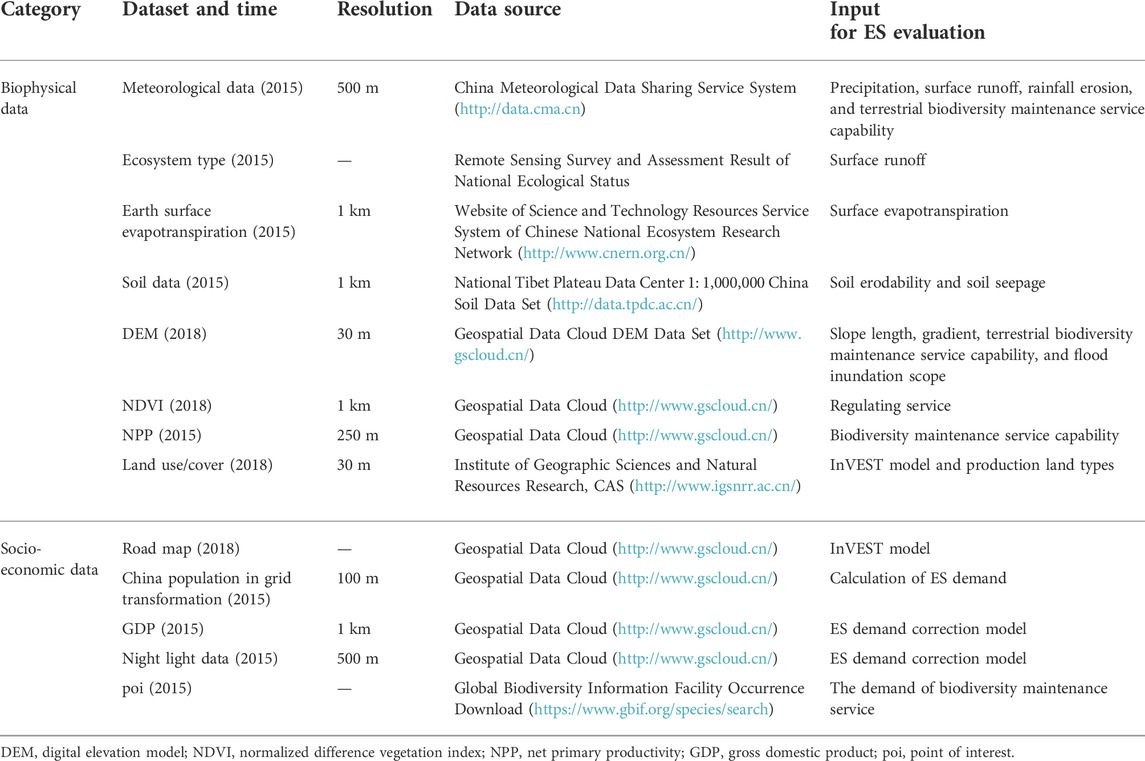
TABLE 1. Sources for input datasets.
2.2 Methodology framework for ecosystem service assessment
A methodology framework for assessing the ES supply–demand which is suitable for rapidly urbanized suburban areas around metropolises or sites with complex land–water environments is shown in Figure 2, and three main steps were identified. Considering the environmental characteristics, the core ecological risks, and relevant literature of the study area (Xu et al., 2017; Shen et al., 2021), we selected four main categories of ESs and 10 quantitative evaluation models so that services of supply and demand can correspond. The second step was to construct correction models based on the spatial heterogeneity of the waterside environment and socio-economic elements, so that the results of the ES supply and demand evaluation could be more compatible with the regional characteristics. Finally, we analyzed the ES supply–demand relationship and matching patterns, identified ecologically critical areas, and provided suggestions for land zoning management.
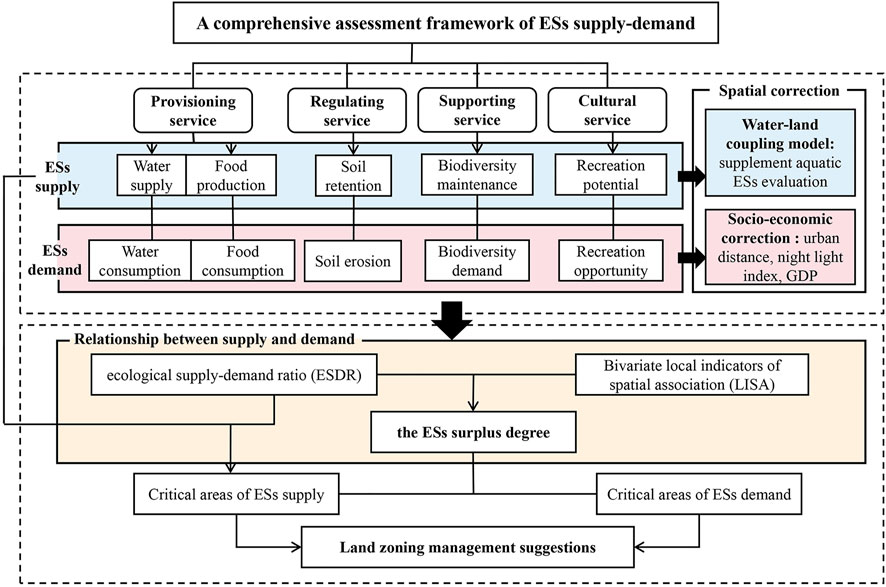
FIGURE 2. Research framework for assessing ES supply–demand.
2.3 Assessment of ecosystem service supply and demand
2.3.1 Constructing the supply and demand of the ecosystem service assessment system
According to the different ecological functions, ecosystem services are divided into four categories: provisioning services, regulating services, supporting services, and cultural services (Pereira et al., 2005; Fisher et al., 2009). Provisioning services (PS) are the material or energy output from ecosystems, including food and water supply, which in the typical waterside study area need to be considered in conjunction with the ecological processes of drinking water sources, agricultural irrigation water, and cultured water for fishery farming in the context of production land types. Regulating services (RSs) are services that ecosystems provide by acting as regulators, such as soil retention, flood storage, and climate regulation. Supporting services (SSs) are the services provided by ecosystems for the conservation of genes, species, and ecosystem diversity, which are mainly related to the species richness of local endemic plants and animals. Due to the difficulty in obtaining data on the distribution of local species, this study characterized supporting services by quantifying the suitability of organisms for survival by selecting environmental factors. Cultural services (CS) are the non-material benefits that people derive from ecosystems through spiritual enrichment, cognitive development, recreation, and aesthetic experiences. In the study area, we adopted waterfront cultural heritages and historic villages to evaluate cultural services. Comprehensive ecosystem services (CESs) overlay the aforementioned four services based on the weights obtained from experts scoring.
2.3.2 Quantifying the supply and demand of the individual ecosystem service
The study area located in the Middle–Lower Yangtze River Plain without a coastline is less sensitive to sandstorms and erosion which might lead to soil loss, and is not closely related to the ESs of wind prevention and sand fixation, coastal protection. Therefore, based on the characteristics of the regional ecological environment and the existing studies (Yu et al., 2020; Shen et al., 2021), we constructed the assessment framework for quantitative calculation with four ES categories and 10 individual indicators, including water supply (supply), food production (supply), water consumption (demand), and food consumption (demand) in the provisioning services, soil retention (supply) and soil erosion (demand) in the regulating service, biodiversity maintenance (supply) and biodiversity demand (demand) in the supporting service, recreation potential (supply) and recreation opportunity (demand) in the cultural service. The calculation models of the supply and demand index of 10 ES indicators are shown in Table 2.
(1) Water supply service (WS). The water supply service refers to the ability of the natural ecosystem to retain or store water resources from rainfall (Li B. Y. et al., 2020), which was calculated by the water-balance equation (Chen J. Y. et al., 2019).
(2) Water consumption service (WC). Water demand includes water consumption for agricultural, industrial, domestic, and ecological purposes (Chen J. Y. et al., 2019). Water consumption was calculated using 2015 per capita water use data for the study area.
(3) Food production service (FP). There is a strong correlation between food supply capacity and land productivity potential (Ouyang et al., 2016). The index of food production capacity was estimated using the total heat of grain crops, oil crops, and vegetables in cropland and the total heat of meat and milk in grassland according to NDVI. The total heat of aquatic products was equally distributed to water body grids.
(4) Food consumption service (FC). The food demand was expressed as the product of the population density and the total per capita food calorie demand given by the local statistical office (Chen J. Y. et al., 2019).
(5) Soil retention service (SR) and soil erosion service (SE). These services are the processes by which ecosystems reduce soil loss due to water erosion through its internal structure and movement, which are closely linked to topography, vegetation, and climatic environment (Asmamaw et al., 2021). These services are simulated by the Revised Universal Soil Loss Equation (RUSLE) model (Viswambharan and Sasidhar, 1987).
(6) Biodiversity maintenance service (BM). The biodiversity maintenance service adopted the habitat quality module in the InVEST model (Martínez-Harms and Balvanera, 2012). Habitat quality refers to the ability of an ecosystem to provide suitable conditions for the persistence of individuals and populations (McKinney, 2002).
(7) Biodiversity demand service (BD). The biodiversity demand service was calculated using the Global Biodiversity Information Facility (GBIF) occurrence POI data, and its spatially assigned weights are quantified by kernel density, and then Z-score standardization was obtained (Shao et al., 2021).
(8) Recreation potential service (RP). The recreation service is an important cultural ES provided by natural ecosystems for human beings, contributing to the improvement of human well-being (Nahuelhual et al., 2017). This service was defined as the ratio of the ecological space (forest land, grassland, and water) area to the total construction area.
(9) Recreation opportunity (RO). The recreation opportunity service is chosen to be characterized by the reverse accessibility from the origin to the sites of cultural landscape resources (Yin et al., 2008), and then combined with population density data to derive the recreation opportunity pressure index of every grid (Xu et al., 2020).
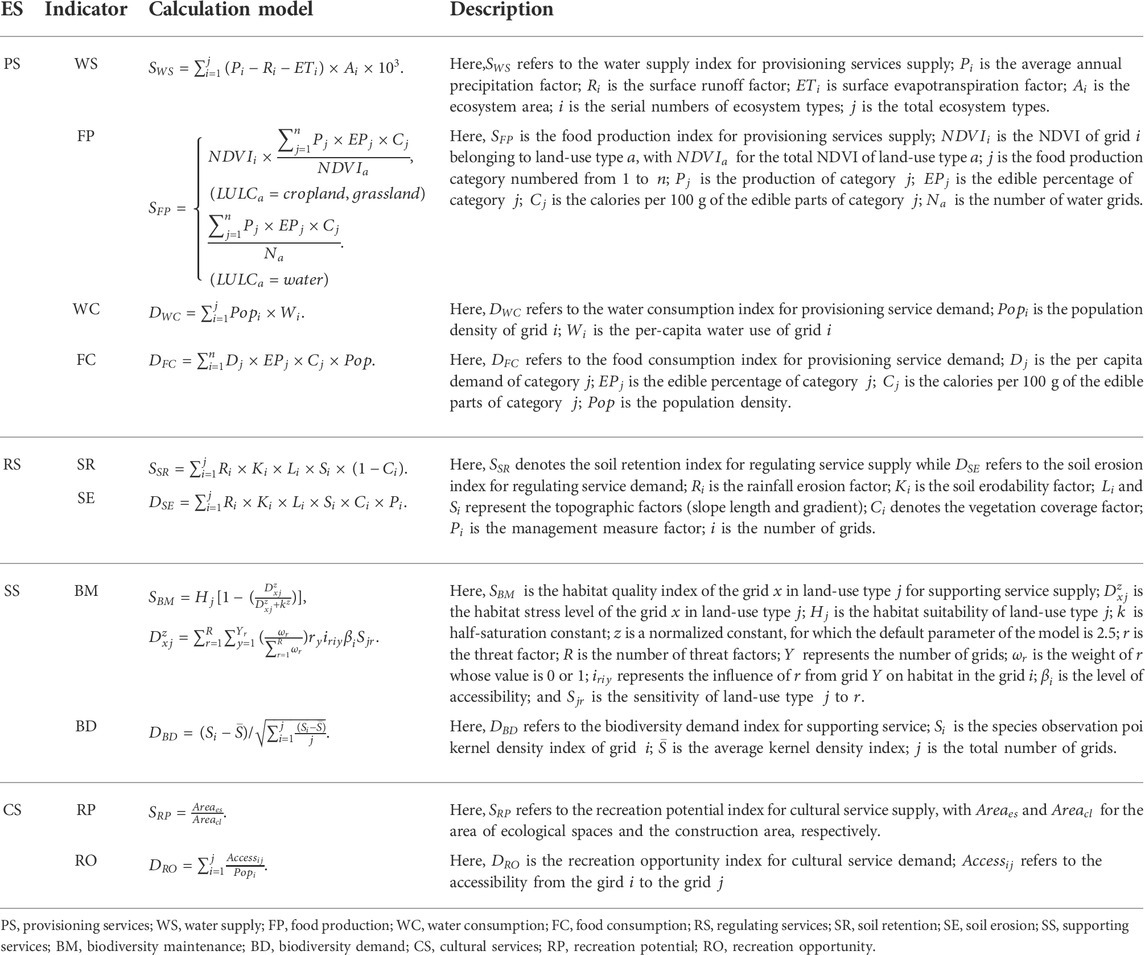
TABLE 2. Indicators and calculation models of four ESs.
2.3.3 Spatial correction model of ecosystem service assessment
Due to the spatial heterogeneity of natural, social, economic, and demographic influences, similar land-use types or ecological spaces may have different supply and demand potentials in the different scales of ecosystems (Liao et al., 2021). The study area has prominent geomorphological characteristics of the waterside environment (Shanghai Municipal Bureau of Planning and Natural Resources, 2019), which have a major influence on the ecological security pattern. In addition, the study area is located within a rapidly urbanized metropolitan area with dense population and active development, where socio-economic factors greatly influenced the public ES demand. Accordingly, this study proposed a spatial correction approach for the aforementioned results of the ES supply and demand assessment, which emphasized the influence caused by natural environmental features and socio-economic situation, improving the accuracy and comprehensiveness of ES evaluation.
2.3.3.1 Water–land coupling model for ES supply
According to the classification plan for ESs in the UN Millennium Ecosystem Assessment, we identified six services and 13 aquatic ES supply evaluation indicators to construct the aquatic ES correction model. A total of 12 experts were invited to conduct a questionnaire survey, whose research fields include landscape ecology, ES assessment and mapping, urban ecological design, and sustainable landscape. According to the experience and preferences of experts in relevant fields, the relative importance of each ES factor to the study area was determined based on the analytic hierarchy process method and used as the weights in the correction model (Table 3; Supplementary Figure S1). The individual indicator was divided into five ranks in the evaluating model, and then the rank values were transferred into ArcGIS 10.7 to map the spatial distribution of aquatic ES assessment result in the study area (detailed evaluation criteria of ranks, indicator sources, and questionnaire design are shown in the Supplementary Tables S2, S3 and Appendix B).
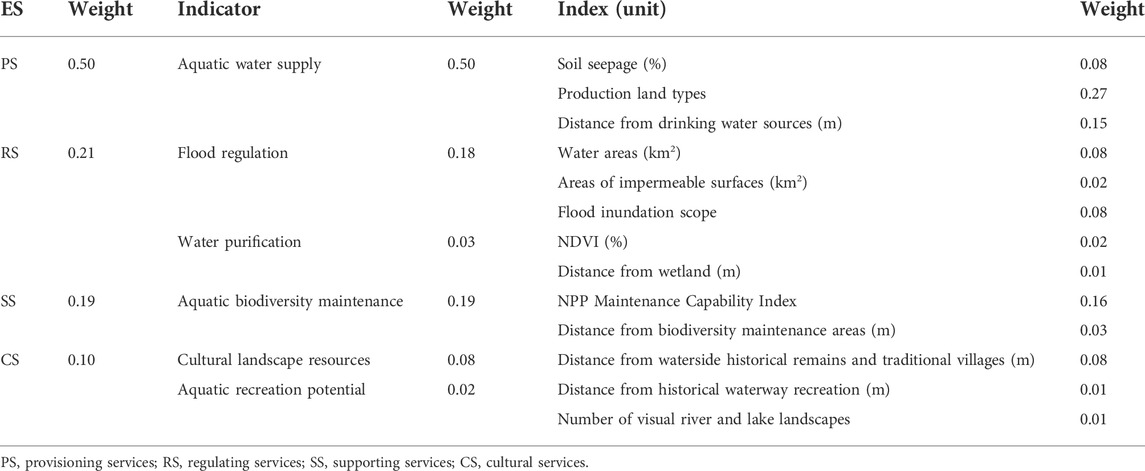
TABLE 3. Classification and weight of aquatic ES supply assessment.
The coupling refers to the interaction and influence between two or more systems and the coupling degree represents the extent of interaction between systems (Xiao et al., 2020), which has been widely adopted to investigate the relationships between urbanization and ESs (Sun et al., 2019; Tian et al., 2020). In this study, to better reflect the extent of interaction between the terrestrial and aquatic ecosystems based on the ES supply assessment, a land–water ES coupling model was constructed. The formula is:
where
2.3.3.2 Socio-economic correction model for ES demand
Referring to the related literature (Peng et al., 2017; Wang et al., 2019), three socio-economic indicators urban distance, night light index, and GDP, were selected in this study to express the spatial heterogeneity of ES demand (Supplementary Figure S2). Urban distance is the buffer value of urban areas at the county level and above, reflecting the intensity of human consumption of energy, the night light index can reflect the concentration of population in the region and the amount of demand on the environment, and GDP can indirectly reflect the human preference for the environment, and the higher the regional economic level is, the higher the expectation for economic growth. The specific formula of its correction model is as follows:
where
2.4 Relationship between supply and demand
2.4.1 Ecological supply–demand ratio
The ecological supply–demand ratio (ESDR), linking the actual supply of ESs and human demand, can be used to reveal the nature of surpluses or deficits (Li et al., 2016; Chen J. Y. et al., 2019). It was used to reflect the ES supply–demand characteristics in our study area and calculated according to the following formula:
where
2.4.2 Matching patterns of ecosystem service supply–demand
Bivariate local indicators of spatial association (LISA) can reflect the correlation between the attribute value of a spatial unit and the same attribute value on its adjacent spatial unit and the spatial aggregation degree (Zhao and Fan, 2018; Liu et al., 2019). We applied GeoDa software to visualize the spatial matching patterns of ES supply–demand in the study area (Anselin and Rey, 2014). Through the LISA analysis, the five matching patterns of ES supply–demand were identified, including “not significant,” “high–high” (high supply–high demand), “low–low” (low supply–low demand), “high–low” (high supply–low demand), and “low–high” (low supply–high demand). The calculation formula is as follows:
where
2.5 Identifying the critical areas based on the surplus degree of ecosystem services
2.5.1 Critical areas of ecosystem service supply
Supply critical areas are core components of regional ecological security patterns, which should not only ensure high-quality ecological functions, but also provide sustainable ESs for human well-being (Li S. C. et al., 2020; Jiang et al., 2021). These areas were required to have outstanding ES supply capacity that could meet the demand of other surrounding areas, and serve as stable ecological sources for the study area that the ES supply index should be greater than the demand index. Therefore, the patches within the top 1/2 score of the ES supply and ESDR standardized indices were extracted, with the intersections defined as critical areas of ES supply.
2.5.2 Critical areas of ecosystem service demand
Based on the results of ESDR and LISA analysis, we established a more integrated and detailed zoning structure of the ES supply–demand relationship, and combined the two indicators to evaluate the ES surplus degree of the study area, whose specific classification is shown in Table 4. The ES surplus degree was divided into 10 grades from zone 1 to zone 10 from high to low, and the patches in zone 10 with the lowest surplus degree (i.e., the highest deficit degree) of the composite ESs were defined as critical areas of ES demand.
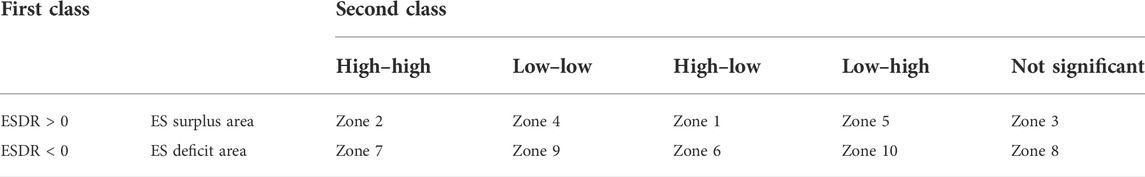
TABLE 4. Classification method of ES surplus degree.
3 Results
3.1 Supply, demand, and ESDR of ecosystem services
The supply–demand assessment results of four individual ESs and CESs stacked by expert scoring weights are shown in Table 5 and Figure 3 (detailed results are shown in Supplementary Figure S1). The supply index of the provisioning service is 0.35, the demand index is 0.08, and the difference of PS supply–demand is 0.27. Due to the distribution of drinking water sources, high PS supply is concentrated around Taihu Lake and Changbaidang in Jinze Town (Figure 3A). While high PS demand is located in three urban built-up areas and Fenhu high-tech zone in the central part of the study area with a high level of urbanization (Figure 3B). The provisioning service in most areas is in surplus (Figure 3C), with an area of 1,622.67 km2, accounting for 75.72% of the total area. The spatial distribution of deficit area is similar to the population density, which is mainly located in the city centers.
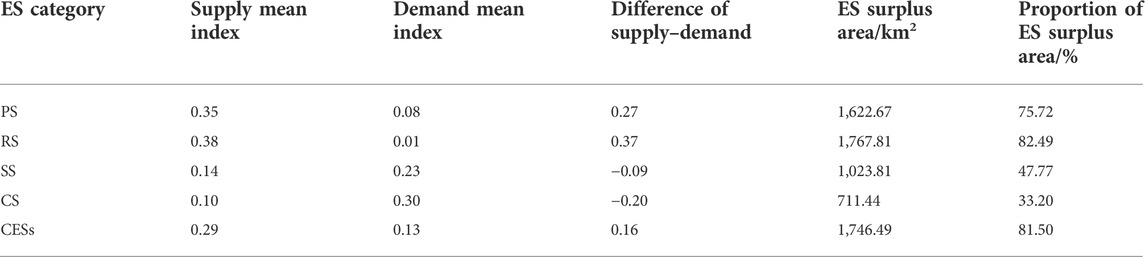
TABLE 5. Comparison of ES supply–demand in the study area.
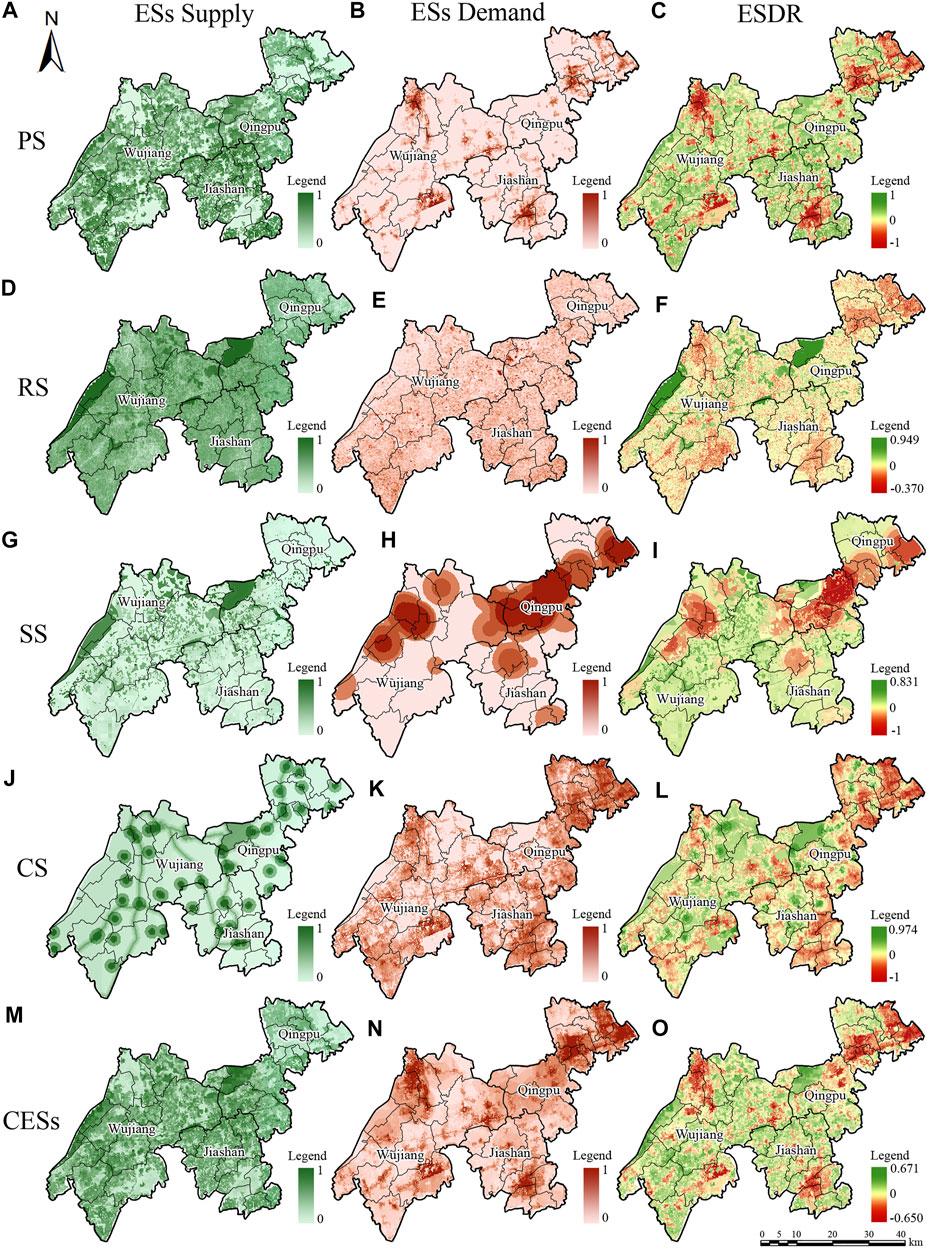
FIGURE 3. Spatial distribution of ES supply, demand, and ESDR. (A) PS supply; (B) PS demand; (C) ESDR for PS; (D) RS supply; (E) RS demand; (F) ESDR for RS; (G)SS supply; (H) SS demand; (I) ESDR for SS; (J) CS supply; (K) CS demand; (L) ESDR for CS; (M) CESs supply; (N) CESs demand; (O) ESDR for CESs. (PS:provisioning service; RS: regulating service; SS: supporting service; CS: cultural service; CESs: comprehensive ecosystem services; ESDR: ecological supply‐demand ratio).
The supply index of regulating service is 0.38, and the demand index is 0.01 which is significantly lower than the supply of 0.37. High RS supply is mainly located in Yudang–Dianshanhu Lake and Taihu Lake and other lakes with large areas (Figure 3D), whose intact surface form and stable aquatic ecosystem have a strong ability of retention and replenishment. On the other hand, the high RS demand showed an overall trend of high in the southeast and low in the northwest (Figure 3E). Although the level of urbanization in the urban centers is higher, the RS demand is not high, because the relatively higher hardening rate of the underlying surface led to less soil erosion. The RS supply–demand in more than half of the study area is balanced, and the surplus area is located in lakes and rivers, with an area of 1,767.81 km2, accounting for 82.49% of the total area (Figure 3F).
The supply index of supporting service is 0.14 while the demand index reached 0.23, with a difference of supply–demand is −0.09. The high SS supply area is also mainly located in large and medium-sized lakes, which showed a pattern of high in the north owing to the existence of several ecological reserves and low in the south (Figure 3G). The high SS demand is concentrated in the two special clusters of Dianshan Lake, Dalian Lake in Qingpu District and the east bank of Taihu Lake, with lower demand in the south (Figure 3H). The supporting service is mainly in deficit, with a deficit area of 1,119.19 km2 which is distributed in the east, accounting for 52.23% of the total area (Figure 3I). The spatial distribution of supporting service supply–demand is imbalanced.
The supply index of cultural service is 0.30, obviously 0.20 lower than the demand index. The high supply area is the buffer zone of historical waterways and cultural landscape heritages (Figure 3J), while the high demand was located around the construction land of towns and large-scale transport hubs (Figure 3K). In terms of ESDR, 66.80% of the study area shows a cultural service deficit, mainly in the eastern part and the suburbs of the study area with a relative lack of historical and cultural resources but high population density (Figure 3L). The surplus area is only 711.44 km2, accounting for 33.20% of the total area, with a serious problem of mismatch between the supply and demand of cultural service.
After weighting the aforementioned four services, the high supply area of composite ESs is mainly located in five special clusters, including Taihu Lake, Yuandang–Dianshan Lake, Fen Lake, Changyang region, Nanxing Lake region, and Changbaidang region, which are all natural spaces with the integrated distribution of lakes (Figure 3M). The spatial distribution of high demand is similar to the construction land, also forming five clusters: Qingpu urban area, Jiashan urban area, Wujiang urban area, Wujiang high-tech zone, and Fenhu high-tech zone (Figure 3N). Most of the study area shows a surplus of composite ESs, with a surplus area of 1,746.49 km2, accounting for 81.50% of the total area (Figure 3O).
3.2 Spatial matching analysis of ecosystem service supply–demand
After dividing the study area into 35 sub-district-level administrative units, the matching patterns of different ES supply–demand based on LISA analysis are identified in Figure 4. Table 6 shows that the pattern with the largest number of the provisioning service is a high–low correlation, whose spatial distribution includes the southern part of Wujiang District, Zhujiajiao Town in Qingpu District, and most of Jiashan District, accounting for 40% of the total number of town units, and only the PS supply and demand of Jinxi Town is matched (Figure 4A). Most of the town units show an insignificant correlation between the supply and demand of the regulating service, so the correlation of the RS supply–demand is only identified in 11 towns. These towns are mainly located in the marginal area of the study area, of which the number of towns with the low–low pattern is the largest, accounting for 17.14% of the total (Figure 4B). The supply capacity of supporting service is relatively insufficient, so the number of towns with the low–low and low–high correlation is the largest, reaching 57.14% of the total. While the four units with a high–low correlation that can provide surplus supporting service are all distributed in the eastern part of Wujiang District (Figure 4C). In the cultural service, a total of seven towns show a low–high correlation which mainly concentrate in the urban centers of Qingpu and Jiashan districts. Meanwhile, only Zhujiajiao Town that has a large number of lakes showed a surplus high–low correlation (Figure 4D).
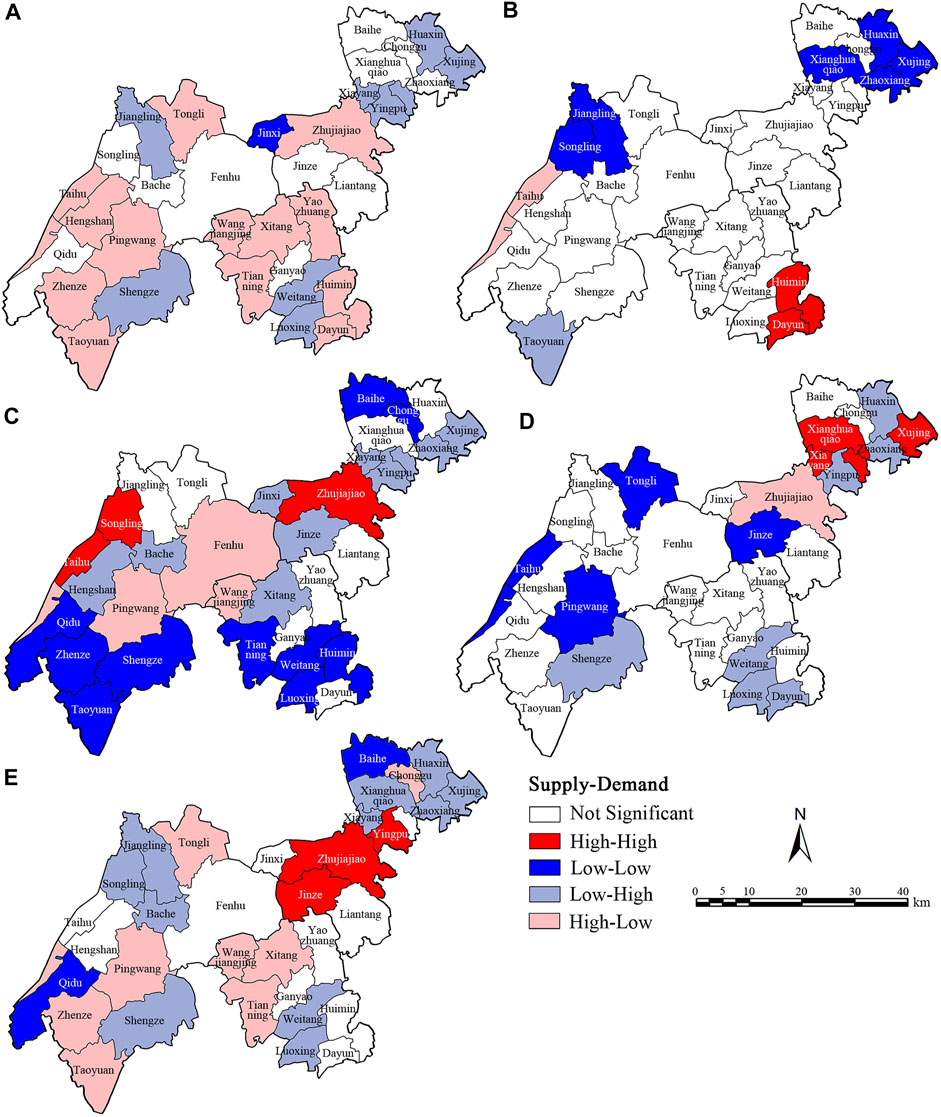
FIGURE 4. Bivariate LISA cluster maps of the matching patterns of ES supply–demand in the study area. (A) Provisioning service; (B) regulating service; (C) supporting service; (D) cultural service; (E) CESs.
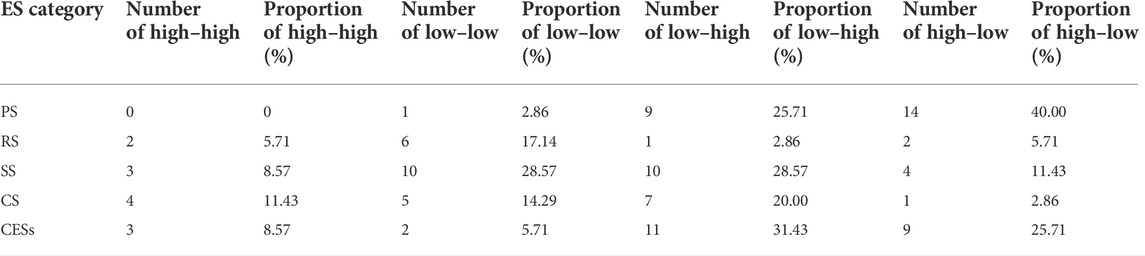
TABLE 6. Statistics of the matching patterns of ES supply–demand in the study area.
In all, the total number of towns with matched supply–demand for various ESs is much smaller than the number of towns with mismatched ES supply–demand in the study area. The CESs had three towns with a high–high correlation and two towns with a low–low correlation, and two mismatched patterns of 11 towns with low–high and nine towns with high–low, accounting for 31.43% and 25.71% of the total number, respectively (Figure 4E). The number of towns with mismatched ES supply–demand reaches 57.14%, so that the urban decision makers need to identify the critical areas for priority protection and restoration for the proper deployment of ecological resources.
3.3 Critical areas of ecosystem service supply–demand
Upon the fragmented patches with areas less than 1 km2 were removed, a total of 41 supply critical areas were selected, with an area of 206.79 km2, accounting for 9.65% of the total study area (Figure 5A). Most of the supply critical areas were located in Wujiang and Qingpu districts, with the overall spatial distribution characteristics of “more in the northwest and less in the southeast,” including Taihu Lake, Yuandang–Dianshan Lake, Changyang–Beimayang, Changbaidang Lake Area in Jinze Town and Nanxing Lake Area in Tongli Town are five spatial clusters. Generally, the supply critical areas have more intact ecological spaces and a stable natural environment. Due to the less influence from construction land expansion, human activities interference, and urban pollution emissions during the rapid urbanization of metropolitan areas, they deserve priority ecological protection.
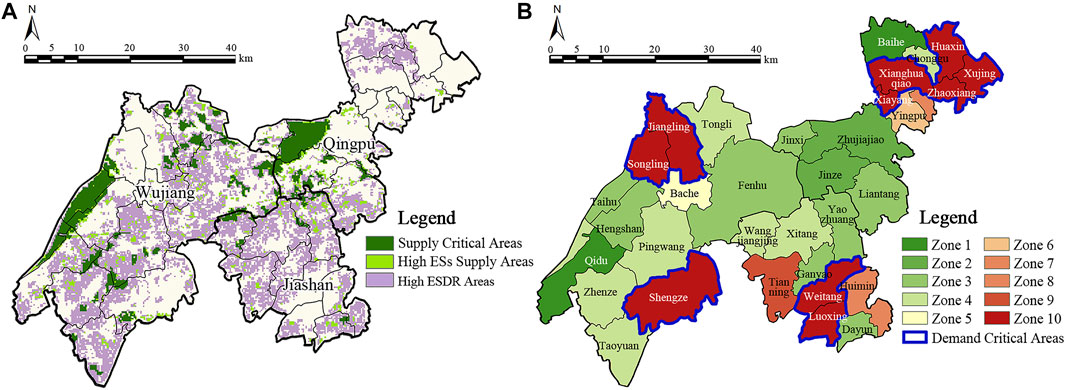
FIGURE 5. Spatial distribution of critical areas. (A) Critical areas of ES supply; (B) critical areas of ES demand.
According to the result of the composite ES surplus degree, 11 demand critical areas were identified, accounting for 31.43% of 35 towns in the study area, mainly distributed in the urban centers of Jiashan, Qingpu, and Wujiang districts and the Wujiang high-tech zone (Figure 5B). The individual ES surplus degree is shown in Supplementary Figure S3). It indicates that the ES supply is far from satisfying the demand and the ES deficit problem is serious in the densely populated built-up areas, which needs to be enhanced by the supply of demand in critical areas by strategies such as ecological restoration and construction of ecological security patterns.
4 Discussion
4.1 Corrections and advantages of composite ES assessment framework
In the rapidly urbanized areas surrounding metropolitan areas, the governance of natural spaces needs detailed strategies considering all the objectives to deal with complex and diverse ecological risks (Polasky et al., 2011). Most of the previous composite ES assessment frameworks focus on the selection of existing environmental indicator formulas for calculation, ignoring the fact that different regions have different dominant ESs that are inconvenient to quantify directly. Hence, before selecting ES types for the assessment framework, we prejudged the indicators of aquatic ES specific to waterside areas (Grizzetti et al., 2016; Tian et al., 2020), and used the land–water coupling degree as a supply correction model to compensate for the limitations of the traditional terrestrial calculation formula approach. The advantage of the proposed approach is that the aquatic ESs had a separate evaluating system. The supply capacity of aquatic ESs was characterized by mapping the environmental indicators that are water-related and had a potential impact on the aquatic ecosystem (Gao et al., 2017), such as distance from wetland, flood inundation scope, and areas of impermeable surfaces (Wang and Pan, 2019). To provide more comprehensive results, for each ES type, biophysical indicators or quantitative proxies capable of describing different aspects were selected (Zhao et al., 2019).
In addition, we improved the shortcomings of related literature works that rarely considered socio-economic indicators closely related to regional social and economic status, selected only biophysical indicators for ES assessment calculations (Cortinovis et al., 2021), and underestimated cultural services (Jiang et al., 2021; Yu et al., 2021). Based on the regional characteristics of the study area, we introduced a demand correction model emphasizing socio-economic impacts, and characterized the demand of local people for cultural services with the accessibility pressure index. This study provided references and inspiration for the refined assessment of cultural services at a smaller scale (Zhang et al., 2022), and was helpful to formulate targeted regional ecological space management strategies.
4.2 Imbalance between supply and demand of ecosystem services
The results of the spatial matching of ES supply–demand show that the total supply of CESs in the study area can satisfy the demand of residents. However, there is a distinct mismatch between the supply and demand with a high surplus in some ecological spaces and a high deficit in some urban spaces. The supply–demand relationship among different ESs can be determined as: regulating service > provisioning service > supporting service > cultural service, in which the supply of provisioning and regulation services is in surplus, and the supply of supporting and cultural services is in deficit.
The areas of imbalance between supply and demand of CESs and individual services show a great spatial consistency. Due to the high population density and rapid economic development in urban built-up areas, the limited scattered ecological spaces within the construction land can hardly meet the high demand of urban residents (Wang et al., 2019). In contrast, the vast rural areas and aquatic environments at the county scale have an abundance of potential ESs, but the transportation and supply to the urban centers are limited. In terms of the four individual ESs of the administrative units, PS has the most supply overflow units, and the supply surplus of farmland even exceeds the water space. This is because food production services in Shanghai metropolitan area can only be provided by agricultural land, and agricultural land is the most important water conservation space aside from the water body (Power, 2010). The RS of most rural areas shows a low value of the supply–demand balance. Nevertheless, human demand for flood regulation and water purification services has greatly increased in urban centers with serious environmental pollution (Larondelle et al., 2014), which is mismatched with the water spaces that supply RS mainly located in the suburbs. Both total supplies of SS and CS are less than the demand, while the supply deficit of SS is relatively small. In this study, the poi observation data of local species were used to represent the biodiversity demand, so the observation points with more species have a relatively high coincidence with the ecological spaces with rich species. Of course, in the eastern study area, which lacks water areas and forests but has a high population density, SS supply is still far from meeting the demand. The imbalance between CS supply and demand is the most serious, not only in construction land. As a waterside area rich in aquatic cultural landscape resources, recreation services are mainly supplied by urban parks, country parks, and traditional villages close to the water. However, the CS demand is affected by accessibility, recreational facilities, and human preferences (Chen L. et al., 2021; Li Z. H. et al., 2021), mainly distributed in urban centers and important inter-city transport hubs, which leads to the failure to form a significant corresponding relationship between supply and demand.
In summary, in critical areas where supply is greater than demand, researchers should pay more attention to the ES flows and the size of space and population that can be met by surplus ESs. In critical areas where supply is less than demand, we should focus on analyzing the environmental issues and solutions resulting from the imbalance between supply and demand, regarding the formulation of long-term development plans by decision makers.
4.3 Land zoning management suggestions and research limitations
In the rapidly urbanized areas surrounding metropolitan areas, the governance of natural spaces needs detailed strategies considering all the objectives to deal with complex and diverse ecological risks (Polasky et al., 2011; Meerow, 2019). Our research results can provide a spatial reference for decision-making on optimal land zoning management and ecological protection in future regional ecological network planning. According to the identification results of critical areas for supply and demand and the different characteristics of ES surplus degree (Supplementary Figure S3), the land zoning of the study area revealed that the spatial priorities were determined as four divisions (Figure 6). In order to provide the multi-categories and full ranges of ES supply, the zoning of ecological function areas should preferably follow a sustainable system with balanced supply and demand of each ES (Seppelt et al., 2011; Field and Parrott, 2017). Therefore, according to the imbalance between ES supply and demand, we proposed corresponding land zoning management measures as follows:
(1) Ecological conservation area. All the supply critical areas are contained in the ecological conservation area and none of which is in deficit. It has a strong capacity to deliver various ESs and a decisive impact on the regional ES supply. This region has a good ecological base, sparsely distributed population distribution and less interference from human production activities, including two tourist attractions of Taihu Lake and Yuandang–Dianshan Lake. In view of this, new development and construction activities harmful to the environment should be prohibited, while the big lake patches should be protected as a waterside cultural core based on the local cultural landscape heritage.
(2) Ecological improvement area. It not only provides surplus provisioning and regulating services but connects the ecological conservation area and urban spaces to a certain extent. This region serves as an important buffer barrier against human interference and protects the ecological conservation area from its surrounding. For these location-critical spaces, it is necessary to limit the scale of development, guide the distribution of population, townships, and industries in an orderly manner, and protect habitats to improve the supply of supporting and cultural services to mitigate the impact of rapid urbanization.
(3) Ecological regulation area. The provisioning and regulating services supplied in ecological regulation areas are slightly greater than the demand of residents, while the supporting and cultural services are in deficit. The main focus is to protect and restore the natural vegetation by adjusting and enriching the plant community structure, so as to recover the original capacity of ES supply before urbanization. Meanwhile, decision makers should strengthen the control over the scale of construction land and agricultural land to alleviate and relieve the pressure of the demand in the urban centers.
(4) Ecological restoration area. All the demand critical areas are contained in the ecological restoration area and at least three types of ESs are in deficit. The ES supply in ecological restoration areas cannot always meet the demand or even have serious deficit problems. This region is the place where most human activities of production and living take place, which is the core area of urbanization development, far from the supply critical areas. We suggest the city adopt betterment and ecological restoration models without affecting the normal economic development, and steadily improve ES supply capacity (Cao et al., 2020). In addition, based on this ES assessment and close integration with urban planning in the study area, decision makers can better manage finely the impact of population growth and urbanization expansion on regional ecological functions, and reduce the spatial mismatch of ES supply and demand.
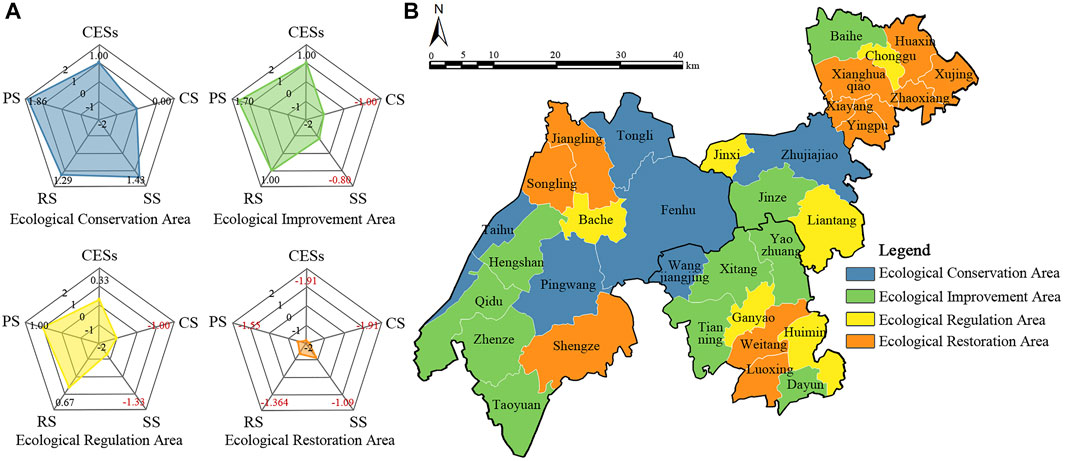
FIGURE 6. Ecological land zoning in the study area. (A) Characteristics of ES surplus degree in four divisions. (B) Land zoning for spatial protection priorities.
There are some limitations and uncertainties in this study. First, the quantitative calculation of ES supply and demand was greatly constrained by the regional scale and data accuracy, so the construction of composite assessment framework and screening techniques for critical areas inevitably have errors (Chen F. Y. et al., 2019). To obtain and use the multi-source data extracted with intelligent technology will be one of the challenges worthy of attention in future quantitative studies (Lin et al., 2018). Second, this study is still stuck in the static perspective of function-oriented ES mapping and assessment, relying on regional data slices of a certain period in the past for analysis. The identification of morphologically oriented critical areas and the construction of ecological security patterns under the scenarios of dynamic land-use changes can be further explored in the future (Shi et al., 2020; Liang et al., 2021).
5 Conclusion
In this study, we constructed a comprehensive assessment framework to quantify and map the ES supply–demand including provisioning, regulating, supporting, and cultural services, and modified the supply and demand evaluation of individual ESs by land–water coupling and socio-economic correction models. In addition, we explored the ES supply–demand relationship and matching patterns in a typical area around rapidly urbanized metropolitan areas, identifying ecologically critical areas. This research provided a theoretical basis for allocating various ESs reasonably, land zoning and precise management of ecologically critical areas. The results show that the ESDR was ranked as regulating > provisioning > supporting > cultural, in which provisioning and regulating services were in surplus while the supporting and cultural services were in deficit. Based on the ES supply–demand matching patterns, 41 patches were identified as supply critical areas, with an area of 206.79 km2, accounting for 9.65% of the total area, showing a spatial pattern of “more in the northwest and less in the southeast.” A total of 11 towns were identified as demand critical areas, accounting for 31.43% of the total number of town units in the study area, with the prominent contradiction of ES supply–demand imbalance and mismatch. Finally, we further proposed a land-zoning control strategy based on the ES surplus degree. Based on our study, decision makers can protect supply critical areas, restore demand critical areas, and connect broken ecological sources according to zoning without affecting normal economic development. This study is of great significance for the construction of regional ecological security patterns, the smart transformation and management of land use around metropolitan areas in other developing countries.
Data availability statement
The original contributions presented in the study are included in the article/Supplementary Material; further inquiries can be directed to the corresponding author.
Ethics statement
Ethics review and approval/written informed consent was not required as per local legislation and institutional requirements.
Author contributions
YN: conceptualization; data curation; methodology; software; validation; formal analysis; investigation; writing—original draft; visualization. JW: conceptualization; methodology; validation; formal analysis; resources; writing—review and editing. TW: validation; resources; supervision; writing—review and editing. MG: supervision; writing—review and editing. QH: supervision; writing—review and editing. MZ: supervision; writing—review and editing.
Funding
This research was funded by the National Natural Science Foundation of China (No. 32001360), the Natural Science Foundation of Jiangsu Province (No. BK20190545), and the Fundamental Research Funds for the Central Universities (130ZJ21195002).
Conflict of interest
The authors declare that the research was conducted in the absence of any commercial or financial relationships that could be construed as a potential conflict of interest.
Publisher’s note
All claims expressed in this article are solely those of the authors and do not necessarily represent those of their affiliated organizations, or those of the publisher, the editors, and the reviewers. Any product that may be evaluated in this article, or claim that may be made by its manufacturer, is not guaranteed or endorsed by the publisher.
Supplementary material
The Supplementary Material for this article can be found online at: https://www.frontiersin.org/articles/10.3389/feart.2022.943910/full#supplementary-material
References
Ai, J. Y., Sun, X., Feng, L., Li, Y. F., and Zhu, X. D. (2015). Analyzing the spatial patterns and drivers of ecosystem services in rapidly urbanizing Taihu Lake Basin of China. Front. Earth Sci. 9 (3), 531–545. doi:10.1007/s11707-014-0484-1
Anselin, L., and Rey, S. J. (2014). Modern spatial econometrics in practice: A guide to GeoDa, GeoDaSpace and PySAL. Urbana, United States: GeoDa Press LLC.
Asmamaw, L., Mohammed, A., and Mathias, T. (2021). Predicting soil erosion by water: Rusle application for soil conservation planning in central rift valley of Ethiopia. Environ. Eng. Manag. J. 20 (9), 1521–1534. doi:10.30638/eemj.2021.141
Bongaarts, J. (2019). IPBES, 2019. Summary for policymakers of the global assessment report on biodiversity and ecosystem services of the Intergovernmental Science‐Policy Platform on Biodiversity and Ecosystem Services. Popul. Dev. Rev. 45 (3), 680–681. doi:10.1111/padr.12283
Burkhard, B., Kroll, F., Nedkov, S., and Müller, F. (2012). Mapping ecosystem service supply, demand and budgets. Ecol. Indic. 21, 17–29. doi:10.1016/j.ecolind.2011.06.019
Cao, Y., Cao, G. Y., Li, Y. H., Tian, X. Q., Fang, Y., Li, Y. Z., et al. (2020). Linking ecosystem services trade-offs, bundles and hotspot identification with cropland management in the coastal Hangzhou Bay area of China. Land Use Policy 97, 104689. doi:10.1016/j.landusepol.2020.104689
Castillo-Eguskitza, N., Martín-López, B., and Onaindia, M. (2018). A comprehensive assessment of ecosystem services: Integrating supply, demand and interest in the Urdaibai Biosphere Reserve. Ecol. Indic. 93, 1176–1189. doi:10.1016/j.ecolind.2018.06.004
Chen, D. S., Pan, Y. Q., Jin, X. L., Du, H. Y., Li, M. C., and Jiang, P. H. (2021). The delineation of ecological redline area for catchment sustainable management from the perspective of ecosystem services and social needs: A case study of the xiangjiang watershed, China. Ecol. Indic. 121, 107130. doi:10.1016/j.ecolind.2020.107130
Chen, L., Pei, S., Liu, X. N., Qiao, Q., and Liu, C. L. (2021). Mapping and analysing tradeoffs, synergies and losses among multiple ecosystem services across a transitional area in Beijing, China. Ecol. Indic. 123, 107329. doi:10.1016/j.ecolind.2020.107329
Chen., F. Y., Li, L., Niu, J. Q., Lin, A. W., Chen, S. Y., and Hao, L. (2019). Evaluating ecosystem services supply and demand dynamics and ecological zoning management in wuhan, China. Int. J. Environ. Res. Public Health. 16 (13), 2332. doi:10.3390/ijerph16132332
Chen, J. Y., Jiang, B., Bai, Y., Xu, X. B., and Alatalo, J. M. (2019). Quantifying ecosystem services supply and demand shortfalls and mismatches for management optimisation. Sci. Total Environ. 650, 1426–1439. doi:10.1016/j.scitotenv.2018.09.126
Chen, H., Yan, W. T., Li, Z. H., Wende, W., Xiao, S. L., Wan, S. L., et al. (2022). Spatial patterns of associations among ecosystem services across different spatial scales in metropolitan areas: A case study of Shanghai, China. Ecol. Indic. 136, 108682. doi:10.1016/j.ecolind.2022.108682
Cortinovis, C., and Geneletti, D. (2020). A performance-based planning approach integrating supply and demand of urban ecosystem services. Landsc. Urban Plan. 201, 103842. doi:10.1016/j.landurbplan.2020.103842
Cortinovis, C., Geneletti, D., and Hedlund, K. (2021). Synthesizing multiple ecosystem service assessments for urban planning: A review of approaches, and recommendations. Landsc. Urban Plan. 213, 104129. doi:10.1016/j.landurbplan.2021.104129
Daily, G. C. (1997). Nature’s services: Societal dependence on natural ecosystems. Washington. DC, USA: Island Press.
Delphin, S., Escobedo, F. J., Abd-Elrahman, A., and Cropper, W. P. (2016). Urbanization as a land use change driver of forest ecosystem services. Land Use Policy 54, 188–199. doi:10.1016/j.landusepol.2016.02.006
Dooley, E. E. (2005). EHPnet: Millennium ecosystem Assessment. Environ. Health Perspect. 113, A591–A591. doi:10.1289/ehp.113-a591
Field, R. D., and Parrott, L. (2017). Multi-ecosystem services networks: A new perspective for assessing landscape connectivity and resilience. Ecol. Complex. 32, 31–41. doi:10.1016/j.ecocom.2017.08.004
Fisher, B., Turner, R. K., and Morling, P. (2009). Defining and classifying ecosystem services for decision making. Ecol. Econ. 68 (3), 643–653. doi:10.1016/j.ecolecon.2008.09.014
Fu, B. J., Yu, D. D., and Lv, N. (2017). An indicator system for biodiversity and ecosystem services evaluation in China. Acta Ecol. Sin. 37 (2), 341–348. doi:10.5846/stxb201611092273
Gao, J., Li, F., Gao, H., Zhou, C. B., and Zhang, X. L. (2017). The impact of land-use change on water-related ecosystem services: A study of the guishui river basin, beijing, China. J. Clean. Prod. 163, S148–S155. doi:10.1016/j.jclepro.2016.01.049
Ghosh, S., Chatterjee, N. D., and Dinda, S. (2021). Urban ecological security assessment and forecasting using integrated DEMATEL-ANP and CA-markov models: A case study on Kolkata metropolitan area, India. Sustain Cities Soc. 68, 102773. doi:10.1016/j.scs.2021.102773
Gissi, E., Burkhard, B., and Verburg, P. H. (2015). Ecosystem services: Building informed policies to orient landscape dynamics. Int. J. Biodivers. Sci. Ecosyst. Serv. Manag. 11 (3), 185–189. doi:10.1080/21513732.2015.1071939
Grizzetti, B., Lanzanova, D., Liquete, C., Reynaud, A., and Cardoso, A. C. (2016). Assessing water ecosystem services for water resource management. Environ. Sci. Policy 61, 194–203. doi:10.1016/j.envsci.2016.04.008
Hainz-Renetzeder, C., Schneidergruber, A., Kuttner, M., and Wrbka, T. (2015). Assessing the potential supply of landscape services to support ecological restoration of degraded landscapes: A case study in the Austrian-Hungarian trans-boundary region of lake neusiedl. Ecol. Model. 295, 196–206. doi:10.1016/j.ecolmodel.2014.07.001
Hanes, R. J., Gopalakrishnan, V., and Bakshi, B. R. (2017). Synergies and trade-offs in renewable energy landscapes: Balancing energy production with economics and ecosystem services. Appl. Energy 199, 25–44. doi:10.1016/j.apenergy.2017.04.081
Huang, L. Y., Wang, J., Fang, Y., Zhai, T. L., and Cheng, H. (2021). An integrated approach towards spatial identification of restored and conserved priority areas of ecological network for implementation planning in metropolitan region. Sustain. Cities Soc. 69, 102865. doi:10.1016/j.scs.2021.102865
Hyman, J. B., and Leibowitz, S. G. (2000). A general framework for prioritizing land units for ecological protection and restoration. Environ. Manag. 25, 23–35. doi:10.1007/s002679910003
Jiang, H., Peng, J., Dong, J. Q., Zhang, Z. M., Xu, Z. H., and Meersmans, J. (2021). Linking ecological background and demand to identify ecological security patterns across the Guangdong-Hong Kong-Macao Greater Bay Area in China. Landsc. Ecol. 36 (7), 2135–2150. doi:10.1007/s10980-021-01234-6
Koellner, T., Bonn, A., Arnhold, S., Bagstad, K. J., Fridman, D., Guerra, C. A., et al. (2019). Guidance for assessing interregional ecosystem service flows. Ecol. Indic. 105, 92–106. doi:10.1016/j.ecolind.2019.04.046
Larondelle, N., Haase, D., and Kabisch, N. (2014). Mapping the diversity of regulating ecosystem services in European cities. Glob. Environ. Change 26, 119–129. doi:10.1016/j.gloenvcha.2014.04.008
Li., B. Y., Wang, W., and Wang, Y. C. (2020). Identifying the relationships among multiple ecosystem services. J. Arid. Environ. 183, 104265. doi:10.1016/j.jaridenv.2020.104265
Li., S. C., Xiao, W., Zhao, Y. L., and Lv, X. J. (2020). Incorporating ecological risk index in the multi-process mcre model to optimize the ecological security pattern in a semi-arid area with intensive coal mining: A case study in northern China. J. Clean. Prod. 247, 119143. doi:10.1016/j.jclepro.2019.119143
Li, J. H., Jiang, H. W., Bai, Y., Alatalo, J. M., Li, X., Jiang, H. W., et al. (2016). Indicators for spatial-temporal comparisons of ecosystem service status between regions: A case study of the Taihu river basin, China. Ecol. Indic. 60, 1008–1016. doi:10.1016/j.ecolind.2015.09.002
Li, X., Yu, X., Wu, K. N., Feng, Z., Liu, Y. N., and Li, X. L. (2021). Land-use zoning management to protecting the regional key ecosystem services: A case study in the city belt along the chaobai river, China. Sci. Total Environ. 762, 143167. doi:10.1016/j.scitotenv.2020.143167
Li, Z. H., Chen, H., and Yan, W. T. (2021). Exploring spatial distribution of urban park service areas in Shanghai based on travel time estimation: A method combining multi-source data. Int J Geo-Inf. 10 (9), 608. doi:10.3390/ijgi10090608
Liang, X., Guan, Q. F., Clarke, K. C., Liu, S. S., Wang, B. Y., and Yao, Y. (2021). Understanding the drivers of sustainable land expansion using a patch-generating land use simulation (plus) model: A case study in wuhan, China. Comput. Environ. Urban Syst. 85, 101569. doi:10.1016/j.compenvurbsys.2020.101569
Liao, G. T., He, P., Gao, X. S., Lin, Z. Y., Fang, C. G., Zhou, W., et al. (2021). Identifying critical area of ecosystem service supply and demand at different scales based on spatial heterogeneity assessment and SOFM neural network. Front. Env. Sci-Switz 9, 714874. doi:10.3389/fenvs.2021.714874
Lin, S. W., Wu, R. D., Yang, F. L., Wang, J. J., and Wu, W. (2018). Spatial trade-offs and synergies among ecosystem services within a global biodiversity hotspot. Ecol. Indic. 84, 371–381. doi:10.1016/j.ecolind.2017.09.007
Liu, L. L., Zhang, H. B., Gao, Y., Zhu, W. J., Liu, X., and Xu, Q. D. (2019). Hotspot identification and interaction analyses of the provisioning of multiple ecosystem services: Case study of Shaanxi Province, China. Ecol. Indic. 107, 105566. doi:10.1016/j.ecolind.2019.105566
Lu, L., Weng, Q., Guo, H., Feng, S., and Li, Q. (2019). Assessment of urban environmental change using multi-source remote sensing time series (2000-2016): A comparative analysis in selected megacities in eurasia. Sci. Total Environ. 684, 567–577. doi:10.1016/j.scitotenv.2019.05.344
Martínez-Harms, M., and Balvanera, P. (2012). Methods for mapping ecosystem service supply: A review. Int. J. Biodivers. Sci. Ecosyst. Serv. Manag. 8 (1-2), 17–25. doi:10.1080/21513732.2012.663792
McKinney, M. L. (2002). Urbanization, biodiversity, and conservation. Bioscience 52, 883–890. doi:10.1641/0006-3568(2002)052[0883:ubac]2.0.co;2
Meerow, S. (2019). A green infrastructure spatial planning model for evaluating ecosystem service tradeoffs and synergies across three coastal megacities. Environ. Res. Lett. 14 (12), 125011. doi:10.1088/1748-9326/ab502c
Mehring, M., Ott, E., and Hummel, D. (2018). Ecosystem services supply and demand assessment: Why social-ecological dynamics matter. Ecosyst. Serv. 30, 124–125. doi:10.1016/j.ecoser.2018.02.009
Morri, E., Pruscini, F., Scolozzi, R., and Santolini, R. (2014). A forest ecosystem services evaluation at the river basin scale: Supply and demand between coastal areas and upstream lands (Italy). Ecol. Indic. 37, 210–219. doi:10.1016/j.ecolind.2013.08.016
Nahuelhual, L., Vergara, X., Kusch, A., Campos, G., and Droguett, D. (2017). Mapping ecosystem services for marine spatial planning: Recreation opportunities in Sub-Antarctic Chile. Mar. Policy 81, 211–218. doi:10.1016/j.marpol.2017.03.038
National Bureau of Statistics of China (2015). China statistical yearbook (1978-2015). [Online]. Available at: http://www.stats.gov.cn/tjsj/ndsj/2015/indexch.htm (Accessed February 21, 2022).
Nel, J. L., Le Maitre, D. C., Roux, D. J., Colvin, C., Smith, J. S., Smith-Adao, L. B., et al. (2017). Strategic water source areas for urban water security: Making the connection between protecting ecosystems and benefiting from their services. Ecosyst. Serv. 28, 251–259. doi:10.1016/j.ecoser.2017.07.013
Ouyang, Z., Zheng, H., Xiao, Y., Polasky, S., Liu, J., Xu, W., et al. (2016). Improvements in ecosystem services from investments in natural capital. Science 352 (6292), 1455–1459. doi:10.1126/science.aaf2295
Peng, J., Hu, Y. N., Dong, J. Q., Mao, Q., Liu, Y. X., Du, Y. Y., et al. (2020). Linking spatial differentiation with sustainability management: Academic contributions and research directions of physical geography in China. Prog. Phys. Geogr. Earth Environ. 44 (1), 14–30. doi:10.1177/0309133319878107
Peng, J., Zhao, H., Liu, Y., and Wu, J. (2017). Research progress on ecosystem service trade-offs: From cognition to decision-making. Acta Geogr. Sin. 72 (06), 960–973. doi:10.11821/dlxb201706002
Pereira, E., Queiroz, C., Pereira, H. M., and Vicente, L. (2005). Ecosystem services and human well-being: A participatory study in a mountain community in Portugal. Ecol. Soc. 10 (2). doi:10.5751/es-01353-100214
Perrings, C., Duraiappah, A., Larigauderie, A., and Mooney, H. (2011). The biodiversity and ecosystem services science-policy interface. Science 331 (6021), 1139–1140. doi:10.1126/science.1202400
Polasky, S., Nelson, E., Pennington, D., and Johnson, K. A. (2011). The impact of land-use change on ecosystem services, biodiversity and returns to landowners: A case study in the state of Minnesota. Environ. Resour. Econ. 48 (2), 219–242. doi:10.1007/s10640-010-9407-0
Power, A. G. (2010). Ecosystem services and agriculture: Tradeoffs and synergies. Phil. Trans. R. Soc. B 365 (1554), 2959–2971. doi:10.1098/rstb.2010.0143
Robinson, D. A., Jackson, B. M., Clothier, B. E., Dominati, E. J., Marchant, S. C., Cooper, D. M., et al. (2013). Advances in soil ecosystem services: Concepts, models, and applications for Earth system life support. Vadose Zone J. 12 (4), vzj2013.01.0027–13. doi:10.2136/vzj2013.01.0027
Sannigrahi, S., Chakraborti, S., Joshi, P. K., Keesstra, S., Sen, S., Paul, S. K., et al. (2019). Ecosystem service value assessment of a natural reserve region for strengthening protection and conservation. J. Environ. Manag. 244, 208–227. doi:10.1016/j.jenvman.2019.04.095
Seppelt, R., Dormann, C. F., Eppink, F. V., Lautenbach, S., and Schmidt, S. (2011). A quantitative review of ecosystem service studies: Approaches, shortcomings and the road ahead. J. Appl. Ecol. 48 (3), 630–636. doi:10.1111/j.1365-2664.2010.01952.x
Serra-Llobet, A., and Hermida, M. A. (2017). Opportunities for green infrastructure under Ecuador's new legal framework. Landsc. Urban Plan. 159, 1–4. doi:10.1016/j.landurbplan.2016.02.004
Shanghai Municipal Bureau of Planning and Natural Resources (2019). Draft of overall planning for national space of green ecological integration development demonstration zone in Yangtze River delta (2019-2035). Jiangsu Provincial Department of Natural Resources., and Zhejiang Provincial Department of Natural Resources. [Online]. Available: http://ghzyj.sh.gov.cn/ghgs/20200617/970bdc96c4f8425c8ab0aa57438a6622.html (Accessed March 17, 2022).
Shao, M., Li, F. Z., and Li, X. (2021). Evaluation of supply and demand of green space ecosystem service function in chengdu-chongqing urban agglomeration based on multi-source data. Landsc. Archit. 28 (01), 60–66. doi:10.14085/j.fjyl.2021.01.0060.07
Shen, J. K., Guo, X. L., and Wang, Y. C. (2021). Identifying and setting the natural spaces priority based on the multi-ecosystem services capacity index. Ecol. Indic. 125, 107473. doi:10.1016/j.ecolind.2021.107473
Sherrouse, B. C., Clement, J. M., and Semmens, D. J. (2011). A GIS application for assessing, mapping, and quantifying the social values of ecosystem services. Appl. Geogr. 31, 748–760. doi:10.1016/j.apgeog.2010.08.002
Shi, Y. S., Shi, D. H., Zhou, L. L., and Fang, R. B. (2020). Identification of ecosystem services supply and demand areas and simulation of ecosystem service flows in Shanghai. Ecol. Indic. 115, 106418. doi:10.1016/j.ecolind.2020.106418
Shi, Y., and Zhou, Y. (2009). The discussion and commentary on the study of megalopolis (metropolitan interlocking region). Int. Urban Plan. 24 (S1), 160–166. doi:10.3969/j.issn.1673-9493.2009.z1.048
Sun, Y. X., Liu, S. L., Dong, Y. H., An, Y., Shi, F. N., Dong, S. K., et al. (2019). Spatio-temporal evolution scenarios and the coupling analysis of ecosystem services with land use change in China. Sci. Total Environ. 681, 211–225. doi:10.1016/j.scitotenv.2019.05.136
Tao, R., and Thill, J. C. (2020). BiFlowLISA: Measuring spatial association for bivariate flow data. Comput. Environ. Urban Syst. 83, 101519. doi:10.1016/j.compenvurbsys.2020.101519
Tao, Y., Li, F., Crittenden, J. C., Lu, Z. M., and Sun, X. (2016). Environmental impacts of China's urbanization from 2000 to 2010 and management implications. Environ. Manag. 57 (2), 498–507. doi:10.1007/s00267-015-0614-x
Tian, Y. Y., Zhou, D. Y., and Jiang, G. H. (2020). Conflict or coordination? Multiscale assessment of the spatio-temporal coupling relationship between urbanization and ecosystem services: The case of the jingjinji region, China. Ecol. Indic. 117, 106543. doi:10.1016/j.ecolind.2020.106543
Vieira, R. R. S., Pressey, R. L., and Loyola, R. (2019). The residual nature of protected areas in Brazil. Biol. Conserv. 233, 152–161. doi:10.1016/j.biocon.2019.02.010
Viswambharan, K., and Sasidhar, V. K. (1987). A note on the use of rainfall erosion indexes for predicting soil and water losses from the slopy fields of Kerala. Curr. Sci. India 56 (11), 540–542.
Wang, G., Liu, Y., Chen, J., Ren, F. F., Chen, Y. Y., Ye, F. Z., et al. (2018). Magnetic evidence for heavy metal pollution of topsoil in Shanghai, China. Front. Earth Sci. 12 (1), 125–133. doi:10.1007/s11707-017-0624-5
Wang, J., Zhai, T. L., Lin, Y. F., Kong, X. S., and He, T. (2019). Spatial imbalance and changes in supply and demand of ecosystem services in China. Sci. Total Environ. 657, 781–791. doi:10.1016/j.scitotenv.2018.12.080
Wang, Y., and Pan, J. H. (2019). Building ecological security patterns based on ecosystem services value reconstruction in an arid inland basin: A case study in ganzhou district, NW China. J. Clean. Prod. 241, 118337. doi:10.1016/j.jclepro.2019.118337
Wei, H. J., Fan, W. G., Wang, X. C., Lu, N. C., Dong, X. B., Zhao, Y. N., et al. (2017). Integrating supply and social demand in ecosystem services assessment: A review. Ecosyst. Serv. 25, 15–27. doi:10.1016/j.ecoser.2017.03.017
Xiao, R., Lin, M., Fei, X. F., Li, Y. S., Zhang, Z. H., and Meng, Q. X. (2020). Exploring the interactive coercing relationship between urbanization and ecosystem service value in the Shanghai-Hangzhou Bay Metropolitan Region. J. Clean. Prod. 253, 119803. doi:10.1016/j.jclepro.2019.119803
Xie, G. D., Zhang, C. X., Zhang, L. M., Chen, W. H., and Li, S. M. (2015). Improvement of the evaluation method for ecosystem service value based on per unit area. J. Nat. Resour. 30 (8), 1243–1254. doi:10.11849/zrzyxb.2015.08.001
Xu, C., Meng, N., Lu, F., Liu, X. M., and Ouyang, Z. Y. (2020). Research on urban green infrastructure management in Macao from the perspective of ecosystem service demand. Chin. Landsc. Archit. 36 (9), 104–109. doi:10.19775/j.cla.2020.09.0104
Xu, L., Huang, Q. H., Ding, D. D., Mei, M. Y., and Qin, H. T. (2018). Modelling urban expansion guided by land ecological suitability: A case study of changzhou city, China. Habitat Int. 75, 12–24. doi:10.1016/j.habitatint.2018.04.002
Xu, X. B., Yang, G. S., Tan, Y., Tang, X. G., Jiang, H., Sun, X. X., et al. (2017). Impacts of land use changes on net ecosystem production in the Taihu Lake Basin of China from 1985 to 2010. J. Geophys. Res. Biogeosci. 122 (3), 690–707. doi:10.1002/2016jg003444
Xu, X. B., Yang, G. S., Tan, Y., Zhuang, Q. L., Li, H. P., Wan, R. R., et al. (2016). Ecological risk assessment of ecosystem services in the Taihu Lake Basin of China from 1985 to 2020. Sci. Total Environ. 554-555, 7–16. doi:10.1016/j.scitotenv.2016.02.120
Yahdjian, L., Sala, O. E., and Havstad, K. M. (2015). Rangeland ecosystem services: Shifting focus from supply to reconciling supply and demand. Front. Ecol. Environ. 13 (1), 44–51. doi:10.1890/140156
Yin, H. W., Kong, F. H., and Zong, Y. G. (2008). Accessibility and equity assessment on urban green space. Acta Ecol. Sin. 28 (7), 3375–3383.
Yin, J., Yin, Z. E., Zhong, H. D., Xu, S. Y., Hu, X. M., Wang, J., et al. (2011). Monitoring urban expansion and land use/land cover changes of Shanghai metropolitan area during the transitional economy (1979-2009) in China. Environ. Monit. Assess. 177 (1-4), 609–621. doi:10.1007/s10661-010-1660-8
Yu, H. J., Xie, W., Sun, L., and Wang, Y. T. (2021). Identifying the regional disparities of ecosystem services from a supply-demand perspective. Resour. Conservation Recycl. 169, 105557. doi:10.1016/j.resconrec.2021.105557
Yu, P., Feng, M., Liu, B., Bai, S., Gu, S., and Chen, Y. (2020). Demarcation and administration of watershed ecological protection red line considering the ecological security pattern: A case of the qilu lake watershed, yunnan Province. J. Lake Sci. 32 (01), 89–99. doi:10.18307/2020.0109
Zhai, T. L., Wang, J., Jin, Z. F., Qi, Y., Fang, Y., and Liu, J. J. (2020). Did improvements of ecosystem services supply-demand imbalance change environmental spatial injustices? Ecol. Indic. 111, 106068. doi:10.1016/j.ecolind.2020.106068
Zhang, H., Wang, X. R., Ho, H. H., and Yong, Y. (2008). Eco-health evaluation for the Shanghai metropolitan area during the recent industrial transformation (1990-2003). J. Environ. Manag. 88 (4), 1047–1055. doi:10.1016/j.jenvman.2007.05.008
Zhang, K. L., Tang, X. H., Zhao, Y. T., Huang, B. W., Huang, L. J., Liu, M. Y., et al. (2022). Differing perceptions of the youth and the elderly regarding cultural ecosystem services in urban parks: An exploration of the tour experience. Sci. Total Environ. 821, 153388. doi:10.1016/j.scitotenv.2022.153388
Zhao, L. L., and Fan, X. C. (2018). Assessment of the relationship between the economy and the environment based on ecosystem services value in nanping city, China. Appl. Ecol. Env. Res. 16 (6), 8029–8044. doi:10.15666/aeer/1606_80298044
Zhao, S. M., Ma, Y. F., Wang, J. L., and You, X. Y. (2019). Landscape pattern analysis and ecological network planning of Tianjin City. Urban For. Urban Green. 46, 126479. doi:10.1016/j.ufug.2019.126479
Keywords: ecosystem services (ESs), critical areas, comprehensive assessment framework, land zoning, Shanghai metropolitan area
Citation: Ni Y, Wei J, Wu T, Guo M, Han Q and Zhang M (2022) Mapping and assessing ecosystem service supply–demand to identify critical areas: A case study of a waterside area in Shanghai metropolitan area. Front. Earth Sci. 10:943910. doi: 10.3389/feart.2022.943910
Received: 14 May 2022; Accepted: 27 June 2022;
Published: 22 July 2022.
Edited by:
Dongjie Guan, Chongqing Jiaotong University, ChinaReviewed by:
Rongfang Lyu, Lanzhou University, ChinaXibao Xu, Nanjing Institute of Geography and Limnology (CAS), China
Lilei Zhou, Chongqing Jiaotong University, China
Copyright © 2022 Ni, Wei, Wu, Guo, Han and Zhang. This is an open-access article distributed under the terms of the Creative Commons Attribution License (CC BY). The use, distribution or reproduction in other forums is permitted, provided the original author(s) and the copyright owner(s) are credited and that the original publication in this journal is cited, in accordance with accepted academic practice. No use, distribution or reproduction is permitted which does not comply with these terms.
*Correspondence: Jiaxing Wei, d2VpanhAbmphdS5lZHUuY24=