 Yan Zhang1
 Yebin Chen
 Wei Zhu
- 1School of Land Engineering, Chang’an University, Xi’an, China
- 2School of Architecture and Urban Planning, Shenzhen University, Shenzhen, China
- 3School of Resource and Environmental Sciences, Wuhan University, Wuhan, China
The topological structure of the underlying streets can help us better understand urban space and human activities therein. As human urban movements are inherently heterogenous in space and statistics, whether or not the network of streets holds a similar degree of heterogeneity worth being investigated. Relying on the graph theory and complex-network thinking, we adopted the street segment analysis-based methods and computed segment-based topological metrics in the downtown of two major cities in China: Beijing and Shanghai. More specifically, we used Flickr photo location data as a proxy of human urban activities and counted the movement flow at levels of both street-based communities and street segments. We measured the heterogeneity of each segment-based metric via the extent of being long-tailed in the rank-size distribution (long-tailedness). We found that segment-based betweenness was most long-tailed and was the best metric for capturing human activities within each community and that neither segment-based degree nor can closeness show a similar extent of long-tailedness and can have a good correlation with the segment-based flow. These findings point to the insight that the positive relationship between street structure and human activities is significantly shaped by their shared heterogeneous nature.
1 Introduction
The past decade in China witnesses a significant rural-urban transition. With more than sixty percent of the total population living in cities, people are confronting a series of urban issues. In the meantime, the advancement of information and communication technology leads more and more people to conduct activities in a hybrid physical-virtual urban space (Shaw and Yu 2009), from which we can easily acquire a massive amount of fined-grained, widely-covered, spatio-temporal data–so-called urban big data (Mayer-Schonberger and Cukier 2013). Big data makes it possible for us to foster a quantitative understanding of how people live, work, and move in the urban area and, more importantly, to offer us a greater chance to explore the factors behind (Zheng et al., 2014). Among those factors, urban space or built environment is probably the first and foremost because it underlies and works as a primary constraint of our physical activities or movements (such as vehicles must run along the street). In this regard, the understanding of the urban structure and its relation to human activities becoming more urgent and important, as authorities and policymakers are actively seeking solutions for better urban and transport planning to related issues including energy, environment, and sustainability (Batty 2007; Batty 2013).
The urban spatial network has long been used for effectively characterizing the urban structure and its underlying dynamics (Zhong et al., 2014). Street network is one of the most prominent network types. On the one hand, the human movements on the streets in a two-dimensional geographical information system (GIS) can be abstracted as moving points along road center lines, in which we can count the number of points on each line as street-based movement flow. On another, the network of streets naturally allows us to store and model the street topology for investigating the underlying structure of urban space, represented by a dual graph consisting of nodes as streets themselves and links as intersections. Moreover, the correlation between the flow and those structural properties can further lead us to apprehend the relationship between urban form and function (Hillier and Lida 2005). It is commonly accepted that the very topology attained from the street segments has the potential to well correlate with human street movements. In the literature, street topological properties exhibit complex-network characteristics such as scale-free (Barabasi and Albert, 1999; García-Pérez et al., 2018). This indicates that a great heterogeneity of street-street connections that leads to the street network consists of compartments or communities wherein the streets are denser than the ones outside (Newman 2003). However, there were rare studies investigating human activities at the street community level. Supported by Flickr data that are with finer spatial and temporal granularities, it is plausible to adopt street communities as the unit to conduct correlation analysis between human activities and a more refined urban space.
In this article, we study the relationship between the street topological properties and human activities represented by location-based social media (LBSM). As one major kind of urban big data, LBSM data record massive geo-related information from millions of users and works as a good proxy of conventional data for exploring the geographic space and human activities therein. Rooted in complex-network thinking and graph theory, we adopt the street community as a unit for analysis and seek the correlation between different types of topological metrics of street segments within each community and related movement flow counted by Flickr points along the segments. The contribution of this study is three-fold: 1) We apply RA-index to measure the heterogeneity or long-tainedness of the spatial distribution of Flickr photos, not only at the community level but also at the street segment level; 2) At the segment level, only betweenness has a moderate correlation with a number of Flickr locations, others do not have at all. 3) A further investigation of statistical distribution of all these metrics suggests that only betweenness metrics exhibit a similar profile to that of Flickr locations. This explains why betweenness can better capture human activities and this knowledge could help us in some urban applications such as traffic prediction and route planning.
The remainder of this paper proceeds as follows. Section 2 introduces the datasets and methods. Section 3 presents the visualization and statistical results regarding the topological analysis of the street network, the imbalance distribution of photo locations at the community and street levels, and the correlation between the two. Section 4 discusses and concludes the results and points to the future research direction.
2 Methodology
2.1 Data and data processing
The framework of this study is presented in Figure 1. We focused on the centermost area of Beijing and Shanghai bounded by the inner ring road for this study. Respectively (Figure 2). The area includes two highly developed districts such as Dongcheng in Beijing and Pudong in Shanghai, both of which attract massive amounts of human activities. We wrote a simple script to clip out the Flickr data downloaded from the Yahoo database. As Figure 2 shows, there were 73,276 and 92,479 records in downtown Beijing and downtown Shanghai, respectively, including Photo ID, user ID, timestamp, and XY coordinates. We also followed a previous study (Wu et al., 2014) and cleaned the data by removing photo duplicates (same user sent at same time and location) and those photos sent by robots. The cleaned data contained 19,970 photo locations for Beijing and 24,589 for Shanghai. The street network was downloaded directly from OpenStreetMap. We further used the Near function to assign each location to the nearest street segment and eventually counted how many photo locations were assigned to a single segment as the segment-based flow.
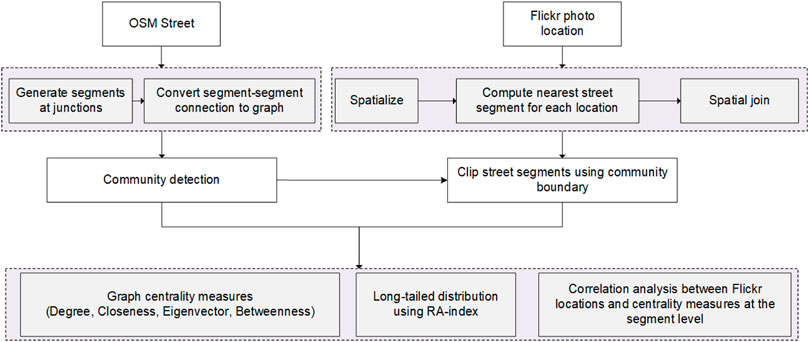
FIGURE 1. The methodological framework of this study.
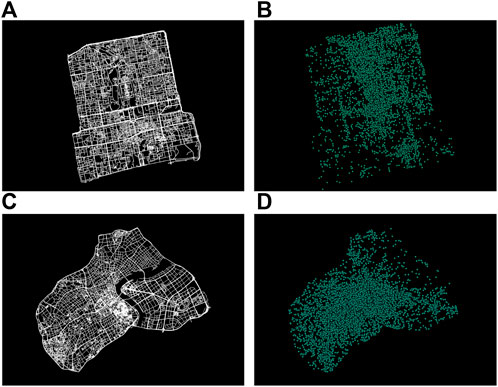
FIGURE 2. (Color online) The spatial distribution of processed geo-tagged photos in the study areas and the underlying street networks in the centermost region of Beijing (A,B) and Shanghai (C,D).
2.2 Topological properties for characterizing a street network structure
We built the dual graph
Degree centrality, as denoted in Eq. 1, the degree of a node is based on how many links connect to that node.
Closeness centrality, refers to the topological distance of a node to every other node in a network, which is denoted by Eq. 2, which
Eigenvector centrality, makes use of the centrality of a node’s neighbor to determine the centrality for that node. The eigenvector centrality for a node
Betweenness centrality measures how big a role a node
Like many other real-world networks, a street network consists of many independent compartments, forming a community structure. This way we can naturally divide a large street network group by group for a better understanding of the structure of the streets. To assess the goodness of a community structure, modularity is often used, denoted by Eq. 5:
in which
2.3 RA-index for measuring the long-tailedness of topological metrics
Commonly, human urban activities are substantially heterogeneous (e.g., Brockmann et al., 2006; Gonzalez et al., 2008), manifested mathematically as a right skew in the probability distribution or a long tail in rank-size distribution. The skewness or long-tailedness in the distribution can also be understood as data imbalance or unevenness since data with this such kind of distribution contain only a few large values but numerous small values, that is, large-to-small ratios are disproportional (e.g., 80/20 rather than 50/50). In recent years, the ratio (RA-index; Gao et al., 2016) is widely used to quantify the extent of a data being long-tailed distribution (Ma et al., 2020). To calculate RA-index, we first rank all values in the data set from the largest to the smallest (a rank-size plot). The RA-index value, as Eq. 6 denotes, equals the ratio between the areas of two polygons A and B divided by the line connected with the largest and smallest values (Figure 3). The value range of the RA-index is between 0 and 1. The smaller the RA-index value, the more long-tailed or right-skewed the data is. This study would compute the RA-index on every type of segment-based measure, as well as the segment-based movement flow.
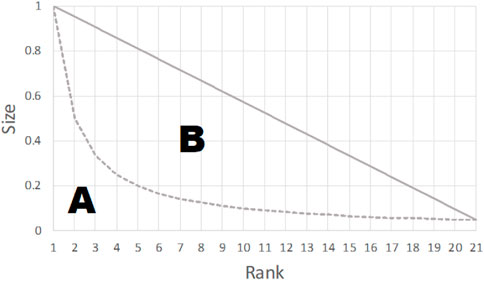
FIGURE 3. The illustration of the RA-index using a rank-size plot.
Where SA and SB represent respectively the area of two parts of the triangle divided by the rank-size distribution line.
3 Results
3.1 Detected communities and related statistics
We firstly partitioned the network graph into several communities. As Table 1 presents, the statistical results of the two downtown areas were similar. As the case with Shanghai, the derived 58 communities with the highest modularity score of 0.937. The size (number of street segments) of each community ranges from 34 to 797 (Table 1). As can be seen from Figure 4A,C, at the center of the study area, numerous small-sized communities were concentrated, whereas bigger ones were surrounded layer by layer. On the other hand, the number of geotagged Flickr photos within each street community gave another story. Figure 4B,D showed that smaller communities at the center tended to possess a considerably large amount of photo locations (2274 at most in one community; Table 1), indicative of the area of interest in the downtown area, while much fewer photo locations resided in larger communities at the periphery. From a statistical point of view, the number of segments contained in each community follows a normal-like distribution, that is, the big-to-small ratio regarding the number of street segments for each community was proportional, that is, around the average value. The statistical distribution for photo locations within each street community was, therefore, quite disproportional (right-skewed) and was with an RA-index of 0.04, suggesting a highly imbalanced distribution, both in space and statistics, of human activities in social media (Figures 4, 5).
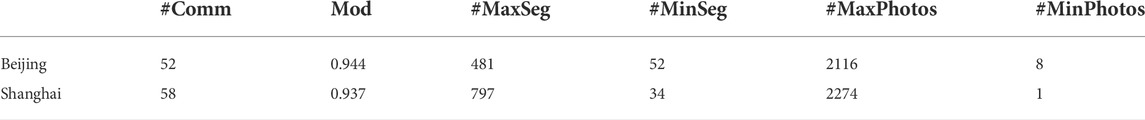
TABLE 1. The statistics of derived street communities in downtowns Beijing and Shanghai. (Note: #, number; Comm, Communities; Mod, Modularity score; MaxSeg, the maximum number of segments within a community; MaxPhotos, maximum unique photo locations within a community).
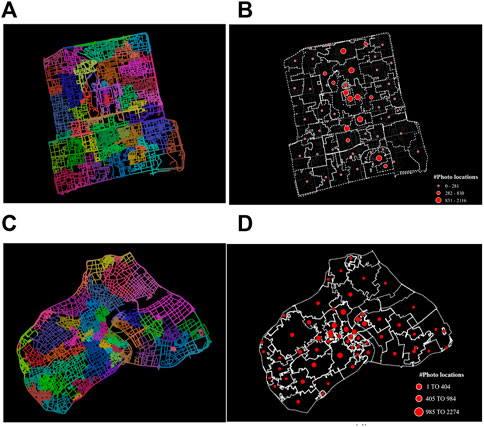
FIGURE 4. (Color online): The layout of detected street communities in the downtown area of Beijing and Shanghai (A,C), each of which is with a number of Flickr points that are mapped using dot size (B,C).
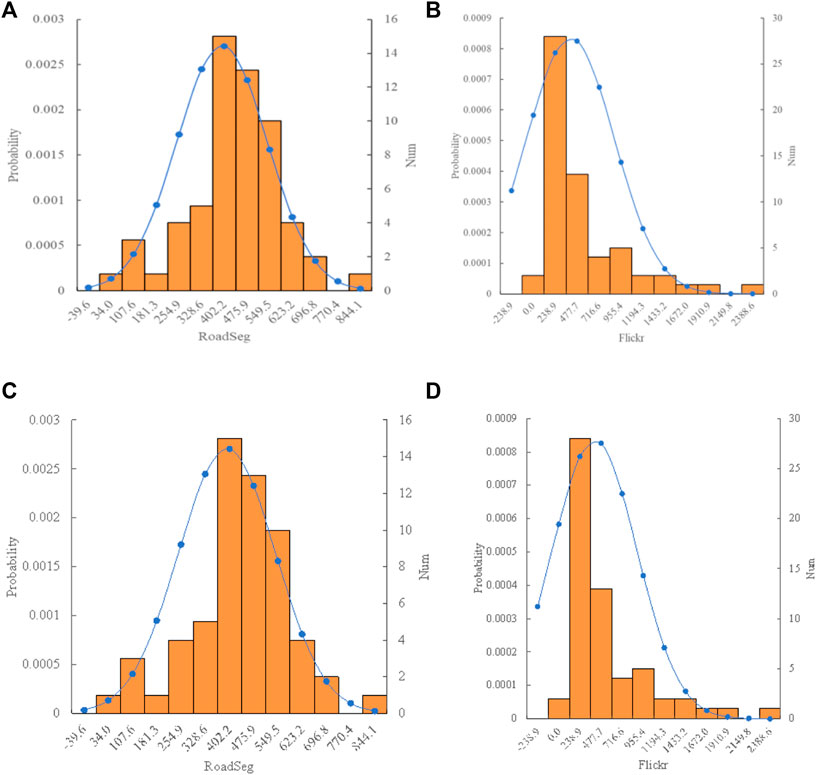
FIGURE 5. (Color online): The probability statistical distribution of #street segments and #Flickr locations within each community [Note: # = number, #road segments for each community obey a normal distribution (A,C), while # Flickr photos exhibit in a right-skewed or long-tailed manner (B,D)].
3.2 Correlation within each community
We computed four types of centrality measures for each street segment, that is, betweenness, closeness, degree, and eigenvector. Within each derived street community, we further extracted the contained street segments and then examined the extent of imbalance distribution across four topological parameters as well as the number of photo locations (Table 2). It is very interesting to note that the distribution of photo locations at the street segment level was very uneven too, for most of the RA-index values were less than 0.1, similar to what has been distributed over different street communities. On the other hand, the centrality measures behaved quite differently. Figure 6 provides an overview of the RA-index for each metric at the community level, from which we can see a remarkable consistency between several photo locations and betweenness, while the other three centrality measures appeared several times bigger (above 0.7).
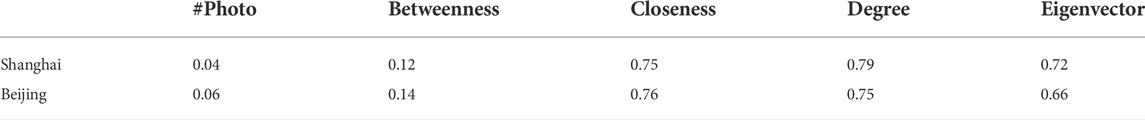
TABLE 2. The average community-based RA-index values for several photo locations and each of the centrality measures.
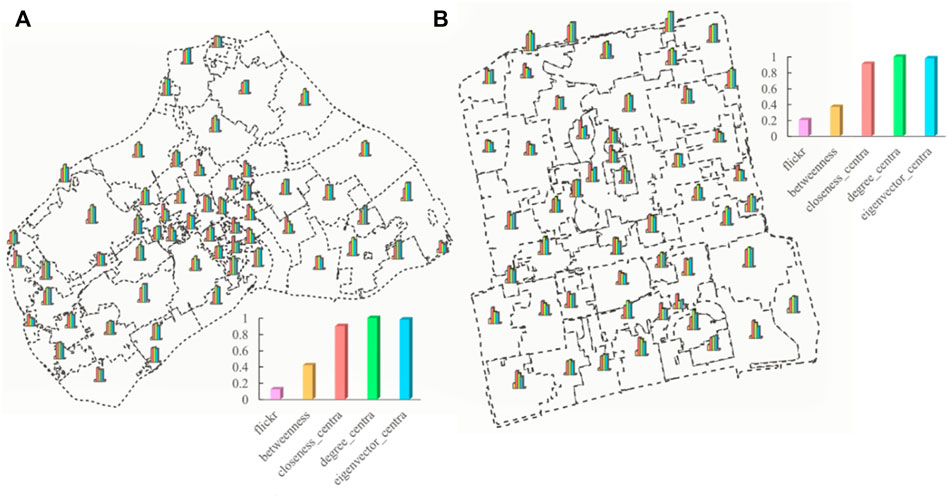
FIGURE 6. (Color online): The bar chart view of RA-index values on five metrics at the community level (Note: Data with an RA-index closer to 0 is prone to be highly right-skewed. Thus, across four types of centrality measures, the extent of imbalance distribution of betweenness is the closest to that of #photo locations, followed, in order, by degree, closeness, and eigenvector).
We correlated each segment-based topological metric with the corresponding amount of photo location. The range of correlation for all metrics was in general (−0.21, 0.39) in Shanghai (Figure 6a) and (−0.18, 0.48) in Beijing (Figure 6b). Taking examples of the top 10 popular communities for both cities shown in Figure 7, the correlation results vary from community to community and demonstrate, by and large, a consistent pattern with the RA-index values, that is, metrics with a smaller RA-index was inclined to have a larger correlation result (e.g., betweenness). In contrast, a lack of correlation or negative correlation can be found in some communities where metrics with a large RA-index value (e.g., degree and closeness). In this regard, betweenness outperforms other structural properties regarding the capture of human activities at the community level (e.g., the strongest correlations in 5 communities out of the top 10 communities in Shanghai; Figure 7A), as it conforms to the imbalanced spatial distribution of photo locations. Furthermore, to confirm the above result about the presence or absence of correlations, we mapped street segments within one of the most popular communities (Figures 7A, B). For example, we selected one community in Shanghai with 1,545 geo-tagged photos over 580 street segments, the visualization uses a color scheme from blue (lowest) to red (highest) showing high/low correspondence between different measures and human activities.
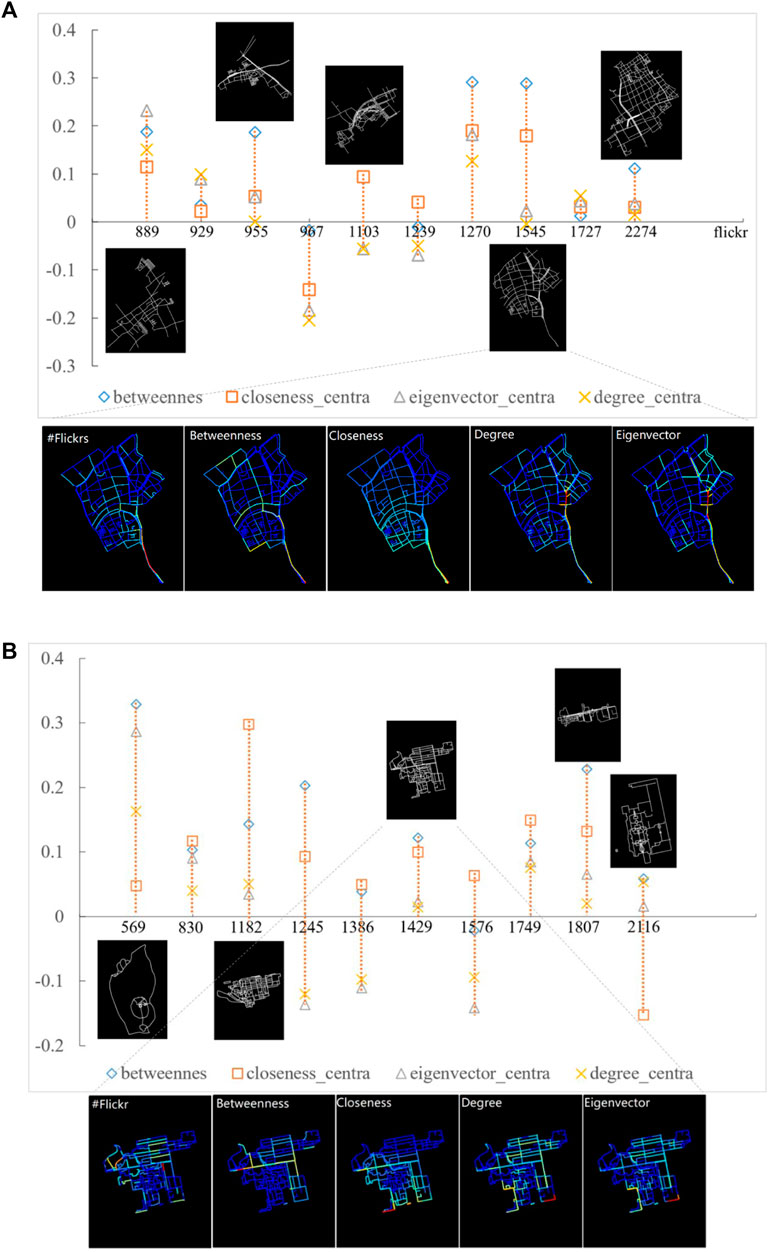
FIGURE 7. (Color online) The segment-based metric-flow correlation results between four types of topological parameters, respectively, and several photo locations in the top 10 popular communities and the street network in one of the selected 10 communities, rendered using different types of segment-based measures, respectively in Shanghai (A) and Beijing (B). (Note: The betweenness value shows the strongest uniformity with the number of photos, either spatially or statistically, and thus has a better correlation than other metrics).
4 Discussion
The street network is a de facto complex network, in which the connections among streets are distributed rather unevenly (Newman 2003). In other words, the connections in some parts of the network are dense while in other parts are quite sparse. This leads us to decompose such a network into communities within which the streets interact more intensively than the ones outside. It should be noted that the detected communities work effectively as alternative space partitioning units that are emerged from the bottom-up rather than traditional ones from the top-down such as equal-sized grids that neglect the essentials of the underlying spatial environment. This is very much in line with the Flickr data used in this study which is also collected in a bottom-up manner and with an unbalanced spatial distribution. Although Flickr is not as popular as Weibo and Wechat in China, we chose the centermost part of the two largest Chinese metropolises where the places are relative with very dense photo locations to ensure the Flickr data can reflect greatly the activity level. In doing so, we managed to conduct an in-depth investigation of the interplay between urban spatial structure and human activities.
From a statistical viewpoint, the unevenness can be characterized as a right-skewed or long-tailed distribution. In the study, it is interesting to stress that such an uneven spatial distribution of Flickr photo locations at two levels: across communities and within a single community, represented by the RA-index value being smaller than or equal to 0.1. From one community to another, the different amount of photo locations can reflect the varying popularity degrees of a place. Such a variation also appears from the street to street within a community. The result showed that the minimum RA-index value for the number of photo locations distributed across streets is 0.02, indicating an extremely imbalanced pattern of far more rarely-visited streets than frequently-visited ones. What is more, some of the calculated segment-based structural parameters exhibited a similar statistical pattern such as betweenness whose RA-index largely resonates one of photo locations in most cases (also shown in Figure 6B).
The correlation test further revealed that betweenness was the best segment-based topological metric for capturing human activities at the community level. Other metrics like degree or closeness were with larger RA-index values and thus were hard to have a moderate metric-flow correlation. The primary reason could be that the betweenness is a more global measure (Freeman 1979) and its calculation takes account of not only the immediate intersected streets (neighbors) of a street, but also neighbors’ neighbors, and so on. On the contrary, the degree of closeness centrality considers only the local neighbors of a street. As a street segment usually intersects immediately with only 3 or 4 segments, the segment-based degrees within a community would not differ too much from one another, thereby leading to a larger RA-index value or a more proportional distribution (e.g., 50/50 rather than 20/80).
The similar community-based statistics in the two cities above help us better understand the interplay between the complex or heterogenous street structure and human check-in activities. As confirmed in many urban literatures, although one has his/her own choice or behavior while moving, the collective movements are greatly influenced by the underlying spatial environment such as the network of streets (e.g., Hillier 2012) and can, to a certain extent, captured by the structural properties (network metrics). Moreover, based on the detected long-tailed distribution on both the betweenness metric and the number of photo locations along streets within each community, we further identify that the heterogeneity of urban space may work as an effective means of characterizing group-level human activities.
5 Conclusion
The relationship between the urban environment and human activities therein is one of the cores in urban science. The present study makes use of the street network in the downtown two metropolitan areas Beijing and Shanghai and decodes the urban morphology from the perspective of the street communities, from which we can further understand a city’s configurational and functional complexity regarding the imbalanced distribution of street topological parameters and human check-in activities. Despite previous studies had pointed out a positive correlation between street topological properties and people movement flow, our experiment further contributes to the literature that one of the reasons behind the positive correlation is the shared heterogeneous or imbalanced nature held by both street structure and human activities. Future work will involve more metropolises worldwide for an international outlook and develop agent-based simulation using street networks as the computation environment for deeper insights into urban structure and its complex dynamics.
Data availability statement
Publicly available datasets were analyzed in this study. This data can be found here: https://www.openstreetmap.org/.
Author contributions
Conceptualization, YZ, and WZ; data curation, YZ.and QZ; formal analysis, YZ, and YC; funding acquisition, YZ; methodology, WZ, and YC; supervision, YC, and WZ; visualization, WW and QZ; writing—original draft, YZ, and WZ; writing—review and editing, YC. All authors have read and agreed to the published version of the manuscript.
Funding
This research was funded by the Technology Innovation Leading Program of Shaanxi (Grant No. 2022ZDLSF07-05), and the Open Fund of the Key Laboratory of Urban Land Resources Monitoring and Simulation, MNR (Grant No. KF-2018-03-016).
Conflict of interest
The authors declare that the research was conducted in the absence of any commercial or financial relationships that could be construed as a potential conflict of interest.
Publisher’s note
All claims expressed in this article are solely those of the authors and do not necessarily represent those of their affiliated organizations, or those of the publisher, the editors, and the reviewers. Any product that may be evaluated in this article, or claim that may be made by its manufacturer, is not guaranteed or endorsed by the publisher.
References
Barabási, A. L., and Albert, R. (1999). Emergence of scaling in random networks. Science 286 (5439), 509–512. doi:10.1126/science.286.5439.509
Batty, M. (2007). Cities and Complexity: Understanding cities with cellular automata, agent-based models, and fractals. Cambridge, Massachusetts: MIT Press.
Blondel, V. D., Jean-Loup, G., Renaud, L., and Etienne, L. (2008). Fast unfolding of communities in large networks. J. Stat. Mech. 10, P10008. doi:10.1088/1742-5468/2008/10/p10008
Brockmann, D., Hufnage, L., and Geisel, T. (2006). The scaling laws of human travel. Nature 439, 462–465. doi:10.1038/nature04292
Freeman, L. C. (1979). Centrality in social networks: conceptual clarification. Soc. Netw. 1, 215–239. doi:10.1016/0378-8733(78)90021-7
Gao, P. C., Liu, Z., Tian, K., and Liu, G. (2016). Characterizing traffic conditions from the perspective of spatial-temporal heterogeneity. ISPRS Int. J. Geoinf. 5 (3), 34. doi:10.3390/ijgi5030034
García-Pérez, G., Boguñá, M., and Serrano, M. Á. (2018). Multiscale unfolding of real networks by geometric renormalization. Nat. Phys. 14 (6), 583–589. doi:10.1038/s41567-018-0072-5
Gonzalez, M., Hidalgo, C. A., and Barabási, A. L. (2008). Understanding individual human mobility patterns. Nature 453, 779–782. doi:10.1038/nature06958
Hillier, B. (2012). Studying cities to learn about minds: some possible implications of space syntax for spatial cognition. Environ. Plann. B. Plann. Des. 39 (1), 12–32. doi:10.1068/b34047t
Hillier, B., and Lida, S. (2005). “Network and psychological effects,” in International Conference on Spatial Information Theory. (Berlin, Heidelberg: Springer), 475–490
Ma, D., Guo, R., Zheng, Y., Zhao, Z., He, F., and Zhu, W. (2020). Understanding Chinese urban form: The universal fractal pattern of street networks over 298 cities. ISPRS Int. J. Geoinf. 9 (4), 192. doi:10.3390/ijgi9040192
Mayer-Schonberger, V., and Cukier, K. (2013). Big data: A revolution that will transform how we live, work, and think. New York: Eamon Dolan/Houghton Mifflin Harcourt.
Newman, M. E. J. (2003). The structure and function of complex networks. SIAM Rev. Soc. Ind. Appl. Math. 45 (2), 167–256. doi:10.1137/s003614450342480
Shaw, S. L., and Yu, H. (2009). A GIS-based time-geographic approach of studying individual activities and interactions in a hybrid physical–virtual space. J. Transp. Geogr. 17 (2), 141–149. doi:10.1016/j.jtrangeo.2008.11.012
Wu, L., Zhi, Y., Sui, Z., and Liu, Y. (2014). Intra-urban human mobility and activity transition: Evidence from social media check-in data. PloS one 9 (5), e97010. doi:10.1371/journal.pone.0097010
Zheng, Y., Capra, L., Wolfson, O., and Yang, H. (2014). Urban computing: Concepts, methodologies, and applications. ACM Trans. Intell. Syst. Technol. 5 (31–38), 155. doi:10.1145/2629592
Keywords: topological analysis, segment analysis, long-tailed distribution, heterogeneity, urban roads
Citation: Zhang Y, Chen Y, Zhu W, Wang W and Zhang Q (2022) The topological structure of urban roads and its relation with human activities at the street-based community level. Front. Earth Sci. 10:966907. doi: 10.3389/feart.2022.966907
Received: 11 June 2022; Accepted: 08 August 2022;
Published: 06 September 2022.
Edited by:
Jiaxing Cui, Central China Normal University, ChinaReviewed by:
Qingsong He, Huazhong University of Science and Technology, ChinaXiaomin Lu, Lanzhou Jiaotong University, China
Enxiang Cai, Henan Agricultural University, China
Copyright © 2022 Zhang, Chen, Zhu, Wang and Zhang. This is an open-access article distributed under the terms of the Creative Commons Attribution License (CC BY). The use, distribution or reproduction in other forums is permitted, provided the original author(s) and the copyright owner(s) are credited and that the original publication in this journal is cited, in accordance with accepted academic practice. No use, distribution or reproduction is permitted which does not comply with these terms.
*Correspondence: Wei Zhu, emh1d2dpc2VyQHdodS5lZHUuY24=