 Ortensia Amoroso1*
 Ferdinando Napolitano1
 Gylfi Pall Hersir2,3Thorbjorg Agustsdottir2
 Vincenzo Convertito4Raffaella De Matteis5Sveinborg Hlíf Gunnarsdóttir2
 Vala Hjörleifsdóttir6
 Paolo Capuano1
- 1Dipartimento di Fisica “E.R.Caianiello”, Università Degli Studi Di Salerno, Fisciano, SA, Italy
- 2Iceland GeoSurvey (ÍSOR), Reykjavík, Iceland
- 3Independent Researcher, Reykjavík, Iceland
- 4Istituto Nazionale di Geofisica e Vulcanologia, Osservatorio Vesuviano, Napoli, Italy
- 5Dipartimento di Scienze e Tecnologie, Università Degli Studi Del Sannio, Benevento, Italy
- 6Reykjavík Energy, Reykjavík, Iceland
We present a detailed seismic imaging of the harnessed Nesjavellir geothermal area, SW-Iceland, which is one of several geothermal fields on the flanks of the Hengill volcano. We map the
1 Introduction
The Hengill volcano, with its surrounding geothermal fields, is the most productive harnessed high temperature geothermal region in Iceland. The Nesjavellir power plant (Figure 1), to the north of the Hengill volcano (120 MWe and 350 MWt), was commissioned in 1990 and the Hellisheiði power plant, to the southwest of the volcano (303 MWe and 210 MWt), was commissioned in 2006. The area is located in the southwest region of Iceland, about 30 km east of the capital Reykjavík at a triple junction formed by the Reykjanes Peninsula (RP), the Western Volcanic Zone (WVZ) and the South Iceland Seismic Zone (SISZ) (Stefánsson et al., 1993; Einarsson, 2008).
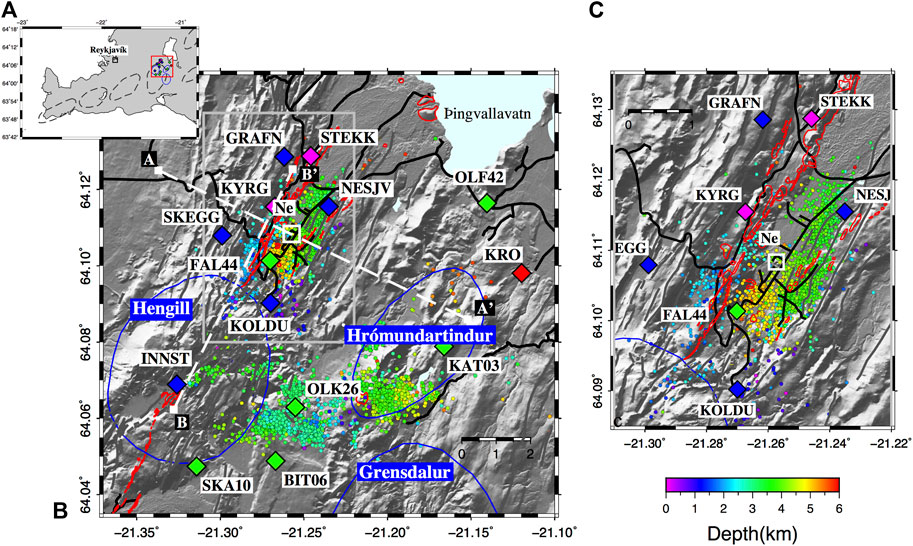
FIGURE 1. The Hengill study area: seismic stations and earthquake locations. (A) shows the location of the study area (red box) and the volcanic centers in SW-Iceland. (B) Seismic events extracted from ÍSOR’s catalog (2016–2020) and relocated using the 3D velocity model based on this study. Blue, green, magenta, and red diamonds represent the seismic stations of the ÍSOR/ON network, the COSEISMIQ and S4CE project, and the SIL seismic network deployed in the study area, respectively. AA′ and BB′ profiles, shown as white dotted lines, are discussed in the results paragraph. Relocated earthquakes (2016–2020) are color coded by depth. Solid blue lines are the three volcanic centers of the region with their respective names in white on a blue background. The white square marked as “Ne” is the Nesjavellir power plant. Black lines are the roads. Red lines represent the eruptive fissure and craters, while the fractures are shown using gray lines (Sæmundsson et al., 2016). (C) is a zoomed-in of the part inside the gray box of the figure to the left.
The geology of the Hengill area is dominated by a succession of alternating layers made of hyaloclastite and basalt deposits formed during sub-glacial and subaerial volcanic eruptions, respectively (Sæmundsson, 1967; Árnason et al., 1986; Sæmundsson, 1992). Below 1.5 km depth, the subsurface is dominated by basaltic intrusions, dykes, and sills (Gunnarsdóttir et al., 2020 and references therein). Hyaloclastites have formed ridge-shaped mountains and tuyas, including the Hengill volcano itself (Sæmundsson et al., 2016). The focus of this study is the Nesjavellir geothermal sub-field (Figure 1). It lies within the N30°E trending Hengill fissure swarm, which is in total about 40 km long, parallel to the hyaloclastite ridges, faults and fissures of the Hengill fissure swarm (Sæmundsson, 1992; Sæmundsson et al., 2016).
The geothermal activity of the Hengill area is closely connected to the three volcanic systems in the region: Grensdalur (extinct), Hrómundartindur (last eruption 11,000 years ago) and Hengill (last eruption 2,000 years ago) (see, Árnason et al., 1987; Sæmundsson, 1992 and reference therein). The conceptual model of the Hengill geothermal system was assumed to consist of a single central up-flow underneath the Hengill volcano (e.g., Björnsson et al., 2003). However, more recent studies indicate a more complex picture with multiple local heat sources with cooler regions in between (Gunnarsson et al., 2011; Gunnarsson & Aradóttir, 2015). The geothermal fluids migrate through the porous basaltic crust, fractures and fissures in the area where the two most productive power plants in Iceland are located: the southern Hellisheiði and the northern Nesjavellir power plants, both operated by ON Power (https://www.on.is/), a subsidiary of OR-Reykjavík Energy. The reservoir temperature for the Hengill area ranges from 200°C to 340°C (Gunnarsson & Aradóttir, 2015). The energy is used to provide space heating and for other direct uses in Reykjavík and neighboring communities, as well as for electricity generation. In the Nesjavellir sub-field a total of 30 production wells have been drilled. Part of the surplus geothermal water from the plant goes into injection wells.
The seismic activity in the Hengill area has been monitored since the middle of 1970s (e.g., Foulger, 1988a, b). Earthquake detection was much improved in 1990 through the installation of the denser South Iceland Lowland seismic network (SIL) of the Icelandic Meteorological Office (IMO) (Stefánsson et al., 1993; Jakobsdóttir, 2008). The permanent seismic network in the Hengill area now consists of 10 stations operated by the Iceland GeoSurvey (ÍSOR) for ON Power, and 5 stations operated by the IMO. The seismicity is characterized by persistent tectonic background activity (Bodvarsson et al., 1996; Rögnvaldsson et al., 1996; Brandsdóttir et al., 2010; Li et al., 2019), and earthquake swarm activity in connection with magma intrusion and geothermal fluid migration in hot rocks (Sigmundsson et al., 1997; Jakobsdóttir, 2008).
Drilling and fluid injection operations can induce seismicity and thus increase the already high rate of seismicity, particularly in the production and injection areas of the Hellisheiði and Nesjavellir power plants (e.g., Flóvenz et al., 2015; Ágústsson et al., 2015; Kristjánsdóttir et al., 2019; Hjörleifsdóttir et al., 2021a, b). Close to the Hellisheiði geothermal plant (64°02′14″N 21°24′03″W), seismicity occurred already during drilling of the injection-wells in the Húsmúli formation, when the wells intersected permeable formations or the bottom of the feed zones with maximum magnitude of ML 2.5 (Ágústsson et al., 2015). When injection began in Húsmúli in September 2011 the rate of seismicity greatly increased, including swarms and two large events, ML 4.0 and 3.8, in the middle of October 2011 (Bessason et al., 2012). The reinjection also caused a local uplift of 2 cm during the first year (Juncu et al., 2017). In the southernmost Hengill sub-field, Hverahlíð, seismicity increased significantly in 2016 when drilling and production started, and has persisted to date (Kristjánsdóttir et al., 2019; Hjörleifsdóttir et al., 2021b).
Detailed analysis of the elastic properties of the crustal media in relation to the local seismicity are important to better understand the crustal structure as well as the current status and permeability of geothermal systems and volcanoes. Variations of P-wave velocity (
Several 1D and 3D velocity models have been made on a regional scale for the greater Hengill area, starting with Foulger (1984) and Foulger and Toomey (1989). Tryggvason et al. (2002) used about 7,500 local earthquakes recorded at 20 seismic stations of the SIL network in a 224 km2 × 112 km2 wide area, including the South Iceland Seismic Zone, the Hengill volcanic system and the Reykjanes Peninsula, to model the 3D velocity structure down to 10–15 km depth. More recently, Jousset et al. (2011) performed a joint tomographic inversion for the estimation of 3D P- and S-wave velocity structure and local earthquakes in the whole Hengill geothermal area including its subareas. They used 250 local earthquakes recorded from June to October 2006 by 8 seismic stations. Wagner (2019) did local-earthquake tomography of Hengill. His
The results presented here aim to provide a more accurate and detailed 3D velocity structure of the Nesjavellir geothermal sub-field using high-resolution seismic tomography and relocation of the local earthquakes recorded from 18 October 2016 to 10 June 2020. The results are then compared with a resistivity model and rock temperature data from boreholes, taking the local geology into account. This study is an important contribution to a better understanding of the crustal structure in and around the Nesjavellir geothermal area, as well as addressing the possible mechanisms generating the observed seismicity.
2 Data
Seismicity in the Hengill area has been monitored by several independent permanent and temporary seismic networks. For almost 3 decades, the activity was monitored by the regional seismic network (the SIL network) operated by the Icelandic Meteorological Office (IMO) (Figure 1, red diamonds). In 2016, Iceland GeoSurvey (ÍSOR) installed a seismic network consisting of 10 stations (Figure 1, blue diamonds), for ON Power (ON) in the Hengill area, which drastically improved the earthquake detection threshold of the pre-existing SIL network. In 2018–2021, the Geothermica EU funded COSEISMIQ project (COntrol SEISmicity and Manage Induced earthQuakes), operated a dense network of 23 stations in the area (Figure 1, green diamonds). In 2019–2020, two additional stations were set up in Nesjavellir by the European Union’s Horizon 2020 funded Science4CleanEnergy (S4CE) project (Figure 1, magenta diamonds). This adds up to a total of 38, three component seismic stations monitoring the Hengill area in 2019–2020. For the purpose of this study, we used 14 permanent and temporary stations in the vicinity of Nesjavellir, comprising 5 ON/ÍSOR stations (Lennartz LE-3DliteMkII 1 s), 2 S4CE stations (Lennartz LE-3DliteMkII 1 s), 1 IMO station (Lennartz 5 s) and 6 COSEISMIQ stations (3 STS2s 120 s and 3 Guralp 6D 30 s) (Figure 1).
The available dataset consists of 6,906 earthquakes extracted from ÍSOR’s catalog, of local magnitude −0.8 ≤ ML ≤ 3.8, recorded between 18 October 2016 and 10 June 2020, in a 120 km2 area around the Nesjavellir geothermal field (Figure 1). ÍSOR’s manually refined catalog consists of 31,320 P- and 25,624 S-waves travel times recorded at the 14 permanent and temporary seismic stations used in our study. Travel time errors associated with the P- and S-wave manual picks are 0.01 and 0.02 s, respectively. In order to evaluate the P- and S-wave travel time consistency, we applied the Wadati diagram analysis (Wadati and Oki, 1933). Specifically, we plotted the difference TS-TP between S-waves (TS) and P-waves (TP) travel times, as a function of TP -T0 (T0 is the origin time) for each event recorded at the available stations (Figure 2). The resulting Wadati diagram shows a linear trend, revealing the good consistency of the data. From the best fitting line, we estimated a local
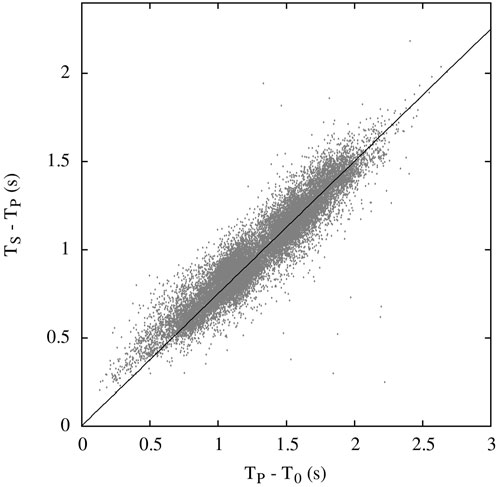
FIGURE 2. Wadati diagram. The difference TS-TP between S-waves (TS) and P-waves (TP) travel times, as a function of TP -T0 (T0 is the origin time) for the 6,906 events recorded at the 14 available stations. The best fit line corresponds to
3 Method and inversion strategy
In order to seismically image the study area we performed a 3D local earthquake tomography. We first selected the best constrained catalog events (Section 3.1), based on the quality of the preliminary location, to calculate a minimum 1D velocity model. Using the new velocity model and the estimated
3.1 1D velocity model and earthquake relocation
Reliable initial hypocenter locations and a reference seismic velocity model are crucial to successfully perform local earthquake tomography (Kissling, 1988; Kissling et al., 1994). For this reason, a reliable minimum 1D P-wave velocity model for the study area has been obtained solving the coupled hypocenter-velocity problem by implementing the VELEST software (Kissling et al., 1995). For this purpose, we used only the P-wave arrival times of the best constrained 473 earthquakes, selected from the starting dataset by requiring a minimum number of 5 P-phases (and at least 2 S-phases), and an azimuthal gap smaller than 180°. Several different velocity models have previously been proposed for Southwest Iceland using older datasets (Figure 3A): 1) the SIL model (Bjarnason et al., 1993; Stefánsson et al., 1993) is routinely used for earthquake locations in Iceland; 2) the velocity model by Tryggvason et al. (2002), obtained by using data recorded in Southwest Iceland, comprising the Reykjanes Peninsula, the Hengill area and the SISZ; 3) the Jousset et al. (2011) model, which includes seismicity of the Hengill area (including the Nesjavellir and Hellisheiði subareas). These models, together with our gradient velocity model were all tested in the present study as starting velocity models in VELEST (Figure 3A) and used to produce four final models (solid coloured lines in Figure 3B). Additionally, the average of these four models (dashed black line in Figure 3B) is used as a starting model for an additional inversion step whose solution finally represents the best minimum 1D P-wave velocity model (indicates as “Final Model” in Figure 3C).
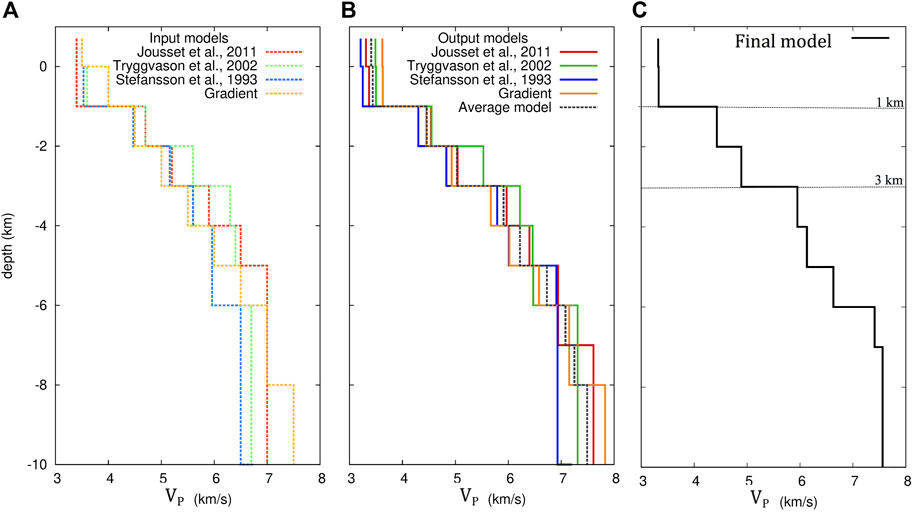
FIGURE 3. 1D-velocity model analysis. (A) Velocity models available in literature for the Hengill area (Stefánsson et al., 1993; Tryggvason et al., 2002; Jousset et al., 2011) used as starting models in VELEST. A fourth synthetic gradient model has been used to test the stability of the results. (B) The 1D velocity models (whole lines) obtained using 473 events from the study area. A final 1D velocity model has been obtained (dashed black line) averaging the velocity in each layer up to a depth of 10 km. This model has been used as input in VELEST. (C) Minimum P-wave 1D velocity model specific for the study area, the Nesjavellir geothermal area and surroundings.
We used a non-linear global search location method, implemented in the NonLinLoc software (Lomax et al., 2000), to perform the relocation of the collected 6,906 events using the best minimum 1D P-wave velocity model (Figure 3C) and the
3.2 3D P and S tomography
We used an iterative linearized delay-time inversion to estimate both the 3D P- and S-wave velocity models and earthquake locations (Latorre et al., 2004). The tomographic code has been used for several applications in tectonic (Amoroso et al., 2014, 2017; Napolitano et al., 2021), volcanic (Serlenga et al., 2016; De Landro et al., 2017), and geothermal areas (Amoroso et al., 2018), as well as in feasibility study in off-shore exploration areas (De Landro et al., 2020). First arrival times are computed through a finite-difference solution of the eikonal equation (Podvin and Lecomte, 1991) on a fine grid of 100 m3 × 100 m3 × 100 m3. Travel times are recalculated by numerical integration of the slowness along the rays. The parameters, that is,
We have estimated the P- and the S-phase pick errors to be equal to 0.01 and 0.02 s, respectively. The reliability of the results has also been tested with respect to the quality of the initial dataset. The test consisted of performing a set of tomographic inversions considering different perturbed datasets. The results indicate that the main features identified in the tomographic images do not change when considering perturbed dataset using standard deviation less or equal to 0.05 s for P travel-time and 0.1 s for S, respectively (Supplementary Figure S4).
4 Results
The minimum 1D P-wave velocity model for the Nesjavellir geothermal area and surroundings (Figure 3C) shows two large velocity steps at 1 and 3 km depth of more than 1 km/s each, but an overall almost linear increase from 3.32 km/s at surface to 7.80 km/s at 10 km depth (Table 1).
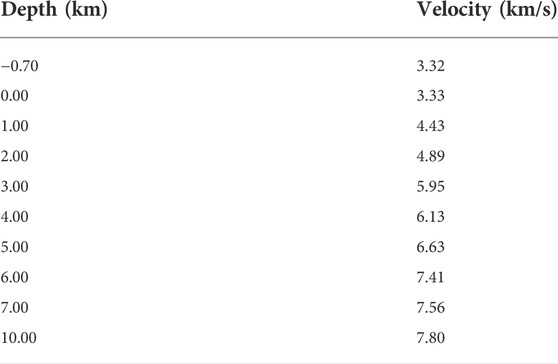
TABLE 1. Minimum 1D P-wave velocity model obtained by VELEST (see Section 3.1).
The final 3D velocity model is represented through horizontal slices at several depths (b.s.l.) in Figures 4–6 and in cross-sections in Figure 7. Note that, while the
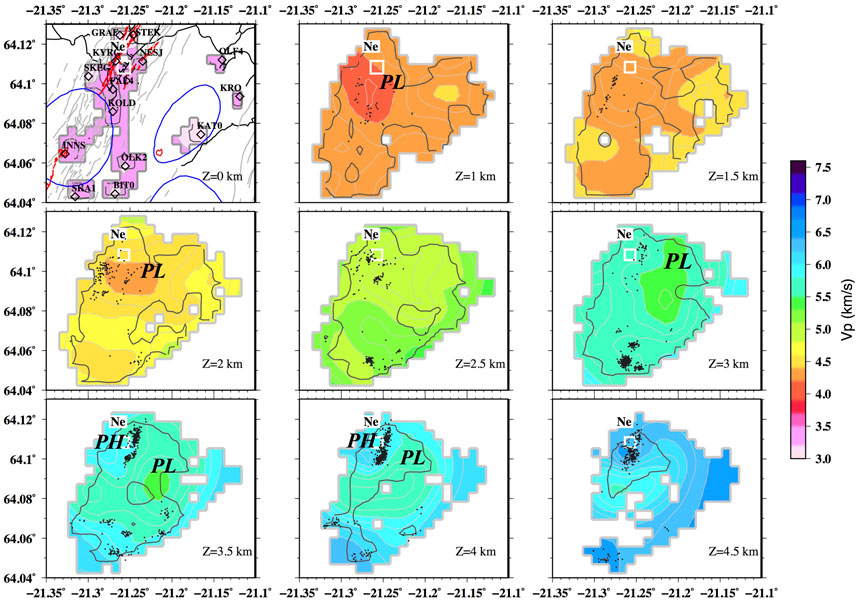
FIGURE 4. 3D tomographic model:
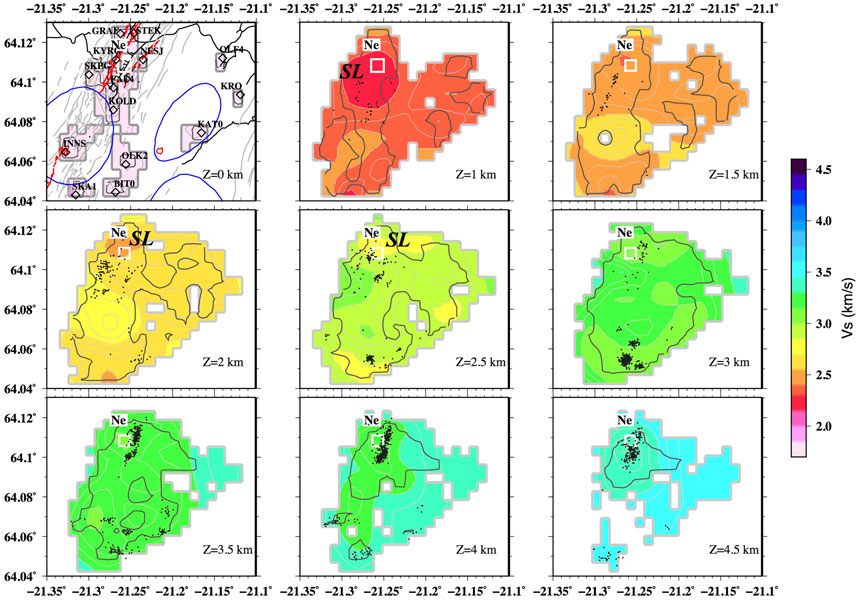
FIGURE 5. 3D tomographic model:
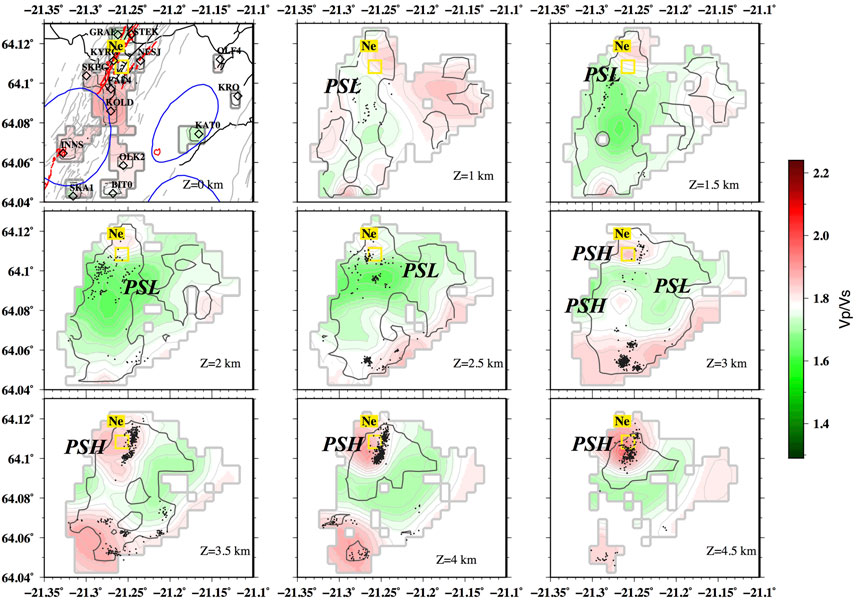
FIGURE 6. 3D tomographic model:
For depths greater than 3 km, the presence of a high P-wave velocity anomaly (PH) is detected in the northwest sector in addition to PL (Figure 4). In the same depth range

FIGURE 7. Tomographic cross-sections across (A) A′ and along (B) B′ the Nesjavellir valley. Profile locations are given on Figure 1. Black dots represent earthquakes located within 250 m on each side from the vertical cross-section (A) A′ (left panels) and within 500 m on each side from the vertical cross-section (B) B′ (right panels). From top to bottom: P-wave velocity (
The distribution of the relocated seismicity using the new detailed 3D
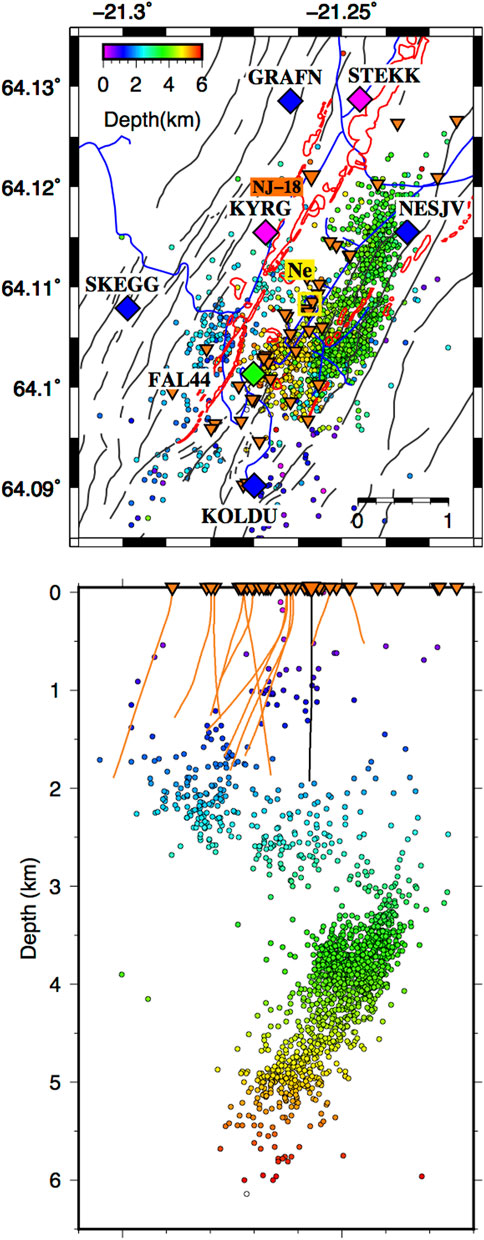
FIGURE 8. Relocated seismicity used in the 3D velocity models. Map and cross-section of the relocated seismicity of the Nesjavellir geothermal field and surroundings. The inverted orange triangles are the well heads and the diamonds show the seismic stations. Orange lines in the cross-sections are borehole trajectories. Red lines represent the eruptive fissure and craters, while the fractures are shown using gray lines (Sæmundsson et al., 2016). Roads are blue and the Nesjavellir power plant is in the yellow square, labeled Ne. The deep injection well NJ-18 is labeled, and its trajectory shown in black. The shallow wells northeast of NJ-18, are also injection wells (note some are shallower than 400 m and do, therefore, not plot clearly on the figure). Earthquakes are color coded by depth.
5 Discussion
In the following section we will discuss and interpret the results of the high resolution 3D tomographic images of the Nesjavellir geothermal area we provided, in terms of
5.1 Seismic tomography
At shallow depths (<1 km), the observed low
Between 1.0 and 3.0 km depth, the production area (Figures 1C, 7) is marked by well constrained low
The extensive fluid extraction at Nesjavellir lowers the pore-pressure in the field and consequently increases the steam dominated zone, leading to lower
At depth greater than 3 km, down to the bottom of the well resolved area (5 km depth), the tomographic images show high
5.2 Relocated seismicity
Figure 8 displays the 2,358 relocated seismic events in the 3D final P- and S-wave models. The vertical and horizontal error modal value is 200 m. The seismicity is confined to the Nesjavellir valley and surrounding ridges, which contains the Nesjavellir power plant, its production and injection wells. The bimodal depth distribution of the seismicity is striking, with the shallower cluster located at 0.5–3.0 km depth and the deeper cluster at 3–6 km depth (Figure 8). The shallowest part of the deeper cluster is located slightly to the NE of the power plant (labeled Ne, on Figure 8) reaching under the power plant and production area at greater depth. We hypothesize that this NNE-SSW trending, west (∼40°) dipping, deeper cluster (3–6 km) is of tectonic nature, as it is highly unlikely that the production would influence stresses down to 6 km depth. It is more likely the seismicity is taking place on the NNE trending normal faults mapped in the area, which belong to the fissure swarm (on-land rift segment) of the Hengill volcano.
It is well established that the reinjection of cold wastewater in hot rocks can yield in vapor creation, and giving rise to cracks opening due to thermal contraction, which together with a fluid pore pressure increase may be the cause of the shallower seismicity. This mechanism has been invoked for other geothermal areas such as The Geysers in southern California (e.g., Majer & Peterson, 2007; Lin & Wu, 2018), Krafla NE-Iceland (Ágústsson and Blanck, 2019) and on Hellisheiði (Ágústsson et al., 2015). However, prior to 2020, all of the wastewater in Nesjavellir was injected into wells shallower than 500 m, and the injection fluid is, therefore, not thought to be in direct contact with the main underlying geothermal system. The re-injection of wastewater into well NJ-18 (the deepest well; for location, see Figure 8) only started in 2020 and no change in seismicity has been observed in association with that injection. It is, therefore, highly unlikely that the shallow seismicity observed during our study period in the Nesjavellir valley is induced by the reinjection. On the other hand, seismicity can also be induced by production, as demonstrated by Kristjánsdóttir et al. (2019) in Hverahlíð, another sub-field of the Hengill geothermal area. We suggest that the rather sparse shallower seismicity is more likely related to the production, in combination with naturally occurring earthquakes, and taking place within the geothermal reservoir. Well temperature data (Figure 9) show that the shallow seismicity is observed in areas of temperature >240°C. It is an interesting observation how little shallow seismicity is observed with a dense seismic network despite the intense production of 120 MWe and 350 MWt.
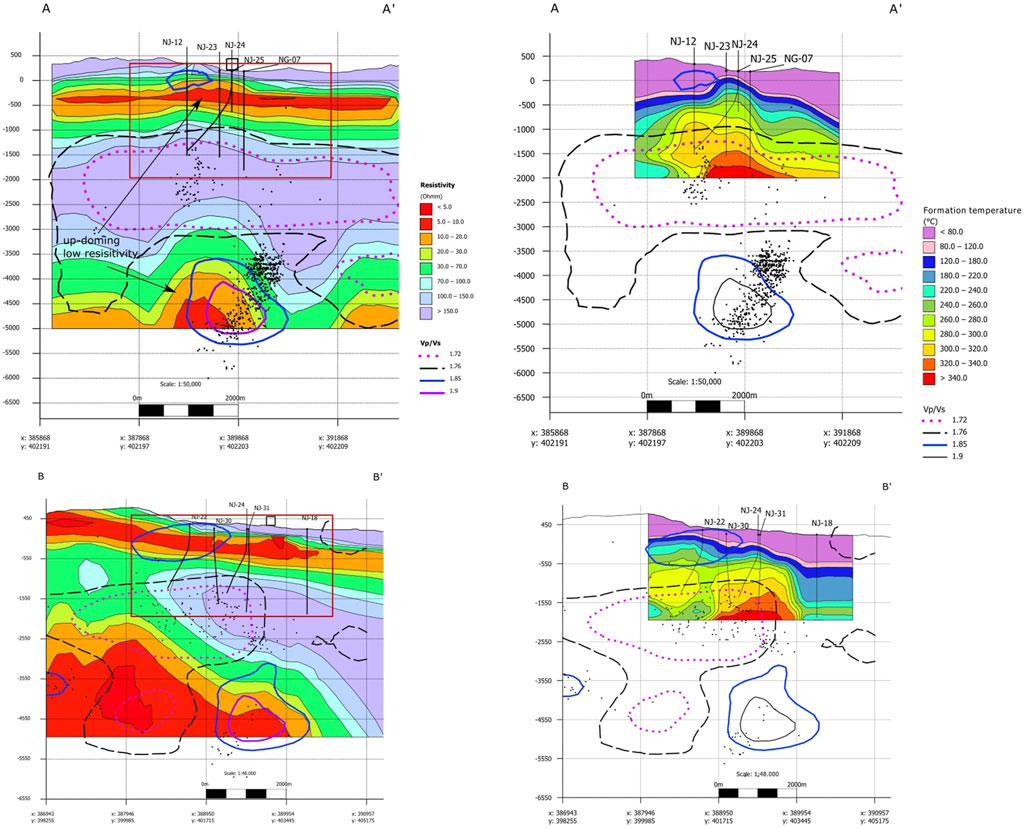
FIGURE 9. Cross-sections (A) A′ and (B) B′ (locations are given on Figure 1). Earthquake’s hypocenters are shown on all four figures as black dots [500 m to each side for (A) A′ and 250 m for (B) B′] and contour lines for the
5.3 Joint interpretation of the 3D seismic tomography, resistivity and well temperature data
The combination of local high resolution seismic and resistivity tomographic images provides a powerful tool for mapping the structure of the subsurface and further understanding of the role of the fluids in the production area of the Nesjavellir geothermal field. Notably, for the first time a joint interpretation or comparison of resistivity data,
Resistivity methods are commonly used in geothermal studies as a temperature proxy in the exploration of high-temperature geothermal fields, keeping in mind that the system might well be fossil and because of that or other reasons, the temperature may not be in equilibrium with the formation temperature (see e.g., Hersir et al., 2022 and references therein). Low resistivity (<10 Ωm), in the uppermost 1 km of the crust, is assumed to be related to smectite, which is a low temperature hydrothermal alteration mineral forming at 100°C–230°C (Árnason et al., 1986, 1987; Hersir et al., 1990; Árnason et al., 2010; Benediktsdóttir et al., 2021). Beneath this conductive clay cap, a high-resistivity core is associated with high-temperature alteration minerals (chlorite, epidote; formed at temperature >230°C). In the Hengill high-temperature geothermal field the up-doming low resistivity at depth (<10 Ωm) imaged by MT data (Árnason et al., 2010; Benediktsdóttir et al., 2021) is thought to represent the core of the geothermal field and presumably reflecting hot, solidified intrusions that are heat sources for the geothermal system.
Cross-section A-A′ on Figure 9, which lies across the Nesjavellir valley (for location, see Figure 1), shows both up-doming of the shallow low resistivity layer (the smectite clay cap) and the up-doming of the deep-seated low resistivity layer (between well NJ-12 and NJ-24), reaching up to about 4.500 m b.s.l. (upper left panel on Figure 9). The deep-seated low resistivity anomaly coincides spatially quite well with the high
Similar correlations are seen on cross-section B-B’ (Figure 9), which lies along the Nesjavellir valley (for location, see Figure 1). The deep-seated low resistivity which extends from the Hengill volcano to the north domes up locally (lower left panel on Figure 9) coinciding with the high
At depths greater than 3 km, down to 5 km depth, our results indicate that the high
Figure 10 is a horizontal slice at 4 km depth through the resistivity model showing earthquake locations and the
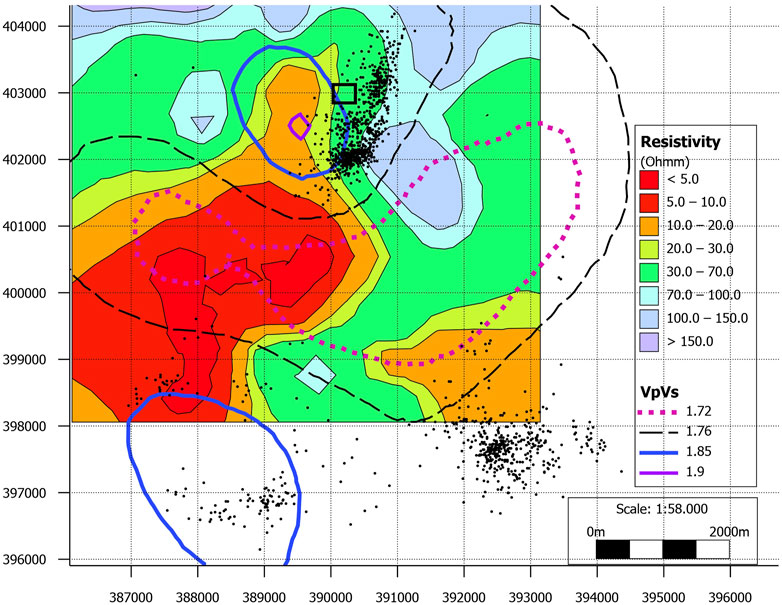
FIGURE 10. A horizontal slice at 4 km depth through the resistivity model (Vilhjálmsson et al., 2019) and the tomographic model showing
6 Conclusion
We present the first 3D seismic tomographic study specifically focused on the Nesjavellir geothermal field, and its associated natural and induced seismicity.
The relocated seismicity using the new 3D velocity model highlights the dual earthquakes depth distribution that was not discussed by previous large scale tomographic studies: 1) rather sparse seismicity within the production area of Nesjavellir at 1–3 km depth in relation to the intense production of 120 MWe and 350 MWt. This seismicity is located around the bottom of the wells and is likely induced by the production in combination with natural events taking place in the shallow part of the geothermal system. The shallow seismicity is observed in areas of temperature >240°C. We speculate that the seismicity is triggered within the part of the reservoir which is being extracted from. If that is the case then the seismicity outlines the harnessed reservoir. The joint interpretation for shallower depths (1–3 km) shows that the low
The comparison of variations in crustal velocities in relation to resistivity and well temperature data in the valley of Nesjavellir, shows a deep-seated conductive body, which domes up at about 4.500 m b.sl. and spatially coincides with a significant high
The 3D Nesjavellir optimized velocity model presented in this study can be of relevant importance for future applications. This is the case, for example, of the precise earthquake location aimed at monitoring the space and time evolution of the seismicity that can involve active faults able to generate large magnitude earthquakes. Moreover, the availability of a 3D model represents a starting point for a future 4D tomography study which will allow us to track changes in crustal properties over time. Eventually, the estimation of fault mechanisms and kinematic source parameters can of course benefit from the proposed 3D model.
Data availability statement
The raw data supporting the conclusion of this article will be made available by the authors, without undue reservation.
Author contributions
OA and PC conceived the work. FN, OA, VC, and RD performed the 1D velocity model, earthquake relocation and 3D tomographic analysis. GH, TÁ, SG, OA, and FN worked on the joint interpretation of 3D seismic tomography, resistivity and well temperature data. VH and TÁ provided the seismic catalogue data and related metadata. OA, FN, GH, and TÁ worked on draft manuscript preparation. All authors discussed the results and contributed to the final manuscript.
Funding
This work has been supported by the S4CE (“Science for Clean Energy”) project, funded by the European Union’s Horizon 2020—R&I Framework Programme, under grant agreement No 764810 and by PRIN-2017 MATISSE project, No 20177EPPN2, funded by the Italian Ministry of Education and Research.
Acknowledgments
We thank the Geothermica ERA-net funded COSEISMIQ project (project No. 170167-4401) for data from six of their stations, and Icelandic Meteorological Office (IMO) for data from one station. We thank ÍSOR and ON Power for the use of their extensive dataset on manually refined phase-picks.
Conflict of interest
The authors declare that the research was conducted in the absence of any commercial or financial relationships that could be construed as a potential conflict of interest.
Publisher’s note
All claims expressed in this article are solely those of the authors and do not necessarily represent those of their affiliated organizations, or those of the publisher, the editors and the reviewers. Any product that may be evaluated in this article, or claim that may be made by its manufacturer, is not guaranteed or endorsed by the publisher.
Supplementary material
The Supplementary Material for this article can be found online at: https://www.frontiersin.org/articles/10.3389/feart.2022.994280/full#supplementary-material
References
Ágústsson, K., and Blanck, H. (2019). Krafla, jarðskjálftar og niðurdæling (Krafla, earthquakes and reinjection). In Icelandic. ÍSOR-2019/022, LV-2019-032.
Ágústsson, K., and Flóvenz, Ó. G. (2005). “The thickness of the seismogenic crust in Iceland and its implications for geothermal systems in Iceland,” in Proceedings of the 2005 world geothermal congress (Turkey: Antalya).
Ágústsson, K., Kristjánsdóttir, S., Flóvenz, Ó. G., and Guðmundsson, Ó. (2015). “Induced seismic activity during drilling of injection wells at the Hellisheiði power plant, SW Iceland,” in Proceedings world geothermal congress 2015 melbourne (Australia, 19–25.
Amoroso, O., Ascione, A., Mazzoli, S., Virieux, J., and Zollo, A. (2014). Seismic imaging of a fluid storage in the actively extending Apennine mountain belt, southern Italy. Geophys. Res. Lett. 41, 3802–3809. doi:10.1002/2014GL060070
Amoroso, O., Festa, G., Bruno, P. P., D’Auria, L., De Landro, G., Di Fiore, V., et al. (2018). Integrated tomographic methods for seismic imaging and monitoring of volcanic caldera structures and geothermal areas. J. Appl. Geophy. 156, 16–30. doi:10.1016/j.jappgeo.2017.11.012
Amoroso, O., Russo, G., De Landro, G., Garambois, S., Mazzoli, S., Parente, M., et al. (2017). From velocity and attenuation tomography to rock physical modeling: Inferences on fluid driven earthquake processes at the irpinia fault system in southern Italy. Geophys. Res. Lett. 44, 6752–6760. doi:10.1002/2016gl072346
Árnason, K., Eysteinsson, H., and Hersir, G. P. (2010). Joint 1D inversion of TEM and MT data and 3D inversion of MT data in the Hengill area, SW Iceland. Geothermics 39 (1), 13–34. doi:10.1016/j.geothermics.2010.01.002
Árnason, K., Haraldsson, G. I., Johnsen, G. V., Thorbergsson, G., Hersir, G. P., Saemundsson, K., et al. (1987). Nesjavellir - Ölkelduháls. Surface investigation in 1986. Orkustofnun report, in Icelandic, 112. OS-87018/JHD-02.
Árnason, K., Haraldsson, G. I., Johnsen, G. V., Thorbergsson, G., Hersir, G. P., Saemundsson, K., et al. (1986). Nesjavellir. Geological and geophysical surveys in 1985 Orkustofnun report, in Icelandic, 125. OS-86014/JHD-02.
Benediktsdóttir, Á., Árnason, K., Karlsdóttir, R., Vilhjálmsson, A. M., and Kristjánsson, B. R. (2021). “Detailed resistivity models of sub-areas of the Hengill geothermal field, Iceland,” in Proceedings world geothermal congress.
Bessason, B., Ólafsson, E. H., Gunnarsson, G., Flóvenz, Ó. G., Jakobsdóttir, S. S., Björnsson, S., et al. (2012). Verklag vegna örvaðrar skjálftavirkni í jarðhitakerfum. Reykjavik, Iceland: Orkuveita Reykjavíkur.
Bjarnason, I. T., Menke, W., Flóvenz, Ó. G., and Caress, D. (1993). Tomographic image of the mid‐Atlantic plate boundary in southwestern Iceland. J. Geophys. Res. 98 (B4), 6607–6622. doi:10.1029/92JB02412
Björnsson, G., Hjartarson, A., Böðvarsson, G., and Steingrimsson, B. (2003). “Development of a 3-D geothermal reservoir model for the greater Hengill volcano in SW-Iceland,” in Proceedings of TOUGH symposium 2003 (Berkeley, CA: Lawrence Berkeley National Laboratory), 12–14.
Bodvarsson, R., Rognvaldsson, S. T., Jakobsdottir, S. S., Slunga, R., and Stefansson, R. (1996). The SIL data acquisition and monitoring system. Seismol. Res. Lett. 67 (5), 35–46. doi:10.1785/gssrl.67.5.35
Brandsdóttir, B., Parsons, M., White, R. S., Guðmundsson, O., Drew, J., and Thorbjarnadóttir, B. (2010). The May 29 2008 earthquake aftershock sequence within the South Iceland Seismic Zone: Fault locations and source parameters of aftershocks. Jokull J. Glaciol. Geol. Soc. Icel. 60, 23–46.
De Landro, G., Amoroso, O., Russo, G., and Zollo, A. (2020). 4D travel-time tomography as a tool for tracking fluid-driven medium changes in offshore oil–gas exploitation areas. Energies 1322, 5878. doi:10.3390/en13225878
De Landro, G., Serlenga, V., Russo, G., Amoroso, O., Festa, G., Bruno, P. P., et al. (2017). 3-D ultra-high resolution seismic imaging of shallow solfatara crater in campi flegrei (Italy): New insights on deep hydrothermal fluid circulation processes. Sci. Rep. 7, 3412. doi:10.1038/s41598-017-03604-0
Duran, A. (2021). Numerical sensitivity kernels in elastic media for imaging purposes and seismic tomography in the Hengill geothermal field. Dr. Diss. ETH-Zurich. doi:10.3929/ethz-b-000518037
Flóvenz, Ó. G., Ágústsson, K., Guðnason, E. Á., and Kristjánsdóttir, S. (2015). “Reinjection and induced seismicity in geothermal fields in Iceland,” in Proceedings world geothermal congress 2015 (Melbourne, Australia.
Foulger, G. R. (1988a). Hengill triple junction, SW Iceland 1. Tectonic structure and the spatial and temporal distribution of local earthquakes. J. Geophys. Res. 93 (B11), 13493–13506. doi:10.1029/JB093iB11p13493
Foulger, G. R. (1988b). Hengill triple junction, SW Iceland 2. Anomalous earthquake focal mechanisms and implications for process within the geothermal reservoir and at accretionary plate boundaries. J. Geophys. Res. 93 (B11), 13507–13523. doi:10.1029/JB093iB11p13507
Foulger, G. R. (1984). Seismological studies at the Hengill geothermal area, S W Iceland, 3. England: Univ.of Durham, 13. PhD thesis.
Foulger, G. R. (1995). The Hengill geothermal area, Iceland: Variation of temperature gradients deduced from the maximum depth of seismogenesis. J. Volcanol. Geotherm. Res. 65 (1-2), 119–133. doi:10.1016/0377-0273(94)00088-X
Foulger, G. R., and Toomey, D. R. (1989). Structure and evolution of the hengill‐grensdalur volcanic complex, Iceland: Geology, geophysics, and seismic tomography. J. Geophys. Res. 94 (B12), 17511–17522. doi:10.1029/JB094iB12p17511
Gunnarsdóttir, S. H., Helgadóttir, H. M., and Snaebjornsdottir, S. (2020). Geco: Geological properties, permeability and porosity of the Nesjavellir high temperature area in relation to the Re-injection of geothermal CO2 and H2S gases. Proc. World Geotherm. Congr.
Gunnarsson, G., and Aradóttir, E. S. P. (2015). The deep roots of geothermal systems in volcanic areas: Boundary conditions and heat sources in reservoir modeling. Transp. Porous Media 108, 43–59. doi:10.1007/s11242-014-0328-1
Gunnarsson, G., Arnaldsson, A., and Oddsdóttir, A. L. (2011). Model simulations of the Hengill area, southwestern Iceland. Transp. Porous Media 90, 3–22. doi:10.1007/s11242-010-9629-1
Helgadóttir, H. M., Snæbjörnsdóttir, S. Ó., Níelsson, S., Gunnarsdóttir, S. H., Matthíasdóttir, T., Harðarson, B. S., et al. (2010). “Geology and hydrothermal alteration in the reservoir of the Hellisheiði high temperature system, SW-Iceland,” in Proceedings world geothermal congress 2010 bali (Indonesia, 25–29.
Hersir, G. P., Björnsson, G., and Björnsson, A. (1990). Eldstöðvar og jarðhiti á Hengilssvæði. Jarðeðlisfræðileg könnun. Orkustofnun OS-90031/JHD-06 93 (in Icelandic).
Hersir, G. P., Guðnason, E. Á., and Flóvenz, Ó. G. (2022). “Geophysical exploration techniques,” in Comprehensive renewable energy. Editor T. M. Letcher. 2nd edition (Oxford: Elsevier), 7, 26–79. doi:10.1016/B978-0-12-819727-1.00128-X
Hjörleifsdóttir, V., Ingvarsson, G., Ratouis, T., Gunnarsson, G., Snæbjörnsdóttir, S. Ó., and Sigfússon, B. (2021a). “Ten years of induced earthquakes in the Húsmúli CO2 injection site, Hellisheiði, Iceland,” in Sixth international conference on engineering Geophysics, virtual, 25–28. doi:10.1190/iceg2021-027.1
Hjörleifsdóttir, V., Snæbjörnsdóttir, S. Ó., Gunnarsson, G., Kristjánsson, B. R., Vogfjord, K., Jónsdóttir, K., et al. (2021b). “Induced earthquakes in the Hellisheiði geothermal field, Iceland,” in Proceedings world geothermal congress 2020+1 reykjavik (Iceland.
Jousset, P., Haberland, C., Bauer, K., and Árnason, K. (2011). Hengill geothermal volcanic complex (Iceland) characterized by integrated geophysical observations. Geothermics 40 (1), 1–24. doi:10.1016/j.geothermics.2010.12.008
Juncu, D., Árnadóttir, T., Hooper, A., and Gunnarsson, G. (2017). Anthropogenic and natural ground deformation in the Hengill geothermal area, Iceland. J. Geophys. Res. Solid Earth 122, 692–709. doi:10.1002/2016jb013626
Kissling, E., Ellsworth, W. L., Eberhart‐Phillips, D., and Kradolfer, U. (1994). Initial reference models in local earthquake tomography. J. Geophys. Res. 99 (B10), 19635–19646. doi:10.1029/93JB03138
Kissling, E. (1988). Geotomography with local earthquake data. Rev. Geophys. 26 (4), 659–698. doi:10.1029/rg026i004p00659
Kissling, E., Kradolfer, U., and Maurer, H. (1995). Program VELEST user’s guide-Short Introduction. ETH Zurich: Institute of Geophysics.
Kristjánsdóttir, S., Gudnason, E. Á., Ágústsson, K., and Ágústsdóttir, Th. (2019). Hverahlíð, Hengill area: Detailed analysis of seismic activity from december 2016 to december 2019, 54. ÍSOR - Iceland GeoSurvey, Reykjavík, Report, ÍSOR-2019/051.
Latorre, D., Virieux, J., Monfret, T., Monteiller, V., Vanorio, T., Got, J. L., et al. (2004). A new seismic tomography of Aigion area (Gulf of Corinth, Greece) from the 1991 data set. Geophys. J. Int. 159 (3), 1013–1031. doi:10.1111/j.1365-246X.2004.02412.x
Li, K. L., Abril, C., Gudmundsson, O., and Gudmundsson, G. B. (2019). Seismicity of the Hengill area, SW Iceland: Details revealed by catalog relocation and collapsing. J. Volcanol. Geotherm. Res. 376, 15–26. doi:10.1016/j.jvolgeores.2019.03.008
Lin, G., and Wu, B. (2018). Seismic velocity structure and characteristics of induced seismicity at the Geysers Geothermal Field, eastern California. Geothermics 71, 225–233. doi:10.1016/j.geothermics.2017.10.003
Lomax, A., Virieux, J., Volant, P., and Berge-Thierry, C. (2000). “Probabilistic earthquake location in 3D and layered models,” in Advances in seismic event location (Dordrecht: Springer), 101–134.
Majer, E. L., and Peterson, E. (2007). The impact of injection on seismicity at the Geysers, California Geothermal Field. Int. J. Rock Mech. Min. Sci. 44 (8), 1079–1090. doi:10.1016/j.ijrmms.2007.07.023
Mavko, G., Mukerji, T., and Dvorkin, J. (2009). The rock physics handbook. Second Edition. New York: Cambridge University Press. Published in the United States of America by.
Miller, A. D., Julian, B. R., and Foulger, G. R. (1998). Three-dimensional seismic structure and moment tensors of non-double-couple earthquakes at the Hengill–Grensdalur volcanic complex, Iceland. Geophys. J. Int. 133 (2), 309–325. doi:10.1046/j.1365-246X.1998.00492.x
Napolitano, F., Amoroso, O., La Rocca, M., Gervasi, A., Gabrielli, S., and Capuano, P. (2021). Crustal structure of the seismogenic volume of the 2010–2014 pollino (Italy) seismic sequence from 3D P- and S-wave tomographic images. Front. Earth Sci. 9. doi:10.3389/feart.2021.735340
Paige, C. C., and Saunders, M. A. (1982). Lsqr: An algorithm for sparse linear equations and sparse least squares. ACM Trans. Math. Softw. 8 (1), 43–71. doi:10.1145/355984.355989
Podvin, P., and Lecomte, I. (1991). Finite difference computation of traveltimes in very contrasted velocity models: A massively parallel approach and its associated tools. Geophys. J. Int. 105 (1), 271–284. doi:10.1111/j.1365-246X.1991.tb03461.x
Rögnvaldsson, S. Th., Gudmundsson, G., Ágústsson, K., Stefánsson, R., and Jakobsdóttir, S. (1996). “Recent seismicity near the Hengill triple-junction, SW Iceland,” in Proceedings of the XXV general assembly of the eur. Seismol. Comm., Icelandic meteorological Office, Reykjavík, Iceland. Editor B. Thorkelson, 461–466. Seismology in Europe.
Sæmundsson, K. (1962). Das alter der Nesja-lava (SW-island). Neues Jahrb. Geol. Paleontol. Monatsh. 12, 650.
Sæmundsson, K., and Saemundsson, K. (1992). Geology of the thingvallavatn area. Oikos 64 (1/2), 40–68. doi:10.2307/3545042
Sæmundsson, K., Sigurgeirsson, M. Á., Hjartarson, Á., Kaldal, I., Kristinsson, S. G., and Víkingsson, S. (2016). Geological map of SW Iceland, 1:100 000 (2. edition). Reykjavík: Iceland GeoSurvey.
Sæmundsson, K. (1967). Vulkanismus und Tektonik des Hengill-Gebietes in Sudwest-Island. Acta Nat. Isl. II-7, 195. (in German).
Sánchez-Pastor, P., Obermann, A., Reinsch, T., Ágústsdóttir, T., Gunnarsson, G., Tómasdóttir, S., et al. (2021). Imaging high-temperature geothermal reservoirs with ambient seismic noise tomography, a case study of the Hengill geothermal field, SW Iceland. Geothermics 96, 102207. doi:10.1016/j.geothermics.2021.102207
Serlenga, V., de Lorenzo, S., Russo, G., Amoroso, O., Garambois, S., Virieux, J., et al. (2016). A three‐dimensional QP imaging of the shallowest subsurface of Campi Flegrei offshore caldera, southern Italy. Geophys. Res. Lett. 43, 218. doi:10.1002/2016GL071140
Sigmundsson, F., Einarsson, P., Rögnvaldsson, S. T., Foulger, G. R., Hodgkinson, K. M., and Thorbergsson, G. (1997). The 1994–1995 seismicity and deformation at the Hengill triple junction, Iceland: Triggering of earthquakes by minor magma injection in a zone of horizontal shear stress. J. Geophys. Res. 102 (B7), 15151–15161. doi:10.1029/97JB00892
Sinton, J., Grönvold, K., and Sæmundsson, K. (2005). Postglacial eruptive history of the western volcanic zone, Iceland. Geochem. Geophys. Geosyst. 6, Q12009. doi:10.1029/2005GC001021
Stefánsson, R., Böđvarsson, R., Slunga, R., Einarsson, P., Jakobsdóttir, S., Bungum, H., et al. (1993). Earthquake prediction research in the south Iceland seismic zone and the SIL project. Bull. Seismol. Soc. Am. 83 (3), 696–716.
Tryggvason, A., Rögnvaldsson, S. T., and Flóvenz, O. G. (2002). Three-dimensional imaging of the P-and S-wave velocity structure and earthquake locations beneath Southwest Iceland. Geophys. J. Int. 151 (3), 848–866. doi:10.1046/j.1365-246X.2002.01812.x
Ussher, G., Harvey, C., Johnstone, R., and Anderson, E. (2000). “Understanding the resistivities observed in geothermal systems,” in Proceedings world geothermal congress Kyushu, 1915–1920.
Vilhjálmsson, A. M., Benediktsdóttir, Á., and Árnason, K. (2019). Nesjavellir og Þverárdalur Einvíð túlkun viðnámsgagna og þrívíð fyrir Nesjavallasvæðið. ÍSOR report, in Icelandic, ÍSOR-2019/062,
Violay, M., Gibert, B., Mainprice, D., Evans, B., Dautria, J. M., Azais, P., et al. (2012). An experimental study of the brittle-ductile transition of basalt at oceanic crust pressure and temperature conditions. J. Geophys. Res. 117. doi:10.1029/2011JB008884
Wadati, K., and Oki, S. (1933). On the travel time of earthquake waves.(Part II). J. Meteorological Soc. Jpn. 11 (1), 14–28. doi:10.2151/jmsj1923.11.1_14
Wagner, F. (2019). “Toward fully automatic earthquake detection and processing for tomography in the Hengill area,” in Digital comprehensive summaries of uppsala dissertations from the faculty of science and technology 1774. Uppsala: Acta Universitatis Upsaliensis, 53. ISBN 978-91-513-0574-5. Available at: http://uu.diva-portal.org/smash/get/diva2:1286849/FULLTEXT01.pdf.
Keywords: seismic imaging, Nesjavellir, Iceland, geothermal, brittle-ductile transition, 3D tomography, Vp/Vs ratio, joint geoscientific interpretation
Citation: Amoroso O, Napolitano F, Hersir GP, Agustsdottir T, Convertito V, De Matteis R, Gunnarsdóttir SH, Hjörleifsdóttir V and Capuano P (2022) 3D seismic imaging of the Nesjavellir geothermal field, SW-Iceland. Front. Earth Sci. 10:994280. doi: 10.3389/feart.2022.994280
Received: 14 July 2022; Accepted: 21 September 2022;
Published: 12 October 2022.
Edited by:
Antonio Pio Rinaldi, ETH Zurich, SwitzerlandCopyright © 2022 Amoroso, Napolitano, Hersir, Agustsdottir, Convertito, De Matteis, Gunnarsdóttir, Hjörleifsdóttir, Capuano. This is an open-access article distributed under the terms of the Creative Commons Attribution License (CC BY). The use, distribution or reproduction in other forums is permitted, provided the original author(s) and the copyright owner(s) are credited and that the original publication in this journal is cited, in accordance with accepted academic practice. No use, distribution or reproduction is permitted which does not comply with these terms.
*Correspondence: Ortensia Amoroso, b2Ftb3Jvc29AdW5pc2EuaXQ=