 Feiyue Sun1
 Jiaqi Guo
- 1School of Civil Engineering, Henan Polytechnic University, Jiaozuo, Henan, China
- 2Research Institute for National Defense Engineering of Academy of Military Science PLA China, Luoyang, Henan, China
In order to study the effect of loading rate on rockburst, an indoor test of single-face fast unloading-three directions and five-face stress-vertical continuous loading is conducted under different loading rates using a new true-triaxial rockburst test system. The entire process of rockburst inoculation-occurrence-development is completely and accurately reproduced. The fragmentation degree, fractal dimension, and Weibull distribution characteristics of rockburst fragments under different loading rates are compared and analyzed. The results indicate that the rockburst ejection failure process can be summarized as four stages: grain ejection, rock spalling into plates, rock shearing into fragments, and rock fragment ejection. Rockburst fragments are mostly coarse-grained, medium-grained, and fine-grained. The macroscopic block characteristics of rockburst fragments reflect the fragmentation degree of rock, and the fragmentation degree of rockburst fragments increases with the loading rate. The fractal dimension shows the same trend with different loading rates, that is, the fractal dimension grows as the loading rate increases. As the loading rate increases, the crack expansion rate accelerates, which aggravates the damage to the rock specimen by decreasing its compressive strength and causing greater fragmentation when the specimen is failed. The loading rate has a significant effect on the energy consumption of rockburst fragments.
1 Introduction
With the construction of underground engineering to the deep earth, rockburst disasters caused by deep high ground stress are becoming more and more frequent. A rockburst has the characteristics of being sudden, local, instantaneous, and violent. When the rockburst disaster occurs, resulting in rock fragments produced by bursting loose, high-speed ejection or throwing, and other dynamic damage phenomena, it poses a serious threat to the safe construction of the project. Seventy-five people perished in an extremely strong rockburst at the Springhill mine in Canada (Hedley, 1992). An extremely strong rockburst in the drainage tunnel of the Jinping II hydropower project in China caused a serious accident that resulted in seven deaths and one injured (Hu et al., 2019b). During underground excavation, the occurrence of rockburst disasters is not only related to the rock mineral composition and internal rock structure but also to the surrounding rock stress state and excavation method. As well, external loading conditions such as loading rate have an equally significant influence on the mechanical behavior of rock. Therefore, the study of different loading rates on the failure characteristics, strength characteristics, energy evolution, and fragment characteristics of rock, to further elucidate the formation mechanism of rockburst disasters, has both theoretical significance and practical application value.
In the research on the effect of loading rate on rockburst, both domestic and international scholars have achieved some progress. Su et al. (2018) investigated the influence of loading rate on strainburst. Chen et al. (2019) studied the energy dissipation of fragments during rockburst. Lu et al. (2020) investigated the effects of loading rate on rock deformation, strength, and failure mode. Si et al. (2020) studied the influence of loading rate on rockburst in a circular tunnel. Khan et al. (2022) proposed a new rockburst tendency criterion based on energy evolution characteristics under different loading rates. The energy release characteristics of rockbursts are closely related to the fragmentation degree of rock fragments after destruction, and the fractal dimension can partially reflect the physical mechanism of rock fragmentation evolution (Xie and Pariseau, 1993). Li et al. (2010), He et al. (2018), and Liu et al. (2021) analyzed the size feature and fragmentation degree of rockburst fragments. Li et al. (2014) clarified the variation law between fractal dimension and loading rate. Liu et al. (2014) determined the fractal dimension of rockburst fragments. Xia et al. (2014) studied the mass and shape distribution characteristics of rockburst fragments under different stress paths. Jiang et al. (2020a) discovered that the average size of rockburst fragments reduces as initial damage increases. Most of the abovementioned research results focus on the effect of loading rate on rock failure under uniaxial, biaxial, and conventional triaxial compression conditions. Existing research on rockburst fragments is still in the qualitative stage, and relevant quantitative research is yet to be carried out. Therefore, in order to more realistically reveal the characteristics of rockburst in the actual engineering context and to provide a more accurate description of the stress path transformation process during deep underground excavation, in this article, a true triaxial test of single-face fast unloading-three directions and five-face stress-vertical continuous loading will be conducted in order to investigate the failure characteristics, strength characteristics, energy evolution, and fragmentation characteristics of rock under different loading rates.
This article uses a novel true-triaxial rockburst test system, based on a new rockburst test method and a new loading and unloading path, to conduct an indoor physical simulation test of single-face fast unloading-three directions and five-face stress-vertical continuous loading under different loading rates. The entire process of rockburst incubation-occurrence-development is monitored in real time by an image acquisition system. Under different loading rates, the failure characteristics, strength characteristics, and energy evolution of granite specimens are compared and analyzed. Therefore, collecting the ejected fragments of specimens after the rockburst in order to measure the quality, size, and grain size of rockburst fragments. The statistical distribution and fractal characteristics of granite rockburst fragments are analyzed by quantitative means and methods in order to further elaborate on the rockburst phenomena under different loading rates.
2 The novel experimental method and design
2.1 Testing equipment
The test system mainly consists of a true-triaxial rockburst testing machine, a loading system, a control system, a real-time data signal acquisition and monitoring system, a high-speed camera system, and other subsystems (Figure 1). True-triaxial rockburst testing machine is a new high-pressure servo rigid press that has a maximum vertical loading pressure of 5,000 kN and a maximum horizontal loading pressure of 3,000 kN, through the full digital servo controller control can be realized in three vertical directions for independent loading and unloading. It has the special function of single-face fast unloading under the three directions and six-face loading conditions. It can accurately simulate the process of rapid change of surrounding rock stress path at the moment of underground engineering excavation. With the aid of a high-speed camera, it is possible to observe the failure phenomenon of unloading faces in real time.
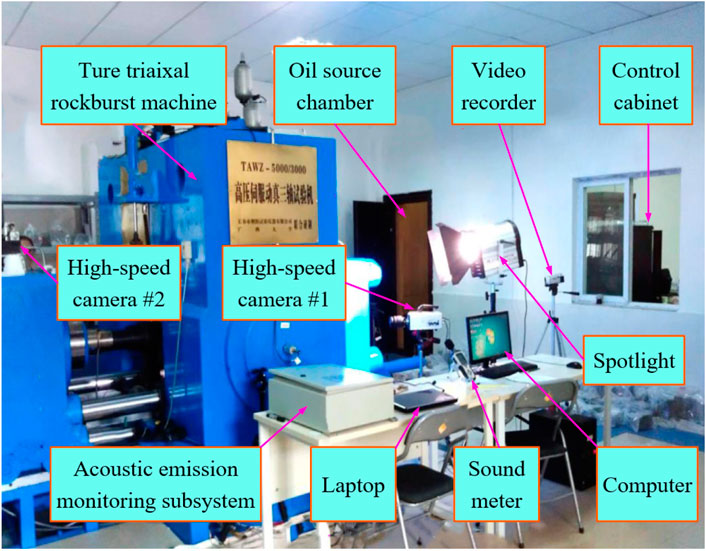
FIGURE 1. True-triaxial rockburst testing system (adapted from Su et al. 2016a).
2.2 Rock sample preparation
Grayish-white granite samples were collected in Wenshang County, Shandong Province, China (Figure 2). To ensure the comparability of tests and decrease the impact of material heterogeneity and dispersion on the test results, all specimens were extracted from the same intact rock. Before true-triaxial rockburst tests, the rectangular prismatic specimens, 100 mm (length) × 100 mm (width) × 200 mm (height), were prepared, and all sides and ends of specimens were finely ground and polished to minimize the local stress concentration and produce flat and smooth end surfaces. To ensure that rock samples are uniformly pressured in all directions, the processing accuracy is strictly in accordance with the standard of the International Society for Rock Mechanics (Fairhurst and Hudson, 1999), with a flatness error of ±0.05 mm for two opposite faces and a perpendicularity error of ±0.25° for two adjacent faces.
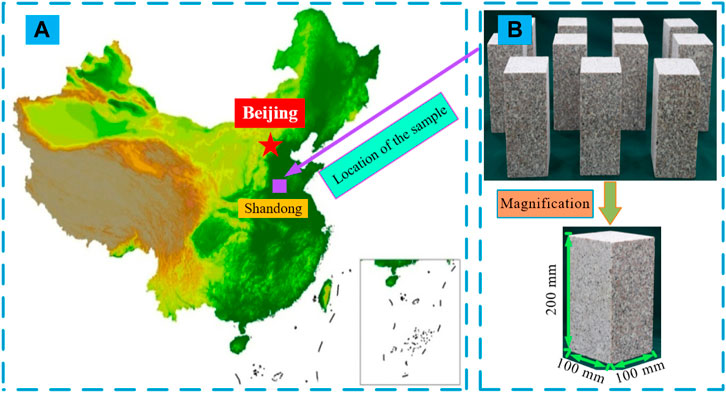
FIGURE 2. Location and photo of the sample. (A) Sampling location; (B) photo of rock specimens.
2.3 Testing methodology
2.3.1 Stress path design
Before excavation of the cavern, the rock mass was in a triaxial stress state. After the cavern excavation is unloaded, the unloading face of rock mass appears, and its radial stress decreases sharply (the corresponding principal stress is σ3), the tangential stress increases gradually (the corresponding principal stress is σ1), and the principal stress along the cavern axis remains the same as the initial stress field (the corresponding principal stress is σ2), as depicted in Figure 3. For the rock unit in the area of concentrated compressive stress in the surrounding rock mass, the radial stress on the excavation boundary is zero, while the radial stress in the rock mass at a certain distance from the excavation surface rises sharply along the diameter direction, and the rock unit is in a special stress state of “one-face zero load-three directions and five-face load".
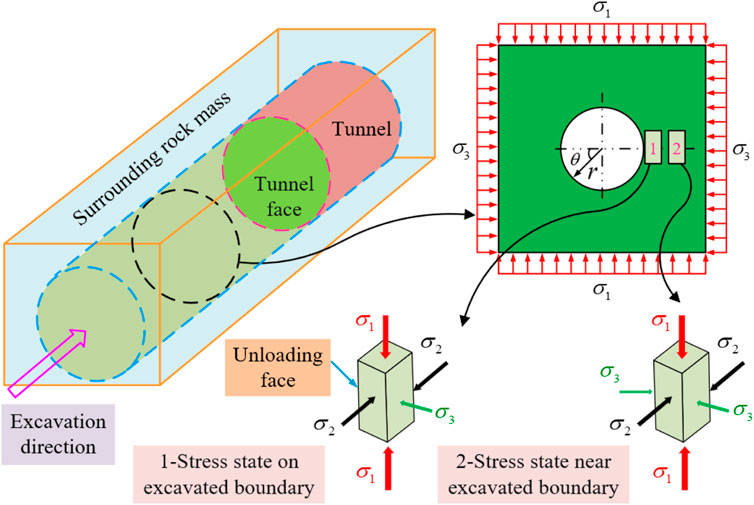
FIGURE 3. Stress state of rocks at and near the excavation boundary (adapted from Jiang et al. (2020b)).
According to the stress path and boundary condition transformation process of the surrounding rock mass after excavation of an underground cavern (Figure 3), the true-triaxial rockburst test with single-face fast unloading-three directions and five-face stress-vertical continuous loading can accurately reproduce the stress transformation process of radial stress plunge and tangential stress concentration after excavation and unloading of deep underground engineering. In addition, engineering practice demonstrates that rockburst typically occurs within 1–3 days after excavation (Chen et al., 2012; Hu et al., 2019a), indicating that the gradual concentration of tangential stress is one of the main factors leading to rockburst. Consequently, the process of continual concentration of tangential stress can be reproduced with vertical continuous loading. Figure 4 depicts the test method and loading-unloading path.
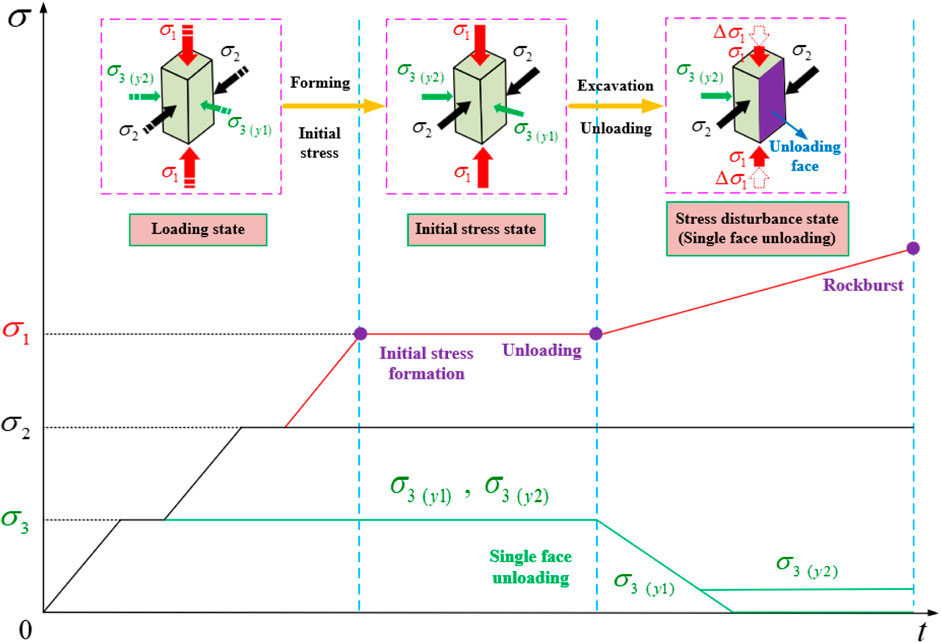
FIGURE 4. Sketch map of the test method and loading-unloading path of rockburst.
The specific testing procedures are described below: (I) the initial stress state of underground engineering rock mass before excavation is simulated according to the in situ stress field inversion of measured geostress in a project, and the initial stress state in three directions is σ1/σ2/σ3=74.58/54.96/39.51 MPa (Ge and Hou, 2011). To achieve the loading and unloading in the tests, the values of σ1, σ2, and σ3 under the initial ground stress condition in loading paths were set as 75, 55, and 40 MPa, respectively. First, the principal stresses σ1, σ2, and σ3 were loaded simultaneously to the predetermined values and then held for about 2–3 min. Second, the principal stresses σ1 and σ2 were loaded simultaneously to the predetermined values and then held for about 2–3 min. Finally, the principal stress σ1 was loaded to the predetermined values. After the initial stress state is applied, the specimen is stabilized for approximately 6–8 min under the triaxial stress state of σ1=75 MPa, σ2=55 MPa, and σ3=40 MPa. (II) A single-face fast unloading device (two springs) is used to unload the stress σ3(y1) to zero on one face in the Y-direction, while rapidly reducing the stress σ3(y2) to a predetermined value on the other face in the Y-direction. In order to simulate the radial stress reduction after excavation unloading in underground engineering and to realize the conversion process, the stress path and boundary conditions near the excavation boundary must be under the effect of tangential stress. The stress σ3(y2) on the opposite face of the unloading face and the stress σ2 in the X-direction are kept unchanged. Finally, the stress σ2 in the vertical stress σ1 is continuously increased at different loading rates until the specimen fails.
2.3.2 Testing plan
In this experiment, four different loading rates of 0.05, 1.0, 3.0, and 5.0 MPa/s were designed, with strain rates of 1.7×10⁻⁶, 3.4×10⁻⁵, 1.0×10⁻⁴, and 1.7×10⁻⁴ s−1 corresponding to the four different loading rates. The specific test procedures are detailed in Table 1. In our test, at least three specimens were prepared for each test with a given loading path to guarantee the repeatability of the experimental results. The typical failure process of each tested specimen was chosen to investigate the rockburst.
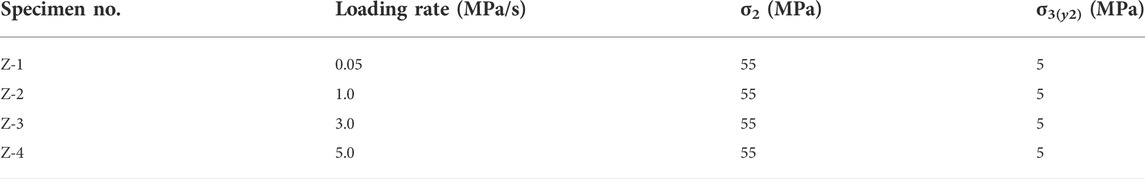
TABLE 1. Testing plan.
3 Failure and ejection characteristics of rockburst
The stress–strain curves, failure process, and failure modes of granite specimens with different loading rates are shown in Table 2.
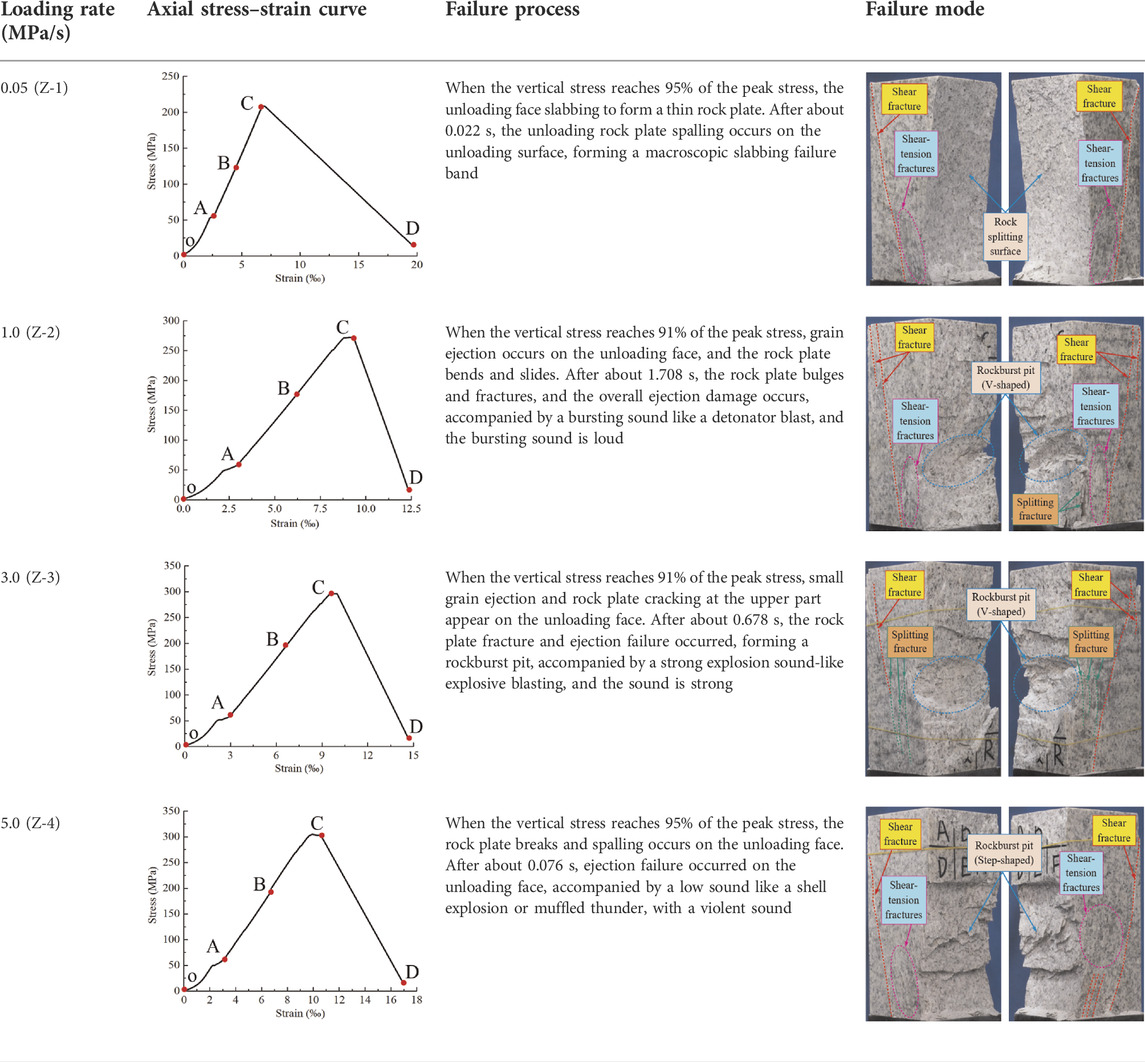
TABLE 2. Failure and ejection characteristics of the specimen with different loading rates.
From Table 2, it is clear that at a loading rate of 0.05 MPa/s, rock samples exhibited static brittle failure characterized by slabbing. At loading rates of 1.0, 3.0, and 5.0 MPa/s, all rock specimens experienced varying degrees of rockburst dynamic failure, with rock specimens (Z-4) experiencing the most severe ejection failure. This indicates that the loading rate is sufficient to cause the accumulation of a large amount of elastic strain energy within the rock specimen, part of which is converted into dissipation energy required for the splitting of the rock plate and the potential shearing of rockburst pit into fragments (pieces), while most of the elastic strain energy is converted into kinetic energy required for the fragment ejection, prompting the rock sample to rockburst.
3.1 Stress–strain curve
By comparing the rock sample (Z-1) with static brittle failure, the typical stress–strain curves of rock samples with ejection failure exhibit the following characteristics: 1) the failure process of rock samples under different loading rates consists of four stages: the initial compaction stage (OA), the elastic deformation stage (AB), the pre-peak unstable fracture stage (BC), and the post-peak failure stage (CD). 2) The pre-peak curve has an obvious yield point, and the stress–strain curve between the yield point and peak point changes more gently, corresponding to the splitting failure at the unloading face of the rock sample and shear failure in the range of potential rockburst pits.
3.2 Failure mode
The failure modes of rock samples under different loading rates are shown in Table 2. Z-1 rock samples exhibit a rock plate splitting phenomenon on the unloading face, a significant penetrating shear diagonal fracture on the inside of the rock body, and shear-tension fractures close to the unloading face, which are predominantly stable and slow slabbing failures. All Z-2∼Z-4 rock samples exhibit clear multiple zoning failure characteristics, that is, the unloading face displays a V-shaped or step-shaped rockburst pit and tension produced by the splitting fracture, and the rockburst pit surface is uneven.
3.3 Ejection process of rockburst
Due to space constraints, the ejection failure process of a Z-3 granite sample is selected as an example to compare with the static brittle failure of the Z-1 granite sample. Figure 5 displays the detailed comparison. The ejection failure process can be divided into four stages, including grain ejection, rock spalling into plates, rock shearing into fragments, and rock fragment ejection.
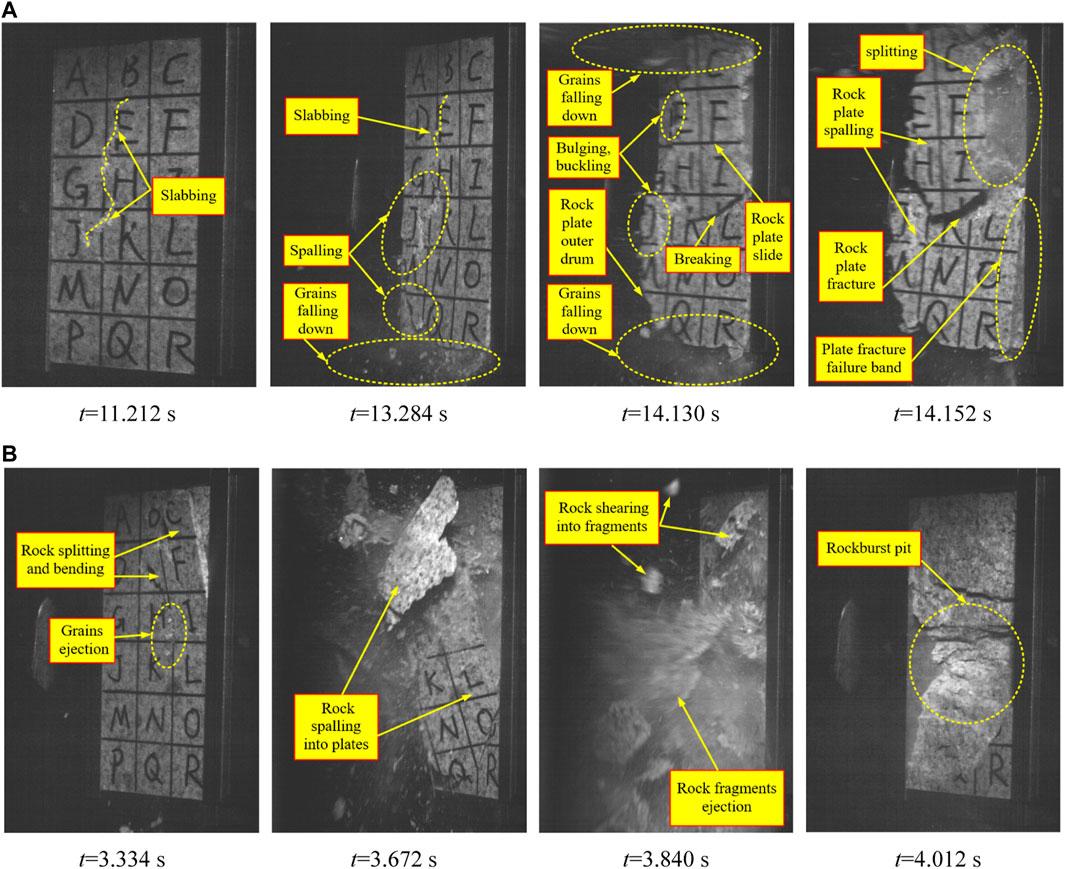
FIGURE 5. Failure process of typically tested specimens under different loading rates. (A) 0.05 MPa/s; (B) 3.0 MPa/s.
4 Fragment characteristics of rockburst
4.1 Particle size grouping and mass distribution characteristics of fragments
According to the rockburst fragment classification method (Su et al., 2016b), fragments were classified into four classes based on particle size: particulate (d < 0.075 mm), fine-grained (0.075 mm ≤ d < 4.75 mm), medium-grained (4.75 mm ≤ d < 9.5 mm), and coarse-grained (d ≥ 9.5 mm). Among them, fine-grained fragments containing six particle sizes (0.075–0.15 mm, 0.15–0.30 mm, 0.30–0.60 mm, 0.60–1.18 mm, 1.18–2.36 mm, and 2.36–4.75 mm). The masses of four grades were weighed by a high-sensitivity electronic scale. Figure 6 depicts photographs of fragment classification under different loading rates. Figure 7 illustrates the percentage distribution of rock fragments of each particle size class in the total mass of fragments under different loading rates.
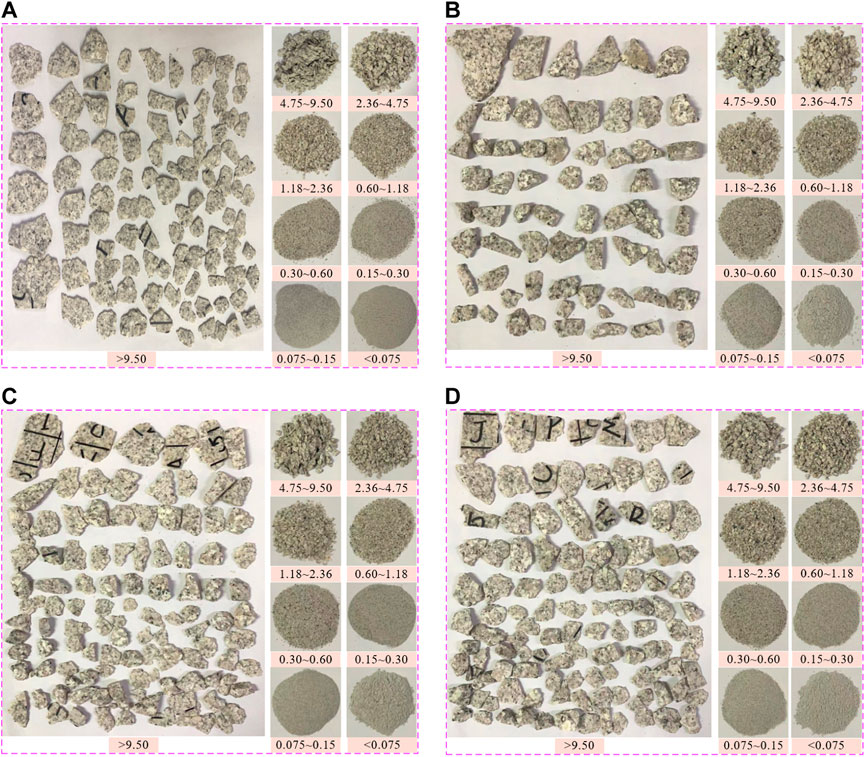
FIGURE 6. Fragment size distribution under different loading rates (unit: mm). (A) 0.05 MPa/s; (B) 1.0 MPa/s; (C) 3.0 MPa/s; (D) 5.0 MPa/s.
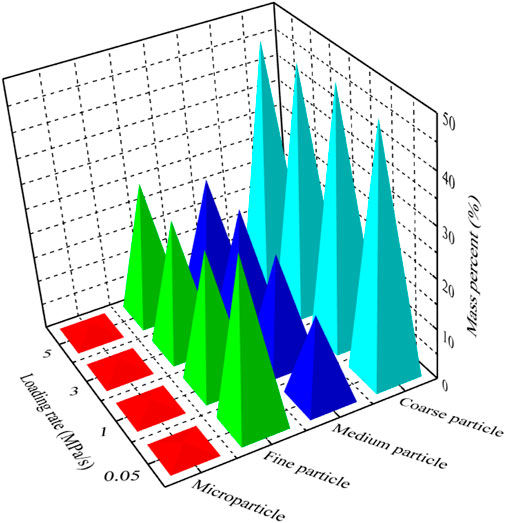
FIGURE 7. Fragment particle-size distribution under different loading rates.
Figure 7 illustrates that coarse-grained, medium-grained, and fine-grained fragments dominate the rockburst fragmentation mass. It demonstrates that as the loading rate increases, under the action of vertical stress σ1, the fractured rock plate caused by the tension stress in the vertical direction unloading face increases significantly, and the rock plate is ejected under the action of shear as well as tensile-shear load, producing larger grain size fragments.
4.2 Weibull distribution of particle size
The Weibull distribution function can be used to fit and statistically analyze the particle size distribution of rockburst fragments, and the Weibull distribution function relationship is given below (Li et al., 2021):
where k is the dimensional parameter; λ is the shape parameter; x is the maximum length value of the fragment particle group.
The size parameter k represents the average value of fragment size, and a smaller value of k indicates that the average fragment size is smaller, that is, the degree of fragmentation is more serious (Liu et al., 2022). Figure 8 depicts the Weibull distribution curve of rockburst fragments. The size parameter k obtained from the Weibull distribution curve is shown in Figure 9.
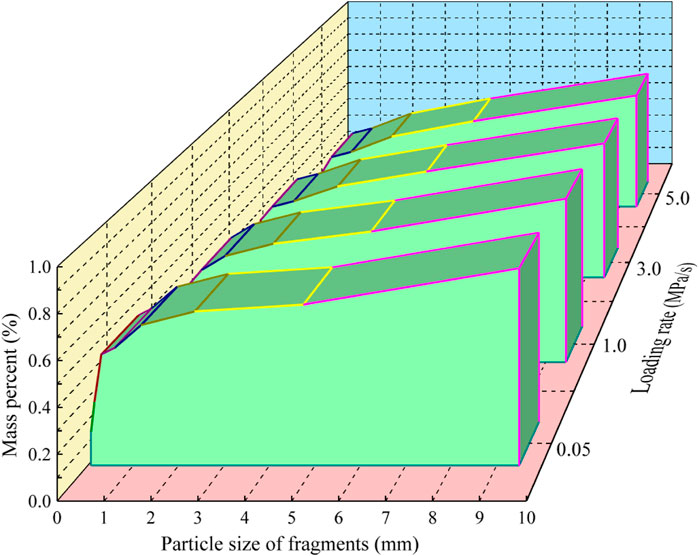
FIGURE 8. Weibull distribution curve of sample fragments.
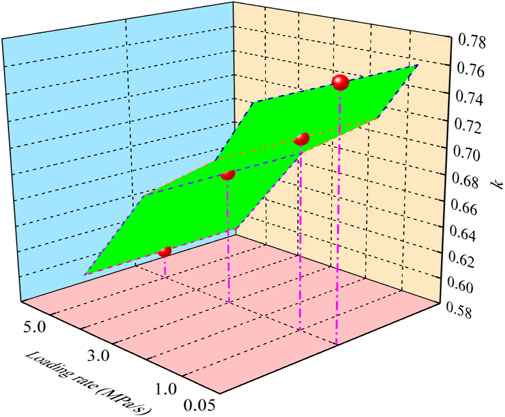
FIGURE 9. Size parameters of the Weibull distribution.
As shown in Figure 9, 1) the size parameter k decreases gradually with the increase in loading rate. It shows that the larger the loading rate within the selected range of tests, the smaller the average size of fragments after the occurrence of rockburst and the more severe the fragmentation of fragments, that is, the fragmentation degree of fragments increases with the increase in loading rate. 2) The use of the Weibull distribution function of rockburst test after the particle size distribution of fragmentation analysis, the quantitative comparison of fragmentation degree, can be used as a reference for quantifying the degree of rockburst serious index.
4.3 Fractal characteristics of fragments
Fractal theory can quantitatively describe various complex morphologies such as material fracture surfaces (Dlouhy and Strnadel, 2008). In particular, the fractal dimension reflects the complex morphologies that cannot be quantitatively expressed in the original Euclidean geometric space (Xie et al., 2004; Ping et al., 2015). Some researchers have utilized fractal methods to analyze the fragmentation degree of rockburst and the energy release characteristics of the failure process (Hu et al., 2002; Deng et al., 2007; Wang and Gao, 2007).
4.3.1 Granularity-quantity
For medium-grained and coarse-grained sizes, the measured length, width, and thickness values (l, w, and h, respectively) were converted into the equivalent side length of a square-by-rectangular shape Leq (where Leq = (l × w × h)1/3). For particulate and fine-grained sizes, particle sieving is performed, and the particle size is used as the equivalent side length value. The particle quantity is counted using the sampling statistics method. According to the granularity-quantity relationship equation (He et al., 2009), the fractal dimension of fractured pieces can be calculated as follows:
where N is the number of fragments with characteristic granularity equivalent to edge length ≥ Leq, N0 is the number of fragments with maximum characteristic scale Leq max, and D is the fractal dimension.
The lgN-lg (Leq max/Leq) fitting curve is plotted as shown in Figure 10. Among them, the slope of the straight-line segment of the fitted curve is the fractal dimension, and the specific values are shown in Table 3.
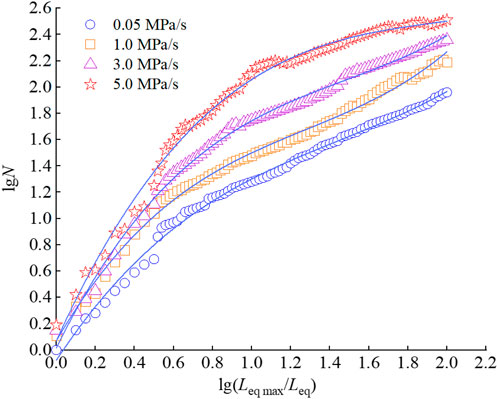
FIGURE 10. Relationship of granularity-quantity.
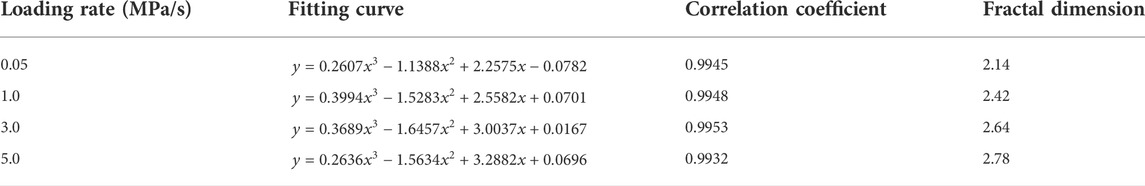
TABLE 3. Calculation of granularity-quantity fractal values.
4.3.2 Granularity-mass
The maximum length, width, and thickness values measured for coarse-grained fragments were converted to equivalent edge lengths, and the sieve grain size was utilized to determine equivalent edge lengths for medium-grained, fine-grained, and particulate fragments. The fragment granularity-equivalent edge length was utilized to calculate the fractional dimension D. The formula was calculated as follows (He et al., 2009):
where
The fitted curve of
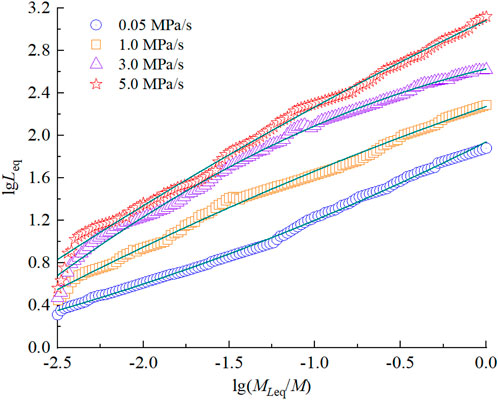
FIGURE 11. Relationship of granularity-mass.
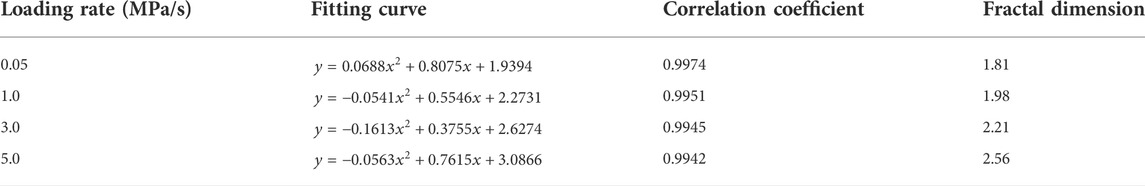
TABLE 4. Calculation of granularity-mass fractal values.
4.3.3 Length/width/thickness-quantity
First, the length, width, and thickness of rockburst fragments are measured (all are the maximum dimensions in that direction). Second, based on the measurement results, the fractal dimension calculations of length-cumulative quantity, width-cumulative quantity, and thickness-cumulative quantity were carried out according to the fractal dimension calculation method of equivalent edge length-cumulative quantity in granularity-quantity (He et al., 2009). Finally, the lgN-lg (1/s) fitting curve (where s is length/width/thickness) is plotted as shown in Figure 12. In this figure, the slope of the straight-line segment of the fitted curve is the fractal dimension, and the specific values are shown in Table 5.
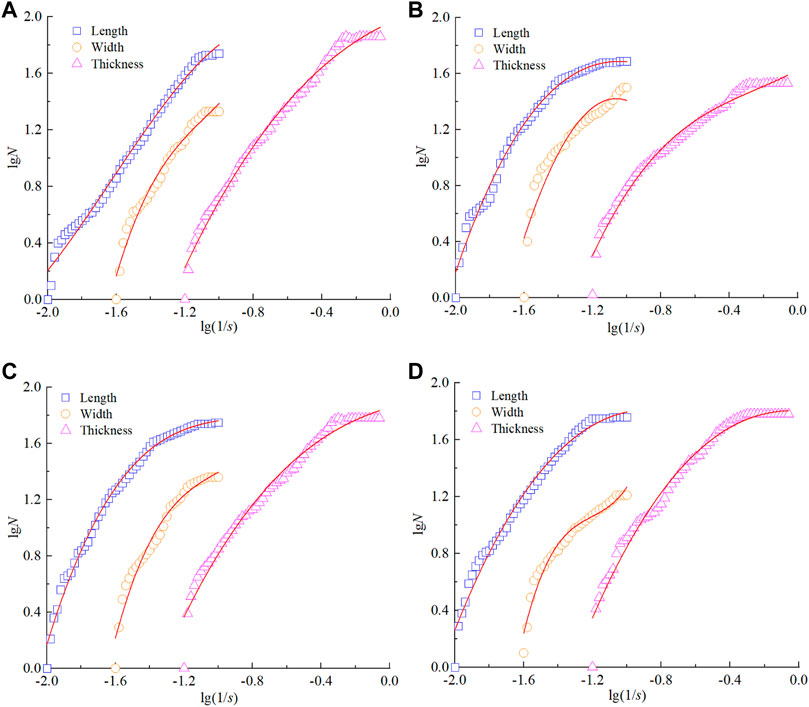
FIGURE 12. Fractal dimension of three sizes. (A) 0.05 MPa/s; (B) 1.0 MPa/s; (C) 3.0 MPa/s; (D) 5.0 MPa/s.
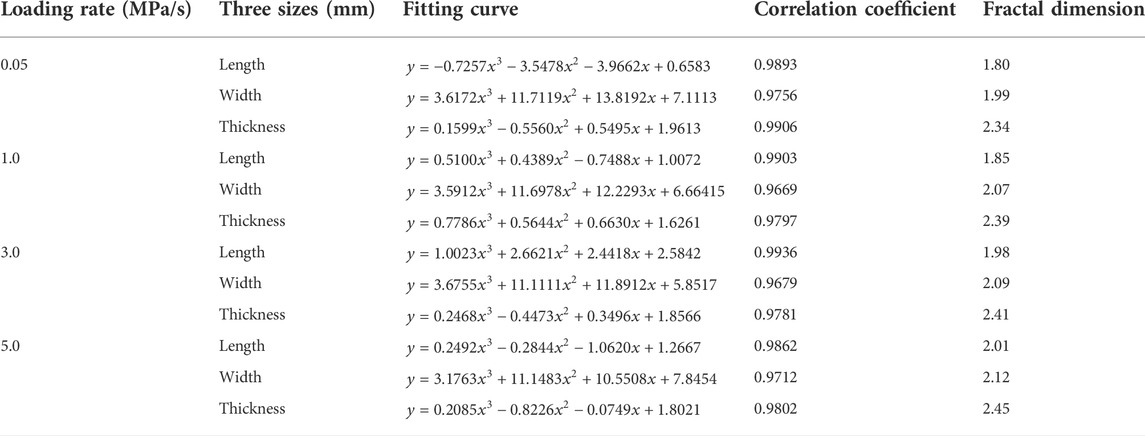
TABLE 5. Fractal dimension calculation of three sizes.
4.3.4 Fractal characteristic analysis of fragments
From Table 3 to Table 5, 1) the fractal dimension of fragments can reflect the failure degree of rock samples, that is, the larger the fractal dimension D, the more serious the fragments are broken. It shows that the failure degree of rock is positively correlated with fractal dimension. The correlation coefficients of fractal dimensions are all greater than 0.950, indicating that the accumulated number of fragments smaller than the equivalent edge length correlates strongly with the equivalent edge length. 2) Although there are evident discrepancies in the fractal dimensions derived by the three calculation methods, the fractal dimensions exhibit the same trend with different loading rates, that is, they rise as the loading rates increase. This indicates that the greater the loading rate, the less energy is consumed by the crack development and expansion of the rock sample, resulting in a greater amount of elastic strain energy that can be converted into kinetic energy of fragment ejection, which results in varying degrees of rockburst hazard for the rock sample. 3) As the loading rate increases, the crack expansion rate accelerates, intensifying the failure of the rock specimen, reducing its compressive strength, and causing greater fragmentation when the specimen fails. The previous results indicate that the fragmentation categorization method can also be utilized to evaluate the degree of rockburst failure on rock-containing structural surfaces.
5 Discussion
This article discusses the effect of loading rate on the energy dissipation of rockburst fragments in the context of research findings on the fractal characteristics of fragments. According to the energy dissipation estimation method (Su et al., 2016a), Figure 13 depicts the total energy dissipation curve of fragments under different loading rates, and Figure 14 depicts the energy dissipation ratio change curve of tension and shear failure under different loading rates.
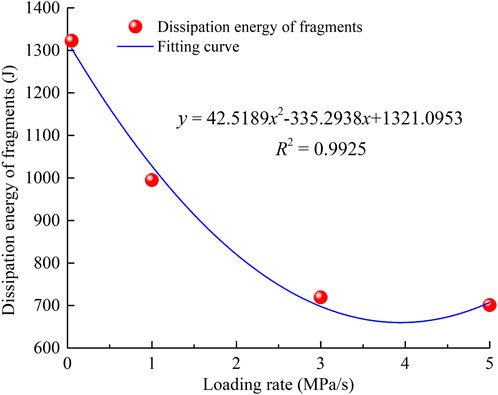
FIGURE 13. Curve of loading rates vs. dissipation energy of fragments.
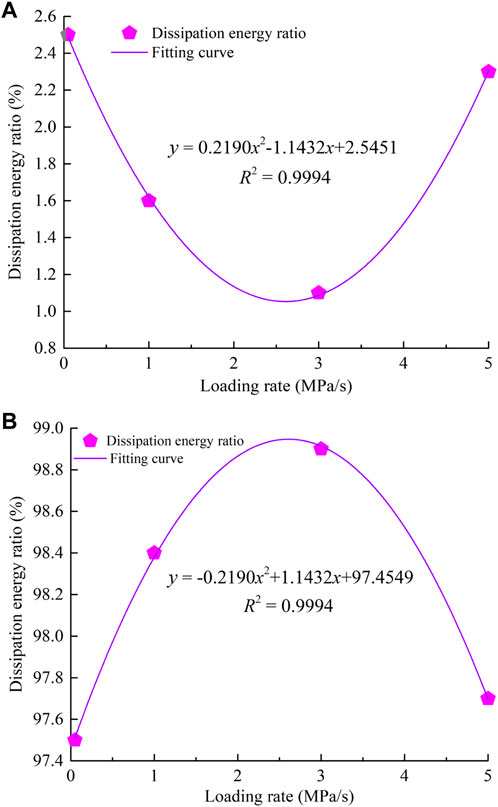
FIGURE 14. Change curves of the ratio of tension to shear dissipating energy vs. loading rate. (A) Tension dissipating energy; (B) shear dissipating energy.
From Figure 13, and 14, the greater the loading rate, the lower the energy dissipation of rockburst fragments. It demonstrates that when the loading rate increases, the fragmentation degree of fragments increases, energy dissipation decreases, and the rockburst becomes more serious. 2) When the loading rate is 0.05 MPa/s, 1.0 MPa/s, 3.0 MPa/s, and 5.0 MPa/s, the proportion of shear failure energy consumption of rock fragments to total energy consumption is 97.5, 98.4, 98.9, and 97.7%, respectively. It proves that the energy dissipation of fragments under different loading rates is dominated by shear energy dissipation. In addition, the proportion of tension energy consumption decreases and subsequently increases as the loading rate increases, while the proportion of shear energy consumption exhibits the opposite trend of tension energy consumption.
According to further analysis of the abovementioned results, the occurrence of rockbursts is essentially caused by unstable changes in the internal energy of rocks. In rock specimens in the loading stage (Figure 4), the loading system applied to the specimen energy is mainly converted into strain energy stored in the specimen and dissipation energy required for fracture closure or expansion. Once the specimen is unloaded, the majority of its stored energy is rapidly transformed into the kinetic energy required for the rapid ejection or throwing of fragments. The greater the loading rate, the specimen in the process of loading and unloading the internal crack development is less adequate. The higher the fragmentation degree, the smaller the corresponding energy dissipation, resulting in the degree of failure to the specimen rockburst will exhibit a stronger dynamic. This also shows that the macroscopic block characteristics of rockburst fragments can reflect the fragmentation degree of rock and that rockburst occurs in the energy input, storage, dissipation, and release are closely associated when a rockburst happens. In judging the level of rockburst failure, the fractal dimension of rockburst fragments can be used as a rockburst reference basis. A large number of engineering practices indicate that the faster the tunnel excavation speed, the greater the degree of failure when the rockburst occurs. Therefore, in the excavation process of underground engineering, the excavation speed can be appropriately reduced to reduce the vertical stress loading rate of the tunnel surrounding rock, so as to effectively avoid the occurrence of severe rockburst.
6 Conclusion
In this article, a complete and accurate reproduction of the entire process of rockburst inoculation-occurrence-development in the test room and a comparative analysis of fragmentation degree, fractal characteristics, and Weibull distribution characteristics of rockburst fragments under different loading rates are presented. The key findings are as follows:
1) The rockburst ejection failure process under different loading rates reveals that at a loading rate of 0.05 MPa/s, rock samples experienced static brittle failure of slabbing. At loading rates of 1.0, 3.0, and 5.0 MPa/s, rock samples experienced different degrees of rockburst disaster. The rockburst ejection failure process can be summarized as four stages: grain ejection, rock spalling into plates, rock shearing into fragments, and rock fragment ejection.
2) The particle size grouping and mass distribution characteristics of different fragments show that the quality of rockburst fragments is mainly coarse-grained, medium-grained, and fine-grained. With the increase in loading rate, under the action of vertical stress σ1, the splitting rock plate caused by tensile stress in the direction of the vertical unloading face increases obviously, and the rock plate is ejected under the action of shear and tensile-shear load, forming large particle-size fragments.
3) The statistical analysis results of the Weibull distribution of rockburst fragments under different loading rates show that the size parameter k represents the average value of fragment size; the smaller the value of k, the more serious the fragmentation degree. The size parameter k gradually decreases with an increasing loading rate. The fragmentation degree of rockburst fragments grows as the loading rate increases.
4) The fractal characteristics of rockburst fragments show that the fractal dimension with different loading rates shows a consistent trend, that is, the fractal dimension increases as the loading rate increases. As the loading rate increases, the rate of crack expansion increases, which exacerbates the damage to the rock specimen, reduces its compressive strength, and causes greater fragmentation when the specimen fails.
Data availability statement
The original contributions presented in the study are included in the article/Supplementary Material; further inquiries can be directed to the corresponding author.
Author contributions
Conceptualization, JG and XL; methodology, FS; data curation, FS; writing—original draft preparation, FS and JG; funding acquisition, JF, JG, and XL; formal analysis, FS; writing—review and editing, FS and JG. All authors have read and agreed to the published version of the manuscript.
Funding
This research was funded by the National Natural Science Foundation of China (52178388, U1810203) and the Natural Science Foundation of Henan Province (212300410146).
Conflict of interest
The authors declare that the research was conducted in the absence of any commercial or financial relationships that could be construed as a potential conflict of interest.
Publisher’s note
All claims expressed in this article are solely those of the authors and do not necessarily represent those of their affiliated organizations, or those of the publisher, the editors, and the reviewers. Any product that may be evaluated in this article, or claim that may be made by its manufacturer, is not guaranteed or endorsed by the publisher.
References
Chen, B. R., Feng, X. T., Ming, H. J., Zhou, H., Zeng, R. H., Feng, G. L., et al. (2012). Evolution law and mechanism of rockburtst in deep tunnel: Time delayed rockburst. Chin. J. Rock Mech. Eng. 31 (3), 561.
Chen, Z. Y., Su, G. S., Ju, J. W., and Jiang, J. Q. (2019). Experimental study on energy dissipation of fragments during rockburst. Bull. Eng. Geol. Environ. 78, 5369–5386. doi:10.1007/s10064-019-01463-9
Deng, T., Yang, L. D., and Han, W. F. (2007). Influence of loading form on distribution of marble fragments. J. Tongji Univ. Sci. 35 (1), 10.
Dlouhy, I., and Strnadel, B. (2008). The effect of crack propagation mechanism on the fractal dimension of fracture surfaces in steels. Eng. Fract. Mech. 75 (3), 726–738. doi:10.1016/j.engfracmech.2007.03.038
Fairhurst, C. E., and Hudson, J. A. (1999). Draft ISRM suggested method for the complete stress-strain curve for intact rock in uniaxial compression. Int. J. Rock Mech. Min. Sci. 36 (3), 279–289.
Ge, X. R., and Hou, M. X. (2011). A new 3D in-situ rock stresses measuring method: Borehole wall stress relief method (BWSRM) and development of geostress measuring instrument based on BWSRM and its primary applications to engineering. Chin. J. Rock Mech. Eng. 30 (11), 2161.
He, M. C., Wang, Y., Su, J. S., and Liu, D. Q. (2018). Analysis of fractal characteristics of fragment of sandstone impact rock burst under static and dynamic coupled loads. J. China Univ. Min. Technol. 47 (4), 699. doi:10.13247/j.cnki.jcumt.000876
He, M. C., Yang, G. X., Miao, J. L., Jia, X. N., and Jiang, T. T. (2009). Classification and research methods of rockburst experimental fragment. Chin. J. Rock Mech. Eng. 28 (8), 1521.
Hedley, D. G. F. (1992). Rockburst handbook for Ontario hardrock mines. Toronto: Toronto Public Library.
Hu, L. Q., Li, X. B., and Zhao, F. J. (2002). Study on energy consumption in fracture and damage of rock induced by impact loadings. Chin. J. Rock Mech. Eng. 21 (S2), 2304.
Hu, X. C., Su, G. S., Chen, G. Y., Mei, S. M., Feng, X. T., Mei, G. X., et al. (2019a). Experiment on rockburst process of borehole and its acoustic emission characteristics. Rock Mech. Rock Eng. 52, 783–802. doi:10.1007/s00603-018-1613-z
Hu, X. C., Su, G. S., Chen, K., Li, T. B., and Jiang, Q. (2019b). Strainburst characteristics under bolt support conditions: An experimental study. Nat. Hazards (Dordr). 97, 913–933. doi:10.1007/s11069-019-03682-5
Jiang, J. Q., Su, G. S., Liu, Y. X., Zhao, G. F., and Yan, X. Y. (2020b). Effect of the propagation direction of the weak dynamic disturbance on rock failure: An experimental study. Bull. Eng. Geol. Environ. 80, 1507–1521. doi:10.1007/s10064-020-01960-2
Jiang, J. Q., Su, G. S., Zhang, X. H., and Feng, X. T. (2020a). Effect of initial damage on remotely triggered rockburst in granite: An experimental study. Bull. Eng. Geol. Environ. 79 (6), 3175–3194. doi:10.1007/s10064-020-01760-8
Khan, N. M., Ahmad, M., Cao, K. W., Ali, L., Liu, W., Rehman, H., et al. (2022). Developing a new bursting liability index based on energy evolution for coal under different loading rates. Sustainability 14 (3), 1572. doi:10.3390/su14031572
Li, D. J., Jia, X. N., Miao, J. L., He, M. C., and Li, D. D. (2010). Analysis of fractal characteristics of fragment from rockburst test of granite. Chin. J. Rock Mech. Eng. 29 (S1), 3280.
Li, D. J., Zhao, F., and Zheng, M. J. (2014). Fractal characteristics of cracks and fragments generated in unloading rockburst tests. Int. J. Min. Sci. Technol. 24 (6), 819–823. doi:10.1016/j.ijmst.2014.10.014
Li, X., Yao, W., and Wang, C. L. (2021). The influence of multiple dynamic loading on fragmentation characteristics in dynamic compression tests. Rock Mech. Rock Eng. 54 (3), 1583–1596. doi:10.1007/s00603-020-02324-8
Liu, D. Q., Han, Z. J., Wang, C. G., and Hu, T. X. (2021). Experimental study on fragment characteristics of rockburst induced by uni-directional, bi-directional and tri-directional disturbances. J. Central South Univ. Sci. Technol. 52 (8), 2793. doi:10.11817/j.issn.1672-7207.2021.08.025
Liu, D. Q., Hu, T. X., Wang, Y., Ling, K., Han, Z. J., and He, M. C. (2022). Experimental study on the effect of dynamic load frequency for impact rockburst of sandstone. Chin. J. Rock Mech. Eng 41 (7), 1310–1324. doi:10.13722/j.cnki.jrme.2021.0951
Liu, D. Q., Li, D. J., Zhao, F., and Wang, C. C. (2014). Fragmentation characteristics analysis of sandstone fragments based on impact rockburst test. J. Rock Mech. Geotechnical Eng. 6 (3), 251–256. doi:10.1016/j.jrmge.2014.04.001
Lu, J., Zhang, D. M., Huang, G., Li, X., Gao, H., and Yin, G. Z. (2020). Effects of loading rate on the compound dynamic disaster in deep underground coal mine under true triaxial stress. Int. J. Rock Mech. Min. Sci. 134, 104453. doi:10.1016/j.ijrmms.2020.104453
Ping, Q., Luo, X., Ma, Q. Y., and Yuan, P. (2015). Broken energy dissipation characteristics of sandstone specimens under impact loads. Chin. J. Rock Mech. Eng. 34 (S2), 4197. doi:10.13722/j.cnki.jrme.2015.0585
Si, X. F., Huang, L. Q., Gong, F. Q., Liu, X. L., and Li, X. B. (2020). Experimental investigation on influence of loading rate on rockburst in deep circular tunnel under true-triaxial stress condition. J. Cent. South Univ. 27, 2914–2929. doi:10.1007/s11771-020-4518-4
Su, G. S., Chen, Z. Y., Jiang, J. Q., Mo, J. H., and Shi, Y. J. (2016a). Experimental study on energy dissipating characteristics of rockburst fragments under different loading rates. Chin. J. Geotechnical Eng. 38 (8), 1481. doi:10.11779/CJGE201608016
Su, G. S., Chen, Z. Y., Yin, H. X., Zhang, X. H., and Mo, J. H. (2016b). True triaxial tests on rockburst of granite after high temperatures. Chin. J. Geotechnical Eng. 38 (9), 1586. doi:10.11779/CJGE201609005
Su, G. S., Jiang, J. Q., Feng, X. T., Jiang, Q., Chen, Z. Y., and Mo, J. H. (2018). Influence of loading rate on strainburst: An experimental study. Bull. Eng. Geol. Environ. 78, 3559–3573. doi:10.1007/s10064-018-1351-1
Wang, L., and Gao, Q. (2007). Fragmentation distribution prediction of rock based on damage energy dissipation. Chin. J. Rock Mech. Eng. 26 (6), 1202.
Xia, Y. Y., Lin, M. Q., Liao, L. L., Xiong, W., and Wang, Z. D. (2014). Fractal characteristic analysis of fragments from rockburst tests of large-diameter specimens. Chin. J. Rock Mech. Eng. 33 (7), 1358. doi:10.13722/j.cnki.jrme.2014.07.007
Xie, H. P., and Pariseau, W. G. (1993). Fractal character and mechanism of rock bursts. Chin. J. Rock Mech. Eng. 12 (1), 28.
Keywords: rockburst, true triaxial test, loading rate, rockburst fragments, fractal dimension
Citation: Sun F, Guo J, Fan J and Liu X (2022) Experimental study on rockburst fragment characteristic of granite under different loading rates in true triaxial condition. Front. Earth Sci. 10:995143. doi: 10.3389/feart.2022.995143
Received: 15 July 2022; Accepted: 22 August 2022;
Published: 14 September 2022.
Edited by:
Lianchong Li, Northeastern University, ChinaCopyright © 2022 Sun, Guo, Fan and Liu. This is an open-access article distributed under the terms of the Creative Commons Attribution License (CC BY). The use, distribution or reproduction in other forums is permitted, provided the original author(s) and the copyright owner(s) are credited and that the original publication in this journal is cited, in accordance with accepted academic practice. No use, distribution or reproduction is permitted which does not comply with these terms.
*Correspondence: Jiaqi Guo, Z2pxNTE5QDE2My5jb20=