 Jonas Kuhn1,2*
 Nicole Bobrowski1,3
 Guillaume Boudoire4,5
 Sergio Calabrese5,6Giovanni Giuffrida3
 Marco Liuzzo5Katcho Karume7
 Dario Tedesco8,9Thomas Wagner2
 Ulrich Platt1,2
- 1Institut für Umweltphysik, Universität Heidelberg, Heidelberg, Germany
- 2Max Planck Institut für Chemie, Mainz, Germany
- 3Instituto Nazionale di Geofisica e Vulcanologia—Osservatorio Etneo, Catania, Italy
- 4Laboratoire Magmas et Volcans, OPGC, CNRS, IRD, UCA, Aubière, France
- 5Instituto Nazionale di Geofisica e Vulcanologia, Palermo, Italy
- 6DiSTeM, Università Degli Studi di Palermo, Palermo, Italy
- 7Observatoire Volcanologique de Goma, Goma, Democratic Republic of Congo
- 8DISTABIF, Università Degli Studi Della Campania Luigi Vanvitelli, Caserta, Italy
- 9Instituto Nazionale di Geofisica e Vulcanologia—Osservatorio Vesuviano, Napoli, Italy
Remote sensing (RS) of volcanic gases has become a central tool for studying volcanic activity. For instance, ultraviolet (UV) skylight spectroscopy with grating spectrographs (GS) enables SO2 (and, under favourable conditions, BrO) quantification in volcanic plumes from autonomous platforms at safe distances. These measurements can serve volcanic monitoring and they cover all stages of volcanic activity in long measurement time series, which substantially contributes to the refinement of theories on volcanic degassing. Infrared (IR) remote sensing techniques are able to measure further volcanic gases (e.g., HF, HCl, CO2, CO). However, the employed Fourier transform spectrometers (FTSs) are intrinsically intricate and, due to limited resolving power or light throughput, mostly rely on either lamps, direct sun, or hot lava as light source, usually limiting measurements to individual field campaigns. We show that many limitations of grating spectrographs and Fourier transform spectrometer measurements can be overcome by Fabry-Perot interferometer (FPI) based spectrograph implementations. Compared to grating spectrographs and Fourier transform spectrometers, Fabry-Perot interferometer spectrographs reach a 1-3 orders of magnitude higher spectral resolution and superior light throughput with compact and stable set-ups. This leads to 1) enhanced sensitivity and selectivity of the spectral trace gas detection, 2) enables the measurement of so far undetected volcanic plume constituents [e.g., hydroxyl (OH) or sulfanyl (SH)], and 3) extends the range of gases that can be measured continuously using the sky as light source. Here, we present measurements with a shoe-box-size Fabry-Perot interferometer spectrograph (resolving power of ca. 150000), performed in the crater of Nyiragongo volcano. By analysing the light of a ultraviolet light emitting diode that is sent through the hot gas emission of an active lava flow, we reach an OH detection limit of about 20 ppb, which is orders of magnitude lower than the mixing ratios predicted by high-temperature chemical models. Furthermore, we introduce example calculations that demonstrate the feasibility of skylight-based remote sensing of HF and HCl in the short-wave infrared with Fabry-Perot interferometer spectrographs, which opens the path to continuous monitoring and data acquisition during all stages of volcanic activity. This is only one among many further potential applications of remote sensing of volcanic gases with high spectral resolution.
1 Introduction
Volcanic gas geochemistry and studies of the chemical evolution of volcanic plumes have made significant progress in the recent decades, essentially driven by developments in remote sensing (RS) techniques (see, e.g., Platt et al., 2018). However, many studies still rely on few and infrequent observations, which in most cases only poorly constrain degassing models. Present RS techniques remain fundamentally limited by either intricate instrumentation with poor field-applicability or by low spectral resolution.
Several recent RS approaches rely on reduced spectral resolution in order to increase the spatial and/or temporal resolution of passive remote sensing instruments (see e.g., Mori and Burton, 2006; Prata and Bernardo, 2014; Platt et al., 2015; Varon et al., 2021). In principle, this approach mostly represents a matching of the observing geometry of the RS measurement to the temporal and spatial scales of the observed process. Under particular atmospheric conditions enhanced spatio-temporal resolution improves measurements of trace gas fluxes of localized sources (e.g., volcanoes). However, these techniques remain limited to (in most cases extraordinarily) high trace gas fluxes. While the approach has led to substantial achievements, cross interference (with e.g., aerosol extinction or gases absorbing in the same spectral region) eventually preclude the quantification of lower fluxes, weaker absorbers or spectrally overlapping absorption of several gases with similar strength. For this reason, we will not further discuss low-spectral-resolution (i.e., resolving power
Fundamental light throughput advantages of Fabry-Pérot interferometers (FPIs, see Jacquinot, 1954; Jacquinot, 1960) can, on the one hand, be used to increase the spatio-temporal resolution of volcanic gas RS measurements without reducing the spectral resolution1 (e.g.,Kuhn et al., 2014; Kuhn et al., 2019; Fuchs et al., 2021). On the other hand, FPIs enable the implementation of compact high resolution spectrographs with high light throughput (Kuhn et al., 2021). Here, we advocate the use of high resolution FPI spectrographs by demonstrating that they enable novel and improved volcanic gas measurements to fill substantial gaps in field observations. We frequently refer to the work of Kuhn et al. (2021), which describes the technique in more detail.
Spectroscopic RS measurements of volcanic plume gases in the atmosphere are routinely performed for SO2 in the ultraviolet (UV) and, for higher SO2 amounts, also in the thermal infrared (IR) spectral range. Autonomous ground- and satellite-based measurements provide global, long-term, and close-to-real-time data, also during eruptive periods (e.g., Prata and Bernardo, 2007; Galle et al., 2010; Carn et al., 2017; Warnach et al., 2019). So far, except for some studies on bromine monoxide (BrO, e.g., Hörmann et al., 2013; Lübcke et al., 2014), SO2 remains the only species to be measured with such high spatio-temporal resolution. Contemporary RS techniques of other species, such as IR absorption and emission spectroscopy of e.g., HF, HCl, CO2, CO, or SiF4 (Mori et al., 1993; Francis et al., 1998; Sawyer et al., 2008; Notsu and Mori, 2010; Taquet et al., 2017) rely on instrumentation, which is less suited for autonomous operation in volcanic environments (see below). Therefore, similarly to DOAS measurements of water vapour, which require an extremely dry background atmosphere (see Kern et al., 2017), the available data on these gases is almost exclusively based on occasional field campaigns at specific volcanoes.
The resolving power of state-of-the-art volcanic trace gas RS measurements ranges between about 103 for measurements in the UV, visible and towards the thermal IR spectral range and about 104 for measurements in the short-wave IR (SWIR, at around 1–2 μm). The width of an individual absorption line of a molecule is however on the order of
In the UV-visible spectral range dense vibrational bands—consisting of many individual rotational transitions—cause characteristic absorption structures detectable with lower spectral resolution (
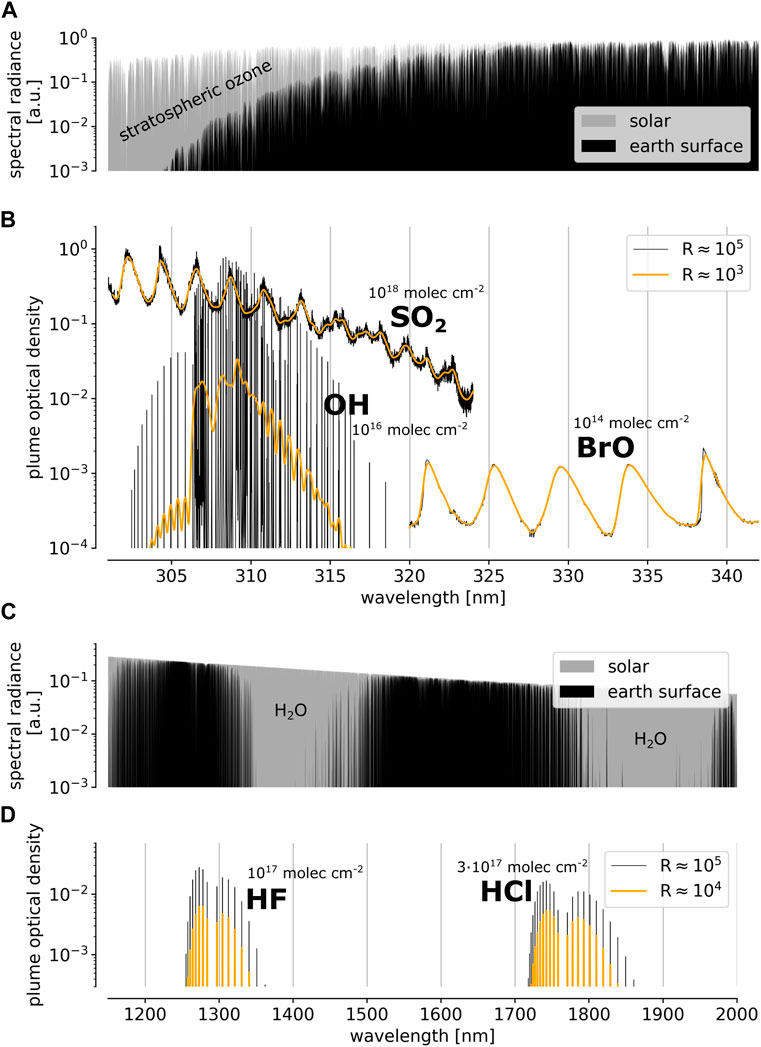
FIGURE 1. (A,C) show the spectral solar radiance arriving at the top of Earth’s atmosphere (gray) and at Earth’s surface (black) in the near UV and the SWIR spectral range. The corresponding panels (B,D) show, for the respective spectral ranges, the contributions of individual gases to the optical density of a typical volcanic plume (OH is only expected in the early and hot part). The black lines show the spectral absorption as observed with a resolving power R of 105 (BrO data is only available with R
In the IR, a resolving power of up to R ≈ 104 is commonly used to identify the ro-vibrational bands of absorbing molecules, such as HF, HCl or CO2 in the SWIR (e.g., Butz et al., 2017) or HF, HCl, CO, OCS, SO2 or CO2 at longer wavelengths (e.g., Sawyer et al., 2008; Notsu and Mori, 2010). Because the IR background atmosphere is optically thick across large ranges of the spectrum (see e.g., Figure 1C), the spectrum is much more variable when for instance changing the measurement’s viewing geometry. The evaluation of such data relies on a precise knowledge of the atmospheric state along the entire measurement light path (with increasing importance of temperature towards longer IR wavelength), particularly when the absorption lines are not well-resolved (i.e., R ≪ 105). The commonly employed Fourier transform spectroscopy (FTS) technique is usually based on Michelson interferometers, which are inherently complicated and delicate instruments with moving parts. Although much progress has been made in FTS instrument design, it is unlikely that these instruments will reach the simplicity and stability of stationary spectrographs without moving parts (e.g., GSs). The interferograms are recorded in a time sequence while mechanically tuning the interferometer. This introduces a sensitivity to intensity fluctuations, which can be limiting for the measurements (see e.g., Notholt et al., 1997). Consequently, FTS measurements are basically restricted to solar occultation measurements at clear sky conditions or to using lamps or lava thermal emission as a light source. Recent photo-detector technology enables the implementation of GSs (which are largely insensitive to intensity fluctuations) in the SWIR spectral range (e.g., Crisp et al., 2017). However, GSs with high resolving power (R
FPIs can yield a much higher light throughput than GSs even for high resolving powers (around 105) and allow the implementation of compact spectrograph set-ups without moving parts (Fabry and Buisson, 1908; Jacquinot, 1954; Kuhn et al., 2021). With that advantage they overcome fundamental limitations of present-day volcanic gas RS techniques in both, the UV and IR spectral range. Kuhn et al. (2021) describe and examine possible implementations of high-resolution FPI spectrographs. They find that, depending on the spectrograph implementation and size of the FPI clear aperture (limited by the manufacturing process), FPI spectrographs—based on recent FPI manufacturing technology—can yield a
Higher spectral resolution of RS observations generally leads to a more selective measurement, i.e., a better identification of the target gas. More details of the spectral absorption signal of a target gas are resolved and allow an accurate separation of overlapping absorption bands of different molecule species, drastically reducing interference by other gases. Moreover, in most cases, higher resolution increases the sensitivity of a measurement since the amplitude of the effective differential absorption cross sections is considerably enhanced, when observed with higher resolving power (see Figures 1B, D). Thus, for a given light throughput, higher spectral resolution lowers the detection limits of the respective gases, also enabling the detection of gas species that could not be measured so far.
Furthermore, the light throughput advantage of FPI spectrographs over GSs can extend the range of skylight-based RS applications at volcanoes towards the IR. By that, the number of plume constituents quantified continuously by autonomous RS measurements (e.g., from ground-based stations or from satellites; so far only SO2 and larger BrO amounts) can be increased.
This article consists of two independent parts that demonstrate the feasibility and the benefits of the use of FPI spectrographs for volcanic gas RS: In Section 2 we present a shoe-box-sized FPI spectrograph prototype reaching a resolving power of R ≈ 150,000 in the UV. Measurements above a lava flow at Nyiragongo volcano (Democratic Republic of Congo) reach a ppb-level detection limit for OH, which is sufficient to detect the high amounts of OH (ppm range) reported in model studies of high-temperature volcanic gas emissions (e.g., Gerlach, 2004). Moreover, the study proves the excellent mobility and stability of high-resolution FPI spectrographs under harsh conditions and introduces evaluation approaches of the obtained high resolution spectra. In Section 3 we present calculations on the feasibility of HF and HCl RS using skylight at around 1,278 and 1,742 nm and show that FPI spectrographs allow DOAS-type measurements of these gases in volcanic plumes.
2 Experimental proof-of-concept—Active remote sensing of OH radicals in hot volcanic gases
OH radicals are known for their high reactivity (Willbourn and Hinshelwood, 1946) and for driving central processes in atmospheric chemistry, such as the removal of pollutants and greenhouse gases from the atmosphere (e.g., Levy, 1971; Crutzen, 1974). While tropospheric OH levels are in the sub-ppt-range, simulations of the high-temperature emission of magmatic gases into the atmosphere find ppm-levels of OH within the hot and early plume (e.g., Gerlach, 2004; Roberts et al., 2019). Such high amounts of OH are very likely to substantially influence the magmatic gas composition, particularly the redox state it represents, within split-seconds after their emission (Kuhn, 2022; Kuhn et al., 2022), taking into question the results based on common thermodynamic equilibrium assumptions prevailing in volcanic gas geochemistry (see, e.g., Symonds et al., 1994; Moussallam et al., 2019). The development of kinetic emission models paired with measurements of volcanic OH (and other short-lived radicals) is crucial for understanding the chemical evolution of volcanic gas plumes in the atmosphere.
OH absorbs in the UV spectral range at around 309 nm. The absorption spectrum consists of discrete ro-vibronic lines (Figure 1B). Their selective detection requires high spectral resolution (around 2 pm), formerly only provided by bulky and intricate laser- and GS-systems (Stone et al., 2012). Section 2.1 and Section 2.2 describe a compact FPI-based prototype set-up capable of quantifying volcanic OH.
OH is only expected in gas emissions with high temperature (e.g., Roberts et al., 2019; Kuhn, 2022; Kuhn et al., 2022). Nyiragongo - and the neighboring Nyamulagira—volcano are located in the Western Branch of the East African Rift in the Democratic Republic of Congo. Nyiragongo is known for its lava lake, which, in the recent decades, often was among the largest on the planet. It is characterized by strong dynamics and frequent changes in activity (e.g., Le Guern, 1987; Bobrowski et al., 2017; Valade et al., 2018), which can lead to disastrous eruptive events (e.g., Tedesco et al., 2007; Smittarello et al., 2022). On the other hand, these dynamic changes can lead to periods (e.g., on the order of months to years), in which the lava lake and active lava flows are relatively easily accessible (e.g., Pouclet and Bram, 2021). These are rare opportunities for sampling the hot gas emissions of lava lakes (e.g., Le Guern, 1987) and to examine the still poorly understood high-temperature interface between magma and the atmosphere, which is likely to significantly influence all open-vent volcanic gas emissions (Kuhn et al., 2022). Section 2.3 describes measurements with the introduced prototype performed at an active lava flow within the crater of Nyiragongo volcano in February 2020.
2.1 Instrumentation
The set-up has been designed and manufactured at the Institute of Environmental Physics in Heidelberg. Figure 2 illustrates the instrument set-up and outlines the principle of the FPI spectrograph. The mobility of the set-up able to perform spectroscopic measurements with R ≈ 150,000 is unprecedented in volcanic and atmospheric RS. Open-path optics, light source, spectrograph, laptop, batteries and casing sum up to about 20 kg and can be carried by one person in a backpack. The total power consumption mainly depends on sensor cooling and is generally well below 20 W, which means a light-weight battery can provide sufficient power for several hours of continuous operation.
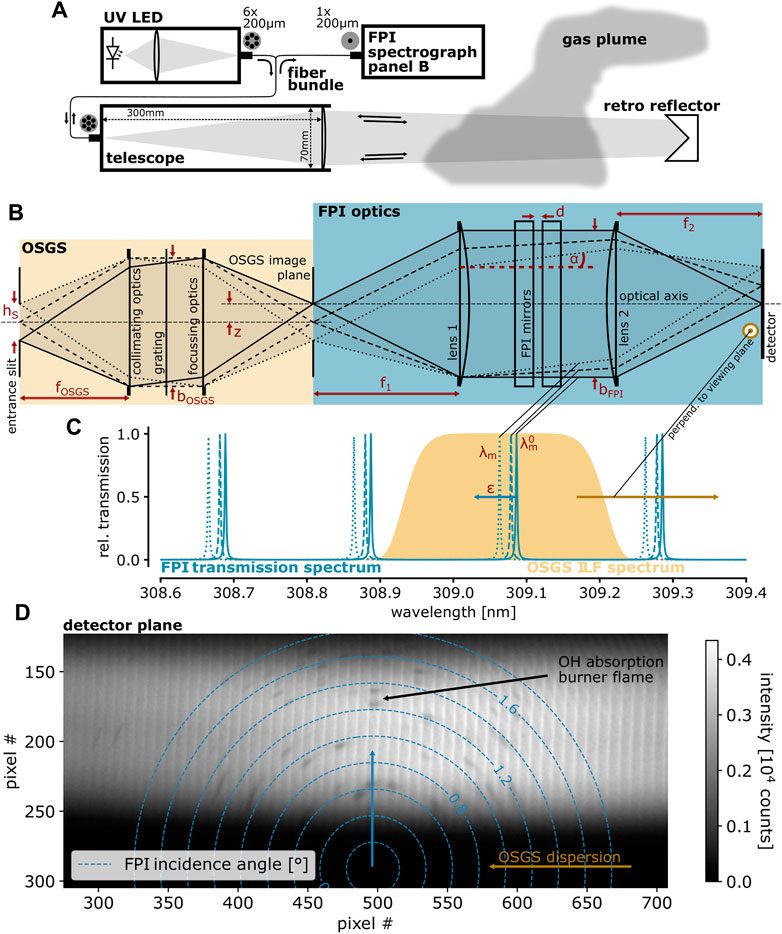
FIGURE 2. (A) Open-path set-up as used for the measurement at Nyiragongo: The light of a UV LED is coupled into 6 “transmitting” optical fibres, collimated by the telescope, sent across the volcanic plume, reflected back by a retro reflector, coupled into a single “receiving”fiber by the same telescope, finally reaching the FPI spectrograph. (B) Optical schematic of the FPI spectrograph with grating OSM: The entrance slit of the OSGS is imaged onto the FPI spectrographs detector. The superposition of linear grating dispersion and radially symmetric FPI transmission is indicated in (C), illustrating how the FPI’s (blue) and the GS’s (brown) spectral transmission change across the detector. (D) Spectrum of a UV LED after traversing a burner flame. Absorption lines of OH are visible, aligned along the indicated lines of equal FPI incidence angle. Parts of this figure are adapted from Kuhn et al. (2021).
2.1.1 Compact open-path optical setup
The compact open-path setup (see Figures 2A, 3C, E) consists of a UV light emitting diode (LED, 305 nm centre wavelength, ca. 10 nm full width at half maximum) within a box (10 cm × 10 cm × 5 cm). The light is coupled into 6 “transmitting” quartz fibers and, after being collimated by a telescope (71 mm clear aperture, 300 mm focal length), is sent across the gas volume to be sampled. A retro reflector reverses the light path and, after traversing the gas volume for a second time, feeds the light back into the telescope, where it is coupled into a single “receiving” quartz fiber leading to the entrance slit of the FPI spectrograph (see, e.g., Merten et al., 2011, for details).
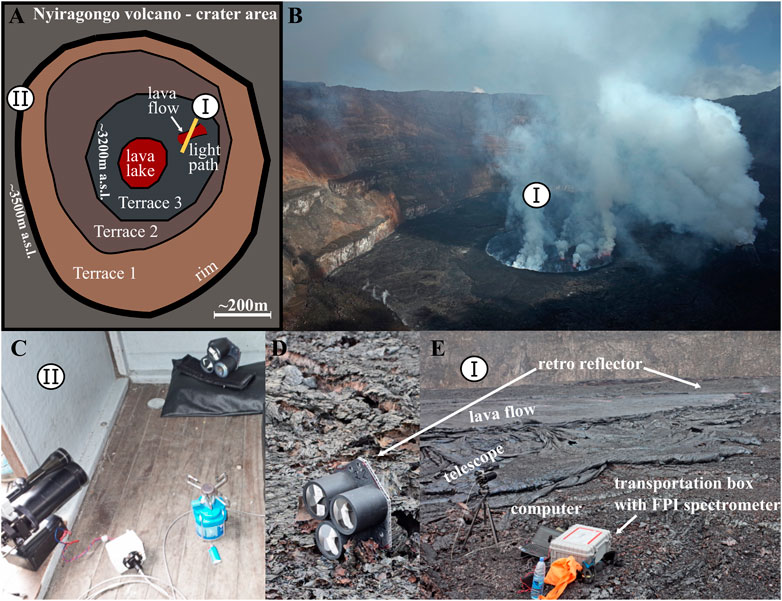
FIGURE 3. (A) Sketch of the crater area of Nyiragongo volcano (February 2020) with measurement sites I and II. (B) Photograph of the crater area. (C) The setup of the camping stove calibration measurement in a shelter at the crater rim (site II). (D) Retro reflector for the measurement at the active lava flow within the crater [(E), site I]. Parts of this figure are adapted from Kuhn et al. (2022).
2.1.2 FPI spectrograph prototype
The concept and implementation of FPI spectrographs are described in detail in Kuhn et al. (2021). Figures 2B–D illustrate the functioning principle of the prototype (ca. 8 L volume and 5 kg weight) used in this study.
The employed FPI etalon (custom-built by SLS Optics Ltd.) has a free spectral range (spectral separation of transmission orders) of ca. 0.2 nm at 300 nm. Its finesse (ratio between free spectral range and full width at half maximum of a transmission peak) is about 95 across a clear aperture of 5 mm (Figure 2C). The individual FPI transmission orders are separated by the superimposed dispersion of a grating (grating order sorting mechanism, OSM, see also Kuhn et al., 2021). First, the light enters the slit of a commercial miniature GS, serving as order sorting GS (OSGS, F-number: 3.9, focal length: 75 mm, slit width: 50 μm, linear dispersion: 5.34 nm mm−1, R ≈ 1,100). By using a second imaging optics in series, the spectrum of the OSGS (intermediate image) is re-imaged onto a focal plane imaging detector (UV-enhanced charge coupled device, CCD, ca. 60% quantum efficiency at 310 nm, 1,024 × 1,024 pixels of 13.3 μm pitch). Within the second imaging optics the FPI is placed in a collimated beam (Figure 2B). The slightly different incidence angles of the light of the collimated beam onto the FPI are then separated in the focal plane in concentric rings of equal spectral FPI transmission. The GS dispersion separates the individual FPI transmission orders (similar to the descriptions by e.g., Fabry and Buisson, 1908; Vaughan, 1989).
Figure 2D shows the spectrum of the UV LED with the absorption lines of OH (dark spots) from a burner flame inside the light path. The OSGS dispersion is aligned along the horizontal detector dimension. For this prototype, the individual FPI transmission orders slightly overlap and cause close-to-vertical stripes of high intensity between the orders. As mentioned above, each order corresponds to ca. 0.2 nm. The radial symmetry of equal FPI transmission is indicated by the shape of the OH absorption lines on the detector plane. As the properties and behavior of the optical components are known, the spectra can be analysed and evaluated using an instrument model (as described in Section 2.2 below).
2.1.3 Processing of the spectra
Prior to their evaluation, the spectra recorded with the FPI spectrograph prototype are corrected for the CCD detector’s dark signal and sensitivity characteristics. The dark signal is approximated by a dark spectrum recorded with unchanged detector settings in temporal proximity to the measurement to be corrected. In this study, the dark spectrum was recorded with the light source turned off in the otherwise unchanged optical setup. Moreover, a flat field image recorded in the laboratory corrects the sensitivity differences of the individual detector pixels. In order to reduce photon shot noise, sequentially recorded spectra are co-added after their individual correction.
2.2 Instrument model
Here we describe a model that allows the evaluation of spectra recorded by the camera in the focal plane of the FPI spectrograph. It refers to the grating OSM implementation of an FPI spectrograph (as used in this study), but it can similarly be used for interferometric OSM approach (Kuhn et al., 2021). The grating OSM implementation of an FPI spectrograph employs an OSGS in line with the FPI imaging unit (see Section 2.1.2 above).
The spectral characteristics (λ denotes wavelength) of the optical components in use are well-determined and enable accurate modeling of the spectral instrument transfer function Tinst (λ; i, j), which converts a spectral radiance to measured signals at each detector pixel (i, j). The recorded signal is determined by the superposition of the OSGS’s spectral transmission function H (λ; i, j) and the FPI transmission spectrum TFPI(λ; i, j):
Broadband spectral contributions (e.g., lens transmission, grating efficiency, etc.) are not considered here since they are negligible on the narrow spectral scales of interest. The OSGS’s line function, i.e., its spectral transmission, can be approximated with a higher order Gaussian (e.g., Beirle et al., 2017):
with a full width at half maximum
For the FPI spectrograph the separation of the reflective surfaces d (ca. 240 μm in this study) and the finesse
with the pixel size dpix, the focal length f2 of the imaging lens and the pixel (ioa, joa), where the FPI surface normal (generally the optical axis) intersects the image plane (i.e., the detector surface).
Furthermore, the spatial extent of the detector pixels needs to be accounted for. It imposes a slight divergence of the beams reaching an individual pixel, which can be approximated by a cone geometry delimited by the pixel size and the focal length of the imaging lens. Integrating the individual single beam FPI transmission spectra along the cone’s dimensions yields the effective FPI transmission spectrum for each pixel (see also Fuchs et al., 2021):
The angular range delimited by a pixel is almost independent of the pixel’s location. Accounting for finite pixel size leads to a slight blurring of the FPI transmission spectra at pixels that correspond to higher FPI incidence angles α (see Figure 2C).
The instrument transfer function (Eq. 1) can now be used to convert literature spectra to detector images. This simple model is sufficient to fit trace gas absorption spectra to measured optical density distributions on the detector across large fractions of the spectrum (see Section 2.3).
2.3 Measurements at Nyiragongo volcano, DR Congo
We present measurement results from a field campaign at Nyiragongo volcano in the Democratic Republic of Congo during February 2020. Figure 3 shows schematics and photographs of the measurement site. In the following, we describe an instrument characterization measurement at the crater rim (site II in Figures 3A, C) and a measurement made above (ca. 1 m) an active lava flow within the crater region (site I in Figures 3A, E).
2.3.1 Characterization measurement at the crater rim
A characterization measurement of the instrument set-up was made inside a small shelter at the crater rim. The measurement light path (ca. 1 m) of the set-up sketched in Figure 2A traverses the flame of a camping stove, providing a high amount of OH (see, e.g., Cattolica et al., 1982). Figure 4A shows the spectrum of the UV LED on the FPI “spectrograph’s” detector plane (the flame radiance is negligible). Bright vertical stripes are due to a remaining overlap of the individual FPI transmission orders (see Section 2.1.2; Figure 2). OH absorption lines induce distinct dark spots within the spectrum, aligned to the circles of equal FPI incidence angle (see Figure 2). The steps of the further evaluation are:
1. A region of interest (ROI) for the spectral evaluation is defined (see Figures 4A, B).
2. Within the ROI column-wise (vertical) polynomial fits (here 7th order) approximate the broadband intensity gradients, including the vertical bright striping (see Figure 4C).
3. The intensity distribution obtained from step 2 is used as reference intensity I0 in order to approximate the differential (narrow-band) optical density τ of the spectrum according to
4. Figure 4E shows the modeled differential optical density spectrum. It is obtained by modeling the intensity distribution on the detector (according to the procedure described in Section 2.2, above) and, subsequently, performing step 2 and 3.
5. By varying the OH column density and temperature within the model the residual (Figure 4F, difference between measured and modeled differential optical density image) is minimized.
The measured absorption spectrum of OH is well reproduced by the model (parameters in Table 1, OH absorption data from Rothman et al., 2013). The OH mixing ratio in the flame is approximately:with the temperature T, pressure p, light path length within the absorber L, and the measured OH column density SOH. The resulting mixing ratio of XOH = 3.5 ⋅ 10–4 for a light path of L = 6 cm (i.e., 2 cm × 3 cm) is realistic (Cattolica et al., 1982). Remaining uncertainties are introduced by e.g., the unknown distribution of flame temperature along the light path, which could be included in future evaluations.
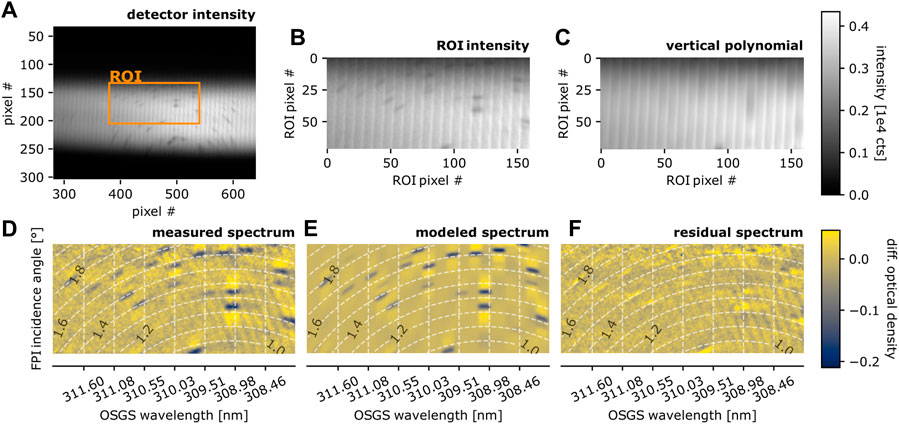
FIGURE 4. Calibration measurement at site II (Figure 3C), absorption spectrum of the flame of a camping stove: (A) Intensity distribution on the detector plane with indicated region of interest (ROI) used for the spectral evaluation. (B) Individual vibronic OH absorption lines are visible as dark spots within the ROI. (C) Column-wise polynomial fit to remove slow intensity gradients and the vertical bright stripes (induced by overlapping orders). (D) Differential narrow-band optical density image, i.e., logarithmic ratio of intensity distributions in (B,C). (E) Modeled differential optical density, i.e., logarithmic ratio of modeled intensity image (model parameters in Table 1) and a column-wise (vertical) polynomial fit. (F) Difference between (D,E). Figure adapted from Kuhn, 2022
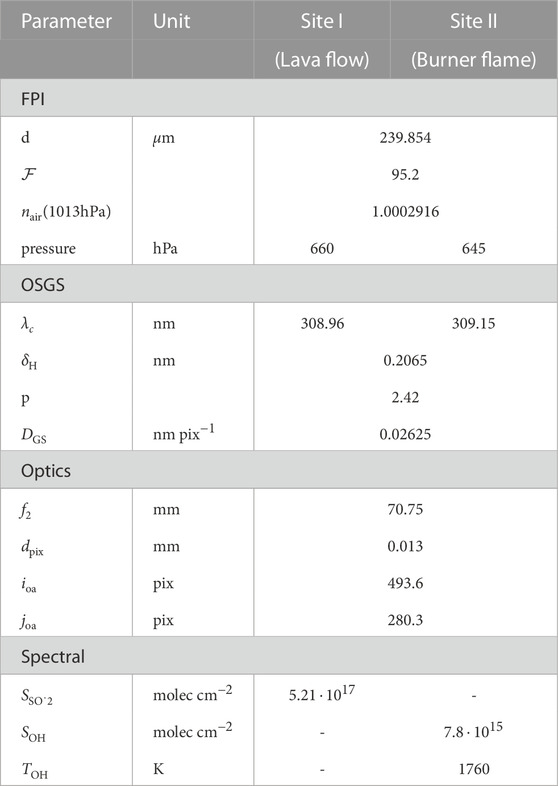
TABLE 1. Model parameters for measurement at site I and II, see Figures 5E, 4E.
This simple experiment demonstrates the capability of the FPI spectrograph prototype to resolve the OH absorption and that the instrument model is suited to quantitatively evaluate the recorded spectra.
2.3.2 Measurement above an active lava flow within the crater
We recorded spectra with a measurement light path crossing about 1 m above an active lava flow (velocity of about 20–50 cm·s−1). On one side of the lava flow the retro reflector is placed on the ground. From the other side the telescope and FPI spectrograph are operated (Figures 3D, E). Figure 5 illustrates the result of the measurement. The measurement spectrum is the sum of 100 individual spectra with 10 s integration time each. The evaluation is performed according to the above described procedures (Section 2.3.1; Figure 4).
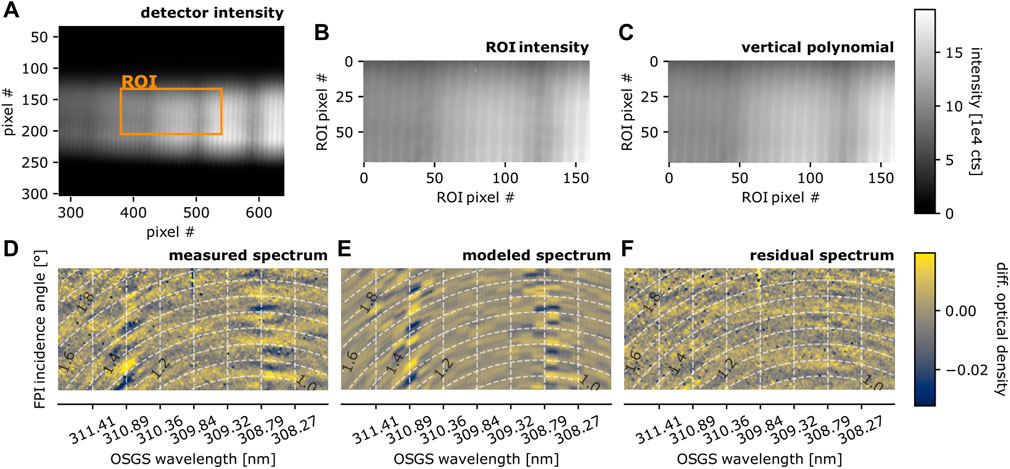
FIGURE 5. Measurement above the active lava flow at site I (Figure 3E). Panel designations are equal to Figure 4. The broad-band (nanometre-scale) absorption bands of SO2 (see Figures 1B, 6) are visible in the intensity distributions (A,B). (D) Shows the narrow-band (picometre-scale) SO2 absorption. The model (with adjusted pressure and OSGS wavelength, Table 1) shows good agreement with the measurement with a realistic SO2 column. OH absorption lines, present within the covered spectral range are not observed, which limits maximum OH amounts to about 20 ppb. Figure adapted from Kuhn, 2022.
The broad vertical dark stripes in the spectrum (Figures 5A–C) represent the broad-band (nanometre-scale) absorption structures of SO2, which are used for conventional SO2 DOAS measurements. The differential optical density image (Figure 5D) shows the narrow-band (picometre-scale) absorption features of SO2, which are again well reproduced by the model using absorption data from Rufus et al. (2003). Despite uncertainties such as unknown sample gas temperature and behavior of the absorption of SO2 at higher temperature, the residual spectrum is dominated by a homogeneous noise pattern with a root mean square in the range of 0.01. The noise likely is introduced by inaccuracies in the detector’s dark signal correction, as a drift of the detector temperature (from −6° to −1°) during the measurement was observed. The dark signal was therefore approximated in lab measurements retrospectively, which was only possible with an uncertainty due to hysteresis effects in the detector electronics.
Figure 6 indicates the wavelength coverage of the evaluation of the lava flow measurement (Figure 5). The gray shaded areas in the spectrum (right panel) show the wavelength range that is covered by the individual FPI transmission orders separated by the grating on the FPI spectrograph’s detector plane. The color code indicates the location of each FPI transmission order on the detector plane (left panel). The spectral optical density of SO2 with the retrieved column density (
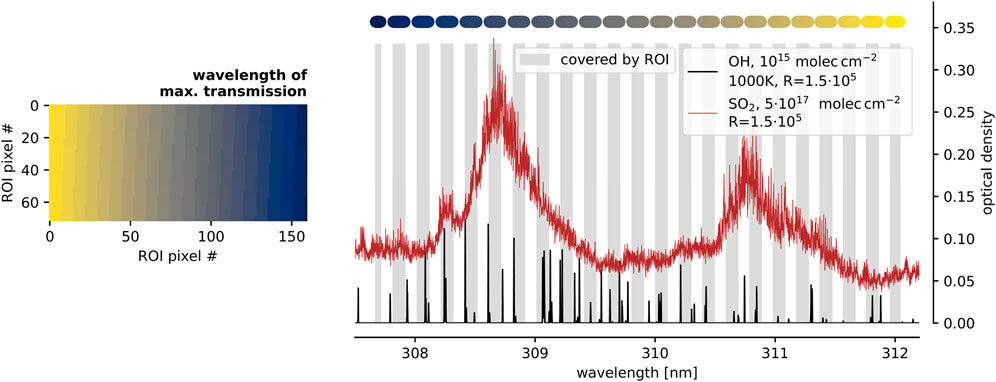
FIGURE 6. The right panel shows the spectral optical density, calculated from literature absorption cross sections, of given amounts of SO2 (red, as measured above the lava flow) and OH (black, hypothetical value of 1015 molec cm−2) observed with R = 1.5 ⋅ 105. The gray shaded areas indicate the spectral range covered by individual FPI transmission orders within the ROI used for the evaluation of the lava flow measurement (Figure 5). The colour above the respective FPI transmission order indicates its location within the ROI (in the left panel). Figure adapted from Kuhn, 2022.
According to Figure 6 several strong OH absorption lines are covered by the evaluation ROI, for example, between 308 and 308.5 nm. Their amplitude for a column density of 1015 molec cm−2 exceeds an optical density of 0.1. Thus, within the noisy residual (root means square of ca. 0.01, Figure 5F) it should be possible to detect OH absorption peaks corresponding to a column density of ca. 2 ⋅ 1014 molec cm−2. For an assumed gas temperature between 800 K and 1,200 K and a light path of 20 m within the hot gas, the OH detection limit would correspond to a mixing ratio of 17–25 ppb. For the same assumptions on the light path, the retrieved SO2 column corresponds to a mixing ratio of 44–64 ppm.
2.4 Discussion
In this exploratory field study we could not detect volcanic OH. The main reason for that might be a low gas temperature and the low emission of the probed lava flow (indicated by the relatively low SO2 levels measured). Nevertheless, it demonstrates central aspects of the field-applicability and the substantial added value through FPI spectrograph measurements for volcanic gas studies. The presented FPI spectrograph measurements yield high spectral resolution (R ≈ 150,000), exceeding that of former volcanic gas RS measurements by at least one order of magnitude. Furthermore, it shows excellent stability under field conditions. The introduced evaluation using high-resolution spectral absorption data enables an accurate calibration of the spectrograph by directly adjusting physical parameters in the instrument model. The burner flame measurement at the crater rim and the measurement at the lava flow within the crater were made on the same day, separated by a few hours and a steep decent of 300 vertical metres into the crater with the instrument set-up in a backpack. Even under the harsh conditions (moist, sunny, hot, dusty, windy) the FPI spectrograph’s calibration remained constant, except for a slight shift of the OSGS wavelength axis (see Table 1). This slight spectral shift might have been introduced by mechanical impacts during transportation and its effects could readily be accounted for by the instrument model within the SO2 evaluation (i.e., re-calibration using the high-resolution SO2 absorption features).
Beyond this proof-of-concept study, the instrument set-up and the spectral evaluation can be significantly improved. Avoiding overlapping orders (e.g., higher OSGS dispersion) and a more appropriate shielding of the detector (to sustain temperature stabilization) would provide photon-shot-noise-limited spectra. Moreover, a FPI spectrograph with interferometric OSM instead of the grating (i.e., using a band-pass filter instead of the OSGS) can increase the light throughput by a factor of 100 (basically by reducing the spectral coverage, see Kuhn et al., 2021, for details). Temperature measurements and high-temperature data of absorption cross sections (e.g., for SO2) would further improve the spectral evaluation. In combination with an optimized (longest possible) light path inside the plume, all these measures might lower the detection limit for OH by another two orders of magnitude. Infrastructural challenges related to the accessibility of hot volcanic gas emissions (e.g., volcano-related hazards) would remain a limiting aspect for OH radical quantification in high-temperature volcanic gases. The placement of retro reflectors by unoccupied aerial vehicles would significantly increase the number of potential measurement sites.
3 Theoretical proof-of-concept—Remote sensing of HF and HCl in volcanic plumes using skylight
Volcanic halogens play significant roles in many volcanic processes and impact the local to regional volcanic environment and Earth’s atmosphere (see, e.g., Aiuppa et al., 2009, and references therein). As halogens tend to degas from the magma at rather shallow depth (e.g., Spilliaert et al., 2006), continuous quantification of volcanic halogen emissions (similar to present-day volcanic SO2 quantification, e.g., Galle et al., 2010; Kern et al., 2022) would substantially contribute to improving models of magma dynamics and degassing and bear a high potential for volcanic monitoring.
Most RS measurements of HF and HCl were only possible with FTS using lamps, lava thermal emission, or direct sunlight (solar occultation) as light source (e.g., Francis et al., 1998; Sawyer et al., 2008; Butz et al., 2017). The reason for this limitation is in part the limited light throughput of FTS instruments. In addition, they are sensitive to intensity fluctuations in the atmosphere, as interferograms are recorded in a time-sequence while delicate optics are tuned mechanically. Moreover, when using sunlight as light source, limited spectral resolution leads to the requirement of an exact knowledge of the atmospheric background spectrum for the evaluation (e.g., via additional O2 measurements and radiative transfer modeling, see e.g., Butz et al., 2017).
For spectrographs, i.e., spectrometers that record all spectral channels simultaneously (like GSs and FPI spectrographs), the influence of temporal intensity variations is negligible and instruments are implemented without movable parts. The thereby gained simplicity, stability, and lower power consumption is an essential advantage for the (automated) employment in harsh volcanic environments. The implementation of spectrographs in the SWIR has become feasible by the development of appropriate focal plane detectors (e.g., Crisp et al., 2017). However, GS implementations with the resolving power required for accurate trace gas retrievals (typically R = 104-105 in the SWIR) and a high light throughput are large and heavy and thus hardly suited for most volcanic applications.
Here, we investigate the feasibility of passive RS measurements of HF and HCl in volcanic plumes using FPI spectrographs and skylight as a SWIR light source. The photon budget calculations rely on skylight radiance estimates (Section 3.1.1) and the quantification of the light throughput of FPI spectrographs relative to that of GSs (based on results of Kuhn et al., 2021; Section 3.1.2). We propose suitable wavelength windows and optimized resolution of the FPI spectrograph and demonstrate the feasibility of a DOAS-type detection of HF and HCl in volcanic plumes by using skylight (Section 3.2).
3.1 The photon budget of skylight measurement geometry
A trace gas can be detected by spectral RS once its effective differential absorption along the measurement light path
The noise of an optical density measurement
The effective differential optical density of an absorber
3.1.1 The spectral radiance of skylight
The radiance of the daytime sky (i.e., the scattered sunlight across the sky) can be extremely variable, strongly depending on, e.g., aerosol and cloud conditions. This variability remains rather moderate at UV-visible wavelength (i.e., usually varying by less than one order of magnitude, see, e.g., Wagner et al., 2004; 2014). The strong spectral dependence of Rayleigh scattering and the generally much weaker spectral dependence of light scattering on aerosol and cloud droplets cause a rapidly increasing contrast between the blue sky and aerosol layers or clouds towards IR wavelengths. We use the parametrization by Ångström (1929) to approximate the spectral scattering efficiency ϵ with the Angstrom exponent γ:
In the coarse assessment of the skylight radiance in this work, we assume:
1. A blackbody spectrum (5,800 K) and a solar line list of Toon (2015) are used to approximate the solar spectrum. The absorption of tropospheric H2O, CO2, O2, CH4 (atmospheric background values, constant temperature T = 300 K; Rothman et al., 2013), and stratospheric O3 (vertical column density of ca. 300 Dobson units, 223 K, Serdyuchenko et al., 2014) is included to approximate the atmosphere’s transmission. In order to account for common measurement viewing geometries, we assume a single scattering atmospheric light path roughly corresponding to a viewing elevation angle of ca. 20° (corresponding to an about 3-fold extension compared to the vertical path).
2. At 400 nm, the radiance of the blue sky, an aerosol layer, and that of a cloud are the same.
3. The radiance of the blue sky Ibs is governed by Rayleigh scattering (i.e., γ = 4, Strutt, 1871), i.e.,:
4. Angstrom exponents for aerosols in the atmosphere range from about 0.7 to 2 (e.g., Martınez-Lozano et al., 1998), while the radiance of clouds, due to the larger particle size parameter is even less dependent on wavelength (see e.g., Stephens and Platt, 1987). We approximate the scattering efficiency of clouds to be independent of wavelength (i.e., γ = 0) and that of aerosol particles (Iae) to scale according to γ = 1:
5. The skylight radiance Ial of the sky covered by an aerosol layer with moderate aerosol optical density τal (AOD, τal < 1) is approximated by the sum of blue sky radiance and that of aerosol scattering, weighted with the AOD:
The variability of the radiance between different types of clouds or different types of aerosol layers introduces a large uncertainty to this simplified approximation of skylight radiances. Particularly for optically very thick clouds the radiances can be much lower. Nevertheless, the above assumptions facilitate a rough but reasonable approximation for the assessment of the photon budget of atmospheric and volcanic RS instruments.
Figure 7 summarises the above assumptions and indicates the resulting spectral skylight radiances of 1) the blue sky, 2) an aerosol layer with slant AOD = 0.2, and 3) a white cloud (relative to 400 nm).
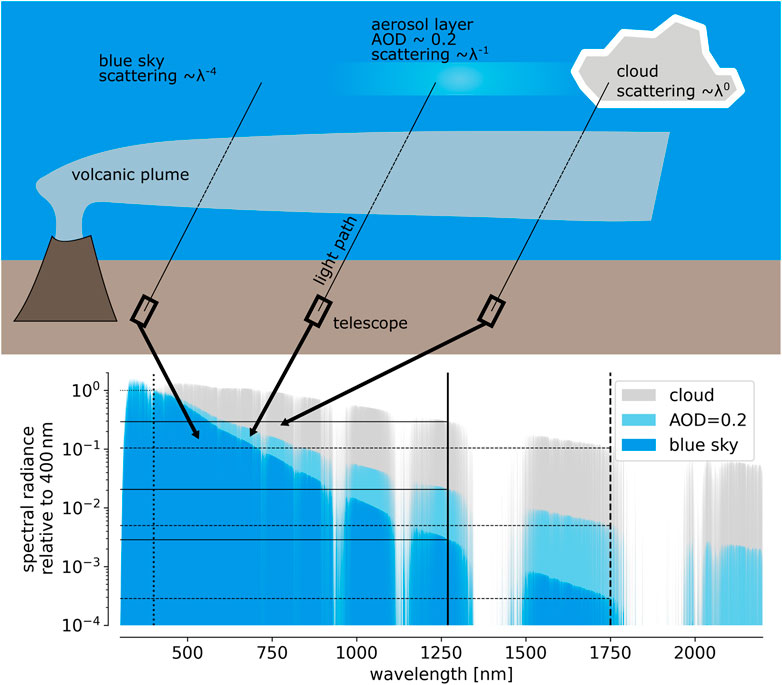
FIGURE 7. Approximation of the relative spectral skylight radiance for different sky conditions. In the blue spectral range (ca. 400 nm) the radiance of the blue sky, an aerosol layer and that of a cloud are similar. Towards IR wavelength the contrast between the different sky conditions increases drastically, which is approximated by representative Angstrom exponents.
3.1.2 The relative light throughput of GS and FPI spectrographs
The light throughput k of a spectrograph determines the flux Jph of photons with wavelength between λ and λ + δλ at the detector for a given incident spectral radiance I(λ) (see Eq. 7). The light throughput of a spectrograph is determined by the etendue E, the spectral resolution δλ and losses μ related to optical components and the detector:
With the assumption that the losses μ are similar for both, GS and FPI spectrograph, their light throughput for a given resolving power R can be compared based on the etendue. The etendue of a compact GS EGS is essentially determined by the square of its slit width wS. Furthermore, the ratio of the GS’s principal focal length f to the slit width approximates its resolving power (Kuhn et al., 2021):
The etendue EFPI that can be reached by high-resolution FPI spectrographs is given by (Jacquinot, 1954; Kuhn et al., 2021):
It is basically determined by the FPI’s clear aperture diameter bFPI and scales, in contrast to GSs, only with the inverse resolving power.
3.2 SWIR DOAS measurements of HF and HCl using skylight
3.2.1 Resolving power
The SWIR spectral range is characterized by many narrow and strong absorption lines of atmospheric gases, mainly H2O, CO2, O2, and CH4 (see, e.g., Figures 1C, 7). Since all of these gases either are present in large amounts or show a more or less uniform distribution in the atmosphere, the strength of their absorption within scattered skylight spectra strongly depends on the atmospheric light path, which is for instance influenced by the viewing geometry and the atmospheric state in terms of aerosol content or clouds. Precise knowledge of the measurement light paths and the atmospheric state along these light paths is required, which, in practice, limits the precision and accuracy of remote detection of for instance CO2 gradients in the atmosphere (e.g., volcanic plumes, see, e.g., Butz et al., 2017).
While being emitted by volcanoes in large quantities, HF and HCl exhibit very low atmospheric background levels. Thus, similar to DOAS measurements of volcanic SO2 in the UV, the measured absorption introduced by HF and HCl within an atmospheric light path traversing the volcanic plume can be unambiguously assigned to the volcanic emission. Figures 8, 9 show a more detailed view of the atmospheric SWIR spectrum at the spectral windows with strong HF and HCl absorption. The upper panels (A) illustrate the spectral jungle of sharp and strong lines of the background atmosphere. Panels B show the closer vicinity of an individual HF (or HCl) line. Panels C show the same spectral range as observed with a spectral resolution of δλ = 0.1 nm (R
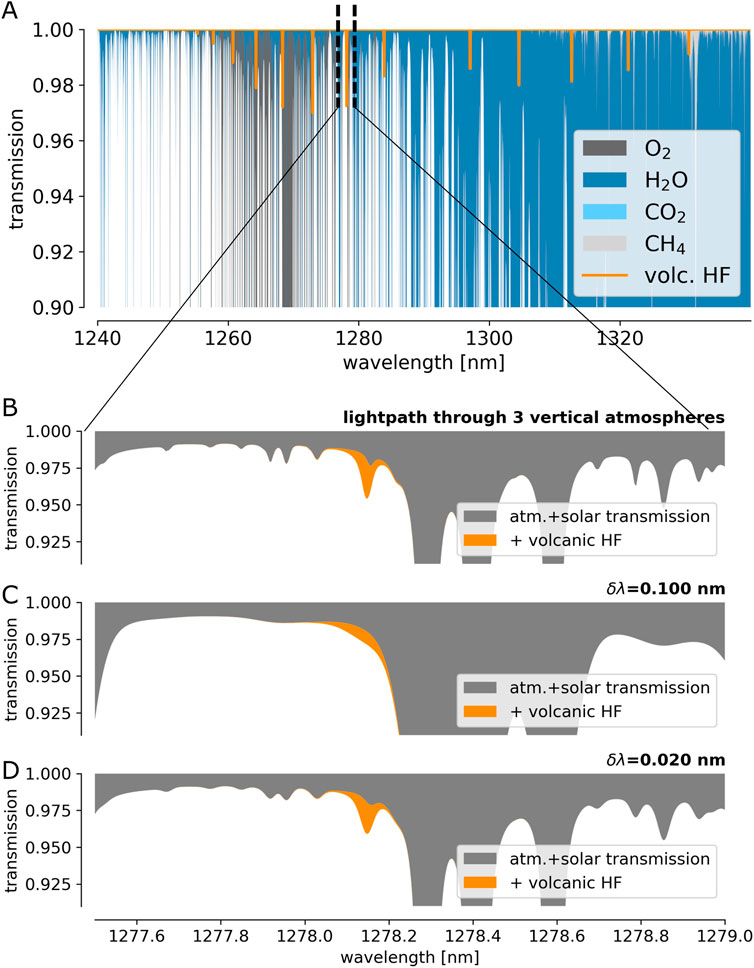
FIGURE 8. (A) High-resolution spectrum of the atmospheric transmission with a typical amount of volcanic HF (1017 molec cm−2) at 1,278 nm. (B) Extract of (A) around an individual HF absorption line. (C,D) show the spectrum of (B) as seen with instruments with a spectral resolution δλ of 0.1 and 0.02 nm, respectively.
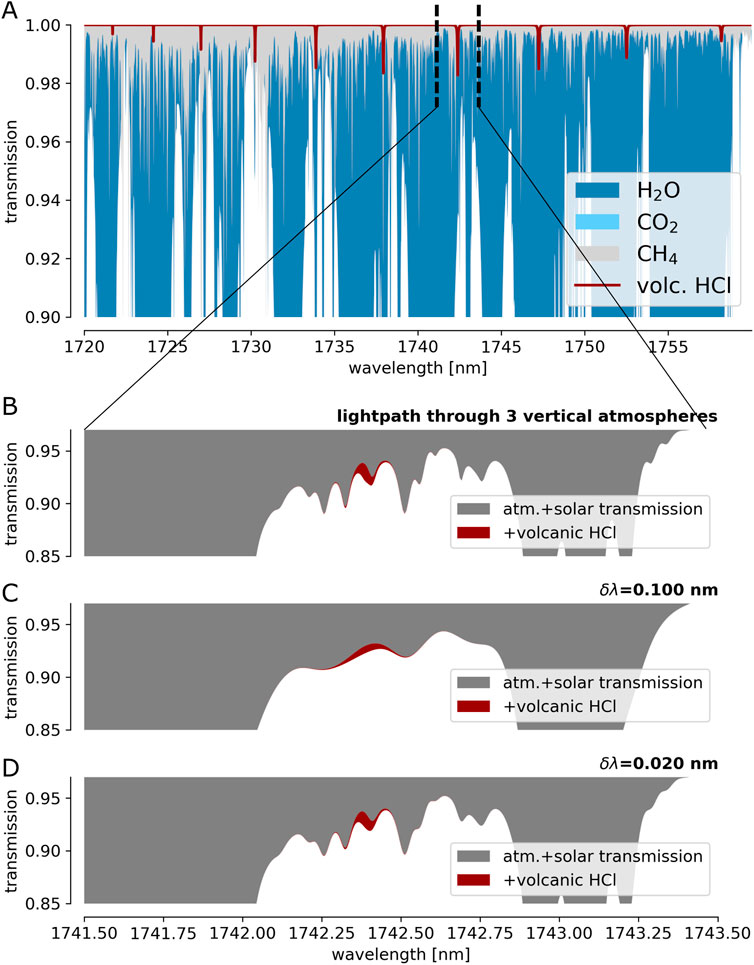
FIGURE 9. Same as Figure 8 for HCl (3 ⋅ 1017 molec cm−2) at 1,742 nm.
3.2.2 Photon budget
We calculate the photon budget for FPI spectrograph measurements using skylight in the spectral range of HF and HCl absorption (Figures 8, 9). A skylight DOAS measurement, performed with a GS (f = 100 mm, R = 1,000), reaches a noise level on the order of Δτ = 10–4 for an exposure time δt of ca. 30 s. This is in accordance with skylight radiance quantification by Blumthaler et al. (1996), who find a radiance of at least 20 mW·m−2·sr−1·nm−1 at 400 nm for clear sky conditions and a solar zenith angle of 68°. This equals I = 4 ⋅ 1010 photons mm−2 sr−1 nm−1 s−1. With the GS’s etendue (Eq. 14), spectral resolution (δλ = 400 nm/R = 0.4 nm), and a loss factor of μ ≈ 0.03 (accounting for: quantum efficiency of the detector, grating efficiency, transmission/reflectivity of mirrors, fibres, telescopes and stray-light filters), this leads to a number of counted photo-electrons of N ≈ 108 for an exposure time of δt =30 s (see Eqs 8, 13).
This number serves as a reference for approximating the SNR of HF and HCl measurements with FPI spectrographs. The above introduced relative skylight radiance quantification (relative to 400 nm) and light throughput quantification of FPI spectrographs (relative to GSs) allows to infer noise limits Δτ and relate them to differential optical densities
Table 2 summarises the result of these calculations. It shows that HF and HCl can be quantified by FPI spectrograph based DOAS measurements using skylight. As expected, the SNR is dependent on the sky conditions with the blue sky scenario representing a lower bound to the skylight radiance as there always is a certain amount of atmospheric aerosol (vertical AOD typically
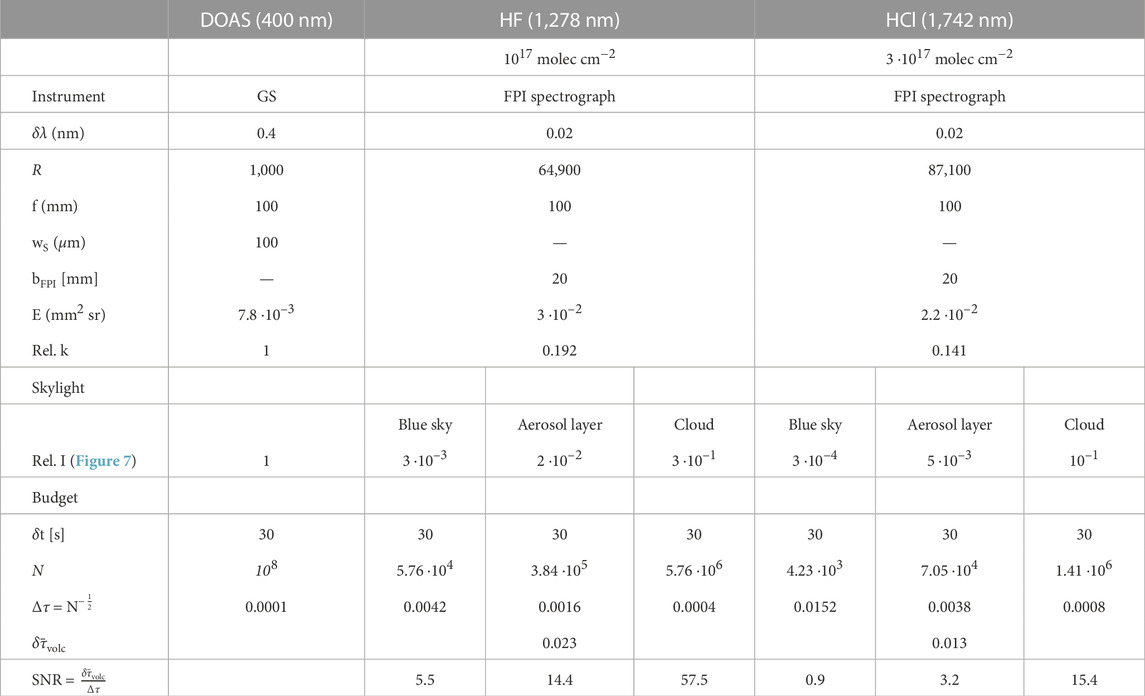
TABLE 2. Photon budget calculations for skylight RS measurements of volcanic HF and HCl.
3.3 Discussion
The above calculations rely on rough skylight radiance approximations. However, the choice of the absolute radiance value is quite conservative. It is based on measurements made at a high solar zenith angle (68°) and, depending on the viewing geometry, it can be by more than an order of magnitude higher (Blumthaler et al., 1996). A sky overcast by thinner clouds above the volcanic plume would represent good measurement conditions. The presence of aerosol or broken-cloud sky conditions would also enable reasonable HF and HCl quantification, particularly as spectrograph measurements are hardly disturbed by background intensity variations.
Volcanic aerosol and condensed plumes can also serve as a light source. Although the light path in such measurement scenarios will not be well-defined, the evaluation of gas ratios (of gases absorbing in similar spectral ranges, such as HF and HCl) will still be possible (similar to the quantification of BrO/SO2 by DOAS in the UV, see e.g., Lübcke et al., 2014).
The absorption cross section of other atmospheric gases (e.g., O2, H2O, CH4, CO2) in the respective spectral retrieval intervals are known. As in common DOAS routines, the absorption of these gases is accounted for in the evaluation and separated from the target trace gas absorption (see Platt and Stutz, 2008, for details).
We conclude that HF and HCl can be measured, similarly to volcanic SO2, by RS with simple, robust and compact spectrographs using skylight as a light source. SO2, HF, and HCl are basically chemically inert within the first minutes of plume evolution in the atmosphere (Beirle et al., 2014; Rüdiger et al., 2021). Thus, the ratio of these gases will provide an independent geochemical (or “purely volcanic”) parameter without relying on atmospheric parameters, such as wind speed, plume height (SO2 fluxes), or chemistry (BrO/SO2 ratios). Autonomous ground-based (e.g., NOVAC-type, see Galle et al., 2010) and satellite-based platforms can be extended to measure HF and HCl in addition to SO2 and provide real-time and continuous data during all stages of volcanic activity.
4 Conclusion and outlook
Nowadays techniques for RS of volcanic gases enable DOAS measurements of SO2 emissions, which, when operated from autonomous platforms, provide global and continuous data (e.g., Carn et al., 2017; Theys et al., 2019; Arellano et al., 2021). Further species (e.g., H2O, CO2, SO2, HF, HCl, CO) can be measured by more intricate techniques that almost exclusively provide data during dedicated field campaigns. We show here, that the use of high-resolution FPIs in spectrograph implementations could overcome the limitations of present-day volcanic gas RS techniques in many respects.
In the first part of this article, we describe volcanic field measurements with a FPI spectrograph prototype and demonstrate the feasibility of the quantification of volcanic OH radicals. While possibly playing a central role in the high-temperature chemistry of volcanic gases, no conventional sampling technique is able to measure volcanic OH. During the field measurements, the prototype set-up showed excellent stability and mobility. Furthermore, we introduce straight-forward evaluation approaches for the data generated by FPI spectrographs. The evaluation of a spectrum recorded above an active lava flow allows the quantification of SO2 by its high resolution (picometre) absorption structures and the determination of a detection limit for OH to about 20 parts per billion. This means that, for an ideal sampling situation (i.e., light path traversing the hot plume), even our present (not fully optimised) prototype is able to quantify the OH mixing ratios predicted by high temperature chemistry models (parts per million range).
In the second part of this article, sample calculations prove the feasibility of DOAS-type measurements of HF and HCl using the light of the daytime sky. FPI spectrographs provide sufficient light throughput and high spectral resolution (for an accurate spectral detection of the trace gas) with a form factor comparable to that of a compact GS (focal length f = 100 mm). A GS with similar performance can only be implemented with a focal length of f
OH measurements and HF and HCl DOAS measurements are only examples for the plenty of applications of FPI-based high-resolution spectroscopy to RS of volcanic gases. Besides improving the quality and lowering the detection limits of many state-of-the-art observations, further applications may include:
1. Similarly to FTSs, FPI spectrographs can be employed in solar occultation viewing geometry or with lamps or lava thermal emission as light source. The increased spectral resolution and higher light throughput leads to higher sensitivity of these measurements and might enable the quantification of further plume constituents, such as isotopes in CO2 or H2O.
2. Quantification of further reactive trace gas species within the high-temperature magma-atmosphere interface is essential for a better understanding of high-temperature volcanic emission processes. High-temperature sulfur chemistry is still bound to large uncertainties. Sulfanyl (SH) might be a central intermediate species in sulfur oxidation at high temperatures (Roberts et al., 2019; Kuhn, 2022) and shows sharp and strong absorption bands in the UV (ca. 324 nm, see Lewis and White, 1939).
3. High spectral resolution might enable RS of 34SO2, based on slight shifts in spectral absorption in the UV (e.g., Danielache et al., 2008). This approach would circumvent fractionation issues as found for conventional sampling techniques (e.g., Mather et al., 2008).
FPI spectrographs rely on a basically very simple optical set-up (two lenses, a band-pass filter, a FPI etalon, and a detector). Low thermal expansion spacers of state-of-the-art FPIs ensure a high thermal stability of the instrument (Kuhn et al., 2021). Due to standardized manufacturing procedures of the intrinsically simple set-up of FPIs, FPI spectrographs are likely to cost a fraction of the price of a commercial FTS system. Moreover, the small size and high robustness makes them also ideal candidates for (miniature) satellite missions.
The combination of simple instrumentation and its striking potential to fill substantial gaps in present data suggests that FPI spectrographs will play a central role in the future of volcanic gas geochemistry.
Data availability statement
The original contributions presented in the study are included in the article/Supplementary Material, further inquiries can be directed to the corresponding author.
Author contributions
NB, GB, SC, GG, ML, KK and DT substantially supported the field measurements at Nyiragongo volcano. NB, TW, UP and JK contributed to the conceptualization and to interpretations of the study in frequent discussions. All co-authors reviewed and contributed to the refinement of earlier drafts of the manuscript. JK conceptualized, manufactured and characterized the FPI spectrograph prototype and the open-path set-up, developed the instrument model, conducted and evaluated the field measurements, conceptualized and performed the photon budget calculations, and wrote the draft of the manuscript.
Funding
This research has been partially funded by the German Research Foundation (DFG; project no. PL 193/23-1). For the publication fee we acknowledge financial support by Heidelberg University and the Deutsche For schungsgemeinschaft within the funding program “Open Access Publicationskosten”.
Acknowledgments
We are grateful to the Goma Volcano Observatory (OVG) for the invitation and logistic help. Further we thank the United Nations Organization Stabilization Mission in the Democratic Republic of the Congo (MONUSCO) and the Institut Congolais pour la Conservation de la Natur (ICCN) for providing the logistics inside the Virunga National Park. We thank SVG Geneve for providing the logistics to descent into Nyiragongo’s crater and particularly Pierre-Yves Burgi and Patrick Marcel for their support during the measurement. We thank SLS Optics Ltd., for their excellent services and kind support.
Conflict of interest
The authors declare that the research was conducted in the absence of any commercial or financial relationships that could be construed as a potential conflict of interest.
Publisher’s note
All claims expressed in this article are solely those of the authors and do not necessarily represent those of their affiliated organizations, or those of the publisher, the editors and the reviewers. Any product that may be evaluated in this article, or claim that may be made by its manufacturer, is not guaranteed or endorsed by the publisher.
Supplementary material
The Supplementary Material for this article can be found online at: https://www.frontiersin.org/articles/10.3389/feart.2023.1039093/full#supplementary-material
Abbreviations
RS, remote sensing; FPI, Fabry-Pérot interferometer; UV, ultraviolet; GS, grating spectrograph; IR, infrared; FTS, Fourier transform spectroscopy; SWIR, short wave infrared; DOAS, differential optical absorption spectroscopy; LED, light emitting diode; OSM, order sorting mechanism; OSGS, order sorting grating spectrograph; ROI, region of interest.
Footnotes
1Nies, A., Heimann, J., Fuchs, C., Kuhn, J., Bobrowski, N., and Platt, U. (2022). Volcanic BrO and SO2 imaging using Fabry-Perot interferometer correlation spectroscopy.
References
Aiuppa, A., Baker, D., and Webster, J. (2009). Halogens in volcanic systems. Chem. Geol. 263, 1–18. doi:10.1016/j.chemgeo.2008.10.005
Ångström, A. (1929). On the atmospheric transmission of sun radiation and on dust in the air. Geogr. Ann. 11, 156–166. doi:10.1080/20014422.1929.11880498
Arellano, S., Galle, B., Apaza, F., Avard, G., Barrington, C., Bobrowski, N., et al. (2021). Synoptic analysis of a decade of daily measurements of SO2 emission in the troposphere from volcanoes of the global ground-based network for observation of volcanic and atmospheric change. Earth Syst. Sci. Data 13, 1167–1188. doi:10.5194/essd-13-1167-2021
Beirle, S., Hörmann, C., Penning de Vries, M., Dörner, S., Kern, C., and Wagner, T. (2014). Estimating the volcanic emission rate and atmospheric lifetime of SO2 from space: A case study for kīlauea volcano, Hawai`i. Atmos. Chem. Phys. 14, 8309–8322. doi:10.5194/acp-14-8309-2014
Beirle, S., Lampel, J., Lerot, C., Sihler, H., and Wagner, T. (2017). Parameterizing the instrumental spectral response function and its changes by a super-Gaussian and its derivatives. Atmos. Meas. Tech. 10, 581–598. doi:10.5194/amt-10-581-2017
Blumthaler, M., Gröbner, J., Huber, M., and Ambach, W. (1996). Measuring spectral and spatial variations of UVA and UVB sky radiance. Geophys. Res. Lett. 23, 547–550. doi:10.1029/96gl00248
Bobrowski, N., Giuffrida, G., Yalire, M., Lübcke, P., Arellano, S., Balagizi, C., et al. (2017). Multi-component gas emission measurements of the active lava lake of Niyragongo, DR Congo. J. Afr. Earth Sci. 134, 856–865. doi:10.1016/j.jafrearsci.2016.07.010
Butz, A., Dinger, A. S., Bobrowski, N., Kostinek, J., Fieber, L., Fischerkeller, C., et al. (2017). Remote sensing of volcanic CO2, HF, HCl, SO2, and BrO in the downwind plume of Mt. Etna. Atmos. Meas. Tech. 10, 1–14. doi:10.5194/amt-10-1-2017
Carn, S. A., Fioletov, V. E., McLinden, C. A., Li, C., and Krotkov, N. A. (2017). A decade of global volcanic SO2 emissions measured from space. Sci. Rep. 7, 44095. doi:10.1038/srep44095
Cattolica, R. J., Yoon, S., and Knuth, E. L. (1982). OH concentration in an atmospheric-pressure methane-air flame from molecular-beam mass spectrometry and laser-absorption spectroscopy. Combust. Sci. Technol. 28, 225–239. doi:10.1080/00102208208952557
Crisp, D., Pollock, H. R., Rosenberg, R., Chapsky, L., Lee, R. A. M., Oyafuso, F. A., et al. (2017). The on-orbit performance of the orbiting carbon observatory-2 (OCO-2) instrument and its radiometrically calibrated products. Atmos. Meas. Tech. 10, 59–81. doi:10.5194/amt-10-59-2017
Crutzen, P. J. (1974). Photochemical reactions initiated by and influencing ozone in unpolluted tropospheric air. Tellus 26, 47–57. doi:10.3402/tellusa.v26i1-2.9736
Danielache, S. O., Eskebjerg, C., Johnson, M. S., Ueno, Y., and Yoshida, N. (2008). High-precision spectroscopy of 32S, 33S, and 34S sulfur dioxide: Ultraviolet absorption cross sections and isotope effects. J. Geophys. Res. 113, D17314. doi:10.1029/2007jd009695
Fabry, C., and Buisson, H. (1908). Wavelength measurements for the establishment of a system of spectroscopic standards. Astrophysical J. 27, 169–196. doi:10.1086/141586
Fleischmann, O. C., Hartmann, M., Burrows, J. P., and Orphal, J. (2004). New ultraviolet absorption cross-sections of BrO at atmospheric temperatures measured by time-windowing Fourier transform spectroscopy. J. Photochem. Photobiol. A Chem. 168, 117–132. doi:10.1016/j.jphotochem.2004.03.026
Francis, P., Burton, M. R., and Oppenheimer, C. (1998). Remote measurements of volcanic gas compositions by solar occultation spectroscopy. Nature 396, 567–570. doi:10.1038/25115
Fuchs, C., Kuhn, J., Bobrowski, N., and Platt, U. (2021). Quantitative imaging of volcanic SO2 plumes using Fabry–Pérot interferometer correlation spectroscopy. Atmos. Meas. Tech. 14, 295–307. doi:10.5194/amt-14-295-2021
Galle, B., Johansson, M., Rivera, C., Zhang, Y., Kihlman, M., Kern, C., et al. (2010). Network for observation of volcanic and atmospheric change (NOVAC) - a global network for volcanic gas monitoring: Network layout and instrument description. J. Geophys. Res. 115, D05304. doi:10.1029/2009JD011823
Gerlach, T. M. (2004). Volcanic sources of tropospheric ozone-depleting trace gases. Geochem. Geophys. Geosystems 5, 9. doi:10.1029/2004gc000747
Hörmann, C., Sihler, H., Bobrowski, N., Beirle, S., Penning de Vries, M., Platt, U., et al. (2013). Systematic investigation of bromine monoxide in volcanic plumes from space by using the GOME-2 instrument. Atmos. Chem. Phys. 13, 4749–4781. doi:10.5194/acp-13-4749-2013
Jacquinot, P. (1960). New developments in interference spectroscopy. Rep. Prog. Phys. 23, 267–312. doi:10.1088/0034-4885/23/1/305
Jacquinot, P. (1954). The luminosity of spectrometers with prisms, gratings, or Fabry–Pérot etalons. J. Opt. Soc. Am. 44, 761. doi:10.1364/josa.44.000761
Kern, C., Aiuppa, A., and de Moor, J. M. (2022). A golden era for volcanic gas geochemistry? Bull. Volcanol. 84, 43. doi:10.1007/s00445-022-01556-6
Kern, C., Masias, P., Apaza, F., Reath, K. A., and Platt, U. (2017). Remote measurement of high preeruptive water vapor emissions at sabancaya volcano by passive differential optical absorption spectroscopy. J. Geophys. Res. Solid Earth 122, 3540–3564. doi:10.1002/2017jb014020
Kuhn, J., Bobrowski, N., Lübcke, P., Vogel, L., and Platt, U. (2014). A Fabry–Perot interferometer-based camera for two-dimensional mapping of SO2 distributions. Atmos. Meas. Tech. 7, 3705–3715. doi:10.5194/amt-7-3705-2014
Kuhn, J., Bobrowski, N., and Platt, U. (2022). The interface between magma and Earth’s atmosphere. Geochem. Geophys. Geosystems 23. doi:10.1029/2022gc010671
Kuhn, J., Bobrowski, N., Wagner, T., and Platt, U. (2021). Mobile and high-spectral-resolution Fabry–Pérot interferometer spectrographs for atmospheric remote sensing. Atmos. Meas. Tech. 14, 7873–7892. doi:10.5194/amt-14-7873-2021
Kuhn, J. (2022). Novel approaches to the analysis of volcanic degassing. PhD Thesis. Heidelberg University. doi:10.11588/HEIDOK.00031922
Kuhn, J., Platt, U., Bobrowski, N., and Wagner, T. (2019). Towards imaging of atmospheric trace gases using Fabry–Pérot interferometer correlation spectroscopy in the UV and visible spectral range. Atmos. Meas. Tech. 12, 735–747. doi:10.5194/amt-12-735-2019
Le Guern, F. (1987). Mechanism of energy transfer in the lava lake of Nyiragongo (Zaire), 1959–1977. J. Volcanol. Geotherm. Res. 31, 17–31. doi:10.1016/0377-0273(87)90003-5
Levy, H. (1971). Normal atmosphere: Large radical and formaldehyde concentrations predicted. Science 173, 141–143. doi:10.1126/science.173.3992.141
Lewis, M. N., and White, J. U. (1939). The band spectrum of HS. Phys. Rev. 55, 894–898. doi:10.1103/physrev.55.894
Lübcke, P., Bobrowski, N., Arellano, S., Galle, B., Garzón, G., Vogel, L., et al. (2014). BrO/SO2 molar ratios from scanning DOAS measurements in the NOVAC network. Solid earth. 5, 409–424. doi:10.5194/se-5-409-2014
Martınez-Lozano, J., Utrillas, M., Tena, F., and Cachorro, V. (1998). The parameterisation of the atmospheric aerosol optical depth using the ångström power law. Sol. Energy 63, 303–311. doi:10.1016/s0038-092x(98)00077-2
Mather, T., Pyle, D., and Heaton, T. (2008). Investigation of the use of filter packs to measure the sulphur isotopic composition of volcanic sulphur dioxide and the sulphur and oxygen isotopic composition of volcanic sulphate aerosol. Atmos. Environ. 42, 4611–4618. doi:10.1016/j.atmosenv.2008.01.052
Merten, A., Tschritter, J., and Platt, U. (2011). Design of differential optical absorption spectroscopy long-path telescopes based on fiber optics. Appl. Opt. 50, 738–754. doi:10.1364/AO.50.000738
Mori, T., and Burton, M. (2006). The SO2 camera: A simple, fast and cheap method for ground-based imaging of SO2 in volcanic plumes. Geophys. Res. Lett. 33, L24804. doi:10.1029/2006gl027916
Mori, T., Notsu, K., Tohjima, Y., and Wakita, H. (1993). Remote detection of HCl and SO2 in volcanic gas from Unzen volcano, Japan. Geophys. Res. Lett. 20, 1355–1358. doi:10.1029/93gl01065
Moussallam, Y., Oppenheimer, C., and Scaillet, B. (2019). On the relationship between oxidation state and temperature of volcanic gas emissions. Earth Planet. Sci. Lett. 520, 260–267. doi:10.1016/j.epsl.2019.05.036
Notholt, J., Schütt, H., and Keens, A. (1997). Solar absorption measurements of stratospheric OH in the UV with a Fourier-transform spectrometer. Appl. Opt. 36, 6076. doi:10.1364/ao.36.006076
Notsu, K., and Mori, T. (2010). Chemical monitoring of volcanic gas using remote FT-IR spectroscopy at several active volcanoes in Japan. Appl. Geochem. 25, 505–512. doi:10.1016/j.apgeochem.2010.01.008
Perot, A., and Fabry, C. (1899). On the application of interference phenomena to the solution of various problems of spectroscopy and metrology. Astrophysical J. 9, 87. doi:10.1086/140557
Platt, U., Bobrowski, N., and Butz, A. (2018). Ground-based remote sensing and imaging of volcanic gases and quantitative determination of multi-species emission fluxes. Geosciences 8, 44. doi:10.3390/geosciences8020044
Platt, U., Lübcke, P., Kuhn, J., Bobrowski, N., Prata, F., Burton, M., et al. (2015). Quantitative imaging of volcanic plumes - results, needs, and future trends. J. Volcanol. Geotherm. Res. 300, 7–21. doi:10.1016/j.jvolgeores.2014.10.006
Platt, U., and Stutz, J. (2008). Differential optical absorption spectroscopy. Berlin Heidelberg: Springer. 978-3-540-21193-8.
Platt, U., Wagner, T., Kuhn, J., and Leisner, T. (2021). The “ideal” spectrograph for atmospheric observations. Atmos. Meas. Tech. 14, 6867–6883. doi:10.5194/amt-14-6867-2021
Pouclet, A., and Bram, K. (2021). Nyiragongo and nyamuragira: A review of volcanic activity in the kivu rift, Western branch of the East African Rift system. Bull. Volkanology 83, 10. doi:10.1007/s00445-021-01435-6
Prata, A. J., and Bernardo, C. (2014). Retrieval of sulfur dioxide from a ground-based thermal infrared imaging camera. Atmos. Meas. Tech. 7, 2807–2828. doi:10.5194/amt-7-2807-2014
Prata, A. J., and Bernardo, C. (2007). Retrieval of volcanic SO2 column abundance from atmospheric infrared sounder data. J. Geophys. Res. 112, D20204. doi:10.1029/2006jd007955
Roberts, T., Dayma, G., and Oppenheimer, C. (2019). Reaction rates control high-temperature chemistry of volcanic gases in air. Front. Earth Sci. 7. doi:10.3389/feart.2019.00154
Rothman, L., Gordon, I., Babikov, Y., Barbe, A., Benner, D. C., Bernath, P., et al. (2013). The HITRAN2012 molecular spectroscopic database. J. Quantitative Spectrosc. Radiat. Transf. 130, 4–50. doi:10.1016/j.jqsrt.2013.07.002
Rüdiger, J., Gutmann, A., Bobrowski, N., Liotta, M., de Moor, J. M., Sander, R., et al. (2021). Halogen activation in the plume of masaya volcano: Field observations and box model investigations. Atmos. Chem. Phys. 21, 3371–3393. doi:10.5194/acp-21-3371-2021
Rufus, J., Stark, G., Smith, P. L., Pickering, J. C., and Thorne, A. P. (2003). High-resolution photoabsorption cross section measurements of SO2, 2: 220 to 325 nm at 295 k. J. Geophys. Res. Planets 108, E2. doi:10.1029/2002je001931
Sawyer, G. M., Carn, S. A., Tsanev, V. I., Oppenheimer, C., and Burton, M. (2008). Investigation into magma degassing at nyiragongo volcano, democratic republic of the Congo. Geochem. Geophys. Geosystems 9, 2. doi:10.1029/2007gc001829
Serdyuchenko, A., Gorshelev, V., Weber, M., Chehade, W., and Burrows, J. P. (2014). High spectral resolution ozone absorption cross-sections - part 2: Temperature dependence. Atmos. Meas. Tech. 7, 625–636. doi:10.5194/amt-7-625-2014
Smittarello, D., Smets, B., Barrière, J., Michellier, C., Oth, A., Shreve, T., et al. (2022). Precursor-free eruption triggered by edifice rupture at nyiragongo volcano. Nature 609, 83–88. doi:10.1038/s41586-022-05047-8
Spilliaert, N., Metrich, N., and Allard, P. (2006). S-cl-f degassing pattern of water-rich alkali basalt: Modelling and relationship with eruption styles on mount etna volcano. Earth Planet. Sci. Lett. 248, 772–786. doi:10.1016/j.epsl.2006.06.031
Stephens, G. L., and Platt, C. (1987). Aircraft observations of the radiative and microphysical properties of stratocumulus and cumulus cloud fields. J. Appl. Meteorology Climatol. 26, 1243–1269. doi:10.1175/1520-0450(1987)026<1243:aootra>2.0.co;2
Stone, D., Whalley, L. K., and Heard, D. E. (2012). Tropospheric OH and HO2 radicals: Field measurements and model comparisons. Chem. Soc. Rev. 41, 6348. doi:10.1039/c2cs35140d
Strutt, J. (1871). XV. on the light from the sky, its polarization and colour. Lond. Edinb. Dublin Philosophical Mag. J. Sci. 41, 107–120. doi:10.1080/14786447108640452
Symonds, R. B., Rose, W. I., Bluth, G. J. S., and Gerlach, T. M. (1994). Volcanic-gas studies; methods, results, and applications. Rev. Mineralogy Geochem. 30, 1–66.
Taquet, N., Hernández, I. M., Stremme, W., Bezanilla, A., Grutter, M., Campion, R., et al. (2017). Continuous measurements of SiF 4 and SO 2 by thermal emission spectroscopy: Insight from a 6-month survey at the popocatépetl volcano. J. Volcanol. Geotherm. Res. 341, 255–268. doi:10.1016/j.jvolgeores.2017.05.009
Tedesco, D., Vaselli, O., Papale, P., Carn, S. A., Voltaggio, M., Sawyer, G. M., et al. (2007). January 2002 volcano-tectonic eruption of nyiragongo volcano, democratic republic of Congo. J. Geophys. Res. 112, B09202. doi:10.1029/2006jb004762
Theys, N., Hedelt, P., Smedt, I. D., Lerot, C., Yu, H., Vlietinck, J., et al. (2019). Global monitoring of volcanic SO2 degassing with unprecedented resolution from TROPOMI onboard sentinel-5 precursor. Sci. Rep. 9, 2643. doi:10.1038/s41598-019-39279-y
Toon, G. C. (2015). Solar line list for the tccon 2014 data release. doi:10.14291/TCCON.GGG2014.SOLAR.R0/1221658
Valade, S., Ripepe, M., Giuffrida, G., Karume, K., and Tedesco, D. (2018). Dynamics of mount nyiragongo lava lake inferred from thermal imaging and infrasound array. Earth Planet. Sci. Lett. 500, 192–204. doi:10.1016/j.epsl.2018.08.004
Varon, D. J., Jervis, D., McKeever, J., Spence, I., Gains, D., and Jacob, D. J. (2021). High-frequency monitoring of anomalous methane point sources with multispectral sentinel-2 satellite observations. Atmos. Meas. Tech. 14, 2771–2785. doi:10.5194/amt-14-2771-2021
Vaughan, M. (1989). The Fabry-Pérot interferometer history, theory, practice and applications. Boca Raton: CRC Press. 978-08-527-4138-2.
Wagner, T., Apituley, A., Beirle, S., Dörner, S., Friess, U., Remmers, J., et al. (2014). Cloud detection and classification based on MAX-DOAS observations. Atmos. Meas. Tech. 7, 1289–1320. doi:10.5194/amt-7-1289-2014
Wagner, T., Dix, B., von Friedeburg, C., Frieß, U., Sanghavi, S., Sinreich, R., et al. (2004). MAX-DOAS O4 measurements: A new technique to derive information on atmospheric aerosols - principles and information content. J. Geophys. Res. 109, D22205. doi:10.1029/2004JD004904
Wagner, T., Dörner, S., Beirle, S., Donner, S., and Kinne, S. (2021). Quantitative comparison of measured and simulated O4 absorptions for one day with extremely low aerosol load over the tropical atlantic. Atmos. Meas. Tech. 14, 3871–3893. doi:10.5194/amt-14-3871-2021
Warnach, S., Bobrowski, N., Hidalgo, S., Arellano, S., Sihler, H., Dinger, F., et al. (2019). Variation of the BrO/SO2 molar ratio in the plume of tungurahua volcano between 2007 and 2017 and its relationship to volcanic activity. Front. Earth Sci. 7. doi:10.3389/feart.2019.00132
Keywords: Fabry-Pérot interferometer, remote sensing, volcanic gases, spectroscopy, hydroxyl radical, halogens
Citation: Kuhn J, Bobrowski N, Boudoire G, Calabrese S, Giuffrida G, Liuzzo M, Karume K, Tedesco D, Wagner T and Platt U (2023) High-spectral-resolution Fabry-Pérot interferometers overcome fundamental limitations of present volcanic gas remote sensing techniques. Front. Earth Sci. 11:1039093. doi: 10.3389/feart.2023.1039093
Received: 07 September 2022; Accepted: 03 February 2023;
Published: 01 March 2023.
Edited by:
Christoph Kern, United States Geological Survey (USGS), United StatesReviewed by:
Emmanuel Dekemper, The Royal Belgian Institute for Space Aeronomy (BIRA-IASB), BelgiumAndrea Gabrieli, University of Hawaii at Manoa, United States
Copyright © 2023 Kuhn, Bobrowski, Boudoire, Calabrese, Giuffrida, Liuzzo, Karume, Tedesco, Wagner and Platt. This is an open-access article distributed under the terms of the Creative Commons Attribution License (CC BY). The use, distribution or reproduction in other forums is permitted, provided the original author(s) and the copyright owner(s) are credited and that the original publication in this journal is cited, in accordance with accepted academic practice. No use, distribution or reproduction is permitted which does not comply with these terms.
*Correspondence: Jonas Kuhn, amt1aG5AaXVwLnVuaS1oZWlkZWxiZXJnLmRl