 Xochilt Gutiérrez1
 Nicole Bobrowski2,3*
 Julian Rüdiger4
 Marcello Liotta5Bastien Geil1Thorsten Hoffmann1Eduardo Gutiérrez1Florian Dinger2,6Francisco Montalvo7
 Mirian Villalobos7Demetrio Escobar7
- 1Institute of Inorganic and Analytical Chemistry, Johannes Gutenberg—University Mainz, Mainz, Germany
- 2Institute of Environmental Physics, University of Heidelberg, Heidelberg, Germany
- 3Istituto Nazionale di Geofisica e Vulcanologia—Osservatorio Etneo, Catania, Italy
- 4Umweltbundesamt, Langen, Germany
- 5Instituto Nazionale di Geofisica e Vulcanologia—Sezione di Palermo, Palermo, Italy
- 6Max-Planck Institute for Chemistry, Mainz, Germany
- 7Observatorio Ambiental, Área de Vulcanología, Ministerio de Medio Ambiente y Recursos Naturales, San Salvador, El Salvador
Volcanic degassing provides important information for the assessment of volcanic hazards. Santa Ana and San Miguel are open vent volcanoes along the Central American Volcanic Arc–CAVA, where the magmatism, basaltic to dacitic, is related to the near-orthogonal convergence of the Caribbean Plate and the subducting Cocos Plate. Both volcanoes are the most active ones in El Salvador with recent eruptive events in October 2005 (Santa Ana) and December 2013 (San Miguel), but still not much data on gas composition and emission are available today. At each volcano, SO2 emissions are regularly monitored using ground-based scanning Differential Optical Absorption Spectrometer (Scan-DOAS) instruments that are part of the global “Network for Observation of Volcanic and Atmospheric Change” (NOVAC). We used the data series from these NOVAC stations in order to retrieve SO2 and minimum bromine emissions, which can be retrieved from the same spectral data for the period 2006–2020 at Santa Ana and 2008–2019 at San Miguel. However, BrO was not detected above the detection limit. SO2 emission ranged from 10 to 7,760 t/d, and from 10 to 5,870 t/d for Santa Ana and San Miguel, respectively. In addition, the SO2 emissions are complemented with in situ plume data collected during regular monitoring surveys (2018–2020) and two field campaigns in El Salvador (2019 and 2020). MultiGAS instruments recorded CO2, SO2, H2S and H2 concentrations. We determined an average CO2/SO2 ratio of 2.9 ± 0.6 when peak SO2 concentration exceeded 15 ppmv at Santa Ana, while at San Miguel the CO2/SO2 ratio was 7.4 ± 1.8, but SO2 levels reached only up to 6.1 ppmv. Taking into account these ratios and the SO2 emissions determined in this study, the resulting CO2 emissions are about one order of magnitude higher than those determined so far for the two volcanoes. During the two field campaigns Raschig tubes (active alkaline trap) were used to collect plume samples which were analyzed with IC and ICP-MS to identify and quantify CO2, SO2, HCl, HF, and HBr. Additionally, also 1,3,5-trimethoxybenzene (TMB)-coated denuders were applied and subsequently analyzed by GC-MS to determine the sum of the reactive halogen species (RHS: including Cl2, Br2, interhalogens, hypohalous acids). The RHS to sulfur ratios at Santa Ana and San Miguel lie in the range of 10−5. Although no new insights could be gained regarding changes with volcanic activity, we present the most comprehensive gas geochemical data set of Santa Ana and San Miguel volcanoes, leading to a solid data baseline for future monitoring purposes at both volcanoes and their improved estimate of CO2, SO2 and halogens emissions. Determining the reactive fraction of halogens is a first step towards a better understanding of their effects on the atmosphere.
1 Introduction
Magma degassing and post-magmatic processes (e.g., processes occurring in hydrothermal systems and/or volcanic aquifers) contribute to the chemical composition of volcanic gas emissions. Studying changes in volcanic gas release and separating these processes allows volcanologists to understand the processes that control volcanic activity and, when this occurs over time, to detect signs of unrest. SO2 emissions are considered a fundamental monitoring tool, which can be measured using remote sensing techniques. Differential optical absorption spectroscopy (DOAS) is a well-established method to measure volcanic SO2 emission rates on a regular basis. In the global Network for Observation of Volcanic and Atmospheric Change (NOVAC), approximately 80 DOAS scanners are in operation at 37 volcanoes (Galle et al., 2010; Arellano et al., 2021). Typically, SO2 flux measurements are combined with in situ gas measurements of SO2 and other volatiles (e.g., CO2, H2S) to assess changes in the volcanic activity. Multisensor instruments (MultiGAS) are often used for this purpose, allowing real-time measurements of multiple gases simultaneously (Aiuppa et al., 2005; Shinohara, 2005; Roberts et al., 2014). When suitable real-time sensors are not available for the species of interest, in situ measurements can be made by using for instance sampling flasks filled with alkaline solutions (e.g., Noguchi and Kamiya, 1993; Symonds et al., 1994; Wittmer et al., 2014). Recently, Rüdiger et al. (2017) presented an in situ method to quantify the amount of reactive halogen species (Cl2, Br2, interhalogens, hypohalous acids) using in situ derivatizing agents applied in diffusion denuders. This method has demonstrated the importance of in situ measurements not only for monitoring volcanic emissions, but also for increasing our knowledge of the role of volcanic halogen emissions in the atmosphere. Each of the aforementioned techniques has individual advantages and disadvantages, but their simultaneous application allows for an integrated approach to the geochemical characterization of a volcano (Symonds et al., 1994; Aiuppa, 2015).
In the beginning of the study we will summarize the limited existing measurements from two volcanic systems Santa Ana and San Miguel, in El Salvador. This summary underscores the importance and need for further studies to determine the gas composition of these volcanoes. The purpose of our comprehensive geochemical gas study is to improve the understanding of the state of volcanic activity of San Miguel and Santa Ana by analyzing long-term SO2 measurements from NOVAC stations, complemented by MultiGAS data collected during regular monitoring (2018–2020) and dedicated field campaigns (2019–2020) including other species (e.g., halogens).
1.1 Santa Ana
Santa Ana volcano (13.853°N, 89.630°W), also known as Ilamatepec, is the highest volcano in El Salvador (2,381 m above sea level (a.s.l)), and is located 40 km west of the capital city, San Salvador (>1.7°million inhabitants) and 15 km from Santa Ana city (>550,000 inhabitants). This active stratovolcano is part of the Santa Ana-Izalco-Coatepeque volcanic complex Figure 1 A and B, which lies in a late Pliocene or early Pleistocene depression (Central American Graben; e.g., Mann et al., 2004) On its northeast flank is the Coatepeque caldera, an elliptical depression of 6.5 × 10.5 km, and on its south-southeast flank, are Izalco volcano and other numerous older cinder cones and explosion craters in the area. The edifice consists of a large cone with four concentric craters on its summit, the largest one with a radius of 1.5 km, and the innermost one with a radius of 0.5 km. The latter crater was formed after the 1904 eruption and hosts a small (∼200 m diameter) acidic lake and an adjacent fumarole field on the western crater wall (Bernard et al., 2004; Laiolo et al., 2017).
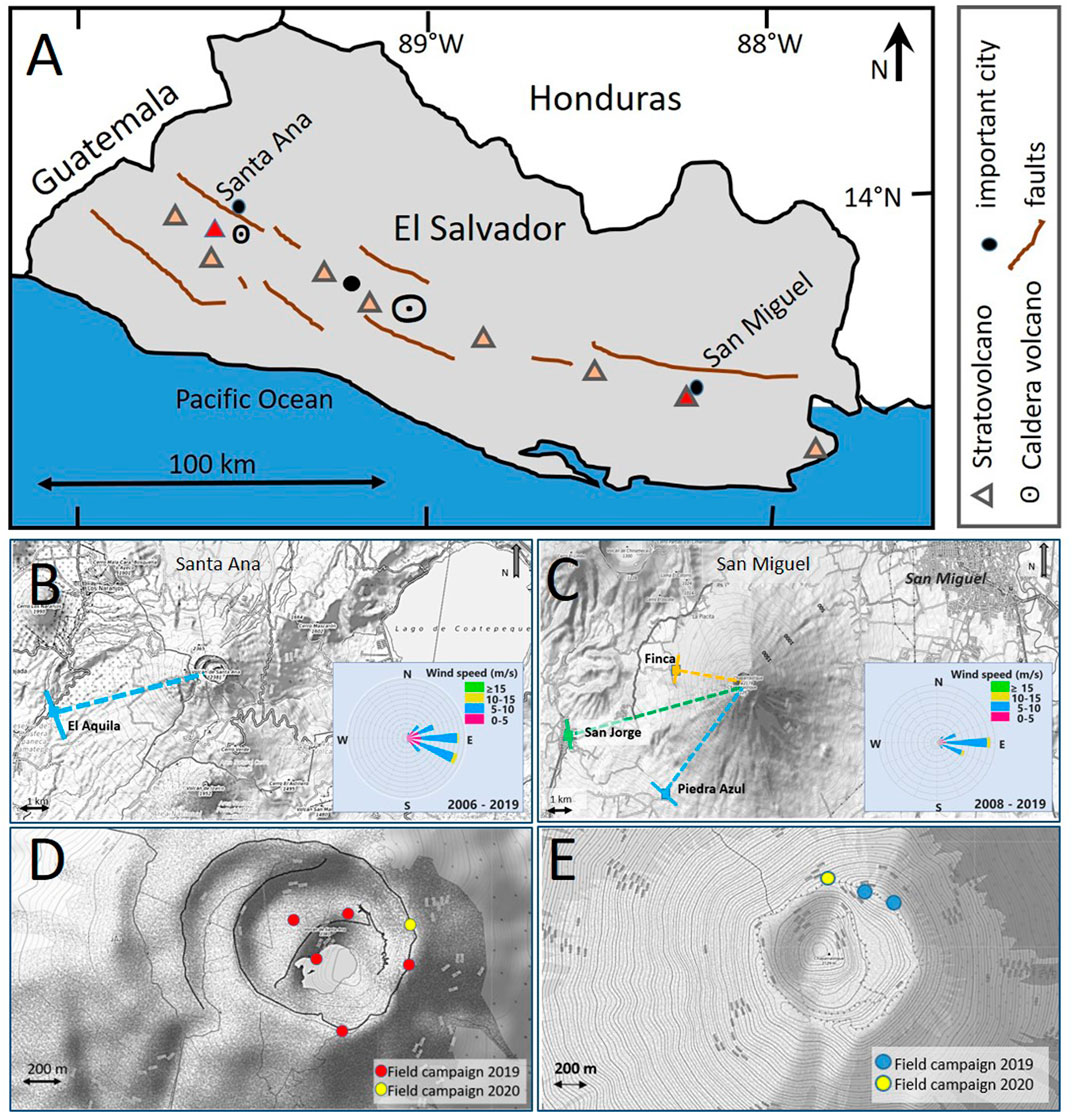
FIGURE 1. Geographical and geological information on the study area (A) overview of the major volcano-structural features in El Salvador adapted from Mann et al., 2004. In (B) and (C) Scan geometry and wind rose displaying from where the wind is blowing at (B) El Águila station, 5.8 Km from Santa Ana volcano and (C) Piedra Azul, Finca and San Jorge stations downwind San Miguel volcano. In-situ sampling sites are displayed in (D) for Santa Ana volcano, and (E) San Miguel volcano during the 2019 and 2020 surveys.
Continuous activity and at least 12 explosive eruptions have been documented since the first Spanish expedition to El Salvador in the 16th century. Meyer-Abich. (1956) reported that the activity of Ilamatepec was limited to hydrothermal or phreatic activity since the 1920 eruption, which almost completely evaporated the crater lake at that time. In January 2000, the presence of a high-temperature fumarole (532°C) was observed on the west side of the lake, followed by an increase in the degassing rate without increase of seismicity (Bernard et al., 2004). In February 2001 very high fumarole temperatures of up to 875°C were measured and Rodriguez et al. (2004) reported sulfur dioxide emission rates that ranged from 30 to 280 t/d at Santa Ana volcano, undertaking ground-based correlation spectrometer (COSPEC) measurements in the same month. In March 2001 SO2 fluxes measured again by stationary and vehicular COSPEC ranged from 244 to 393 t/d (Global Volcanism Program, 2001—GVP Bulletin). In addition, Salazar et al. (2004) determined the diffuse emission of carbon dioxide from the Santa Ana-Izalco-Coatepeque volcanic complex using the accumulation chamber technique during a survey in March 2001. The total diffuse CO2 emission for this volcanic complex was estimated to be ∼600 t/d. These studies constitute the first published data from measurements of emitted gases at this volcano. In a further field survey in January 2002, Rodriguez et al. (2004) determined SO2 emission rates in a similar range with values ranging between 10 and 220 t/d.
Signs of unrest were observed at the crater in mid-2004 (e.g., intense degassing, hydrothermal activity and high-temperature fumaroles), that culminated in the 01 October 2005 eruption. The activity and evolution of the crater lake before and after this event are well documented (Bernard et al., 2004; Hernández et al., 2007; Colvin et al., 2013; Laiolo et al., 2017). Table 1 shows the variations in temperature (16–66°C), pH (≤1–2.5) and chemistry of the crater lake. SO2 fluxes determined with mobile and stationary differential optical spectrometers (scanning-DOAS) in 2004–2005 were also reported (Olmos et al., 2007). These studies allowed the calculations of SO2 fluxes listed in Table 2. For many years thereafter, very few studies have published SO2 fluxes and water composition data (Colvin et al., 2013; Hasselle et al., 2019; Arellano et al., 2021).
TABLE 1. Santa Ana volcano crater lake chemistry.
TABLE 2. Published sulfur dioxide fluxes emitted by Santa Ana volcanoes between 2000–2018.
In a study presented by Hasselle et al. (2019), SO2 fluxes (Table 2) and measurements of gas composition (H2O, CO2, SO2, H2S and H2) from gas plumes released from the crater lake were determined using the observatory’s NOVAC station and a multicomponent gas analyzer system (MultiGAS), respectively. Total volatile fluxes of 20,200–30,200 ton/d and 900–10,167 t/d were reported for 2017 and 2018, respectively, which includes water vapor. These results highlight the dynamic nature of the lake, the rapid changes in its composition and the need for further monitoring.
1.2 San Miguel
San Miguel volcano, also called Chaparrastique, is an active volcano in the eastern part of El Salvador (13.434°N, 88.269°W). It rises 2,310 m a.s.l near and is located at about 11 km distance from the municipalities of San Miguel, El Tránsito, San Rafael Oriente, and San Jorge. It lies on the eastern section of the Central Graben of the country, which is crossed by the regional NW-SE fault system (Bonforte et al., 2016). Its northern flank extends to the San Esteban river, while its western flank is truncated against the Ojo de Agua (Cerro El Limbo) and Chinameca (Cerro El Pacayal) volcanoes (Chesner et al., 2004).
This stratovolcano has a symmetrical cone shape. The edifice consists of two main cones, the ancestral cone to the east of the summit, and a younger cone formed by the collapse of the ancestral one with a central crater ∼900 m in diameter and several adventive cones (Escobar, 2003).
Over the past 500 years, more than 28 volcanic eruptions and unrest periods have been recorded (Escobar, 2003; Chesner et al., 2004). According to the local observatory, the 1699 eruption was identified as the first historical eruption, consisting of a large lava flow that descended about 8 km from its source vent to the southeast flank of the volcano at 480 m a.s.l (Jiménez et al., 2020). During the period from January 1999 to December 2000, measurements of diffuse soil gases (radon, thoron, mercury and carbon dioxide) were made at San Miguel volcano to understand gas flow within the volcanic edifice and the status of volcanic activity. The low CO2 fluxes obtained in that study (less than 0.1–5.0 g/m2d), were interpreted as low permeability of the volcanic edifice caused by lava flows which covered the sampling locations rather than with low gas fluxes (Cartagena et al., 2004).
Later, Pérez et al. (2006) reported an average CO2 fluxes of 29.4 g/m2d for the period of November 2001 to March 2002, using an automated station on the eastern flank of San Miguel volcano (594 m a.s.l). In this survey the authors detected an increased flux (270 g/m2d) for the January 2002 short-term unrest at San Miguel volcano and statistically estimated a rate of 16 g/m2d as a background value for the volcano, considering larger rates as anomalous.
Sulfur dioxide fluxes were first estimated by Rodriguez et al. (2004) based on ground-based COSPEC measurements during the January 2002 unrest. The average emission was between 220 and 280 t/d. No previous measurements have been documented and there are no published data for more than 10 years after the ones from Rodriguez et al. (2004). In December 2013, San Miguel volcano erupted after 46 years of weak activity. Granieri et al. (2015) reported SO2 emissions gained by the NOVAC stations, ∼8 km from the summit crater and normally used for continuous monitoring by the observatory; and a FLAME station, located 2.7 km from the crater, used by INGV between January 30 and 21 February 2014. The observed rates were: ∼310 t/d, 1 year before the eruption; between 330–2,200 t/d during eruption; and 680 t/d after eruption.
Moreover, average 640 t/d CO2 emission rates calculated from MultiGAS system data and the scan-DOAS station data for the period January-February 2014 are presented in that study. In addition, the first halogen emission rates using FTIR spectrometer measurements were presented for the same period (∼90 t/d for HCl and ∼10 t/d for HF).
2 Methods
2.1 DOAS measurements
In this study, SO2 emissions are determined by using two scanning DOAS systems, one of which is installed at Santa Ana volcano and one at San Miguel volcano, nowadays at 6 and 8 km downwind, respectively. These stations are part of NOVAC, which is operated in El Salvador by the Ministerio de Medio Ambiente y Recursos Naturales (MARN) - Observatorio Ambiental, the national institution responsible for the study and research of natural phenomena in the country. The El Águila (Santa Ana volcano) and Piedra Azul (San Miguel volcano) stations (spectrometer number D2J2167 and D2J2170, respectively) have been in operation since 2006 and 2008, respectively. However, the instrument at Piedra Azul was removed due to technical problems, and a new station with a different spectrometer was established at San Jorge. From 2014 to 2016 the NOVAC station at Piedra Azul was replaced by another instrument which had been installed at a distance of only 2.8 km from the summit, at Finca (see Figure 1). Afterwards, in 2017, the former San Jorge station could be reactivated and since then it is the only working NOVAC-station at San Miguel volcano. Summary information about the stations and their locations is presented in Table 3.

TABLE 3. NOVAC stations settings for Santa Ana and San Miguel volcanoes.
Each station records spectra during daylight hours (6 a.m.–6 p.m.). Each instrument consists of an UV-spectrometer (Ocean Optics®, S2000: 274.3–424.8 nm for El Águila; 277.1–425.8 nm for Piedra Azul; 278.7–424.4 nm for Finca and 474.4–409.0 nm for San Jorge), connected to a telescope (field of view 8 mrad) via a quartz fiber and collecting backscattered sunlight through a motor-driven mirror; each measurement sequence scans the sky in a vertical plane of 180°, from horizon to horizon, with angular steps of 3.6°. More details about the NOVAC instruments can be found in Galle et al. (2010). The instrument is controlled by a microcomputer, which is also used to store and transmit the measurements via radio link to the observatory, where the measurements are downloaded and analyzed using the Novac Program (Galle et al., 2010). Data collected from the stations were used here to retrieve SO2 and BrO gas emissions from Santa Ana and San Miguel volcanoes for the period 2006–2020 and 2008–2019, respectively. Datasets were provided by the observatory, with some gaps due to instrument failures. The analysis is based on Lübcke et al., 2014 and Dinger et al. (2021), who performed the following: 1) a quality check of individual spectra from a scan, 2) a retrieval of the spatial SO2 distribution, 3) a spectral addition of scan spectra to perform the SO2 and BrO DOAS fitting, 4) a spectral addition of successive scans to further improve the signal-to-noise of the BrO fitting. The results of this evaluation are time series of SO2 and BrO slant column densities (SCDs) (Figure 2); and in principle daily BrO/SO2 ratios. Unfortunately, BrO was not significantly exceeding the detection limit. In addition, this approach allows the calculation of the SO2 emission fluxes when meteorological data are available via
where
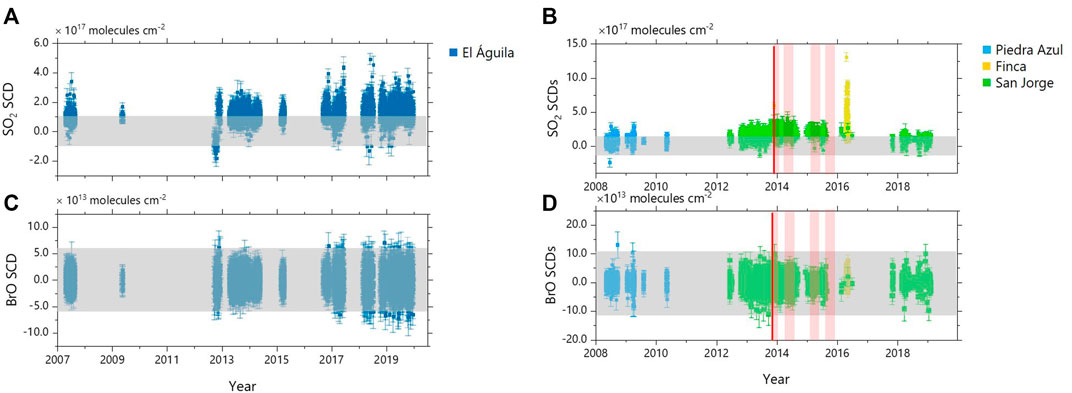
FIGURE 2. Time series of SCD’s of SO2 and BrO for Santa Ana (A–C) and San Miguel (B–D). Red line indicates eruption, red shadow points out periods of increase of activity, including ash emissions. NOVAC stations are indicated by different colors. Gray shadow indicates the limit of detection (LOD).
2.2 In-situ measurements
Sampling locations were selected based on accessibility and prevailing wind direction to obtain measurements of the fumarole degassing on the inner flanks of the summit crater of each volcano (Figures 1D, E), given that it is difficult to sample the fumaroles directly. Measurements were made as part of regular monitoring surveys by the local observatory and during our field campaigns for detailed studies.
2.2.1 MultiGAS
Two different portable instruments were used during the field campaigns: Pitsa (PT) (Tirpitz et al., 2019) and Sunkist (SK) (Rüdiger et al., 2018), both developed by the University of Heidelberg, Germany. PT was used only for measurements on Santa Ana’s plateau (∼200 m from the crater lake), during the 2019 survey. The SK instrument (Hasselle et al., 2019) is a smaller MultiGAS version designed for use onboard an unmanned aerial vehicle (UAV). In February 2019, measurements with SK were made over the crater lake at Santa Ana, with the UAV flying between several tens of meter above the lake and staying below the height of the crater rim and on the ground at the rim of San Miguel. The observatory conducted measurements with a third portable MultiGAS instrument, here called SN, for gas measurements of CO2, SO2 and H2S and H2 on the plateau and rim of Santa Ana and San Miguel as regular monitoring of the volcanoes between 2018 and 2020. This system also includes sensors for temperature (T), pressure (P) and relative humidity (Rh), which allow the calculation of H2O mixing ratios.
In the field, each device draws the volcanic gases through a PTFE (Polytetrafluorethylene) inlet filter with a pore size of 45 μm to the corresponding gas sensors. The sensors are read by a microcontroller equipped with a microSD card logger (Rüdiger et al., 2018). Sensor from PT and SK were calibrated in the laboratory using test gas standards (200 ppm SO2 in N2, 5,000 ppm CO2 in N2, All-in-Gas e.K., München, Germany) prepared in different gas mixtures in Tedlar® bags. The sensors were exposed to these gas mixtures by pumping the gas through the MultiGAS system before every field campaign for six different gas mixtures for SO2 (2–200 ppm) and two gas mixtures for CO2 (2,500–5,000 ppm). The recorded field data were post-processed using the RatioCalc program (Tamburello, 2015) to obtain time series of X/SO2 mixing ratios (X: CO2, H2S, H2, H2O). Specific acquisition time windows or subintervals were selected, and molar ratios were determined by the best-fitting regression line in scatter plots of volatile pairs. If volcanic gases were excessively dilute (e.g., SO2 < 3.0 ppmv) or if the correlation coefficient was low (R2 < 0.5), no ratio calculated during the subintervals was considered.
2.2.2 Active alkaline trap
Active alkaline traps, as used in this work, refers to the use of a Raschig-tube device (RT) (Wittmer et al., 2014), consisting of a glass cylinder containing little glass rings (Raschig rings), wetted with 50 ml of aqueous 1 M NaOH solution (EMSURE® ≥ 99.0%, Sigma Aldrich) as trapping medium. Homogeneous wetting is achieved by rotating the RT during the sampling period using a geared motor. Before each measurement, the tube is cleaned with ultra-pure water. During sampling, the RT collects the acid gases through an inlet with a flow rate of 4 L min−1 using a GilAir Plus™ pump (Sensidyne, St. Petersburg, FL, United States). The collected samples were stored, prepared and analyzed according to Wittmer et al. (2014) at the Instituto Nazionale di Geofisica e Vulcanologia–Sezione di Palermo in Italy. For this purpose, an ion chromatograph (Dionex ICS-1100, Thermo Fischer Scientific, Massachusett, United States) was equipped with an AS14A column (1 ml min−1 flow rate), an AERS 500e suppressor, and a 100 µL sample loop. This instrument was used to analyze Cl−, SO42- and F− species. In addition, samples from the 2019 survey were also analyzed for HBr and HI by ICP-MS (Agilent 7500 CE). Carbon dioxide in this type of samples was determined by volumetric titration adding 0.1 M HCl solution to 0.5 ml of the sample dissolved in 35 ml of CO2-free water (Geil, 2021).
2.2.3 Gas diffusion denuder
Reactive halogen species were collected using TMB-coated denuders prepared with brown borosilicate glass tubes (6 mm i.d., length 50 cm) and a 15 mM TMB (≥99.0%, Merck Germany) solution in methanol (HPLC-Grade, Merck Germany) according to Rüdiger et al. (2017). In-situ sampling was performed at Santa Ana and San Miguel volcanoes, using two denuders in a serial setup with a GilAir Plus pump at a flow of 250 ml min−1. The measurements were performed simultaneously with the RT-instrument. The collected samples were analyzed following Rüdiger et al. (2017), at the Institute of Inorganic and Analytical Chemistry, JGU Mainz in Germany, using an Agilent 6850 Network GC and Agilent 5973 Network Mass Selective Detector (Agilent Technologies, Inc. Santa Clara, CA, United States).
3 Results
3.1 SO2 and BrO SCDs
Here we present a description of the SO2 and BrO SCD’s retrieved from the NOVAC stations at Santa Ana and San Miguel volcanoes, with its respective limit of detection (LOD), calculated as four times the fitting error (Stutz and Platt, 1996; Lübcke et al., 2014). At Santa Ana, ∼50% of the total SO2 SCD’s exceed the LOD, while at San Miguel ∼40% of the data exceed this limit (Table 4). Our results demonstrate relatively low SO2 emissions compared to high emitting volcanoes (e.g., Etna, Nyiragongo, Cotopaxi, Masaya) that have SO2 SCDs >2 × 10¹⁸ molecules cm−2 (Bobrowski et al., 2007; Bobrowski and Giuffrida, 2012; Dinger et al., 2021; Dinger et al., 2021). BrO was not detected above the LOD (6.0 × 10¹³ molecules cm−2 and 11.0 × 10¹³ molecules cm−2 for Santa Ana and San Miguel, respectively). Expected SCDs for this gas would be in the range between (1.0–10) × 1013 molecules cm−2 during quiescent periods (e.g., Pacaya), and eventually (1.5–6.0) × 1014 molecules cm−2 during eruptive periods (e.g., Masaya). Although the maximum values (in total a number of fourteen values for Santa Ana and one for San Miguel) are above our respective LOD, these correspond to single measurements within the 10 + years of recorded measurements. Each of those spectra were manually checked and none of them showed a visible clear definite absorption structure. However, BrO production within the plume cannot be excluded, but it has not been detectable.
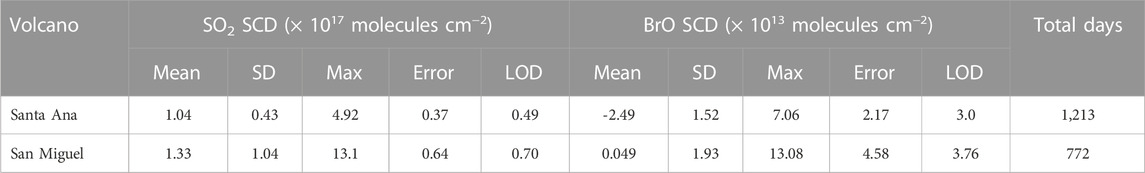
TABLE 4. SO2 and BrO SCD’s in the gas plume of Santa Ana and San Miguel volcanoes between 2008–2020.
3.2 SO2 emission fluxes
SO2 fluxes were calculated as described in section 2.1, using the SO2 SCDs of each volcano and assuming a fixed plume height according to the summits’ height (Figure 3). The daily average SO2 flux (±1 standard deviation) for Santa Ana results in 470.0 ± 414.69 t/d with a maximum of 7,757.98 t/d in January 2009 and a minimum of 10.28 t/d in June 2008 (Table 5). San Miguel shows a daily average of 903.88 ± 599.49 SO2 t/d with a maximum of 5,868.93 t/d in July 2014, and a minimum of 10.47 t/d in June 2015.
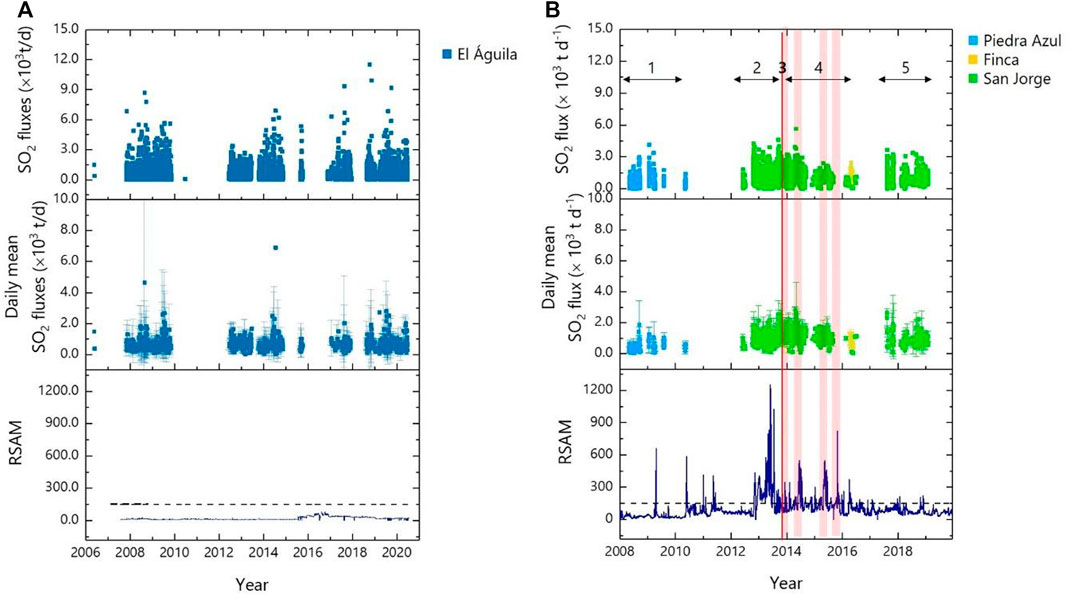
FIGURE 3. Temporal variation of SO2 fluxes and RSAM of (A) Santa Ana and (B) San Miguel volcanoes. Red line indicates eruption, red shadow points out periods of increase of activity, black dash line shows the RSAM threshold.
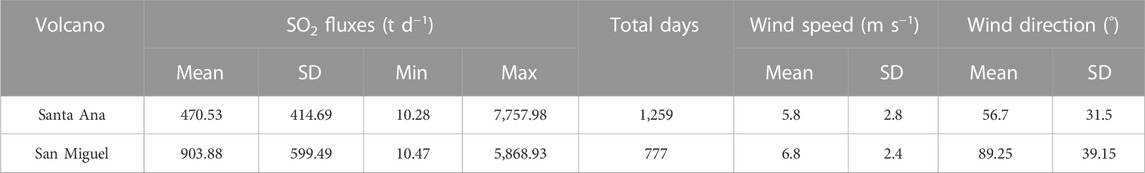
TABLE 5. SO2 in the gas plume of Santa Ana and San Miguel volcanoes between 2008–2020.
During the analyzed period at San Miguel an eruption was recorded on 29 December 2013. Our results show that: 1) before the unrest of the volcano, between July 2008 and September 2012, the SO2 emission had an average value of 474.0 ± 376.57 t/d, 2) in the year of the eruption, between January and December 2013, the SO2 emissions increased with a daily mean of 1,032.13 ± 581.47 t/d, 3) during the eruption, on 29 and 30 December 2013 the daily mean SO2 rate increased to a maximum value of 2,378.85 ± 978.21 t/d, 4) during the post-eruption period when smaller explosions were reported by the local observatory, between February 2014 and September 2016, the SO2 rates observed had a small decrease with a daily mean of 1,077.41 ± 590.86 t/d, and 5) between October 2017 and April 2019, a passive degassing period has followed with an average SO2 emissions of 765.710 ± 610.14 t/d. The average SO2 rates of the eruptive event were ∼23–40% higher than those of the passive degassing periods and ∼50% higher than those of the preceding and post-eruptive periods. Granieri et al. (2015) reported an average value of SO2 emissions of 310 ± 170 t/d for the year 2013, values between 640 and 1,240 t/d during the eruption on 29 and 30 December, and an average of 680 ± 220 t/d for the period following the eruption in January - February 2014. These emissions are ∼25% higher than those of the year 2013 and >50% higher than the post-eruptive months, which is in agreement with our estimations.
3.3 Molar carbon dioxide, hydrogen and water to sulfur dioxide ratios (X/SO2)
During our observations between 2018 and 2020, both volcanoes were in a state of passive degassing activity with plumes associated with their respective fumaroles and Santa Ana crater lake. The maximum gas concentrations we measured using the MultiGAS instruments were: 33.6 ppmv SO2, 73.2 ppmv CO2, 63.4 ppmv H2 and 11.0 ppmv H2S for Santa Ana and 12.65 ppmv SO2, 76.9 ppmv CO2, 8.9 ppmv H2 and 1.7 ppmv H2S for San Miguel. The recorded datasets from the MultiGAS instruments were post-processed using the RatioCalc program (Tamburello, 2015) to obtain concentration ratios from the correlation of the measured gases. Ratios calculated from subintervals were not considered if excessive volcanic gas dilution was present (e.g., SO2 < 3.0 ppmv) or a low correlation coefficient was determined (R2 < 0.5) between gases (Table 6), following Aiuppa et al. (2018).
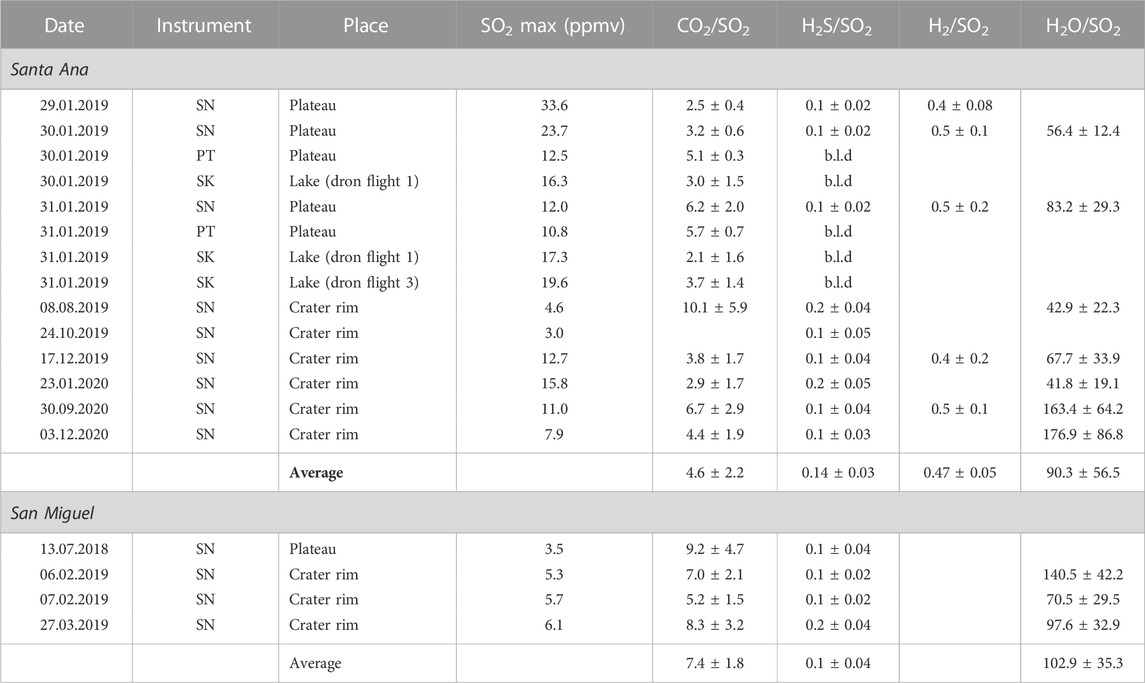
TABLE 6. Daily mean gas mixing ratios observed at Santa Ana and San Miguel volcanoes, using the portable MultiGAS devices.
Figure 4A shows the molar X/SO2 ratios as time series for both volcanoes. Moderate variations were observed for Santa Ana’s CO2/SO2 ratios, ranging from 2.1 to 10.1, while San Miguel ratios range from 5.2 to 9.2. Previous studies have described that CO2/SO2 ratio population is often inversely correlated to peak SO2 concentrations in diluted-plume conditions (low peak SO2) (Shinohara et al., 2008; Aiuppa et al., 2018; Battaglia et al., 2018; Woitischek et al., 2020). In this study, the calculated CO2/SO2 population is scattered at low concentrations (<15 ppmv SO2), along with observations at other volcanoes (e.g., Etna, Masaya, Pacaya) and they converge at more concentrated plume conditions (>15 ppmv SO2) with values in the range of 2.1–3.3 (2.9 ± 0.6), behaving within the CAVA (2.0 ± 1.1) and the global arc gas signature (∼2.5) (Aiuppa et al., 2017). Hasselle et al. (2019) already reported this behavior from measurements taken at Santa Ana, suggesting the scattering of the ratios due to the diluted nature of the plume and/or because of contributions from multiple gas sources (e.g., weakly degassing hydrothermal fumaroles and soil diffuse degassing on the inner crater slope). However, changes in the wind speed and direction should also be considered since some of the measurements were performed in a time span between 2 and 4 h, bringing different gas concentrations to the sampling point. A similar behavior is observed for the H2O/SO2 ratio (4c), where low ratios are obtained in denser plumes (peak SO2 concentrations >15 ppmv). The extent of variation in the ratios clearly depends on the sampling location. For example, at the outer rim of Santa Ana estimated CO2/SO2 ratios ranged from 2.9 to 10.1 (mean: 4.8 ± 2.37) indicating the influence of several sources, while a smaller range was observed over Santa Ana’s crater lake (2.1–3.7, mean: 2.9 ± 0.8) pointing to a single distinct source. In the case of San Miguel the mean value of CO2/SO2 is 6.8 ± 1.6 for the rim, while 9.2 ± 4.7 is observed on the plateau, at a distance of ∼0.4 km and ∼0.25 km from the summit, respectively. These variations are related to the SO2 concentration in the plume at the time of sampling. As shown in Figure 4B, the CO2/SO2 populations calculated from San Miguel were obtained from measurement at dilute plume concentrations (<15 ppmv SO2). The ratios are higher than those reported by Granieri et al. (2015) for San Miguel volcano (see Figure 5) because they measured a few days after the eruption of the volcano, when even higher amounts of SO2 were emitted in comparison to the lower emission measured during our study (quiescent phase).
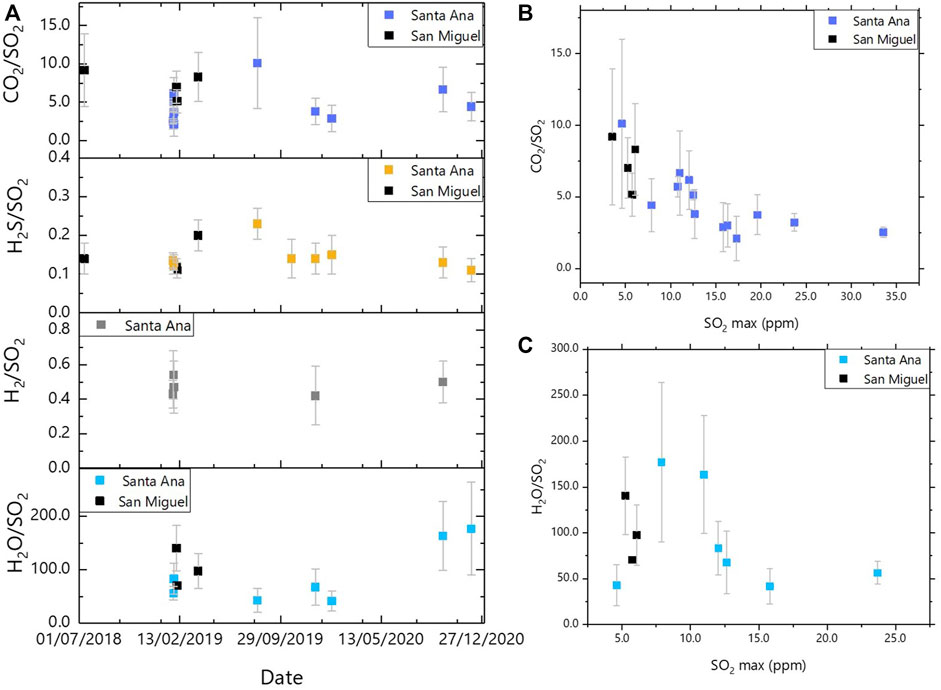
FIGURE 4. (A) Time series of carbon, hydrogen sulfide, hydrogen and water to sulfur molar ratios for Santa Ana and San Miguel corresponding to the 2018–2020 time period. (B, C) are the CO2/SO2 and H2O/SO2 versus the peak SO2 concentration (maximum concentration within each evaluation window).
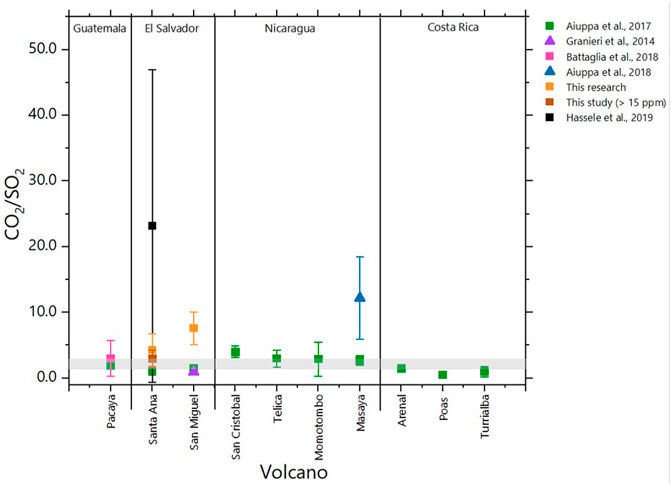
FIGURE 5. Comparison of published CO2/SO2 molar ratios of volcanoes belonging to the CAVA arc segment and the ones obtained in this work. Gray shadow indicates the CO2/St signature assigned to the arc (Aiuppa et al., 2017). Triangles present data taken during eruptive periods. Squares refer to data taken during quiescent degassing periods. Average ratios obtained in this study with all measurements are in light orange while average ratio obtained at concentrated plumes conditions (>15 ppm SO2) is in dark orange.
H2/SO2 ratios determined for Santa Ana ranged from 0.4 to 0.5 (0.47 ± 0.05), with no difference between sites. This differs from the results of Hasselle et al. (2019), who found large differences between sites (Lake: 0.42 ± 11, and Plateau: 2.39 ± 0.27), which was attributed to an additional contribution of H2 by diffuse degassing. However, at the end of their study (May–June 2018), also lower H2/SO2 ratios were measured with daily mean values ranging between 0.37 and 0.39 on the Santa Ana plateau. Our results are consistent with these later observations, suggesting that additional gas supply has decreased since 2018. No data are available from San Miguel for the H2/SO2 ratio, as no correlation between the two gases was observed. H2S/SO2 ratios were also estimated and showed the same mean value for both volcanoes (0.1 ± 0.03). However, the cross-sensitivity of the H2S measurement with respect to SO2 is also in this range, so these values should be interpreted with caution.
3.4 Total halogen to sulfur ratios (Y/S)
The determined halogens are abbreviated here as Y (Y = F, Cl, Br, I). Supplementary Table S7 summarizes the determined concentration of halogens in the Santa Ana and San Miguel plumes, while Table 7 shows the obtained molar ratios of halogens to sulfur for each volcano. Figure 6 shows the overall ratio of halogens to sulfur, which varies by sampling location. The mean Y/S ratios for the Santa Ana rim are 0.2 ± 0.03 for fluorine, 0.7 ± 0.2 for chlorine, and (8.0 ± 5.3) × 10−5 for bromine, while on the plateau only Cl/S was detected with a value of 0.1 ± 0.02. No large variations were found between campaigns. At the San Miguel rim, Cl, Br, and I were detected in the plume with mean Y/S ratios of 1.0 ± 0.08 for chlorine, (5.2 ± 1.0) × 10−4 for bromine, and (1.8 ± 0.63) × 10−5 for iodine. No ratio was obtained for F/S because the fluorine values detected were below the detection limit (Table 7). Figure 6B shows the Y/S ratios obtained during the two field campaigns at San Miguel. No large variations are observed between the surveys, indicating the quiet state of the volcano. First measurements of Cl/S plume ratios for San Miguel volcano were done using a solar occultation FTIR (Fourier transform infrared) spectrometer between January and February 2014, obtaining an average of 0.13 (Granieri et al., 2015), a smaller value than those obtained in this study which might be interpreted as a consequence of the different state of activity at the time of the surveys (post-eruptive period and quiescent period).
TABLE 7. Molar ratios (±error) calculated from data in Supplementary Table S6.
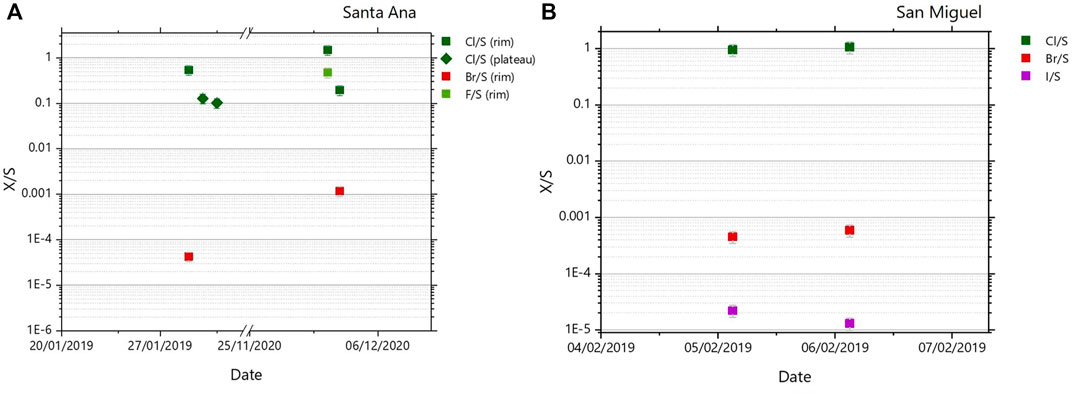
FIGURE 6. Halogen-to-sulfur molar ratios (X/S, where X = F, Cl, Br, I) measured at different sampling sites at Santa Ana volcano (left) and at San Miguel’s rim (right).
Reactive bromine (BrX) was determined in 14 of 22 samples for Santa Ana, all samples from San Miguel were below the detection and quantitation limits (LODBr2 = 0.13 ng and LOQBr2 =0.4 ng). Reactive chlorine (ClX) was determined in four of the 22 samples from Santa Ana and at two of 10 samples for San Miguel (LODCl2 = 0.18 ng and LOQCl2 = 0.5 ng). The results for these samples are given in Table 8, along with the ratios of reactive to total halogen and reactive halogen to total sulfur ratios in (mol/mol). Uncertainties were calculated using the Gaussian error propagation by using an error of 5% for the sampled volume and 10% for the measured analyte amounts (Rüdiger et al., 2021). These are the first RHS measurements performed at both volcanos. The Santa Ana RHS ranged from 1.1 to 9.1 pptv BrX and from 3.6 to 35.3 pptv ClX, whereas only ClX was detected in the San Miguel samples (1.2–1.7 pptv). These data represent less than 1% of the total chlorine content of the RT samples. Several studies suggest halogen activation within the volcanic plume as a function of the distance from the crater (e.g., von Glasow, 2010; Bobrowski and Giuffrida, 2012; Roberts et al., 2014; Surl et al., 2021). Our results are within this expected behavior, showing low ratios when the measurement locations are closer to the emission vent and increasing ratios for bromine when they are farther from it (Figure 7). For example, BrX/S increases from (3.7 ± 0.9) × 10–7, on the Santa Ana plateau, to (1.9 ± 0.09) × 10−5 at the crater rim, while BrX/Br increases from 0.02 ± 0.01 to 0.16 ± 0.04. ClX/S and ClX/Cl have been calculated for Santa Ana’s plateau ((0.12 ± 0.02) × 10−5 and (0.95 ± 0.16) × 10−5, respectively). Observations and model studies at other volcanoes (e.g., Etna, Masaya) have also shown that ClX/Cl is significantly smaller in the plume compared to BrX/Br (Roberts et al., 2009; Gliß et al., 2015; Rüdiger et al., 2021). In the case of San Miguel volcano, samples were collected only at its crater rim because the plateau and fumaroles are not easily accessible.
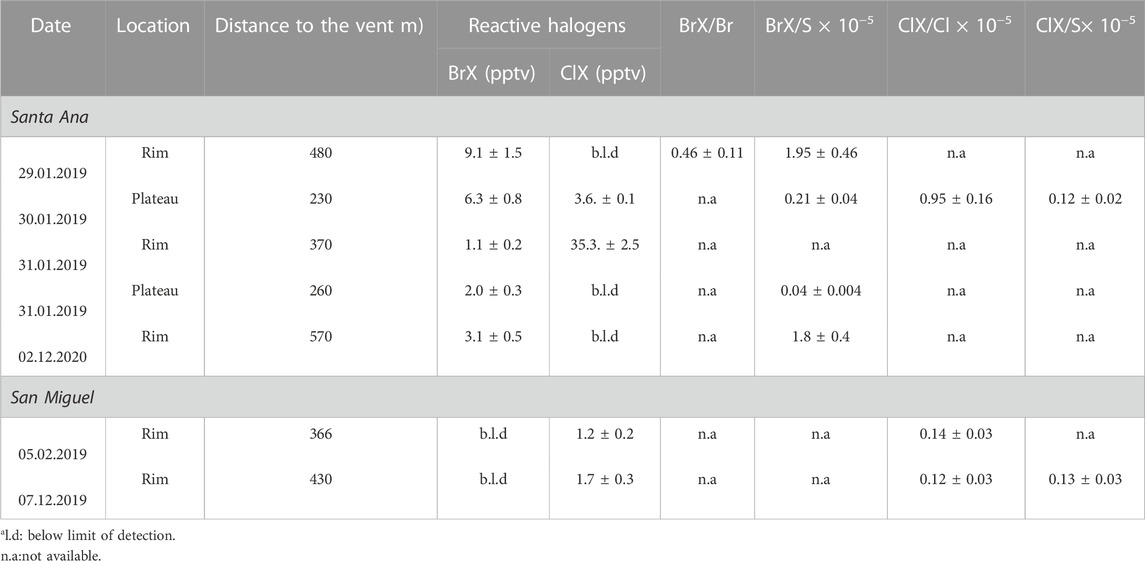
TABLE 8. Molar mixing ratios of reactive halogens, obtained from denuders, to total halogens and total sulfur, obtained at different sampling sites.
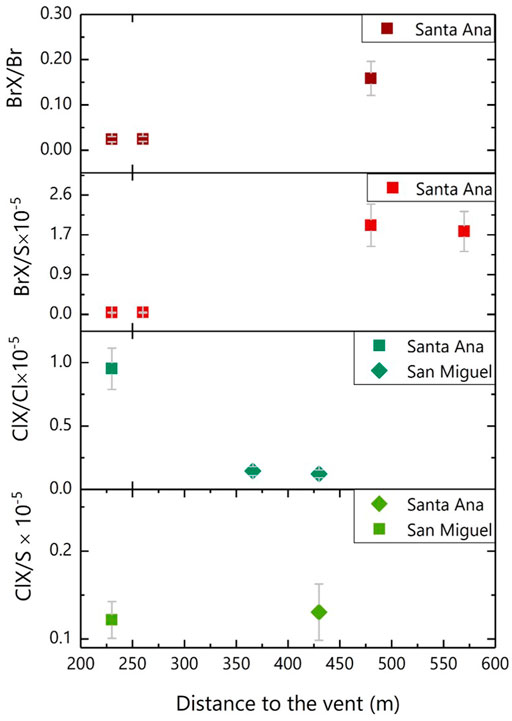
FIGURE 7. RHS molar ratios calculated from the concentrations detected at Santa Ana and San Miguel’s crater.
4 Discussion
4.1 Comparison of SO2 with NOVAC repository
In sections 1.1 and 1.2, we have described all SO2 flux studies we are aware of at the two volcanoes where measurements were taken over at least a 1–2-year period. More recently, Arellano et al. (2021) presented a global compilation of SO2 fluxes obtained from all NOVAC stations, including Santa Ana and San Miguel stations, for a 12-year period between 2005 and 2017. Fluxes were calculated using the NOVAC post-processing-program (Galle et al., 2010) and wind speed downloaded from the ERA-Interim re-analysis database, considering valid spectra the ones that have position, time, total duration (≤ 15 min) and adequate intensity (≤ 10% of saturation); and a chi-square (χ2) value of 9 × 10⁻³ as DOAS fit threshold for the retrieval of SO2. Less data were evaluated in the repository due to less data available on the NOVAC database. An average of 169.5 ± 48.7 SO2 t/d was obtained for Santa Ana volcano, corresponding to 22 days between June 2008 and September 2009. The average obtained for the same days with our evaluation is 472.90 ± 375.45 t/d, being more than 2.5 times higher. The difference is caused by the meteorological data used (Supplementary Tables S1, S2). In the case of San Miguel, an average of 1,828.7 ± 262.5 SO2 t/d was reported as the mean value for the period of 2005–2017, calculated with 4 days that correspond to the last 2 days of December 2013 and 2 days of February 2014 (Arellano et al., 2021). Our results for the same days show a mean SO2 emission rate of 1,686.43 ± 470.01 t/d, which is within the confidence interval of the NOVAC inventory. The comparison shows the overall consistency of the calculated SO2 fluxes at San Miguel and a discrepancy with Santa Ana estimations.
4.2 Comparison of SO2 fluxes with seismic data
Real-time Seismic-Amplitude Measurement–RSAM (Endo and Murray, 1991), is the average signal size over a given period of time (10 min) acquired by the seismic network of the local Observatory. At Santa Ana volcano, the seismic station called San Blas (13.8393-89.6230) is located 1.0 km from the vent, while at San Miguel the VSM station (13.4413-88.2725) used to obtain the seismic data are at 0.9 km from the crater. For both volcanoes, the Observatory has assigned 150 RSAM units as the threshold. Data above this value represent an anomaly. This threshold was set arbitrarily, but is based on long-term monitoring experience. Figure 3 shows the temporal variation of SO2 fluxes and RSAM value, demonstrating the quiet degassing of Santa Ana volcano, although an increase in the seismic data are observed between 2016 and 2018. However, these values are still at background level. Seismic data from San Miguel volcano show several periods when RSAM values were above threshold, which fits with events or phases before the volcano increased its activity. Figure 3 shows anomalous RSAM values during 2013 (151.0–1,252. RSAM units) prior to the eruption when SO2 fluxes ranged from 25.9 to 1,863.2 t/d. On December 29, 1,275 RSAM units were recorded with SO2 emissions varying between 727 and 3,390 t/d. After this event, the observatory reported smaller explosions (reddish shading in Figure 3) with values between 199.5 and 1,218.5 RSAM units and SO2 emission rates that varied between 111.0 and 2,789.8 t/d. Although this study does not examine the specific seismic events that occurred during the study period (i.e., long-period volcano-tectonic events, tremors), the RSAM signatures follow overall general trend such as the SO2 emission rates for San Miguel volcano, which also correlates with the visual observations of changes in the volcanic activity reported by the observatory.
4.3 Plume Gas composition
CO2/SO2 and H2O/SO2 ratios determined with the MultiGAS instrument both varied widely (Table 6). Using each pair of ratios recorded together, the molar fractions (in mol%) were calculated for the three main volatiles (Fischer and Chiodini, 2015; Symonds et al., 1994). The derived compositions range from 79.1 to 97.0 mol% H2O, 2.4–18.6 mol% CO2 and 0.5–2.2 mol% SO2 for Santa Ana, while San Miguel has compositions of 91.1–94.5 mol% H2O, 4.7–7.7 mol% CO2 and 0.7–1.3 mol% SO2. Larger variations are observed for Santa Ana than for San Miguel, of the global volcanic arc gases (Aiuppa, 2015; Edmonds, 2021). Furthermore, our results position Santa Ana in the list of low-carbon volcanoes in the CAVA segment when considering only data with >15 ppmv SO2, in agreement with Mather et al. (2006) and Aiuppa et al. (2017). Furthermore, we see a medium to rich amount of water in the plume, when measurements were made under concentrated plume conditions (>15 ppm SO2). Previous studies have reported variations in gas composition due to a combination of both scrubbing and meteorological conditions such as precipitation (e.g., Symonds et al., 2001; Colvin et al., 2013; Aiuppa, 2015; Hasselle et al., 2019). Field campaigns in this study were conducted during the dry season with sunny or cloudy days and no rain, so the above-mentioned effect did not influence our data.
Aiuppa et al. (2019) reported on the volcanic CO2 inventory of several volcanoes, including Santa Ana and San Miguel, by scaling satellite-based SO2 observations during 2005–2015, and CO2/SO2 ratios in high-temperature gases and calculating 66 ± 125 t/d and 91 ± 139 t/d, respectively. The SO2 fluxes calculated here show a high variability and include observations of mainly quiescent degassing periods with few exceptions for San Miguel. Nevertheless, our mean SO2 emission fluxes result in higher mean SO2 fluxes than those of Carn et al., 2017, which covered a 10-year period (2005–2015) that partially overlaps with the period reported here (2006–2020 and 2008–2019 for Santa Ana and San Miguel, respectively) but is based on less frequent plume detection. In Carn et al., 2017, Santa Ana and San Miguel are 77th and 78th on the global list of volcanic SO2 emission observed from space. In this study, CO2 emission rates were estimated using the daily mean SO2 fluxes obtained from the NOVAC stations between 2006 and 2019 for Santa Ana and 2008 and 2019 for San Miguel, and CO2/SO2 ratios obtained from MultiGAS with high SO2 concentrations considered representative of magmatic composition, yielding CO2 output rates of 1,585.4 ± 866.6 t/d for Santa Ana volcano.
The difference of these findings with the previously described results is noteworthy, since, based on our measurements, significantly higher CO2 emission results. However, the previous datasets (Granieri et al., 2015; Aiuppa et al., 2019) were based on a comparatively small database. This alone can be a problem, as emphasized by Werner et al. (2019), for example, if few measurements obtained during periods of increased activity are the basis of the estimates. Therefore, longer time series are an important scientific basis, for improved emission estimation. In this study, we report time series of more than 10 years for SO2 emissions and also MultiGAS data repeatedly collected over a 3-year period (2018–2020), which we believe leads to a more representative data set. In the case of San Miguel and Santa Ana volcanoes, previous sparse measurements apparently tended to underestimate CO2 emissions. More long-term ground- and space-based measurement series are undoubtedly needed for a more accurate determination of global volcanic degassing.
5 Conclusion
We summarized earlier SO2 emission rates for Santa Ana and San Miguel which cover periods often of only 1–2 years or even less (Bernard et al., 2004; Cartagena et al., 2004; Rodriguez et al., 2004; Pérez et al., 2006; Olmos et al., 2007; Arellano et al., 2021) and extended those time series significantly. We obtained a daily average of 903.88 ± 599.49 t/d for San Miguel and 470.53 ± 414.69 t/d for Santa Ana. These new data were recorded from NOVAC stations installed downwind of the craters on the SW flanks of both volcanoes. Most of the data were recorded during quiescent volcanic activity, with the exception of the events at San Miguel shown in Figure 3, where peak SO2 fluxes were observed along with some changes in the seismic data recorded for the same period.
The remote sensing data were complemented with in situ sampling conducted during field campaigns in 2019–2020, to further characterize the chemical signature of the gas plumes at Santa Ana and San Miguel. Plume composition at Santa Ana is H2O-intermediate (79.1–97.0 mol%), with a typical CAVA CO2/SO2 signature of 2.9 ± 0.6 while San Miguel is H2O-rich (91.1–94.5 mol%) with relatively high CO2/SO2 ratios obtained from diluted and discontinuous plume signatures (< 10 ppm SO2), likely containing contributions from low-temperature hydrothermal gases characterized by sulfur scrubbing (Aiuppa et al., 2017).
We also report the total halogen fraction of the emitted gases with their corresponding halogen to sulfur ratios. At San Miguel, halogen to sulfur ratios were obtained with mean values for HCl/SO2, HBr/SO2 and HI/SO2 of (1.0 ± 0.2, (5.2 ± 1.3) × 10−4 and (1.8 ± 0.4) × 10−5, while at Santa Ana we found average values of HCl/SO2, HF/SO2 and HBr/SO2 of 0.5 ± 0.1, 0.2 ± 0.3, (6.8 ± 1.6) × 10−5, respectively. In addition, we present the first measurements of RHS (sum of reactive bromine and chlorine species) made at these two El Salvadorean volcanoes using TMB coated denuders. The data show activation of halogens as a function of distance from the emission vent, i.e., higher RHS concentrations are measured at greater distances, consistent with measurements on other locations and model studies (von Glasow, 2010; Roberts et al., 2014). These field observations provide new data on RHS, especially for low-emission volcanoes. As a result, the global data set on halogen speciation in volcanic plumes is complemented. This contributes to a better understanding of the relationship between emitted halogen species and measurable halogen compounds—i.e., better understanding the chemistry in volcanic plumes. Overall, we present the most comprehensive geochemical gas dataset of the Santa Ana and San Miguel volcanoes, with the aim of creating a significantly expanded database of their gas emissions. The CO2 flux determined in this study is about an order of magnitude higher than previous estimates. The database presented is an essential prerequisite not only for a better understanding of basic volcanological processes, but also as a basis for the scientific assessment of the significance of changes in the emission rate of released gases or their compounds later formed in the volcanic plume. In addition, on the long-term this allows to reliably use the gas emissions as indicators of volcanic unrest.
Data availability statement
The datasets presented in this study can be found in online repositories. The names of the repository/repositories and accession number(s) can be found below: https://github.com/xguti83/ESA_gas_emissions; https://novac.chalmers.se/.
Author contributions
XG, NB, JR, FM, MV, and DE collected samples. XG produced research results and processed data. FD provided scripts to evaluate DOAS data. ML and BG contributed research results. JR and NB provided input on the analysis of the results. EG and FM contributed with the logistic of the field campaigns. XG, NB, and TH wrote the paper with input from ML and BG.
Funding
XG thanks the Deutscher Akademischer Austauschdienst for the financial support. Field campaigns were supported from TeMaS (Terrestrial Magmatic Systems, a collaborative effort of the Universities of Mainz, Frankfurt and Heidelberg) and the Max Planck Graduate Center (MPGC).
Acknowledgments
We would like to thank the park rangers, Comandos de Salvamento de El Salvador and Policía Nacional Civil (PNC) as well as the colleagues from observatory for their collaboration during the surveys, especially Manuel Díaz, Gerente de Geología, for facilitating the cooperation with us. XG thanks Carlos Alberti, Institute of Meteorology and Climate Research (IMK-ASF), Karlsruhe Institute of Technology (KIT), Karlsruhe, Germany; for his input with the evaluation scripts. We also thank the two reviewers and the editor for revising our manuscript and all constructive comments to improve the article.
Conflict of interest
The authors declare that the research was conducted in the absence of any commercial or financial relationships that could be construed as a potential conflict of interest.
Publisher’s note
All claims expressed in this article are solely those of the authors and do not necessarily represent those of their affiliated organizations, or those of the publisher, the editors and the reviewers. Any product that may be evaluated in this article, or claim that may be made by its manufacturer, is not guaranteed or endorsed by the publisher.
Supplementary material
The Supplementary Material for this article can be found online at: https://www.frontiersin.org/articles/10.3389/feart.2023.1049670/full#supplementary-material
References
Aiuppa, A., Federico, C., Franco, A., Giudice, G., Gurrieri, S., Inguaggiato, S., et al. (2005). Emission of bromine and iodine from Mount Etna volcano. Geochem. Geophys. Geosyst. 6 (8), n/a. doi:10.1029/2005gc000965
Aiuppa, A., Fischer, T. P., Plank, T., and Bani, P. (2019). CO2 flux emissions from the Earth's most actively degassing volcanoes, 2005 - 2015. Sci. Rep. 9, 5442. doi:10.1038/s41598-019-41901-y
Aiuppa, A., Fischer, T. P., Plank, T., Robidoux, P., and Di Napoli, R. (2017). Along-arc, inter-arc and arc-to-arc variations in volcanic gas CO 2/S T ratios reveal dual source of carbon in arc volcanism. Earth-Science Rev. 168, 24–47. doi:10.1016/j.earscirev.2017.03.005
Aiuppa, A., Moor, J. M. D., Arellano, S., Coppola, D., Francofonte, V., Galle, B., et al. (2018). Tracking Formation of a lava lake from ground and space: Masaya volcano (Nicaragua), 2014-2017. Geochem. Geophys. Geosyst. 19 (2), 496–515. doi:10.1002/2017GC007227
Aiuppa, A. (2015). “Volcanic-gas monitoring,” in Volcanism and global environmental change. Editors A. Schmidt, and E. Kirsten (Cambridge: Cambridge University Press), 81–96.
Arellano, S., Galle, B., Apaza, F., Avard, G., Barrington, C., Bobrowski, N., et al. (2021). Synoptic analysis of a decade of daily measurements of SO2 emission in the troposphere from volcanoes of the global ground-based Network for Observation of Volcanic and Atmospheric Change. Earth Syst. Sci. Data 13 (3), 1167–1188. doi:10.5194/essd-13-1167-2021
Battaglia, A., Bitetto, M., Aiuppa, A., Rizzo, A. L., Chigna, G., Watson, I. M., et al. (2018). The magmatic gas signature of Pacaya Volcano, with implications for the volcanic CO2 flux from Guatemala. Geochemistry,Geophysics, Geosystems 19, 667–692. doi:10.1002/2017GC007238
Bernard, A., Escobar, C. D., Mazot, A., and Gutierrez, R. E. (2004). “The acid volcanic lake of Santa Ana volcano, El Salvador,” in Natural Hazards in El salvado (Boulder, CO: Geological Society of America).
Bobrowski, N., and Giuffrida, G. (2012). Bromine monoxide/sulphur dioxide ratios in relation to volcanological observations at Mt. Etna 2006–2009. Solid earth. 3 (2), 433–445. doi:10.5194/se-3-433-2012
Bobrowski, N., Glasow, R. V., Aiuppa, A., Inguaggiato, S., Louban, I., Ibrahim, O. W., et al. (2007). Reactive halogen chemistry in volcanic plumes. J. Geophys. Res. 112 (D6), D06311. doi:10.1029/2006JD007206
Bonforte, A., Hernandez, D. A., Gutiérrez, E., Handal, L., Polío, C., Rapisarda, S., et al. (2016). The unrest of the san Miguel volcano (El Salvador, central America): Installation of the monitoring network and observed volcano-tectonic ground deformation. Nat. Hazards Earth Syst. Sci. 16, 1755–1769. doi:10.5194/nhess-16-1755-2016
Carn, S. A., Fioletov, V. E., McLinden, C. A., Li, C., and Krotkov, N. A. (2017). A decade of global volcanic SO2 emissions measured from space. Sci. Rep. 7 (1), 44095. doi:10.1038/srep44095
Cartagena, R., olmos, R., López, D. L., Soriano, T., Barahona, F., Hernández, P. A., et al. (2004). “Diffuse soil degassing of carbon dioxide, radon and mercury at San Miguel volcano, El Salvador,” in natural hazards in El Salvador (Boulder, CO: Special Paper of the Geological Society of America).
Chesner, C. A., Pullinger, C. R., and Escobar, C. D. (2004). “Physical and chemical evolution of San Miguel volcano, El Salvador,” in Natural hazards in El Salvador (Boulder, CO: Geological Society of America).
Colvin, A., Rose, W. I., Varekamp, J. C., Palma, J. L., Escobar, D., Gutierrez, E., et al. (2013). “Crater lake evolution at Santa Ana Volcano (El Salvador) following the 2005 eruption,” in Understanding open-vent volcanism and related hazards. Editors W. I. Rose, J. L. Palma, H. Delgado Granados, and N. Varley (Geological Society of America Special Paper), 23–43. doi:10.1130/2013.2498(02
Dinger, F., Kleinbek, T., Dörner, S., Bobrowski, N., Platt, U., Wagner, T., et al. (2021). SO2 and BrO emissions of Masaya volcano from 2014 to 2020. Atmos. Chem. Phys. 21 (12), 9367–9404. doi:10.5194/acp-21-9367-2021
Edmonds, M. (2021). “Geochemical monitoring of volcanoes and the mitigation of volcanic gas hazards,” in Forecasting and Planning for Volcanic Hazards, Risks and Disasters. Editors J. Schroder, and P. Papale doi:10.1016/C2018-0-02632-8
Endo, E. T., and Murray, T. (1991). Real-time seismic amplitude measurement (RSAM): a volcano monitoring and prediction tool. Bull. Volcanol. 53 (7), 533–545. doi:10.1007/BF00298154
Escobar, C. D. (2003). San Miguel volcano and its volcanic hazards, El Salvador, Central America. Houghton, WA: Michigan Technological University. PhD thesis.
Fischer, T. P., and Chiodini, G. (2015). “Volcanic, Magmatic and Hydrothermal Gases,” in The Encyclopedia of Volcanoes. Editors H. Sigurdsson, B. Houghton, S. R. McNutt, H. Rymer, and J. Stix doi:10.1016/C2015-0-00175-7
Galle, B., Johansson, M., Rivera, C., Zhang, Y., Kihlman, M., Kern, C., et al. (2010). Network for observation of volcanic and atmospheric change (NOVAC)—a global network for volcanic gas monitoring: Network layout and instrument description. J. Geophys. Res. 115 (D5), D05304. doi:10.1029/2009JD011823
Geil, B. (2021). Methodenentwicklung zur Halogenbestimmung von Vulkanischen Systemen mittels Basischer Fallen und Diffusionsabscheidern/Entwicklung einer Permeablen Chlorgasquelle (Master thesis). Mainz, Germany: Johannes Gutenberg Universität Mainz.
Gliß, J., Bobrowski, N., Vogel, L., Pöhler, D., and Platt, U. (2015). OClO and BrO observations in the volcanic plume of Mt. Etna – implications on the chemistry of chlorine and bromine species in volcanic plumes. Atmos. Chem. Phys. 15, 5659–5681. doi:10.5194/acp-15-5659-2015
Granieri, D., Salerno, G., Liuzzo, M., La Spina, A., Giuffrida, G., Caltabiano, T., et al. (2015). Emission of gas and atmospheric dispersion of SO 2 during the December 2013 eruption at San Miguel volcano (El Salvador, Central America). Geophys. Res. Lett. 42 (14), 5847–5854. doi:10.1002/2015GL064660
Hasselle, N., Montalvo, F., Rouwet, D., Battaglia, A., Bitetto, M., Escobar, D., et al. (2019). The crater lake of Ilamatepec (Santa Ana) volcano, El Salvador: Insights into lake gas composition and implications for monitoring. Bull. Volcanol. 81 (11), 66. doi:10.1007/s00445-019-1331-8
Hernandez, P., Pérez, N., Varekamp, J., Henríquez, B., Hernández De la Cruz, A., Barrancos, J., et al. (2007). crater lake temperature changes of the 2005 eruption of Santa Ana volcano, El Salvador Pure and applied geophysics, Springer. Central America. doi:10.1007/978-3-7643-8720-4_9
Jiménez, D., Becerril, L., Bartolini, S., Escobar, D., and Martí, J. (2020). Making a qualitative volcanic-hazards map by combining simulated scenarios: An example for San Miguel Volcano (El Salvador). J. Volcanol. Geotherm. Res. 395, 106837–110273. doi:10.1016/j.jvolgeores.2020.106837
Laiolo, M., Coppola, D., Barahona, F., Benitez, J. E., Cigolini, C., Escobar, D., et al. (2017). Evidences of volcanic unrest on high-temperature fumaroles by satellite thermal monitoring: The case of Santa Ana volcano, El Salvador. Journa Volcanolgy Geotherm. Res. 340, 170–179. doi:10.1016/j.jvolgeores.2017.04.013
Lübcke, P., Bobrowski, N., Arellano, S., Galle, B., Garzón, G., Vogel, L., et al. (2014). BrO/SO2 molar ratios from scanning DOAS measurements in the NOVAC network. Solid earth. 5 (1), 409–424. doi:10.5194/se-5-409-2014
Mann, C. P., Stix, J., Vallance, J. W., Richer, M., Rose, W. I., Bommer, J. J., et al. (2004). “Subaqueous intracaldera volcanism, ilopango caldera, El Salvador, central America,” in Natural hazards in El Salvador (Boulder, Colorado: Geological Society of America Special Paper).
Mather, T. A., Pyle, D. M., Tsanev, V. I., McGonigle, A. J. S., Oppenheimer, O., and Allen, A. G. (2006). “A reassessment of current volcanic emissions from the Central American arc with specific examples from Nicaragua,” in Journal of Volcanology and Geothermal Research 149, 297–311. doi:10.1016/j.jvolgeores.2005.07.021
Meyer-Abbich, H. (1956). Anales servicio geologico nacional. El Salvador: Anales del Servicio Geologico Nacional.
Noguchi, K., and Kamiya, H. (1963). Prediction of volcanic eruption by measuring the chemical composition and amounts of gases. B. Volcanol. 26, 367–378. doi:10.1007/bf02597298
Olmos, R., Barrancos, J., Rivera, C., Barahona, F., López, D. L., Henriquez, B., et al. (2007). Anomalous emissions of SO2 during the recent eruption of Santa Ana volcano, El Salvador, central America. Pure Appl. Geophys. 164 (12), 2489–2506. doi:10.1007/s00024-007-0276-6
Pérez, N. M., Hernández, P. A., Padrón, E., Cartagena, R., Olmos, R., Barahona, F., et al. (2006). Anomalous diffuse CO2 emission prior to the january 2002 short-term unrest at san Miguel volcano, El Salvador, central America. Pure Appl. Geophys. 163, 883–896. doi:10.1007/s00024-006-0050-1
Roberts, T. J., Braban, C. F., Martin, R. S., Oppenheimer, C., Adams, J. W., Cox, R. A., et al. (2009). Modelling reactive halogen formation and ozone depletion in volcanic plumes. Chem. Geol. 263 (1-4), 151–163. doi:10.1016/j.chemgeo.2008.11.012
Roberts, T. J., Martin, R. S., and Jourdain, L. (2014). Reactive bromine chemistry in mount etna's volcanic plume: The influence of total Br, high-temperature processing, aerosol loading and plume–air mixing. Atmos. Chem. Phys. 14 (20), 11201–11219. doi:10.5194/acp-14-11201-2014
Rodríguez, L. A., Watson, I. M., Rose, W. I., Branan, Y. K., Bluth, G. J. S., Chigna, G., et al. (2004). SO2 emissions to the atmosphere from active volcanoes in Guatemala and El Salvador, 1999–2002. J. Volcanol. Geotherm. Res. 138 (3-4), 325–344. doi:10.1016/j.jvolgeores.2004.07.008
Rüdiger, J., Bobrowski, N., Liotta, M., and Hoffmann, T. (2017). Development and application of a sampling method for the determination of reactive halogen species in volcanic gas emissions. Anal. Bioanal. Chem. 409 (25), 5975–5985. doi:10.1007/s00216-017-0525-1
Rüdiger, J., Gutmann, A., Bobrowski, N., Liotta, M., Moor, J. M. D., Sander, R., et al. (2021). Halogen activation in the plume of Masaya volcano: Field observations and box model investigations. Atmos. Chem. Phys. 21 (5), 3371–3393. doi:10.5194/acp-21-3371-2021
Rüdiger, J., Tirpitz, J., Moor, J. M. D., Bobrowski, N., Gutmann, A., Liuzzo, M., et al. (2018). Implementation of electrochemical, optical and denuder-based sensors and sampling techniques on UAV for volcanic gas measurements: Examples from Masaya, turrialba and stromboli volcanoes. Atmos. Meas. Tech. 11 (4), 2441–2457. doi:10.5194/amt-11-2441-2018
Salazar, J. M., Hernández, P. A., Pérez, N. M., Olmos, R., Barahona, F., Cartagena, R., et al. (2004). “Spatial and temporal variations of diffuse CO2 degassing at Santa Ana-Izalco-Coatepeque volcanic complex, El Salvador, Central America,” in Natural Hazards. Editors W. Rose, J. J. Bommer, D. Lopez, M. J. Carr, and J. J. Major
Shinohara, H. (2005). A new technique to estimate volcanic gas composition: Plume measurements with a portable multi-sensor system. J. Volcanol. Geotherm. Res. 143 (4), 319–333. doi:10.1016/j.jvolgeores.2004.12.004
Shinohara, H., Aiuppa, A., Giudice, G., Gurrieri, S., and Liuzzo, M. (2008). Variation of H2O/CO2 and CO2/SO2 ratios of volcanic gases discharged by continuous degassing of Mount Etna volcano, Italy. J. Geophys. Res. 113 (B9), 5185. doi:10.1029/2007JB005185
Stutz, J., and Platt, U. (1996): Numerical analysis and estimation of the statistical error of differential optical absorption spectroscopy measurements with least-squares methods. Applied optics 35(30), 6041–6053.
Surl, L., Roberts, T., and Bekki, S. (2021): Observation and modelling of ozone-destructive halogen chemistry in a passively degassing volcanic plume. Atmos. Chem. Phys. 21(16), 12413–12441. doi:10.5194/acp-21-12413-2021
Symonds, R. B., Rose, W. I., Bluth, G. J. S., and Gerlach, T. M. (1994): VOLCANIC-GAS studies: METHODS, results, and applications,” in Volatiles in magmas. Editors M. R. Carroll, and J. R. Holloway (Berlin, Boston: De Gruyter), 1–66. doi:10.1515/9781501509674-007
Symonds, R. B., Gerlach, T. M., and Reed, M. H. (2001). Magmatic gas scrubbing: Implications for volcano monitoring. J. Volcanol. Geotherm. Res. 108, 303–341. doi:10.1016/s0377-0273(00)00292-4
Tamburello, G. (2015). Ratiocalc: Software for processing data from multicomponent volcanic gas analyzers. Comput. Geosciences 82, 63–67. doi:10.1016/j.cageo.2015.05.004
Tirpitz, J. L., Pöhler, D., Bobrowski, N., Christenson, B., Rüdiger, J., Schmitt, S., et al. (2019). Non-dispersive UV absorption spectroscopy: A promising new approach for in-situ detection of sulfur dioxide. Front. Earth Sci. 7, 2. doi:10.3389/feart.2019.0002
von Glasow, R. (2010). Atmospheric chemistry in volcanic plumes In PNAS 107(15), 6594–6599. doi:10.1073/pnas.0913164107
Werner, C., Fischer, T. P., Aiuppa, A., Edmonds, M., Cardellini, C., Carn, S., et al. (2019). “Carbon dioxide emissions from subaerial volcanic regions,” in Deep carbon past to present (Cambridge, Great Britain: Cambridge University Press).
Wittmer, J., Bobrowski, N., Liotta, M., Giuffrida, G., Calabrese, S., and Platt, U. (2014). Active alkaline traps to determine acidic-gas ratios in volcanic plumes: Sampling techniques and analytical methods. Geochem. Geophys. Geosyst. 15 (7), 2797–2820. doi:10.1002/2013GC005133
Woitischek, J., Woods, A. W., Edmonds, M., Oppenheimer, C., Aiuppa, A., Pering, T. D., et al. (2020). Strombolian eruptions and dynamics of magma degassing at Yasur volcano (Vanuatu). J. Volcanol. Geotherm. Res. 398, 106869. doi:10.1016/j.jvolgeores.2020.106869
Keywords: Santa Ana, San Miguel, volcanic gas emissions, SO2 emissions, halogen emissions, (min.5-max. 8)
Citation: Gutiérrez X, Bobrowski N, Rüdiger J, Liotta M, Geil B, Hoffmann T, Gutiérrez E, Dinger F, Montalvo F, Villalobos M and Escobar D (2023) Geochemical characterization of volcanic gas emissions at Santa Ana and San Miguel volcanoes, El Salvador, using remote-sensing and in situ measurements. Front. Earth Sci. 11:1049670. doi: 10.3389/feart.2023.1049670
Received: 20 September 2022; Accepted: 20 April 2023;
Published: 01 June 2023.
Edited by:
Silvana Hidalgo, Escuela Politécnice Nacional, EcuadorReviewed by:
Daniel Sierra, Escuela Politécnice Nacional, EcuadorMariana Patricia Jacome Paz, National Autonomous University of Mexico, Mexico
Copyright © 2023 Gutiérrez, Bobrowski, Rüdiger, Liotta, Geil, Hoffmann, Gutiérrez, Dinger, Montalvo, Villalobos and Escobar. This is an open-access article distributed under the terms of the Creative Commons Attribution License (CC BY). The use, distribution or reproduction in other forums is permitted, provided the original author(s) and the copyright owner(s) are credited and that the original publication in this journal is cited, in accordance with accepted academic practice. No use, distribution or reproduction is permitted which does not comply with these terms.
*Correspondence: Nicole Bobrowski, bmljb2xlLmJvYnJvd3NraUBpbmd2Lml0