 N. Taquet1*
 C. Rivera Cárdenas1
 W. Stremme1
 T. Boulesteix2
 A. Bezanilla1
 M. Grutter1O. García3F. Hase4
 T. Blumenstock4
- 1Instituto de Ciencias de la Atmósfera y Cambio Climático, Universidad Nacional Autónoma de México, Mexico City, Mexico
- 2Volcanology Research Group, Department of Life and Earth Sciences, Instituto de Productos Naturales Y Agrobiología (IPNA-CSIC), San Cristóbal de La Laguna, Spain
- 3Centro de Investigación Atmosférica de Izaña (CIAI), Agencia Estatal de Meteorología (AEMet), Santa Cruz de Tenerife, Spain
- 4Karlsruhe Institute of Technology (KIT), Institute of Meteorology and Climate Research (IMK-ASF), Karlsruhe, Germany
Volcanic plume composition is strongly influenced by both changes in magmatic systems and plume-atmosphere interactions. Understanding the degassing mechanisms controlling the type of volcanic activity implies deciphering the contributions of magmatic gases reaching the surface and their posterior chemical transformations in contact with the atmosphere. Remote sensing techniques based on direct solar absorption spectroscopy provide valuable information about most of the emitted magmatic gases but also on gas species formed and converted within the plumes. In this study, we explore the procedures, performances and benefits of combining two direct solar absorption techniques, high resolution Fourier Transform Infrared Spectroscopy (FTIR) and Ultraviolet Differential Optical Absorption Spectroscopy (UV-DOAS), to observe the composition changes in the Popocatépetl’s plume with high temporal resolution. The SO2 vertical columns obtained from three instruments (DOAS, high resolution FTIR and Pandora) were found similar (median difference <12%) after their intercalibration. We combined them to determine with high temporal resolution the different hydrogen halide and halogen species to sulfur ratios (HF/SO2, BrO/SO2, HCl/SO2, SiF4/SO2, detection limit of HBr/SO2) and HCl/BrO in the Popocatépetl’s plume over a 2.5-years period (2017 to mid-2019). BrO/SO2, BrO/HCl, and HCl/SO2 ratios were found in the range of (0.63 ± 0.06 to 1.14 ± 0.20) × 10−4, (2.6 ± 0.5 to 6.9 ± 2.6) × 10−4, and 0.08 ± 0.01 to 0.21 ± 0.01 respectively, while the SiF4/SO2 and HF/SO2 ratios were found fairly constant at (1.56 ± 0.25) × 10−3 and 0.049 ± 0.001. We especially focused on the full growth/destruction cycle of the most voluminous lava dome of the period that took place between February and April 2019. A decrease of the HCl/SO2 ratio was observed with the decrease of the extrusive activity. Furthermore, the short-term variability of BrO/SO2 is measured for the first time at Popocatépetl volcano together with HCl/SO2, revealing different behaviors with respect to the volcanic activity. More generally, providing such temporally resolved and near-real-time time series of both primary and secondary volcanic gaseous species is critical for the management of volcanic emergencies, as well as for the understanding of the volcanic degassing processes and their impact on the atmospheric chemistry.
1 Introduction
Volcanic plume composition measurements allow detection of significant changes in the magmatic processes from the magma chamber to the most superficial levels (Francis et al., 1995; Oppenheimer and McGonigle, 2004) and contribute to determining the degassing balance during eruptions (Gerlach and Graeber, 1985). Among the main magmatic volatile species involved in volcanic eruptions, halogens (F, Cl, Br, I) play a key role in the extrusive processes, affecting the physico-chemical properties of magmas (Dingwell and Mysen, 1985; Aiuppa, 2009), and having major implications for their transport towards the surface, their ascension speed, their potential to segregate a gas phase, their eruptability and the eruption dynamics/explosivity. In particular, based on their contrasted solubility in magma compared to sulfur, the temporal variability of halogen-to-sulfur ratios in plumes allowed deciphering the magmatic processes and eruptive dynamics (Mori et al., 1993; Burton et al., 2007; Schipper et al., 2019; Aiuppa et al., 2021).
For example, an increase of Cl/S ratios was observed during the eruptive periods with respect to quiescent periods, at, e.g., Mount Etna during the 2001 and 2002–2003 eruptions (Aiuppa et al., 2002; 2004; Notsu and Mori, 2010), which was interpreted in terms of solubility-controlled fractionation. The variability of the HCl/SO2, CO2/SO2 in different eruptive contexts provides insights on the transition between quiet and explosive regimes, and on explosion mechanisms (Burton et al., 2007; Woitischek et al., 2020; Aiuppa et al., 2021). Edmonds et al. (2002) observed an increase of the HCl/SO2 ratio at Soufrière Hills Volcano during lava extrusion, illustrating the shallow decompressional degassing of Cl.
Some of these halogen derivatives are reactive in volcanic plumes, obscuring the relationships between the plume composition and the magmatic/eruptive processes, which require both primary (magmatic) and secondary (in-plume) species to be accounted for in degassing balances. In-plumes reactions include SO2 and HCl scavenging on volcanic ash (Martin et al., 2012; Delmelle et al., 2018), uptake by sulfate aerosols (Edmonds et al., 2003; Rodriguez et al., 2008; Rüdiger et al., 2021), and halogen chemistry (Bobrowski et al., 2007; Rudiger et al., 2021). The conversion of SO2 to sulfate aerosols can be significant over long-term observation periods under humid conditions (Rodriguez et al., 2008), but seems to play a minor role in ash poor-plumes over a period of minutes to hours (McGonigle et al., 2004; Voigt et al., 2014). On the other hand, the characterization of the halogen activation mechanisms in volcanic plumes and their reaction kinetics is critical for both long and short-term studies, affecting the variability of primary species ratios and degassing balances.
Among the halogen secondary species, BrO was measured for the first time in a volcanic plume at Soufrière Hills (Montserrat) by Bobrowski et al. (2003), and then at a number of other volcanoes (Oppenheimer et al., 2006; Bobrowski and Platt, 2007; Kern et al., 2009; Heue et al., 2011; Rix et al., 2012; Donovan et al., 2014; Gliß et al., 2015; Dinger et al., 2018; Warnach et al., 2019; Dinger et al., 2021) including Popocatépetl (Boichu et al., 2011; Bobrowski and Giuffrida, 2012; Platt and Bobrowski, 2015; Fickel and Delgado Granados, 2017). Recent models succeeded in reproducing some observations of plume compositions at different plume ages (Rüdiger et al., 2021) and provide valuable information about the lifetimes and conversion rates of the primary (HCl, HF, HBr) and secondary (BrO, ClO, OClO, BrOH, Br2, BrCl, BrONO2) halogen species. However, the lack of simultaneous measurements of the different halogens species leaves some input parameters poorly constrained, and the influence of plume-mixing processes, relative humidity, presence of aerosols, photochemistry and/or redox conditions on the conversion rates remains still not fully understood. A review of the main recent findings on this topic is given in Gutmann et al. (2018). Some typical behaviors of the BrO/SO2 ratios with respect to the volcanic activity were described at Mount Etna (Bobrowski and Giuffrida, 2012), Nevado del Ruiz (Lübcke et al., 2014), Tungurahua (Warnach et al., 2019) and Cotopaxi (Dinger et al., 2018), with low ratios prior to and during eruptions and/or explosive activity, while higher ratios occurred at the end of the eruptions or during passive degassing. On the other hand, Aiuppa et al. (2005) observed a coherent geochemical behaviour of halogen (F, Cl, Br, I) to sulfur ratios in the Mount Etna’s plume before (increase of the ratio) and during (decrease of the ratio) the 2004 eruption. Unless Cl and F partition early in water/brines (Aiuppa, 2009; Shinohara, 2009), these species are generally exsolved from magma shallower than sulfur. The conditions of bromine exsolution from magma are not yet well understood, and both shallow and deep origins are still considered (Gutmann et al., 2018), complicating the interpretation of the BrO/SO2 ratios in terms of magmatic processes.
SiF4 is a byproduct of the reaction of HF with silicates either within the conduit or during the ash transport in the plume (Love et al., 1998; de Hoog et al., 2005). FTIR spectroscopy is the only method allowing its quantification together with HF (Mori et al., 2002). This compound has been detected at a few volcanoes such as Mount Etna and Satsuma-Iwojima, but especially at Popocatépetl (Love et al., 1998; Stremme et al., 2011; Stremme et al., 2012; Taquet et al., 2017; Taquet et al., 2019) where frequent ash-laden plumes and vigorous degassing through successive dome extrusions favors the formation of SiF4 (de Hoog et al., 2005). The previous studies evidenced that both formation modes occur at Popocatépetl (Taquet et al., 2017; Taquet et al., 2019) and that the SiF4/SO2 ratio increases several minutes preceding (Love et al., 1998) and during dome-related explosions (Stremme et al., 2011; Taquet et al., 2017).
Many primary magmatic species (H2O, CO2, SO2, HCl, HF, HBr, CO, OCS, H2S) and their derivatives (BrO, OClO, SiF4) can be remotely measured using satellite and ground-based spectroscopic techniques (from ultraviolet to thermal infrared) in both active and passive configurations. A complete review of the different ground-based techniques used to date for measuring and imaging the different species in volcanic plumes is given in Platt et al. (2018).
The use of DOAS instruments to measure SO2 and reactive halogen species (BrO, OClO) has proven to be simple and effective, providing the possibility to automatize current instrumentation and create robust monitoring networks (Galle et al., 2010) such as the Network for Observation of Volcanic and Atmospheric Change (NOVAC). BrO/SO2 ratios are measured by DOAS instruments using scattered sunlight (Gutmann et al., 2018) and Gliß et al. (2015) additionally measured the OClO species in the volcanic plume of Mount Etna using Multi-AXis DOAS (MAX-DOAS). FTIR spectroscopy has long been used to study the compositional variability (SO2, HCl, HF, SiF4, CO2, OCS, CO, H2S) of volcanic plumes, mainly in open-path configuration, which requires an intense IR source (lava fountains and lakes or artificial), limiting its applicability. Solar occultation FTIR spectroscopy, using direct sunlight overcomes some of these limitations, allowing measurements during passive and active degassing phases (Francis et al., 1998; Oppenheimer et al., 1998; Burton et al., 2001; Stremme et al., 2011; Taquet et al., 2019). Few studies (Love et al., 1998; Love et al., 2000; Smekens et al., 2023) present simultaneous FTIR and UV measurements of volcanic plumes composition using thermal emission (in the LWIR range) and the solar radiation scattered by the atmosphere or clouds behind volcanic plumes. Thermal emission measurements have been performed recently at Popocatépetl (Taquet et al., 2017) and have proven to complement direct solar absorption measurements. Using thermal emission allows measuring with high frequency by just pointing towards the volcanic plume, but solving the radiative transfer and deriving the composition remain challenging (Love et al., 2000; Platt et al., 2018). Butz et al. (2017) combined for the first time direct-sun DOAS and FTIR measurements using portable instruments (EM27/SUN FTIR and UV spectrometers) to simultaneously measure SO2, HCl, HF, CO2, BrO species in Mount Etna’s volcanic plume. In such configuration, the different instruments share the same line of sight and thus the same airmass. This allows straightforward comparisons of the retrieved vertical columns (VCs) and robust calculation of multiple volcanic species ratios, making this method one of the most reliable and adaptable for studying long-term variability of the volcanic plume composition.
In this contribution, we present 2.5 years (2017 to mid-2019) of high quality multispecies compositional data of Popocatépetl’s plume combining ground-based DOAS and FTIR direct-sun measurements, with a focus over the most voluminous dome growth and destruction episode (February–April 2019) of the study period. The measurements were performed from the Altzomoni (ALTZ) observatory, one of the few stations pertaining to the Network for the Detection of Atmospheric Composition Change (NDACC) and to the Pandonia Gobal Network (PGN) located near a persistently degassing volcano. The site instruments (a high resolution (HR)-FTIR coupled with a DOAS and a Pandora spectrometers) and measurements benefit from standardized protocols, intercalibrations and comply with the measurement quality requirements. We studied the variability of both the primary and secondary species and of their ratios (i.e., BrO/SO2, BrO/HCl, HCl/SO2, HF/SO2, SiF4/SO2) in the volcanic plume during different phases of the dome growth and relate it with the degassing processes and in-plume reactions.
2 Popocatépetl volcano and measurement site
Popocatépetl is an andesitic-dacitic stratovolcano of the trans-Mexican volcanic belt, located 70 km SE of Mexico City. Its past activity comprises destructive episodes of lateral flank collapses and plinian phases. Its historical activity is characterized by cycles of extrusion of lava domes and their destruction through a combination of compaction and explosions (Campion et al., 2018), interspersed with quiet periods with continuous passive degassing (Taquet et al., 2019). The long duration of the ongoing eruption (>28 years at the time of writing) and its relatively high degassing rate are ideal to explore the link between the volcanic activity and the variability of the plume composition, which is one of the few observable manifestations of the magmatic processes. The previously reported short- or long-term time series of the HCl, HF, SO2, CO2, SiF4 species abundance and of their ratios in the Popocatépetl’s plume (Goff et al., 1998; Love et al., 1998; Goff et al., 2001; Gerlach, 2004; Stremme et al., 2011; Stremme et al., 2012; Taquet et al., 2017; Taquet et al., 2019) gave valuable information on the behavior of these species with respect to the volcanic activity. However, the optimal combination of eruptive and meteorological conditions for measurements is seldom met multiple times during a single dome growth episode. We focused here on a 2.5-month time-series spanning the full cycle of construction and destruction of dome 82 (according to reports of the local institution in charge of the monitoring, i.e., Centro Nacional de Prevención de Desastres or CENAPRED). Following a relatively intense extrusive activity during September–December 2018, with the succession of the dome emplacement-destruction cycles #80 and #81 (CENAPRED daily reports; Caballero Jimenez et al., 2019), January 2019 is marked by a powerful explosion on day 22, apparently without a dome occupying the crater. Such explosions are rare, but they became more frequent following the earthquakes of 2017 (Boulesteix et al., 2022). A crater overflight was operated on day 27, which confirmed that the crater was still empty and that the conduit was permeable. Caballero and Valderrama (2020) indeed report the observation of a thermal anomaly coinciding with that of Sentinel-2 data (see, e.g., Mounts processing, Valade et al., 2019) and with the emission source of passive degassing plumes, as already proposed in previous thermal imaging studies at Popocatépetl (e.g., Wright et al., 2002). Based on CENAPRED reports, following this explosion and before the onset of the dome growth episode, daily averages of ∼15 min of tremor, of 1.3 Volcano Tectonic (VT) earthquakes and of 150 exhalations (local term for low intensity explosions with little impulsive character) were recorded. On 15 February 2019, at approximately 2:55 UTC (14 February at 20:55, local time), the first 6 h-long LPs-tremor-explosions segment of this dome growth episode started. Its manifestation at the surface consisted in a “Strombolian-type” episode with sustained ash-venting, ejecting incandescent blocks on the external slopes of the cone. On 19 February 2019, an overflight confirmed the presence of a voluminous dome inside the crater with 200 m diameter (i.e., ∼1.3 Mm3 according to Valade et al., submitted). Similar 3–9 h-long tremor segments were recorded over the next days until day 27 summing to approximately 120 h. Another overflight on 28 February confirmed that the dome 82 was still occupying the crater. Between 26 February and 10 March 2019, 48 explosions were reported by CENAPRED (Figure 5), some of which (e.g., 1 and 9 March 2019) expelled incandescent blocks on the external slopes of the cone hundreds of meters downslope. This explosive activity resulted in 69 VAAC alerts, 29 of which occurred between 5–8 March. Strong degassing during the overflight on 7 March did not allow observations of the dome destruction. An image of 8 March in Google Earth offers a clear view on more than half of the crater floor, showing a stepped profile of the walls and clear marks of several explosions, confirming that the dome was destroyed during this explosion sequence. Eleven additional and sometimes large explosions occurred until the end of March, with a large outreach of the blocks that set fire to the highest altitude vegetation on 27 March 2019. The explosions ceased during April and the activity declined significantly with, e.g., a threefold decrease of the number of exhalations. Dome forming activity only returned in mid-July (Caballero and Valderrama, 2020).
Currently, there are several strategies to remotely monitor the emission of gases from Popocatépetl volcano, both in mobile (Campion et al., 2018) and static configurations (Taquet et al., 2017; Schiavo et al., 2019; Taquet et al., 2019; Arellano et al., 2021). Since 2012, the installation of the ALTZ Atmospheric Observatory in the Izta-Popo-Zoquiapan National Park, 11 km from the Popocatépetl crater, allowed the ICAyCC-UNAM team to perform not only atmospheric measurements, but also volcanic plume measurements using solar, lunar absorption (Stremme et al., 2012; Krueger et al., 2013; Taquet et al., 2019) and thermal emission (Stremme et al., 2011; Stremme et al., 2012; Taquet et al., 2017) FTIR spectroscopic techniques. This site benefits from a number of advantages such as open and direct view to the volcano, a high altitude to minimize the interferences from water vapor and anthropogenic pollutants, a safe distance from the crater and from abundant ash-falls, and the availability of operational services (power and communication). Apart from the HR-FTIR spectrometer (a Bruker IFS-125HR), the station was also equipped with meteorological instruments, visible cameras, in-situ gas analyzers for atmospheric and environmental monitoring, among other instrumentation. Additionally, remote sensing equipments including a UV camera, a Pandora, another DOAS spectrometer coupled with the HR-FTIR instrument and a low-resolution FTIR spectrometer (a Bruker EM27-MIR), occasionally allow measuring Popocatépetl’s plume composition with different configurations (solar absorption, thermal emission, UV scattered-light mode).
3 Instrumental set-up and analysis procedures
In this study, we present direct solar absorption measurements performed from the ALTZ station using the coupled HR-FTIR/DOAS set-up, and the Pandora spectrometer over a period of 2.5 years (2017-mid 2019). Plume measurements with this configuration are possible on days with clear sky conditions and only during favorable wind conditions, at times when the volcanic plume and the instrument are aligned with the Sun. Since both the DOAS instrument and Pandora are based on the DOAS technique, we hereafter referred to the DOAS integrated in the coupled HR-FTIR/DOAS set-up as “S2000 DOAS,” and as “Pandora” for the Pandora instrument. In the same way, the DOAS measurements made by the Pandora will be referred to as “Pandora measurements” while the DOAS measurements of the HR-FTIR/DOAS set-up will be referred to as “S2000 DOAS measurements.”
3.1 The combined FTIR-DOAS solar absorption measurements
A solar tracker (Camtracker; Gisi et al., 2011; Gisi et al., 2012; Gisi, 2012) located on the roof of the station collects the direct solar beam and reflects it into the container (see, e.g., Plaza-Medina et al., 2017; Taquet et al., 2019). A part of the solar beam is directed by mirrors toward the entrance of the S2000 DOAS optical fiber and the other part towards the FTIR spectrometer aperture (Figure 1).
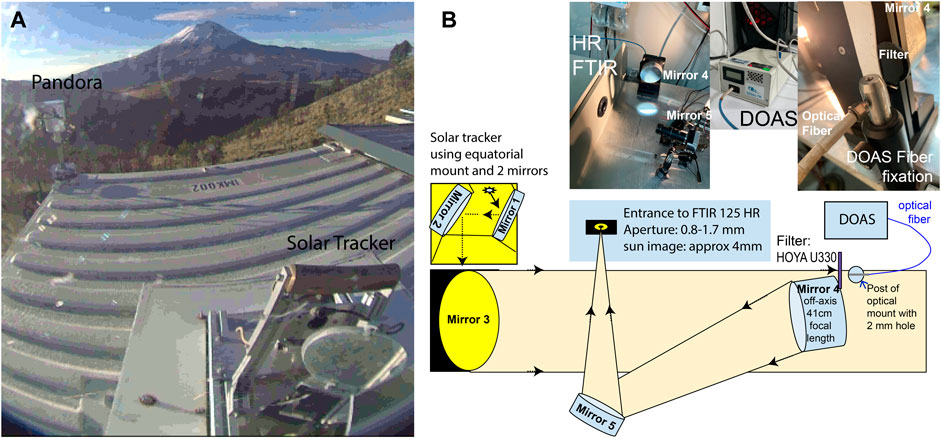
FIGURE 1. Set-up of the Pandora, HR-FTIR and S2000 DOAS instruments at the ALTZ station. (A) Global view of the instruments installed on the roof of the ALTZ station. (B) Instrumental set-up for the combined DOAS-FTIR measurements.
The Bruker IFS-125HR FTIR spectrometer can provide a maximal optical path difference (OPDmax) of 257 cm corresponding to a spectral resolution of 0.0035 cm−1 (resolution = 0.9/OPDmax). The spectrometer operates with either KBr or CaF2 beam splitters, three different detectors (MCT, InSb and InGaAs) and a set of seven optical filters installed in a rotating wheel. A remote control liquid-nitrogen filling system assures that the MCT and InSb detectors are properly cooled. The measurement routine was programmed to acquire high (0.005 cm−1), moderate (0.02 cm−1) and low (0.1 cm−1) resolution spectra in the near-infrared (NIR) and mid-infrared (MIR) spectral ranges using the different filters. The complete normal-mode sequence lasts ∼20 min. Every time the volcanic plume is observed in the optical path of the instrument, the acquisition is switched to a faster sequence, keeping only the NIR and the low resolution acquisitions with the NDACC filters three and 6 (∼5 min for a complete sequence). The field of view varies between 2 and 4 mrad, depending on the used optical filter and measurement configuration.
For the DOAS measurements, spectra were collected using an Ocean Optics S2000 spectrometer (spectral resolution of ∼0.6 nm) combined with an optical fiber and a band-pass filter (Hoya U330) which blocks visible light with wavelength between 360 and 640 nm. S2000 DOAS spectra were acquired using the DOASIS software (Kraus, 2006) adjusting automatically the exposure time to the Sun intensity. Collected spectra were averaged so that a final collection time of 1 min was achieved.
The container is thermally stabilized to provide optimal operating conditions for the different instruments. A remote-controlled dome cover and a microwave communication system (50 km line of sight to the university campus) allow us to fully control and perform the measurements remotely.
3.2 The Pandora measurements
A Pandora instrument (number 65) was implemented in the ALTZ station in 2018, and the data products have been available since January 2019. The Pandora head sensor is installed on the rooftop of the container, and points accurately to the Sun with a 2.5° field of view (FWHM SunFOV) using its own solar tracking system (SciGlob/NASA tracker). The head sensor is connected through an optical fiber to an Avantes spectrometer located in the thermally stabilized FTIR container. The spectrometer (model Avantes AvaSpec ULS 2048x64) has a 0.6 nm resolution (FWHM) covering the spectral range from 280 to 530 nm. Different bandpass and neutral density filters can be chosen and combined inside the optical head by two filter wheels, so that a large range of intensity is covered by the instrument and direct and indirect Sun or Moon light can be recorded. The measurement routine starts automatically in the morning, collecting direct solar spectra, but also hourly indirect sunlight spectra (zenith sky measurements, pointing above the crater and MAXDOAS-type measurements). During night time, lunar spectra are recorded, if possible. Spectra are sent to the central server of the PANDONIA Global Network (PGN, https://www.pandonia-global-network.org/) where the data are processed and analyzed.
3.3 Data analysis
3.3.1 UV analysis
3.3.1.1 Pandora data processing
In this study, we utilized the L2-rsus1p1-8 products available in the PGN server, in which the SO2 total columns are retrieved using the code “sus1” of the BlickSFA algorithm (Cede et al., 2021). The PGN retrievals follow the Cede et al. (2021) Total Optical Absorption Spectroscopy approach. It is based on non-linear least square fitting of the absorption cross-sections of multiple atmospheric absorbers to the spectra, and uses a synthetic solar absorption reference spectrum, constructed from the measurements of the same spectrometer. SO2 is fitted in the 306–326.4 nm spectral range (Table 1) with a fourth order smoothing polynomial function and includes the following cross sections: SO2 (Vandaele et al., 2009), O3 (Serdyuchenko et al., 2013), NO2 (Vandaele et al., 1998), HCHO (Meller and Moortgat, 2000), HONO (Stutz et al., 2000) and BrO (Wilmouth et al., 1999). Additionally, we explored the BrO slant columns density (SCD) product, one of the outputs of the PGN “fus5” algorithm, officially used to retrieve the HCHO species in the 322.5–359.2 nm spectral range. In this algorithm, all of the O3, NO2, SO2, HCHO, HONO, BrO species are fitted using the cross sections reported in Table 1. We converted the BrO SCDs to VCs to be compared with the S2000 DOAS products. Further details about the fitting procedures and calibrations can be found in Cede et al. (2021).
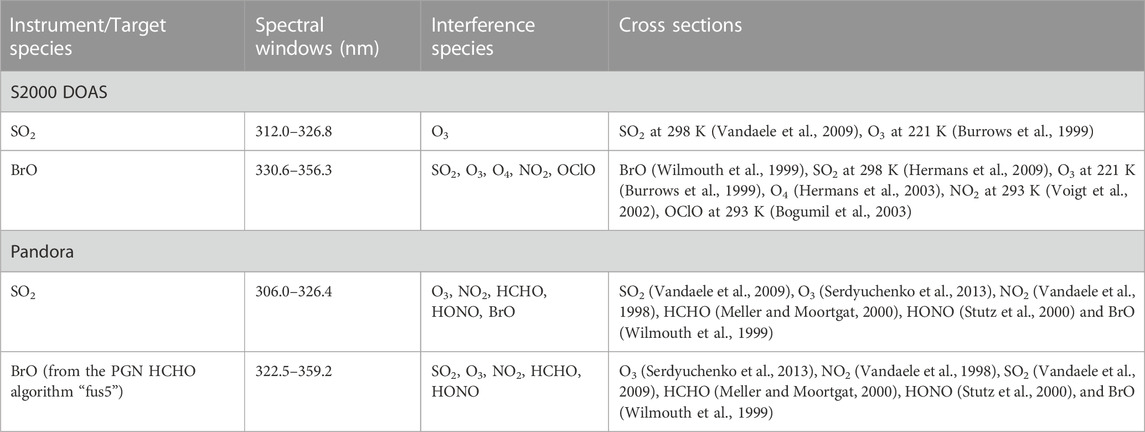
TABLE 1. Retrieval settings used for the S2000 DOAS and Pandora spectra analysis.
3.3.1.2 S2000 DOAS data processing
The UV spectra from the S2000 DOAS spectrometer were analyzed using the QDOAS software version 2.111 (Danckaert et al., 2013), developed by BIRA-IASB, which retrieves the SCDs of trace gases from the measured spectra, using a Marquardt Levenberg Non-Linear Least Squares (NLLS) Fitting algorithm. Wavelength calibration and slit function files were created with a low-density mercury lamp and were used as inputs in the QDOAS retrieval. An electronic offset correction was also measured and applied in the spectra analysis. SO2 was retrieved in the 312.0–326.8 nm spectral window (Table 1) following the Butz et al. (2017) procedure. In the retrieval, two cross sections were used: SO2 at 298 K (Vandaele et al., 2009) and O3 at 221 K (Burrows et al., 1999) as an interfering gas and a fifth-order polynomial function was included in the fitting routine to remove broad band extinction. Intensity offset, non-linear wavelength shift and first order stretching corrections were included in the DOAS fit settings. In contrast to the scattered light radiance measurements, the direct-sun configuration is not affected by the Ring effect (Herman et al., 2009), so that we did not include it in the retrieval. The retrieval of SO2 was performed applying two different strategies based on two different references. The “DOAS_v1” product is produced using the high resolution solar reference spectrum from Chance and Kurucz (2010) (“sao2010_solref_air.dat”: hereafter “RSAO”), and the “DOAS_v2” product obtained with a measured clear sky reference spectrum (hereafter “Rmeas”) acquired on 17 February 2019 with a solar zenith angle (SZA) close to zero. Fits and residuals obtained from the two strategies are presented in Figure 2. The use of a measured reference significantly improves the SO2 fits, limiting the effect of interfering atmospheric gases and avoiding structures of the solar spectrum. To correct the I0 effect (Platt and Stutz, 2008), QDOAS performs an on-line approximation by correcting the cross sections with the high resolution solar Fraunhofer spectrum, considering a fixed predefined SCDI0. The I0 effect was corrected as following for the full time series: six SO2 retrievals were performed using the QDOAS I0-correction algorithm for fixed SO2 slant column values of 0.0, 1.0 × 10¹⁸, 2.0 × 10¹⁸, 3.0 × 10¹⁸, 4.0 × 10¹⁸, 5.0 × 10¹⁸ molec/cm2 (the latter is close to the maximum uncorrected slant column). For each uncorrected datum, the most adequate I0-correction was interpolated from the five retrievals, depending on their slant column values. Only one iteration was required, since the difference between the slant columns obtained after the second and third iteration was lower than 1% of the retrieval error, so that the convergence was achieved after the second iteration. The O3 cross section was also I0-corrected using the fixed slant column value of 1.0 × 10¹⁹ molec/cm2, measured at Altzomoni by Plaza-Medina et al. (2017).
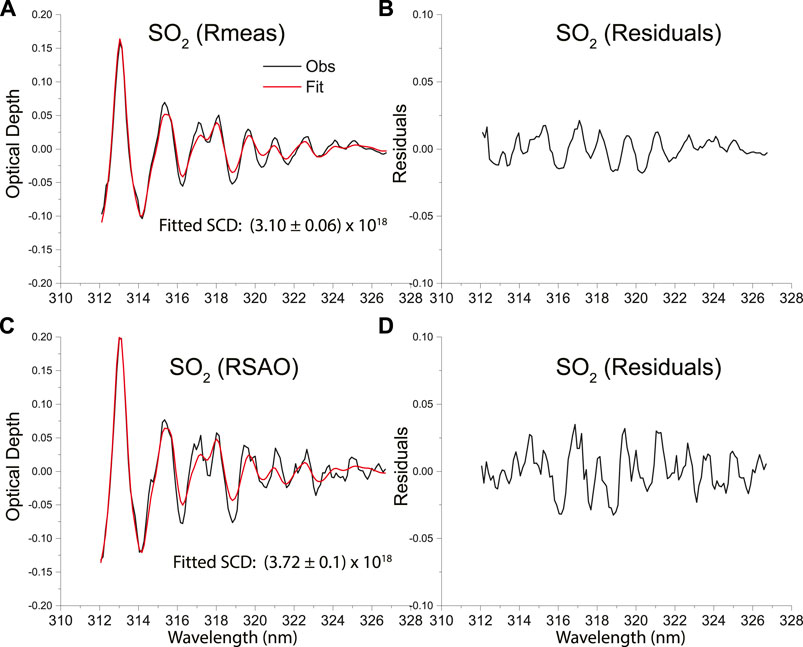
FIGURE 2. Example of fit of SO2 analyzed in the 312.0–326.8 nm spectral window from the S2000 DOAS measurements at ALTZ station performed on 20 February 2019 using (A) the measured reference (Rmeas) and (C) the RSAO reference. The corresponding residues are presented in (B,D), respectively. The retrieved slant column density (SCD, in molec/cm2) is shown in the legend.
BrO was analyzed in the 330.6–356.3 nm spectral window (Table 1) according to Gliß et al. (2015), including the following cross sections: BrO at 298 K (Wilmouth et al., 1999), SO2 at 298 K (Hermans et al., 2009), O3 at 221 K (Burrows et al., 1999), O4 (Hermans et al., 2003), NO2 at 293 K (Voigt et al., 2002), OClO at 293 K (Bogumil et al., 2003) and a third-order polynomial function was included in the fitting routine. The I0 correction was applied to the O3 cross-section. For the reference spectra, the same measured spectrum (Rmeas) as for the SO2 retrieval was used. OClO was tentatively quantified from the same spectral window and settings, but it was not detected during the study period. Figure 3 shows an example of a BrO fit from DOAS measurements at ALTZ station. Data affected by the presence of clouds or without volcanic plume contribution were discarded using the SO2 slant column uncertainties calculated by the QDOAS algorithm (based on the fit uncertainties) from the SO2 analysis. We only consider data for which the relative SO2 retrieval uncertainties were ≤20%. DOAS SO2 and BrO SCDs were then converted into VCs to be compared with the FTIR and Pandora products, by dividing them by the SZA-dependent air mass factor (1/cos (SZA)).
FIGURE 3. Example of fit of BrO analyzed in the (330.6–356.3 nm) spectral window from the DOAS measurements at ALTZ station performed on 20 February 2019. The retrieved slant column density (SCD, in molec/cm2) is shown in the legend.
3.3.2 FTIR analysis
SO2, HCl, HF, and SiF4 are retrieved from the high, medium and low resolution FTIR spectra using the PROFFIT9.6 retrieval code (Hase et al., 2004). Retrieval settings and strategies are detailed in Taquet et al. (2019) and summarized in Table 2. Examples of SO2, HCl, HF, and SiF4 fits are given in supplementary material (Supplementary Figures S3–S7). Importantly, this set-up allows the sequential analysis of the following pairs of gas species: SO2 and HCl (InSb detector, NDACC filter 3), HF and HCl (InGaAs detector, Open) and SO2 and SiF4 (MCT detector, NDACC Filter 6), corresponding to different spectral regions (see Table 2). The different SO2 (and HCl) products obtained using the different spectral ranges were calibrated and combined according to our previous study (Taquet et al., 2019). The only change with respect to Taquet et al. (2019) is the inclusion of the new spectral parameters for SiF4 measured by Boudon et al. (2020), allowing retrievals of SiF4 from both high (0.005 cm−1) and low (0.1 cm−1) resolution spectra. An estimation of the total error in the retrieved total columns is calculated by the PROFFIT code for all retrievals and includes systematic and statistical errors from different sources, such as the noise, baseline with channeling, Instrumental Line Shape (ILS), Line Of Sight (LOS) and spectroscopic parameters. The error analysis for this ALTZ instrument is described in more detail by Plaza-Medina et al. (2017). The channeling error (frequencies and amplitudes) for the instrument has been recently characterized and described by Blumenstock et al. (2020).
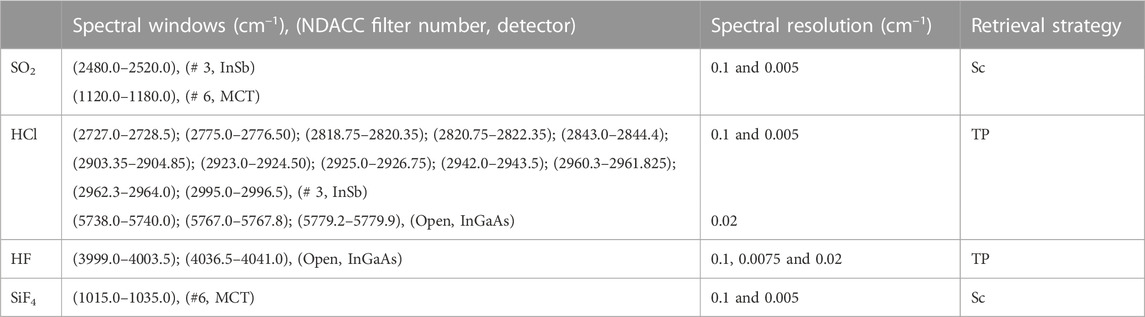
TABLE 2. Spectral ranges and retrieval strategies (detailed in Taquet et al., 2019) applied for the SO2, HCl, HF, and SiF4 analysis from the FTIR data. TP refers to a profile retrieval with a Tikhonov-Phillips regularization, and Sc to a scaling retrieval.
To evaluate the bias resulting from the use of the new spectroscopy in the SiF4 analysis, we re-evaluated the SiF4 VCs from the most significant SiF4 events recorded at ALTZ on 06 March 2015 (Taquet et al., 2019). The re-analysis of the low resolution spectra provided SiF4 columns slightly lower than previously published, by a factor of (0.94 ± 0.03) with a determination coefficient (R2) of 0.96. The spectral fits are only slightly improved, but still a systematic artefact depending on the SZA, likely due to spectral interferences, was observed in the new SiF4 time series. An empirical post-correction was applied to reduce this effect. A mean SiF4 VC was calculated for all SZA (using bins of 5°). The so-generated airmass-dependent function was used for the whole time series and the intraday variability of SiF4 was removed. Apart from increasing the number of SiF4 data in the time series, the SiF4 analysis from the high resolution spectra allows obtaining much lower total errors in the VCs than that for the low spectral resolution. For SiF4 total columns higher than 2 × 10¹⁵ molec/cm2, the SiF4 VCs total errors are lower than 20%, while those obtained from the low resolution spectra occasionally reached 60%.
The quality control procedure described in Taquet et al. (2019) is applied for the different target species and an additional filter selecting SO2 columns with relative total error <50% discards data with important uncertainties (presence of clouds, low signal, etc.).
4 Results
4.1 Intercomparison between the different instruments
4.1.1 SO2 VCs from S2000 DOAS, FTIR, and Pandora
The intercomparison between the SO2 VCs obtained from the FTIR, S2000 DOAS, and Pandora instruments is shown in Figure 4. Data pairs were chosen with a coincidence criterium equal to 1 min. Equations of regression lines (including uncertainties) are given in Table 3. SO2 vertical columns obtained from the DOAS measurements using the two different strategies described in Section 3.3.1 (DOAS_v1 vs. DOAS_v2) are perfectly correlated (Figure 4A, in green) with a slope of 0.85 ± 0.01 (y3) and a determination coefficient of 0.99. In comparison with the DOAS products (measured with the highest temporal frequency), a good correlation (R2 ≥ 0.90) is observed in Figure 4A (Table 3) for the FTIR (y1) and Pandora (y2) SO2 VCs products. The DOAS_v2 and the calibrated official Pandora SO2 products are consistent, with respective bias of 0.85 ± 0.01 (R2 = 0.99) and 0.92 ± 0.01 (R2 = 0.94) to the DOAS_v1 product. Using the pre-calibrated RSAO reference (DOAS_v1) in the QDOAS retrieval instead of a “measured reference” allows obtaining “absolute” vertical columns directly comparable with those obtained from other instruments (Herman et al., 2009). However, the use of a measured reference (DOAS_v2 product) has the advantage to considerably reduce the noise in the absorbance spectrum (Figure 2) improving the fits and minimizing the total errors. The possible contamination of the measured reference, however, has to be evaluated. For this, the measured reference used in the DOAS_v2 retrieval was pre-evaluated regarding its SO2 content using a literature solar background spectrum as a Fraunhofer reference spectrum (Chance and Kurucz, 2010) which was convolved with the instrumental line spread function. The resulting SO2 abundance of 9.1 × 10¹⁶ molec/cm2 is of the same order of magnitude as the mean fit error (5.0 ± 4.0 × 10¹⁶ molec/cm2) of the SCDs and can be considered negligible in our measurement conditions.
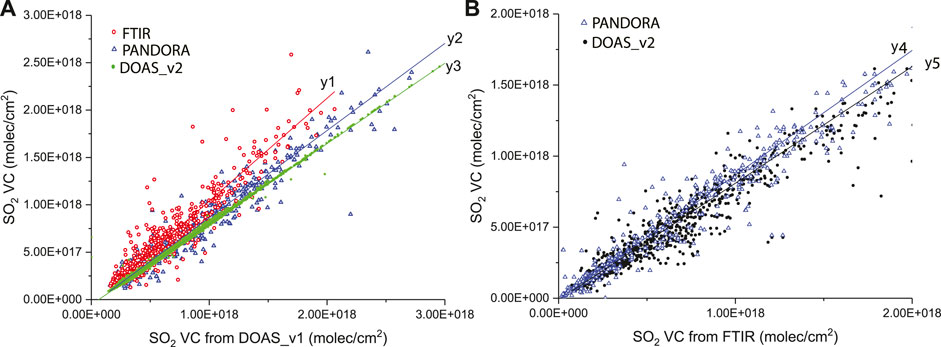
FIGURE 4. (A) Correlation plot of SO2 VCs obtained from S2000 DOAS, Pandora, and FTIR instruments. (B) Determination of calibration factors with respect to the FTIR SO2 product. Fit parameters are reported in Table 3.
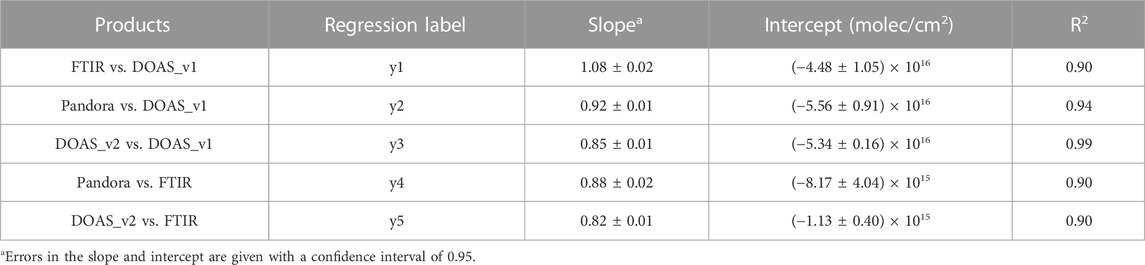
TABLE 3. Linear fit parameters obtained from the intercomparison of the FTIR, S2000 DOAS and Pandora SO2 products. R2 stands for the determination coefficient.
Because of our longtime record of FTIR measurements at the ALTZ station (Stremme et al., 2009; Stremme et al., 2011; Stremme et al., 2012; Taquet et al., 2017; Taquet et al., 2019), the FTIR SO2 product is hereafter used as our absolute reference, and the calibration factors defined in Figure 4B and reported in Table 3 were applied to the Pandora and DOAS_v2 products. The intercomparison was also examined at the intraday scale for different days, as shown in Figures 6A, B and Figures 7A, B, capturing explosive and passive degassing events during the dome growth episode of February 2019. The superimposition of the SO2 VCs (median difference <12%) from the three instruments highlights the possibility to combine them, increasing the time resolution of the SO2 time series and providing more pairs of coincident data for the calculation of the ratios.
4.1.2 BrO VCs from S2000 DOAS and Pandora
The Pandora and the DOAS BrO detections occurred on the same days (on the 16, 18 and 20/02/2019) during our 2.5-month time series. At the intraday scale (Figure 6), the BrO VCs from the two instruments agree within their uncertainties. However, the two time series are not well correlated (R2 of 0.74) and show a slope DOAS/Pandora around 1.2. The PGN “fus5” retrieval is indeed not optimized for recovering BrO which is not a PGN official product, so that we will not consider it further for combination with the other products.
4.2 SO2, HCl, HF, BrO and SiF4 VCs measurements in the Popocatépetl’s plume
The combination of the DOAS-FTIR instruments allowed the joint detection of more than 80 volcanic events during the whole measurement period (01/2017–05/2019), but the most significant SO2, HCl, HF, BrO, and SiF4 columns were recorded during the main dome growth episodes. BrO was only detected during two (December 2017 and February 2019) of the 11 dome growth and destruction episodes that occurred during our 2.5-year time series (public CENAPRED annual and daily reports: https://www.cenapred.unam.mx/reportesVolcanGobMX/). The February-March 2019 dome growth episode is the only one during which we capture the volcanic plume over several consecutive days with the three (FTIR, S2000 DOAS and Pandora) instruments, with optimal meteorological conditions. Indeed over the 77 days of the period February–April 2019, 67 allowed measuring at least 1 h with the solar absorption configuration, cumulating a total of 558 h of measurements. The volcanic plume was captured by the different instruments over 118 h, distributed over 33 days. Figure 5 reports the SO2, HCl, HF, BrO, SiF4 time series during this crisis, concurrently with the tremor duration (from the daily CENAPRED reports), generally associated with short-term (several hours) extrusive periods. During this episode, we distinguished three main activity periods (see Introduction): P1 (15 February–26 February 2019), dominated by the dome growth manifestations such as “Strombolian-type activity” accompanied by spasmodic tremor; P2 (26 February–16 March 2019) characterized by the occurrence of strong explosions accompanying and following the dome destruction; and P3 (16 March–18 April 2019) with low volcanic activity and without dome occupying the crater.
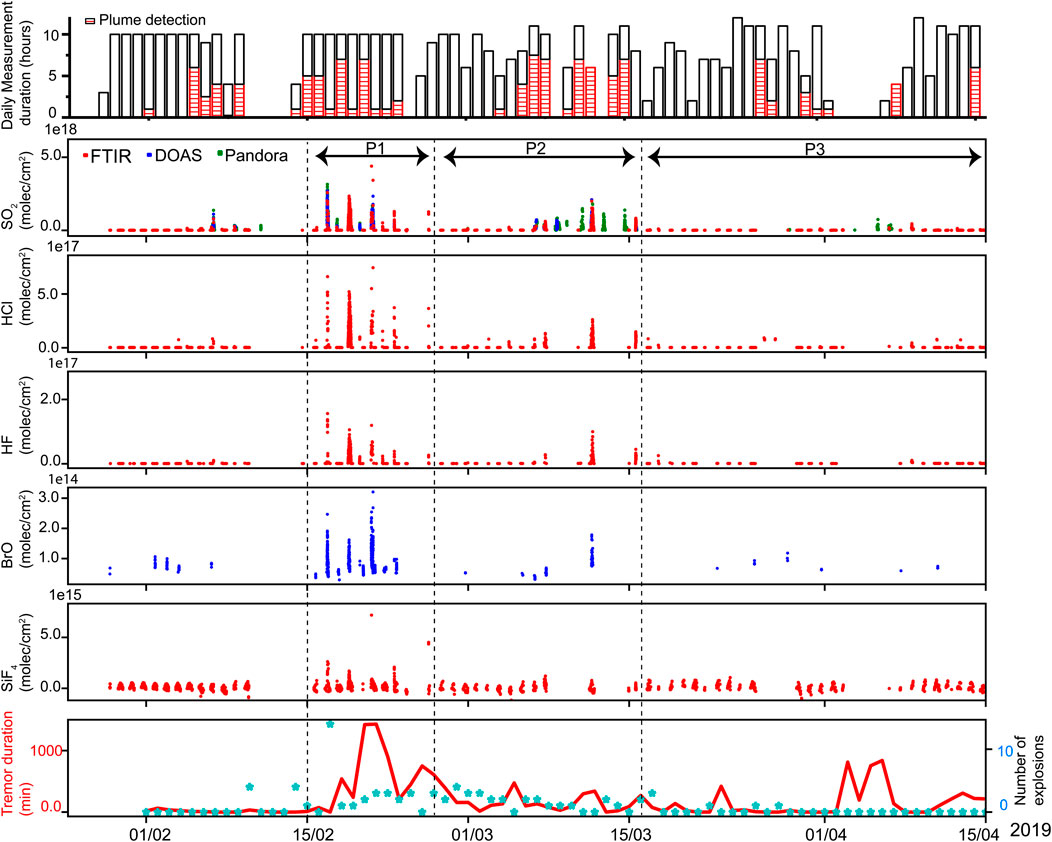
FIGURE 5. SO2, HCl, HF, BrO, and SiF4 VCs measured using S2000 DOAS, Pandora and FTIR instruments during the February–April 2019 period. The daily number of measurement hours and the number of hours affected by the presence of the volcanic plume are presented in the upper panel.
Appreciable SO2 columns were detected from 6 February 2019, at the same time as a small HCl and HF enhancement, unfortunately difficult to fully characterize on this day because of an unexpected interruption of the FTIR measurements. After that, even if small SO2 short-term events were occasionally captured during the following days, the hydrogen halide and active halogen species VCs remained close to their detection limits until the first Strombolian-type episode started (on 15 February 2019). High SO2, HCl, HF and BrO VCs were recorded during both the P1 and P2 periods, while significant columns of SiF4 were only detected during P1. During P1, we captured volcanic plumes emitted between tremor episodes, sometimes accompanied with Strombolian-type phases (on 16, 18, 20, 21, and 22 February 2019). Two of these detections were facilitated by optimal northward wind conditions, driving the plume toward the ALTZ station for several hours. During P2, we captured an explosion plume (on 7 March 2019) and passive degassing (on 6, 11, and 15 March 2019). Examples of intraday time series corresponding to the different phases of the dome growth cycle are presented in Figures 6, 7. Intraday ratios are also calculated “point by point” from the measurement pairs to show the intraday variability of each species with respect to that of SO2. Such ratios, occasionally combining VCs from different instruments (HF/SO2) and/or built upon species acquired within 1 min intervals, may be affected by noise errors and shall only be considered as indicative. For the longer-term comparison of the plume chemistry, we prefer the ratio obtained from daily correlation plots, averaging the noise and very short-term variations. Plume ages (±1 min) were estimated from the ALTZ webcams, capturing images every minute. All mentioned times are local winter times (UTC-6).
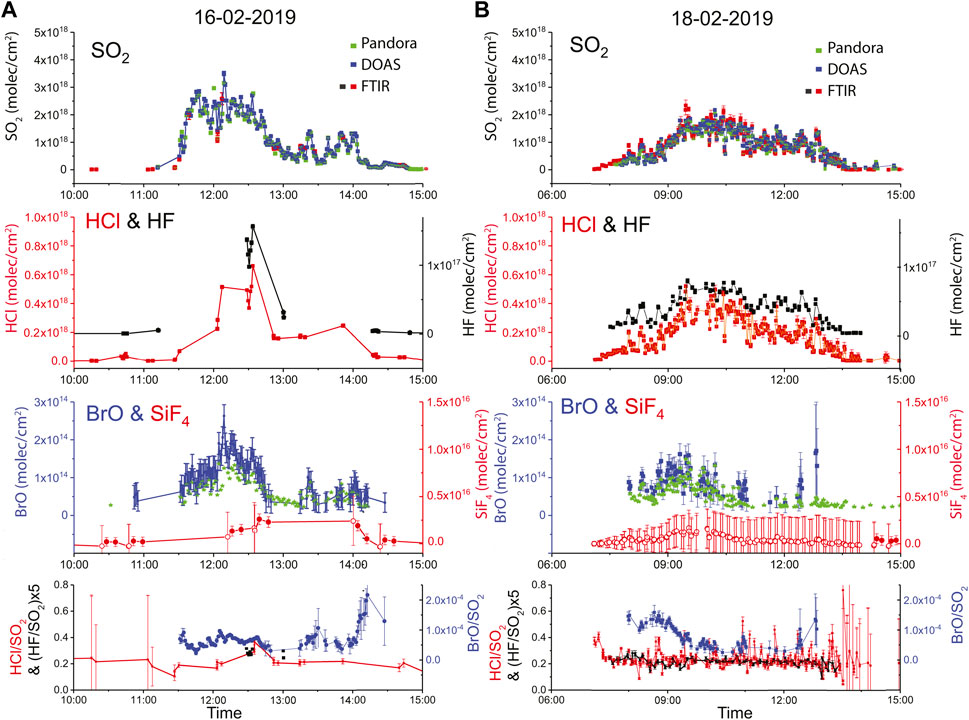
FIGURE 6. SO2, HCl, HF, BrO, SiF4 VCs intraday time series captured on the (A) 16 February 2019 and (B) 18 February 2019 using the S2000 DOAS, FTIR and Pandora instruments. For SiF4, open and full circles correspond to the low and high resolution products, respectively. The BrO from the Pandora instrument [third (A) and (B) panels, in green] corresponds to a non-official PNG product and is only indicative of the S2000 DOAS and Pandora BrO VCs agreement. The lower panel shows the time series of the HCl/SO2, HF/SO2 (×5) and BrO/SO2 ratios. See text for more details.
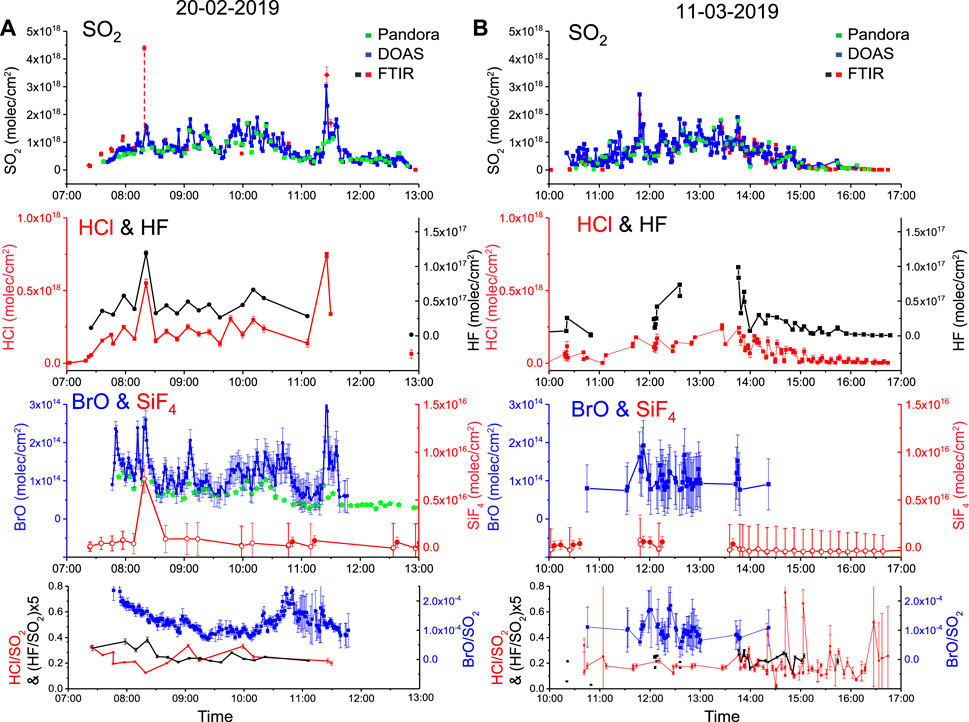
FIGURE 7. Same as Figure 6 for (A) 20 february 2019 and (B) 11 March 2019.
On 16 February 2019, our measurements take place during a passive degassing episode, a few hours after a ∼3-h long Strombolian-type episode. An abrupt increase of SO2 VCs was detected at 11:30, recording the arrival of the plume in the FTIR line of sight. This plume, aged of ∼20 min and free of ash, corresponds to a continuous degassing period between two Strombolian-type episodes (from ∼1:30 to ∼4:30 and from ∼16:00 to ∼20:30), in the early phases of the dome construction. BrO was initially detected at the same time as SO2, and abruptly increased around 12:05, as well as HF and HCl VCs. SO2 and BrO are well correlated after this event (regression y1c in Table 4; Figure 8). The intraday BrO/SO2 time series shows a small but statistically significant increase (>2 × Ratio error) between 11:45 and 13:00, coinciding with an apparent increase in the degassing (station’s webcams). Although the time resolution of the FTIR time series is less than that of DOAS, HCl/SO2 seems to show similar variations. The SiF4 species is also detected on this day but with a very low abundance, close to its detection limit (VCs <1σ).
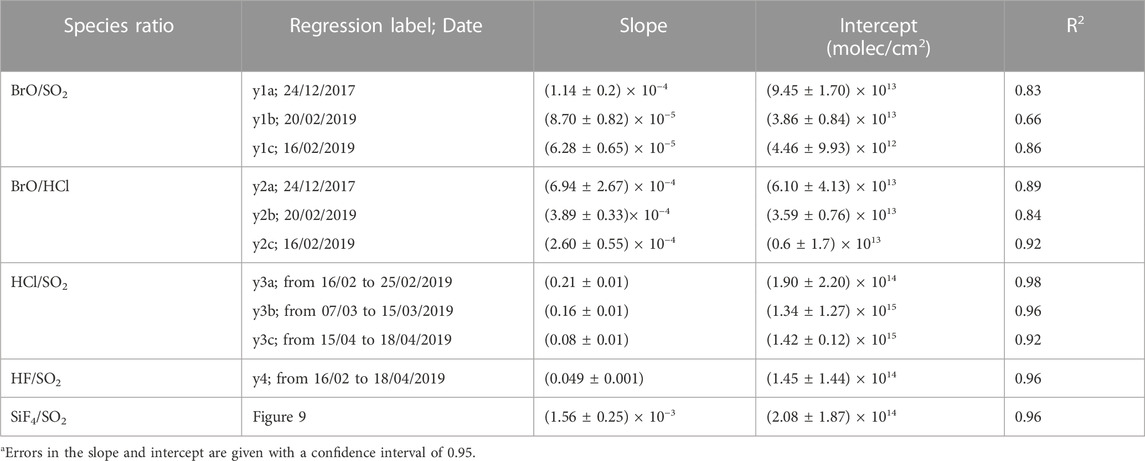
TABLE 4. Linear fit parameters obtained from the correlation plots as presented in Figures 8 and 9. R2 stands for the determination coefficient.
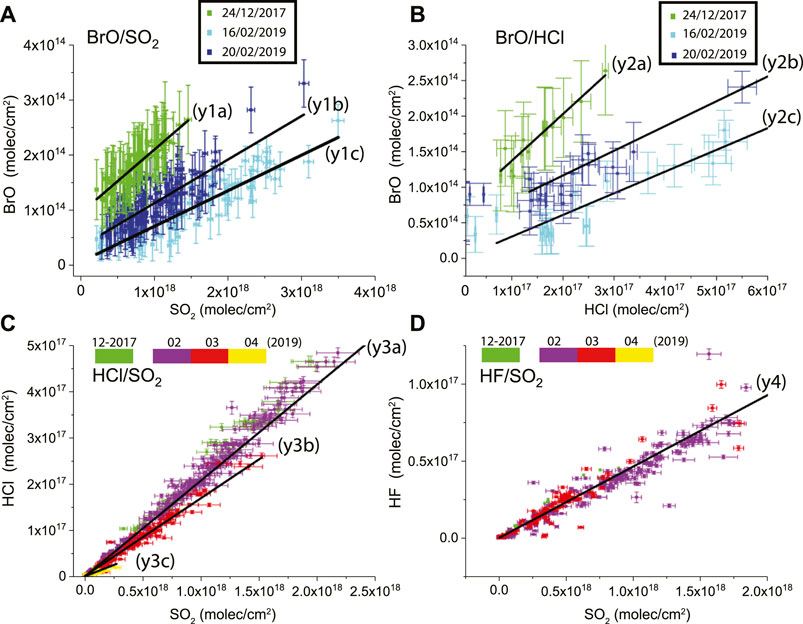
FIGURE 8. Correlation plots of (A) BrO vs. SO2, (B) BrO vs. HCl, (C) HCl vs. SO2 and (D) HF vs. SO2 VCs combining DOAS and FTIR data on 24 December 2017 and during the February–April 2019 dome cycle. The BrO/SO2, BrO/HCl, HCl/SO2 and HF/SO2 ratios were determined from the slopes of the correlation plots.
On 18 February 2019, we captured an ash-poor plume from continuous degassing during several hours, immediately following the end of a weak Strombolian-type episode (∼21:30 to ∼7:30 from CENAPRED reports) with few extra-crater projections. After a strong drop of ∼30 min duration in the degassing activity (from ∼6:30), an explosion occurred at 07:04, preceding the beginning of our measurements. Our measurements captured the return to a higher degassing regime. Wind speed was evaluated to more or less 20 m/s this day (from the GDAS/NOAA model), and the plume age can be estimated to be ∼15 min using the station webcam. The HF, HCl, and SO2 column variations remained perfectly correlated between them during the whole measured period as highlighted by the relatively constant HCl and HF to sulfur ratios of 0.20, 0.05 respectively. Although the intraday variability of the BrO VCs is the same order of magnitude as its total error, the BrO/SO2 is less affected and allows observing a progressive decrease between 07:30 and 09:30. This decrease is mainly controlled by an increase in SO2 columns during this period. Although the error of SiF4 VCs is also important, its time series follows the general trend of the other species.
On 20 February 2019 (Figure 7A), the measurements started during an ∼11-h long tremor episode and captured an ash-free plume, corresponding to continuous degassing. The wind conditions in the early morning drove the plume towards the ENE reaching the instruments field of view in about 21 min. At 07:52, a puff occurred (Supplementary Figure S2, supplementary material), and the plume reached the measurement line of sight at ∼ 08:11. At ∼8:45, the wind field changes towards the NE accompanying the rising Sun and the plume was progressively driven towards the station. A small puff occurred at 10:10, and an apparently more condensed plume was observed from 10:40 to 12:00 (Supplementary Figure S2, supplementary material). Despite the low time resolution of the FTIR measurements, SO2, HCl and HF time series have a similar behaviour, with coincident peaks at 08:20 and 11:25. BrO VCs are on average about a factor of 1.5 higher than that observed on 18 February 2019, and although its variability is different from that of the other species, it shows the same significant peaks at 08:20 and 11:25. The peak observed at 08:20 coincides with the arrival of the first puff plume in the optical path of the instrument. The BrO/SO2 linearly decreases with time until ∼9:30 when it reaches a plateau, increases again from 10:15 to 10:50 and finally drops again until the end of the measurements. HCl/SO2 and HF/SO2 oscillate around their average ratio, except for the slight decrease of HF/SO2 at the beginning of the time series until ∼9:00. SiF4 is detected over a short period (<30 min, two measurements: 7.2 × 10¹⁵ molec/cm2) with VCs much higher than those of the other presented days, closer to the values recorded on 6 March 2015 (1.2 × 10¹⁶ molec/cm2; Taquet et al., 2019). The BrO/SO2 peak at 10:50 coincides with the arrival of the more condensed plume (after the puff at 10:10) in the optical path of the instrument.
On 11 March 2019 (Figure 7B), we captured a northward blown plume from passive degassing a few days after the end of the dome destruction. The plume entered the instruments line of sight around 10:30 until 15:00. The SO2 peak at 11:46 corresponds to a plume coming from a small puff detected on the visible cameras above the crater at 11:30. HCl and SO2 vary in time with the same magnitude, such that the HCl/SO2 ratio is found to be almost constant. BrO is also detected, but contrary to the other days, BrO/SO2 does not present a specific trend, oscillating around its mean value.
4.3 BrO/SO2, HCl/SO2, HF/SO2, and BrO/HCl ratios at Popocatépetl
BrO/SO2, HCl/SO2, HF/SO2, and BrO/HCl ratios have been calculated from the intraday correlation plots from February to April 2019 and reported in Figure 8. For the calculation of the HF/SO2 (HF and SO2 measured with two different NDACC filters) and BrO/HCl ratios, we interpolated the SO2 and BrO S2000 DOAS time series (which have the highest time resolution) at the time of the FTIR measurements (HF, HCl). The interpolation is performed only if there are coincident data within an interval of 1 min for SO2 or 2 min for BrO. An evaluation of the bias generated by the use of the SO2 columns from the different instruments for the calculation of HF/SO2 and BrO/SO2 ratios is shown in supplementary material, Supplementary Figure S1. A maximum bias of 3% is found, making possible the combination of the different SO2 products to increase the number of coincident pairs, in particular for the HF/SO2 ratio. S2000 DOAS and FTIR SO2 products were therefore combined before the calculation of the different ratios, presented in Figure 8. Because of the rare occurrence of the BrO and SiF4 species in our 2.5-month time series, we added the event of 24 December 2017 (Figure 8 in green) which was one of the most significant events of our 2.5-year time series to give an idea of their long-time variability.
BrO/SO2 ratios (Figure 8A) are found in the range of [0.6–1.1] × 10−4, with a significantly higher ratio on 24 December 2017 than those reported for 2019. This falls in the higher range of the few ratios previously reported for the Popocatépetl volcano between 0.04 × 10⁻⁴ and 1.4 × 10⁻⁴ (Boichu et al., 2011; Bobrowski and Giuffrida, 2012; Platt and Bobrowski, 2015; Fickel and Delgado Granados, 2017) and compiled in Gutmann et al. (2018).
BrO/HCl (Figure 8B) ranges between 2.6 and 6.9 × 10⁻⁴ and shows similar slopes (∼3 × 10⁻⁴) during the 2019 dome growth phase (on 16 and 20 February 2019) but different offsets.
HCl/SO2 (Figure 8C) ranges between 0.08 ± 0.01 and 0.21 ± 0.01 and decreases with time during the 2019 dome growth cycle. Three different trend lines can be distinguished corresponding to three periods, from 15 to 25 February 2019, from 7 to 15 March 2019 and after this. The first two trend lines coincide with the dome growth (p1), and destruction (p2) periods described in Section 4.2, respectively. The third trend line (y3c), corresponding to the period p3, with very low HCl column abundances and low HCl/SO2 ratios characterizes a new phase without extrusive activity.
HF/SO2 (Figure 8D) correlation plot shows a more important dispersion, and only one trend line can be identified over the 2019 dome cycle, with a HF/SO2 ratio around 0.049 ± 0.001. This value is in accordance with the previous values measured since 2012 (from 0.01 to 0.04) (Taquet et al., 2019).
Our previous studies on the long-term variability of the Popocatépetl’s plume composition showed a link between the HCl/SO2 and the main long-term changes in the deep and shallow magmatic processes (intrusions, long-term cessation of extrusive activity, etc). In this study we examined the variability of this ratio during a complete dome growth cycle (timescale of several months), and found a clear increase of HCl with respect to sulfur during the period of dome growth. It decreased during the period of destruction and reached very small values when no dome sits on the floor of the crater. HF/SO2 does not show the same behavior and remains almost constant during the whole cycle. Its high intraday variability is likely due to in-plume reaction during the transport to the measurement locus.
Two types of SiF4 detections occurred over the 2.5 years survey, either 1) as transient peaks generally occurring during explosions with ash-rich plumes, too short-termed for correlations with the SO2 or HF to be clearly established, or 2) as several hour long enhancements with clear correlations with the other volcanic gas species, occurring only at the end of the dome growth episodes. Over the complete 2.5-years time series, only 6 days (Figure 9) allowed calculating an average SiF4/SO2 ratio, found equal to (1.56 ± 0.25) × 10−3, similar to the lowest values found in 2012–2016 (1.0 − 9.9 × 10⁻³; Taquet et al., 2019).
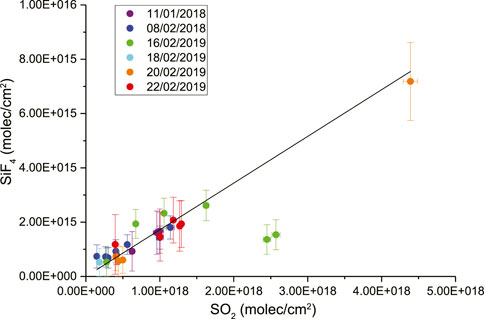
FIGURE 9. SiF4/SO2 correlation plot for the 2017–2019 measurement period. The slope is found to be (1.56 ± 0.25) × 10−3. Error bars represent the total errors of the FTIR VCs measurements, detailed in the text.
In our opinion, these two types of observation support the occurrence at Popocatépetl of both SiF4 generation mechanisms, as previously reported (Love et al., 1998; Taquet et al., 2017), i.e., 1) the HF interaction with silica in the closing connected porosity of a mature dome and 2) the in-plume reaction of HF with ash. BrO/SO2 and BrO/HCl have similar slopes on 16 and 20 February 2019, but further data are needed to explore its variability as a function of the dome growth phases. Finally, we compared our bromine to sulfur ratios with some of the meteorological parameters of interest available at the ALTZ station. The lowest ratio (6.3 ± 0.6 × 10⁻⁵), obtained on 16 February 2019 is recorded on the day with the highest RH (>48%). On 18 February 2019, the RH even falls under 10% over the measurement period with a mid-range ratio (Figure 6). The highest ratios were obtained on 24 December 2017 and 20 February 2019, 2 days characterized with low humidity conditions <24% and <34%, respectively, which do not favor the formation of BrO (Oppenheimer et al., 2006). These observations suggest that atmospheric humidity might not be the main control on BrO conversion at Popocatépetl. Furthermore, on 20 February 2019, the highest ratios are measured at ∼7:46, during sunrise, with a solar irradiance as low as 133 W/m2, which appears sufficient to allow the conversion of HBr into detectable amounts of BrO.
5 Discussion and conclusion
In this contribution, we explored the feasibility and performance of combining direct-sun measurements from S2000 DOAS, Pandora and HR-FTIR instruments to study the short-term variability of Popocatépetl’s plume composition. The SO2 vertical columns obtained from the three instruments were found similar after their intercalibration (median difference <12%), making it possible to combine the different products to increase the number of coincident data pairs in the ratios calculation. Although the DOAS instrument is generally used in “scattering” mode to continuously measure BrO/SO2 in volcanic plumes, there are important advantages of direct-sun such as the straightforward conversion from slant to vertical columns using a simple geometric determination of the airmass factor, and the absence of ring effect, thus considerably reducing the total errors. Moreover, this configuration is one of the most reliable allowing direct comparison with VCs from other techniques (FTIR) and determining ratios of species that are not detectable with the same technique. FTIR SiF4 retrieval was improved compared to that published in Taquet et al. (2019) using the new spectroscopy from Boudon et al. (2020) and allowing the treatment of high resolution spectra. The VCs total errors obtained from the low resolution products are only slightly improved, but the results obtained from the high resolution spectra are significantly more precise with total error <20% for total columns >2.0 × 10¹⁵ molec/cm2 when those from the low resolution spectra occasionally reached 60%.
The BrO/SO2 ratio was successfully quantified at a distance of 11 km from the crater, found between 0.6 and 1.1 × 10⁻⁴, in the range of the few values previously reported (Bobrowski and Giuffrida, 2012; Platt and Bobrowski, 2015; Fickel and Delgado Granados, 2017). However, HBr analysis from the high resolution FTIR spectra is not straightforward at this distance from the crater, and so as in Taquet et al. (2019), only a detection limit of 5.0 × 10¹⁴ molec/cm2 was calculated. Following this study and assuming the average Br/Cl ratio for arc volcanoes (2.2 ± 2.0 × 10⁻³; Gerlach, 2004), we calculate a speculative primitive HBr/SO2 for the surveyed period from the average HCl/SO2 ratio (0.21 ± 0.01) of (4.6 ± 4.2) × 10−4. Assuming the maximum value (8.8 × 10⁻⁴) within the uncertainty interval for this (HBr/SO2) ratio, our measured BrO/SO2 ratios would thus correspond to minimum HBr conversion rates of the order of 10%, which is in the range for plumes with an age equal to or higher than 15 min (Rüdiger et al., 2021). Using this detection limit, the maximum HBr/BrO ratio would then be between 0.11 and 0.19.
For the first time, the BrO/SO2, HCl/SO2, HF/SO2, BrO/HCl, and SiF4/SO2 ratios have been simultaneously measured in the Popocatépetl’s plume and their behavior with respect to the volcanic activity was explored at the scale of a dome growth cycle (several weeks). The decrease of the HCl/SO2 ratio after the dome destruction at the end of February 2019 suggests that halogen emissions are higher during the dome growth periods, i.e., during sustained ascension of the magma column, confirming the long-term observations reported in Taquet et al. (2019). HF/SO2 ratios apparently remain constant during the February to April 2019 period and show a high intraday variability. SiF4/SO2 was quantified on various occasions during the dome cycle period and apparently remains constant, equal to (1.56 ± 0.25) × 10−3 compatible with previous results (Goff et al., 1998; Love et al., 1998; Stremme et al., 2012; Taquet et al., 2017; Taquet et al., 2019). Considering a HF/SO2 average ratio of 0.049 ± 0.001 over the dome cycle period, we determine an average SiF4/HF ratio of 0.031 ± 0.001.
BrO/SO2 and HCl/SO2 apparently show different long-term variability, at least for the three examples presented here (on 24 December 2017 and on 16 and 20 February 2019), for which two significantly different BrO/SO2 ratios were found while the HCl/SO2 was found to be constant (Figure 8).
On a few occasions, clear patterns appear in the BrO/SO2 intraday time series (Figures 6, 7A) while the HCl/SO2 remains almost constant (flat baseline). These patterns, generally a few hours long, consisted either in decreasing trends (e.g., the first hours of 18 and 20 February) or increase/decrease sequences (e.g., 10:00–12:00 on 20 February). In particular, 2 days (16 and 20 February 2019) show significant BrO/SO2 variations, which are not dominated by the SO2 columns variability. The most significant variations (20 February 2019 between 10:50 and 12:00) occur coincidentally with a change in the aspect of the plume and might be related to changes in the plume moisture content, although further studies are needed to explore this aspect in more details. Surprisingly, the highest average BrO/SO2 ratio (recorded on 20 February 2019) is not observed during meteorological and sunlight intensity conditions (RH <34%, and solar irradiance ∼133 W/m2) that favour HBr conversion to BrO (c.f. Oppenheimer et al., 2006; Kern et al., 2009). Since the BrO content in the Popocatépetl’s plume may not be mainly controlled by the meteorological conditions or sunlight intensity, the impact of plume aerosol content has to be explored in future studies. BrO/HCl was quantified for the first time at Popocatépetl (from 2.6 to 6.9 × 10⁻⁴). It is found almost constant at the intraday scale but with significant day to day variability. Considering the BrO as full conversion from HBr, this is already a factor of 1.5–3.5 higher than the lower bound of Gerlach. (2004) Br/Cl range, and thus constitutes a first minimum constraint on this ratio at Popocatépetl. The maximum conversion rates ever described (65% at Ambrym, Vanuatu; Bani et al., 2009; Gutman et al., 2018) would provide a higher bound for this ratio at Popocatépetl of 1.08 × 10⁻³.
This study is a new step towards the establishment of a comprehensive highly time-resolved database of volcanic gas ratios for Popocatépetl by integrating multiple spectroscopic techniques. Such database should provide insight for, e.g., 1) delineating the degassing processes at Popocatépetl occurring during both passive degassing and extrusive phases, 2) refining the degassing balance by taking into account the in-plume interactions, and 3) comparing the degassing processes observed at Popocatépetl with those of analogue volcanoes.
Our study shows the benefits and performance of implementing a UV-Vis spectrometer on an existing HR-FTIR NDACC instrument to simultaneously measure the main primary and secondary volcanic gaseous species. Such implementation does not either disturb or interrupt the continuous solar absorption atmospheric measurements performed for the networks. This experiment could be reproduced at any other NDACC stations located near volcanoes, such as, e.g., the Izaña Observatory which recently recorded atmospheric data during the 2021-La Palma (Canary Islands, Spain) eruption (Garcia et al., 2022), at Maïdo observatory (La Réunion Island, France), or Mauna Loa Observatory (Hawaii), providing quasi-near-real-time critical data for the management of volcanic emergencies. High spectral resolution spectroscopic data also have the advantage to provide simultaneous atmospheric vertical profiles of both atmospheric and some volcanic species, giving new insight into the effect of volcanic emissions on the atmospheric chemistry and climate change.
Data availability statement
The raw data supporting the conclusion of this article will be made available by the authors, without undue reservation.
Author contributions
All the co-authors contributed in the development and the discussion of concepts, and to the preparation of the manuscript. NT, CR, and WS were responsible of the DOAS and FTIR measurements and the data analysis. MG and WS lead the ALTZ station development and its long-term operation. TBo participated to the measurements and to the interpretation. AB was responsible of the maintenance of the instruments at the Altzomoni station. OG contributes for the FTIR/DOAS intercomparison and discussions. TBl leads at KIT the German-Mexican collaboration for the deployment of the high resolution FTIR spectrometer and supports its long-term operation as part of NDACC. FH has helped in the design and setup of the spectrometer and solar tracker before it was shipped to Mexico. He has developed the retrieval code PROFFIT and gives continuously support to the UNAM group for its use and in operating the spectrometer.
Funding
We acknowledge financial support from grants UNAM-PAPIIT IA101620 and IN111521. NT and TBo also thank the stipend given by the Mexican Foreign Affairs Department (Secretaría de Relaciones Exteriores) and its AMEXCID program. Financial support from Conacyt-AEM through grant No. 275239 is acknowledged.
Acknowledgments
We thank the two reviewers for their very constructive comments, which help to significantly improve the manuscript. We thank R. Campion for fruitfull discussions on the degassing and activity of the Popocatépetl. We thank all the personnel of the CENAPRED for realizing the Popocatépetl activity reports. We thank the PGN team for the Pandora data processing. The PGN is a bilateral project supported with funding from NASA and ESA. We thank to C. Fayt, M. Van Roozendael, and A. Merlaud for their help to use the QDOAS software.
Conflict of interest
The authors declare that the research was conducted in the absence of any commercial or financial relationships that could be construed as a potential conflict of interest.
Publisher’s note
All claims expressed in this article are solely those of the authors and do not necessarily represent those of their affiliated organizations, or those of the publisher, the editors and the reviewers. Any product that may be evaluated in this article, or claim that may be made by its manufacturer, is not guaranteed or endorsed by the publisher.
Supplementary material
The Supplementary Material for this article can be found online at: https://www.frontiersin.org/articles/10.3389/feart.2023.1062699/full#supplementary-material
References
Aiuppa, A., Bellomo, S., D’Alessandro, W., Federico, C., Ferm, M., and Valenza, M. (2004). Volcanic plume monitoring at Mount Etna by diffusive (passive) sampling. J. Geophys. Res. 109, D21308. doi:10.1029/2003JD004481
Aiuppa, A., Bitetto, M., Delle Donne, D., La Monica, F. P., Tamburello, G., Coppola, D., et al. (2021). Volcanic CO2 tracks the incubation period of basaltic paroxysms. Sci. Adv. 7, eabh0191. doi:10.1126/sciadv.abh0191
Aiuppa, A. (2009). Degassing of halogens from basaltic volcanism: Insights from volcanic gas observations. Chem. Geol. 263 (1-4), 99–109. doi:10.1016/j.chemgeo.2008.08.022
Aiuppa, A., Federico, C., Antonio, P., Giovannella, P., and Mariano, V. (2002). S, Cl and F degassing as an indicator of volcanic dynamics: The 2001 eruption of Mount Etna. Geophys. Res. Lett. 29, 1559. doi:10.1029/2002GL015032
Aiuppa, A., Federico, C., Franco, A., Giudice, G., Gurrieri, S., Inguaggiato, S., et al. (2005). Emission of bromine and iodine from Mount Etna volcano. Geochem. Geophys. 6 (8). doi:10.1029/2005GC000965
Arellano, S., Galle, B., Apaza, F., Avard, G., Barrington, C., Bobrowski, N., et al. (2021). Synoptic analysis of a decade of daily measurements of SO2 emission in the troposphere from volcanoes of the global ground-based Network for Observation of Volcanic and Atmospheric Change. Earth Syst. Sci. Data 13 (3), 1167–1188. doi:10.5194/essd-13-1167-2021
Bani, P., Oppenheimer, C., Tsanev, V. I., Carn, S. A., Cronin, S. J., Crimp, R., et al. (2009). Surge in sulphur and halogen degassing from Ambrym volcano, Vanuatu. Vanuatu. Bull. Volcanol. 71, 1159–1168. doi:10.1007/s00445-009-0293-7
Bobrowski, N., and Giuffrida, G. (2012). Bromine monoxide/sulphur dioxide ratios in relation to volcanological observations at Mt. Etna 2006–2009. Solid earth. 3, 433–445. doi:10.5194/se-3-433-2012
Bobrowski, N., Hönninger, G., Galle, B., and Platt, U. (2003). Detection of bromine monoxide in a volcanic plume. Nature 423, 273–276. doi:10.1038/nature01625
Bobrowski, N., and Platt, U. (2007). Bromine monoxide studies in volcanic plumes. J. Volcanol. Geotherm. Res. 166, 147–160.doi:10.5194/acp-13-4749-2013
Bobrowski, N., Von Glasow, R., Aiuppa, A., Inguaggiato, S., Louban, I., Ibrahim, O. W., et al. (2007). Reactive halogen chemistry in volcanic plumes. J. Geophys. Res. Atmos. 112 (D6), D06311. doi:10.1029/2006jd007206
Bogumil, K., Orphal, J., Homann, T., Voigt, S., Spietz, P., Fleischmann, O. C., et al. (2003). Measurements of molecular absorption spectra with the SCIAMACHY pre-flight model: Instrument characterization and reference data for atmospheric remote sensing in the 230-2380 nm region. J. Photochem. Photobiol. A Chem. 157, 167–184. doi:10.1016/S1010-6030(03)00062-5
Boichu, M., Oppenheimer, C., Roberts, T. J., Tsanev, V., and Kyle, P. R. (2011). On bromine, nitrogen oxides and ozone depletion in the tropospheric plume of Erebus volcano, Atmos. Environ. 45, 3856–3866. doi:10.1016/j.atmosenv.2011.03.027
Boudon, V., Manceron, L., and Richard, C. (2020). High-resolution spectroscopy and analysis of the ν3, ν4 and 2ν4 bands of SiF4 in natural isotopic abundance. J. Quantitative Spectrosc. Radiat. Transf. 253, 107114. doi:10.1016/j.jqsrt.2020.107114
Boulesteix, T., Legrand, D., Taquet, N., Coppola, D., Laiolo, M., Valade, S., et al. (2022). Modulation of Popocatépetl’s activity by regional and worldwide earthquakes. Bull. Volcanol. 84, 80. doi:10.1007/s00445-022-01584-2
Burrows, J. P., Richter, A., Dehn, A., Deters, B., Himmelmann, S., Voigt, S., et al. (1999). Atmospheric remote-sensing reference data from GOME: Part 2. Temperature-Dependent absorption cross-sections of O3 in the 231-794 nm range. J. Quant. Spectrosc. Radiat. Transf. 61, 509–517. doi:10.1016/S0022-4073(98)00037-5
Burton, M., Allard, P., Muré, F., and La Spina, A. (2007). Magmatic gas composition reveals the source depth of slug-driven strombolian explosive activity. Science 317, 227–230. doi:10.1126/science.1141900
Burton, M. R., Oppenheimer, C., Horrocks, L. A., and Francis, P. W. (2001). Diurnal changes in volcanic plume chemistry observed by lunar and solar occultation spectroscopy. Geophys. Res. Lett. 28 (5), 843–846. doi:10.1029/2000gl008499
Butz, A., Dinger, A. S., Bobrowski, N., Kostinek, J., Fieber, L., Fischerkeller, C., et al. (2017). Remote sensing of volcanic CO2, HF, HCl, SO2, and BrO in the downwind plume of Mt. Etna. Atmos. Meas. Tech. 10, 1–14. doi:10.5194/amt-10-1-2017
Caballero, G., and Valderrama, S. (2020). Actividad del volcán Popocatépetl 2019. México. Mexico City: Centro Nacional de Prevención de Desastres.
Caballero Jimenez, G., Valderrama, S., and Espinasa Perena, R. (2019). Actividad del volcan Popocatépetl 2018. Mexico City: Centro Nacional de Prevención de Desastres.
Capion, R., Delgado-Granados, H., Legrand, D., Taquet, N., Boulesteix, T., Pedraza-Espitía, S., et al. (2018). Breathing and coughing: The extraordinarily high degassing of Popocatépetl volcano investigated with an SO2 camera. Front. Earth Sci. 6, 163. doi:10.3389/feart.2018.00163
Cede, A., Tiefengraber, M., Gebetsberger, M., and Spinei Lind, E. (2021). Pandonia global network data products readme document. Version 1.8-5. Available at: https://www.pandonia-global-network.org/wp-content/uploads/2022/01/PGN_DataProducts_Readme_v1-8-5.pdf.
Chance, K., and Kurucz, R. (2010). An improved high-resolution solar reference spectrum for Earth’s atmosphere measurements in the ultraviolet, visible, and near infrared. J. Quant. Spectrosc. Ra. 111, 1289–1295. doi:10.1016/j.jqsrt.2010.01.036
Danckaert, T., Fayt, C., Van Roozendael, M., De Smedt, I., Letocart, V., Merlaud, A., et al. (2013). QDOAS Software user manual. Belgium: Belgian Institute for Space Aeronomy.
De Hoog, J. C., Van Bergen, M. J., and Jacobs, M. H. (2005). Vapour-phase crystallisation of silica from SiF4-bearing volcanic gases. Ann. Geophys. 48 (4–5). doi:10.4401/ag-3233
Delmelle, P., Wadsworth, F. B., Maters, E. C., and Ayris, P. M. (2018). High temperature reactions between gases and ash particles in volcanic eruption plumes. Rev. Mineral. Geochem. 84, 285–308. doi:10.2138/rmg.2018.84.8
Dinger, F., Bobrowski, N., Warnach, S., Bredemeyer, S., Hidalgo, S., Arellano, S., et al. (2018). Periodicity in the BrO∕SO2 molar ratios in the volcanic gas plume of Cotopaxi and its correlation with the Earth tides during the eruption in 2015. Solid earth. 9, 247–266. doi:10.5194/se-9-247-2018
Dinger, F., Kleinbek, T., Dörner, S., Bobrowski, N., Platt, U., Wagner, T., et al. (2021). SO2 and BrO emissions of Masaya volcano from 2014 to 2020. Atmos. Chem. Phys. 21, 9367–9404. doi:10.5194/acp-21-9367-2021
Dingwell, D. B., and Mysen, B. O. (1985). Effects of water and fluorine on the viscosity of albite melt at high pressure: A preliminary investigation. Earth Planet. Sci. Lett. 74, 266–274. doi:10.1016/0012-821X(85)90026-3
Donovan, A., Tsanev, V., Oppenheimer, C., and Edmonds, M. (2014). Reactive halogens (BrO and OClO) detected in the plume of Soufriere Hills Volcano during an eruption hiatus. Geochem. Geophys. Geosyst. 15, 3346–3363. doi:10.1002/2014GC005419
Edmonds, M., Herd, R. A., Galle, B., and Oppenheimer, C. M. (2003). Automated, high time-resolution measurements of SO2 flux at Soufrière Hills Volcano, Montserrat. Bull. Volcanol. 65, 578–586. doi:10.1007/s00445-003-0286-x
Edmonds, M., Pyle, D., and Oppenheimer, C. (2002). HCl emissions at Soufrière Hills Volcano, Montserrat, west indies, during a second phase of dome building: November 1999 to october 2000. Bull. Volcanol. 64, 21–30. doi:10.1007/s00445-001-0175-0
Fickel, M., and Delgado Granados, H. (2017). On the use of different spectral windows in DOAS evaluations: Effects on the estimation of SO2 emission rate and mixing ratios during strong emission of Popocatépetl volcano. Chem. Geol. 462, 67–73. doi:10.1016/j.chemgeo.2017.05.001
Francis, P., Burton, M. R., and Oppenheimer, C. (1998). Remote measurements of volcanic gas compositions by solar occultation spectroscopy. Nature 396 (6711), 567–570. doi:10.1038/25115
Francis, P., Maciejewski, A., Oppenheimer, C., Chaffin, C., and Caltabiano, T. (1995). SO2∶HCl ratios in the plumes from Mt. Etna and vulcano determined by fourier transform spectroscopy. Geophys. Res. Lett. 22, 1717–1720. doi:10.1029/95GL01657
Galle, B., Johansson, M., Rivera, C., Zhang, Y., Kihlman, M., Kern, C., et al. (2010). Network for observation of volcanic and atmospheric change (NOVAC)—a global network for volcanic gas monitoring: Network layout and instrument description. J. Geophys. Res. 115, D05304. doi:10.1029/2009JD011823
García, O., Stremme, W., Taquet, N., Hase, F., Ortega, I., Hannigan, J., et al. (2022). Sulphur dioxide from ground-based Fourier transform infrared spectroscopy: Application to volcanic emissions. TCCON/COCCON/NDACC 2022 Jt. Meet.
Gerlach, T., and Graeber, E. (1985). Volatile budget of Kilauea volcano. Nature 313, 273–277. doi:10.1038/313273a0
Gerlach, T. M. (2004). Volcanic sources of tropospheric ozone-depleting trace gases. Geochem. Geophys. Geosystems 5 (9), Q09007. doi:10.1029/2004GC000747
Gisi, M., Hase, F., Dohe, S., and Blumenstock, T. (2011). Camtracker: A new camera controlled high precision solar tracker system for ftir-spectrometers. Atmos. Meas. Tech. 4, 47–54. doi:10.5194/amt-4-47-2011
Gisi, M., Hase, F., Dohe, S., Blumenstock, T., Simon, A., and Keens, A. (2012). XCO2-measurements with a tabletop FTS using solar absorption spectroscopy. Atmos. Meas. Tech. 5, 2969–2980. doi:10.5194/amt-5-2969-2012
Gisi, M. (2012). Setup of precise camera based solar tracker systems and greenhouse gas measurements using a modified portable spectrometer. Doctoral dissertation. Karlsruhe: Karlsruher Institut für Technologie (KIT). doi:10.5445/IR/1000031248
Gliß, J., Bobrowski, N., Vogel, L., Pöhler, D., and Platt, U. (2015). OClO and BrO observations in the volcanic plume of Mt. Etna – implications on the chemistry of chlorine and bromine species in volcanic plumes. Atmos. Chem. Phys. 15, 5659–5681. doi:10.5194/acp-15-5659-2015
Goff, F., Janik, C. J., Delgado, H., Werner, C., Counce, D., Stimac, J. A., et al. (1998). Geochemical surveillance of magmatic volatiles at Popocatépetl volcano, Mexico. Geol. Soc. Am. Bull. 110, 695–710. doi:10.1130/0016-7606(1998)110<0695:GSOMVA>;2.3.CO;2
Goff, F., Love, S. P., Warren, R., Counce, D., Obenholzner, J., Siebe, C., et al. (2001). Passive infrared remote sensing evidence for large, intermittent CO2 emissions at Popocatépetl volcano, Mexico. Chem. Geol. 177, 133–156. doi:10.1016/S0009-2541(00)00387-9
Gutmann, A., Bobrowski, N., Roberts, T. J., Rüdiger, J., and Hoffmann, T. (2018). Advances in bromine speciation in volcanic plumes. Front. Earth Sci. 6, 213. doi:10.3389/feart.2018.00213
Hase, F., Hannigan, J., Coffey, M., Goldman, A., Hopfner, M., Jones, N., et al. (2004). Intercomparison of retrieval codes used for the analysis of highresolution, ground-based FTIR measurements. J. Quant. Spectrosc. Radiat. Transf. 87, 25–52. doi:10.1016/j.jqsrt.2003.12.008
Herman, J., Cede, A., Spinei, E., Mount, G., Tzortziou, M., and Abuhassan, N. (2009). NO2 column amounts from ground-based Pandora and MFDOAS spectrometers using the direct-sun DOAS technique: Intercomparisons and application to OMI validation. J. Geophys. Res. 114,D13307. doi:10.1029/2009JD011848
Hermans, C., Vandaele, A. C., Fally, S., Carleer, M., Colin, R., Coquart, B., et al. (2003). Absorption cross-section of the collision-induced bands of oxygen from the UV to the NIR. Proc. NATO Adv. Res. Workshop, Weakly Interact. Mol. Pairs Unconv. Absorbers Radiat. Atmos. France. NATO Sci. Ser. IV Earth Environ. Sci. 27, 193–202. doi:10.1007/978-94-010-0025-3_16
Hermans, C., Vandaele, A., and Fally, S. (2009). Fourier transform measurements of SO2 absorption cross sections: I. Temperature dependence in the 24 000–29 000 cm-1 (345–420 nm) region. J. Quant. Spectrosc. Ra. 110, 756–765. doi:10.1016/j.jqsrt.2009.01.031
Heue, K.-P., Brenninkmeijer, C. A. M., Baker, A. K., Rauthe-Schöch, A., Walter, D., Wagner, T., et al. (2011). SO2 and BrO observation in the plume of the eyjafjallajökull volcano 2010: CARIBIC and GOME-2 retrievals. Atmos. Chem. Phys. 11, 2973–2989. doi:10.5194/acp-11-2973-2011
Kern, C., Sihler, H., Vogel, L., Rivera, C., Herrera, M., and Platt, U. (2009). Halogen oxide measurements at Masaya Volcano, Nicaragua using active long path differential optical absorption spectroscopy. Bull. Volcanol. 71, 659–670. doi:10.1007/s00445-008-0252-8
Krueger, A., Stremme, W., Harig, R., and Grutter, M. (2013). Volcanic SO2 and SiF4 visualization using 2-D thermal emission spectroscopy - Part 2: Wind propagation and emission rates. Atmos. Meas. Tech. 6, 47–61. doi:10.5194/amt-6-47-2013
Love, S. P., Goff, F., Counce, D., Siebe, C., and Delgado, H. (1998). Passive infrared spectroscopy of the eruption plume at Popocatépetl volcano, Mexico. Nature 396, 563–567. doi:10.1038/25109
Love, S. P., Goff, F., Schmidt, S. C., Counce, D., Pettit, D., Christenson, B. W., et al. (2000). Passive infrared spectroscopic remote sensing of volcanic gases: Ground-based studies at white Island and ruapehu, New Zealand, and Popocatepetl, Mexico. Geophys. Monograph-American Geophys. Union 116, 117–138. doi:10.1029/GM116p0117
Lübcke, P., Bobrowski, N., Arellano, S., Galle, B., Garzón, G., Vogel, L., et al. (2014). BrO/SO2 molar ratios from scanning DOAS measurements in the NOVAC network. Solid earth. 5, 409–424. doi:10.5194/se-5-409-2014
Martin, R. S., Wheeler, J. C., Ilyinskaya, E., Braban, C. F., and Oppenheimer, C. (2012). The uptake of halogen (HF, HCl, HBr and HI) and nitric (HNO3) acids into acidic sulphate particles in quiescent volcanic plumes. Chem. Geol. 296-297, 19–25. doi:10.1016/j.chemgeo.2011.12.013
McGonigle, A. J. S., Delmelle, P., Oppenheimer, C., Tsanev, V. I., Delfosse, T., Williams-Jones, G., et al. (2004). SO2 depletion in tropospheric volcanic plumes. Geophys Res. Lett. 31, L13201. doi:10.1029/2004GL019990
Meller, R., and Moortgat, G. K. (2000). Temperature dependence of the absorption cross sections of formaldehyde between 223 and 323 K in the wavelength range 225-375 nm. J. Geophys. Res. 105 (6), 7089–7101. doi:10.1029/1999JD901074
Mori, T., Notsu, K., Tohjima, Y., and Wakita, H. (1993). Remote detection of HCl and SO2 in volcanic gas from Unzen volcano, Japan. J. Geophys. Res. 13, 1355–1358. doi:10.1029/93gl01065
Mori, T., Sato, M., Shimoike, Y., and Notsu, K. (2002). High SiF4/HF ratio detected in Satsuma-Iwojima volcano’s plume by remote FT-IR observation. Earth Planets Space 54, 249–256. doi:10.1186/BF03353024
Notsu, K., and Mori, T. (2010). Chemical monitoring of volcanic gas using remote FT-IR spectroscopy at several active volcanoes in Japan. Appl. Geochem. 25 (4), 505–512. doi:10.1016/j.apgeochem.2010.01.008
Oppenheimer, C., Francis, P., and Maciejewski, A. J. H. (1998). Spectroscopic observation of HCl degassing from Soufriere Hills volcano, Montserrat. Geophys. Res. Lett. 25 (19), 3689–3692. doi:10.1029/98gl01584
Oppenheimer, C., and McGonigle, A. J. (2004). Exploiting ground-based optical sensing technologies for volcanic gas surveillance. Ann. Geophys. 47 (4).
Oppenheimer, C., Tsanev, V. I., Braban, C. F., Cox, R. A., Adams, J. W., Aiuppa, A., et al. (2006). BrO formation in volcanic plumes. Geochim. Cosmochim. Acta 70 (12), 2935–2941. doi:10.1016/j.gca.2006.04.001
Platt, U., Bobrowski, N., and Butz, A. (2018). Ground-based remote sensing and imaging of volcanic gases and quantitative determination of multi-species emission fluxes. Geosciences 8 (2), 44. doi:10.3390/geosciences8020044
Platt, U., and Bobrowski, N. (2015). “Quantification of volcanic reactive halogen emissions,” in Volcanism and global environmental change (Cambridge: University Press), 115–132.
Platt, U., and Stutz, J. (2008). Differential optical absorption spectroscopy (DOAS), principle and applications. Heidelberg: Springer-Verlag.
Plaza-Medina, E. F., Stremme, W., Bezanilla, A., Grutter, M., Schneider, M., Hase, F., et al. (2017). Ground-based remote sensing of O3 by high- and medium-resolution FTIR spectrometers over the Mexico City basin. Atmos. Meas. Tech. 10, 2703–2725. doi:10.5194/amt-10-2703-2017
Rix, M., Valks, P., Hao, N., Loyola, D., Schlager, H., Huntrieser, H., et al. (2012). Volcanic SO2, BrO and plume height estimations using GOME-2 satellite measurements during the eruption of Eyjafjallajökull in May 2010. J. Geophys. Res. 117, D00U19. doi:10.1029/2011JD016718
Rodríguez, L. A., Watson, I. M., Edmonds, M., Ryan, G., Hards, V., Oppenheimer, C. M. M., et al. (2008). SO2 loss rates in the plume emitted by Soufrière Hills volcano, Montserrat. J. Volcanol. Geotherm. Res. 173, 135–147. doi:10.1016/j.jvolgeores.2008.01.003
Rüdiger, J., Gutmann, A., Bobrowski, N., Liotta, M., de Moor, J. M., Sander, R., et al. (2021). Halogen activation in the plume of masaya volcano: Field observations and box model investigations. Atmos. Chem. Phys. 21, 3371–3393. doi:10.5194/acp-21-3371-2021
Schiavo, B., Stremme, W., Grutter, M., Campion, R., Guarin, C. A., Rivera, C., et al. (2019). Characterization of a UV camera system for SO2 measurements from Popocatépetl Volcano. J. Volcanol. Geotherm. Res. 370, 82–94. doi:10.1016/j.jvolgeores.2018.09.001
Schipper, C. I., Castro, J. M., Kennedy, B. M., Christenson, B. W., Aiuppa, A., Alloway, B., et al. (2019). Halogen (Cl, F) release during explosive, effusive, and intrusive phases of the 2011 rhyolitic eruption at Cordón Caulle volcano (Chile). Volcanica 2 (1), 73–90. doi:10.30909/vol.02.01.7390
Serdyuchenko, A., Gorshelev, V., Weber, M., Chehade, W., and Burrows, J. P. (2013). High spectral resolution ozone absorption cross-sections - Part 2: Temperature dependence. Atmos. Meas. Tech. Discuss. 6, 6613–6643. doi:10.5194/amtd-6-6613-2013
Shinohara, H. (2009). A missing link between volcanic degassing and experimental studies on chloride partitioning. Chem. Geol. 263 (1-4), 51–59. doi:10.1016/j.chemgeo.2008.12.001
Smekens, J. F., Mather, T. A., Burton, M. R., La Spina, A., Kabbabe, K., Esse, B., et al. (2023). Quantification of gas, ash, and sulphate aerosols in volcanic plumes from open path Fourier transform infrared (OP-FTIR) emission measurements at Stromboli volcano, Italy. Front. Earth Sci. 10, 1005738. doi:10.3389/feart.2022.1005738
Stremme, W., Krueger, A., Harig, R., and Grutter, M. (2012). Volcanic SO2 and SiF4 visualization using 2-D thermal emission spectroscopy - Part 1: Slant-columns and their ratios. Atmos. Meas. Tech. 5, 275–288. doi:10.5194/amt-5-275-2012
Stremme, W., Ortega, I., and Grutter, M. (2009). Using ground-based solar and lunar infrared spectroscopy to study the diurnal trend of carbon monoxide in the Mexico City boundary layer. Atmos. Chem. Phys. 9, 8061–8078. doi:10.5194/acp-9-8061-2009
Stremme, W., Ortega, I., Siebe, C., and Grutter, M. (2011). Gas composition of Popocatépetl volcano between 2007 and 2008: FTIR spectroscopic measurements of an explosive event and during quiescent degassing. Earth Planet. Sci. Lett. 301, 502–510. doi:10.1016/j.epsl.2010.11.032
Stutz, J., Kim, E. S., Platt, U., Bruno, P., Perrino, C., and Febo, A. (2000). UV-visible absorption cross sections of nitrous acid. J. Geophys. Res. Atmos. 105 (11), 14585–14592. doi:10.1029/2000jd900003
Taquet, N., Hernández, I. M., Stremme, W., Bezanilla, A., Grutter, M., Campion, R., et al. (2017). Continuous measurements of SiF4 and SO2 by thermal emission spectroscopy: Insight from a 6-month survey at the Popocatépetl volcano. J. Volcanol. Geotherm. Res. 341, 255–268. doi:10.1016/j.jvolgeores.2017.05.009
Taquet, N., Stremme, W., Grutter, M., Baylón, J., Bezanilla, A., Schiavo, B., et al. (2019). Variability in the gas composition of the Popocatépetl volcanic plume. Front. Earth Sci. 7, 114. doi:10.3389/feart.2019.00114
Valade, S., Ley, A., Massimetti, F., D’Hondt, O., Laiolo, M., Coppola, D., et al. (2019). Towards global volcano monitoring using multisensor Sentinel missions and artificial intelligence: The MOUNTS monitoring system. Remote Sens. 11, 1528. doi:10.3390/rs11131528
Vandaele, A. C., Hermans, C., and Fally, S. (2009). Fourier transform measurements of SO2 absorption cross sections: II. Temperature dependence in the 29000-44000 cm-1 (227-345 nm) region. J. Quant. Spectrosc. Radiat. Transf. 110, 2115–2126. doi:10.1016/j.jqsrt.2009.05.006
Vandaele, A. C., Hermans, C., Simon, P. C., Carleer, M., Colin, R., Fally, S., et al. (1998). Measurements of the NO2 absorption cross-section from 42,000 cm-1 to 10,000 cm-1 (238-1000 nm) at 220 K and 294 K. J. Quant. Spectrosc. Radiat. Transf. 59, 171–184. doi:10.1016/S0022-4073(97)00168-4
Voigt, C., Jessberger, P., Jurkat, T., Kaufmann, S., Baumann, R., Schlager, H., et al. (2014). Evolution of CO2, SO2, HCl, and HNO3 in the volcanic plumes from Etna. Geophys. Res. Lett. 41, 2196–2203. doi:10.1002/2013GL058974
Voigt, S., Orphal, J., and Burrows, J. (2002). The temperature and pressure dependence of the absorption cross-sections of NO2 in the 250–800 nm region measured by Fourier-transform spectroscopy. J. Photoch. Photobio. A 149, 1–7. doi:10.1016/S1010-6030(01)00650-5
Warnach, S., Bobrowski, N., Hidalgo, S., Arellano, S., Sihler, H., Dinger, F., et al. (2019). Variation of the BrO/SO2 molar ratio in the plume of Tungurahua volcano between 2007 and 2017 and its relationship to volcanic activity. Front. Earth Sci. 7, 132. doi:10.3389/feart.2019.00132
Wilmouth, D. M., Hanisco, T. F., Donahue, N. M., and Anderson, J. G. (1999). Fourier transform ultraviolet spectroscopy of the A 2Π 3/2 ← X 2Π 3/2 transition of BrO. J. Phys. Chem. A 103, 8935–8945. doi:10.1021/jp991651o
Woitischek, J., Woods, A. W., Edmonds, M., Oppenheimer, C., Aiuppa, A., Pering, T. D., et al. (2020). Strombolian eruptions and dynamics of magma degassing at Yasur Volcano (Vanuatu). J. Volcanol. Geotherm. Res. 398, 106869. doi:10.1016/j.jvolgeores.2020.106869
Keywords: solar absorption spectroscopy, volcanic degassing, Popocatépetl, FTIR, DOAS, Pandora, dome cycle
Citation: Taquet N, Rivera Cárdenas C, Stremme W, Boulesteix T, Bezanilla A, Grutter M, García O, Hase F and Blumenstock T (2023) Combined direct-sun ultraviolet and infrared spectroscopies at Popocatépetl volcano (Mexico). Front. Earth Sci. 11:1062699. doi: 10.3389/feart.2023.1062699
Received: 06 October 2022; Accepted: 09 March 2023;
Published: 06 April 2023.
Edited by:
Ryunosuke Kazahaya, National Institute of Advanced Industrial Science and Technology (AIST), JapanReviewed by:
Ben Esse, The University of Manchester, United KingdomJean-François Smekens, University of Oxford, United Kingdom
Copyright © 2023 Taquet, Rivera Cárdenas, Stremme, Boulesteix, Bezanilla, Grutter, García, Hase and Blumenstock. This is an open-access article distributed under the terms of the Creative Commons Attribution License (CC BY). The use, distribution or reproduction in other forums is permitted, provided the original author(s) and the copyright owner(s) are credited and that the original publication in this journal is cited, in accordance with accepted academic practice. No use, distribution or reproduction is permitted which does not comply with these terms.
*Correspondence: N. Taquet, bm9lbWkudGFxdWV0QGdtYWlsLmNvbQ==