 Arina N. Veres1*†
 Alexey A. Ekaykin1,2*†
 Liudmila P. Golobokova3Tamara V. Khodzher3Olga I. Khuriganowa3Alexey V. Turkeev1
- 1Climate and Environmental Research Laboratory, Arctic and Antarctic Research Institute, St. Petersburg, Russia
- 2Institute of Earth Sciences, Saint Petersburg State University, St. Petersburg, Russia
- 3Laboratory of Hydrochemistry and Chemistry of Atmosphere, Limnological Institute, Siberian Branch of Russian Academy of Sciences, Irkutsk, Russia
Introduction: The products of volcanic eruptions found in the snow, firn and ice deposits of the polar ice sheets are precious sources of information on the volcanic forcing of the climate system in the recent or remote past. On the other hand, the layers containing the traces of well-known eruptions serve as absolute age markers that help to construct the depth-age scale for the snow-firn thickness.
Methods: In this study we present new records of the sulfate concentrations and electrical conductivity (ECM) from three shallow (up to 70 m depth) firn cores drilled in the vicinity of Vostok station (central East Antarctica).
Results: In the non-sea-salt sulfate and ECM profiles we were able to identify 68 peaks that can be interpreted as traces of volcanic events.
Discussion: 22 of these peaks can be unambiguously attributed to well-known volcanic eruptions (including Tambora 1816 CE, Huaynaputina 1601 CE, Samalas 1258 CE, Ilopango 541 CE and others), which allowed to construct a robust depth-age scale for the cores. 37 events have their counterparts in other Antarctic cores, but cannot be associated with welldated eruptions. Finally, 9 peaks do not have analogues in the other cores, i.e., they may be traces of so far unknown volcanic events. According to the newly constructed depth-age function, the deepest studied firn layers (70.20 m) are dated by 192 BCE.
1 Introduction
Volcanic activity was one of the major climatic drivers in Late Holocene until the mid-XIX century when the anthropogenic activity came in force (Büntgen et al., 2020). The increased frequency of large volcanic eruptions could cause periods of prolonged cooling which, in turn, strongly affected the development of human societies (Sigl et al., 2015; Büntgen et al., 2020; van Dijk et al., 2022).
In case if an eruption is sufficiently powerful, its products are injected into the stratosphere and can reach high latitudes where they are deposited onto the surface of the polar ice sheets. These snow layers are characterized by an increased concentration of non-sea-salt sulfate ions and by higher electrical conductivity (Hammer, 1980). The firn and ice cores recovered as a result of drilling through the Antarctic and Greenland ice sheets are thus valuable sources of information on the Earth’s volcanism over the past millennia (Sigl et al., 2015).
The volcanic peaks discovered in the cores are also used as absolute age markers that help to improve the dating of the cores in case if a volcanic event can be robustly identified (Sinnl et al., 2022). Even if a peak cannot be attributed to the specific eruption, identical peaks can be used to transfer the depth-age function from a better-dated core to a poorer-dated core (Veres et al., 2013).
In this paper we present a new inventory of the volcanic events covering the past 2,200 years and recorded in the ECM (electrical conductivity measurements) and chemical data from 3 shallow firn cores drilled in the vicinity of Vostok Station (central East Antarctica, Figure 1). In total we discovered about 70 volcanic peaks, most of which have counterparts in the previously published core-based archives of the volcanic events. About one-third of the peaks can be unambiguously attributed to the known and well-dated eruptions which allowed us to construct an improved robust depth-age scale for the upper part of the firn thickness that covers the last 2,200 years.
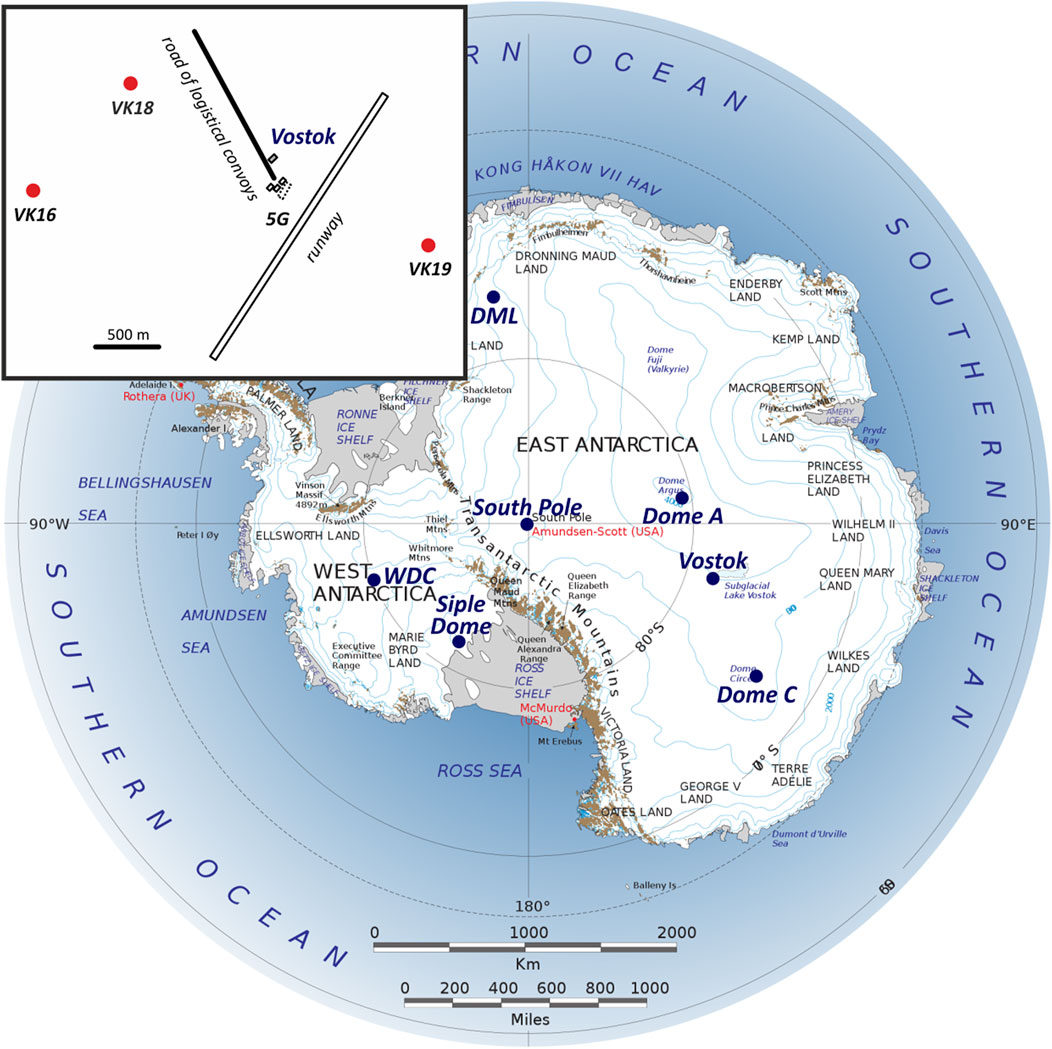
FIGURE 1. Locations of the Antarctic core sites mentioned in the paper. In the insert a scheme of the Vostok station vicinity is shown with the location of VK16, VK18, and VK19 drilling sites. The source for the map of Antarctica: https://gisgeography.com/antarctica-map-satellite-image/.
2 Materials and methods
2.1 Drilling of the cores and ECM measurements
In this study we use the data obtained from three shallow (down to 70 m) firn cores recovered in the vicinity of Vostok (78.465°S and 106.835°E, 3,490 m a.s.l.; Figure 1) in 2016–2019. The need to study multiple cores is related to a very small signal-to-noise ratio typical for a time-series of any climatic parameters as obtained from a single record (Ekaykin et al., in review). In order to reduce the amount of noise and increase the robustness of the results, a stacked record must be constructed based on data from several individual records.
The lengths of the cores are 70.20 m for core VK16 (drilling finished in January 2018), 55.14 m for VK18 and 65.37 m for VK19 (both finished in January 2019). The core recovery was close to 100% which provided an uninterrupted core sequence. The technology of drilling with the use of a light mechanical auger is described in (Veres et al., 2020).
After recovery the cores were transported to the glaciological laboratory of the Vostok station where the ECM and density measurements were performed. Then the samples for stable water isotope measurements were cut alongside the cores with the resolution of 10 cm (the data will be presented elsewhere). Finally, the remaining part of core VK16 in the depth interval 9.90–70.20 m was transported to Limnological Institute, Siberian Branch of Russian Academy of Sciences (LI SB RAS, Irkutsk, Russia) for chemical analyses.
The ECM record is a proxy of the total ion content of ice (Hammer, 1980). In Vostok firn cores the most abundant ion is SO42- (see the next section), and the correlation of the ECM profile with the SO42- data is 0.4 (significant with p < 0.01), with no significant relationship between electrical conductivity and the other ions. Thus, for Vostok the ECM record can be used as a substitute of the sulfate concentration record.
The ECM measurements were performed under temperature of about −15°C ± 4°C with the use of a 1,000 V DC as an input signal. The output signal was recorded digitally every 1 s which corresponds to about 1.4 cm of the core length resolution (or roughly 2-5 datapoints per year on average depending on the core density). The ECM profiles for all the 3 cores are presented in Figures 2A–C. One can see that the level of the ECM signal varies between the cores and between different intervals of individual cores. The electrical conductivity of firn depends on several factors (Hammer, 1980): 1) temperature of the core. We tried to maintain the constant temperature in the laboratory (−15°С), but it may vary by about ±4°С; 2) quality of the firn core surface (e.g., roughness); 3) density of core (usually ECM signal increases with increasing density); 4) the strength of the contact between firn and the electrodes, the area of the contact and the distance between the electrodes. We tried to keep these parameters constant, but it is not always possible. Thus, the ECM signal is not supposed to be the same in different cores, but this does not affect the interpretation of the ECM data since we remove the background and only study the peaks of the electrical conductivity (see Section 2.3).
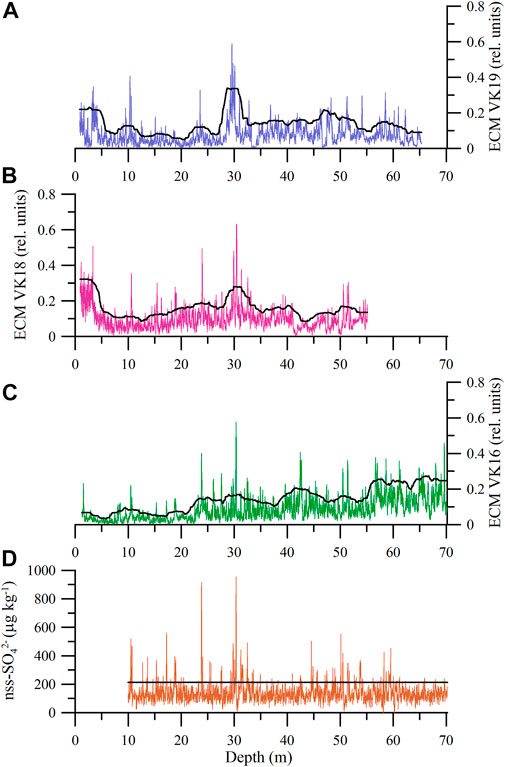
FIGURE 2. The electrical conductivity (ECM) profiles from cores (A) VK19, (B) VK18 and (C) VK16, and (D) the non-sea-salt SO42- concentration in 9.90–70.20 m interval of VK16 core. The black lines are the cut-off values to separate the volcanic peaks from the background (see the text for details).
2.2 Chemical analysis of VK16 core
The chemical analyses were performed in Laboratory of Hydrochemistry and Chemistry of Atmosphere of LIN SB RAS. Before measurements the VK16 core was kept in a frozen state (−20°C). In order to prevent a contamination, we cut the thin slabs (1.5–2 cm) of the outer part of the core and used only the inner part for the analysis. The central part of each core segment was cut with 2 cm resolution in a clean room. Then each sample was put in a 100 ml Pyrex glass bottle with the polypropylene caps. The 2-cm firn samples were melted at room temperature followed by filtration through the 0.2 μm cell-size filters. Further lab works consisted of measurements of acidity and the main ions concentration. We analyzed chemical composition using the ICS-3000 Dionex reagent-free ion chromatography system (Sunnyvale, California, the United States). The determination of the level of fluctuation noises, the zero signal drift and the deviation of the output signal of the device were controlled using the IC-SCS1 and IC-FAS-1A reference samples (Inorganic Ventures, Christiansburg, VA, United States) (Golobokova et al., 2022). Relative error of the concentration values is estimated to be within 5%–8%. In total, 2,947 samples were analyzed in a depth interval of 9.90–70.20 m.
The total mineralization of the firn in the studied cores is about 300 ppb (μg kg−1). Of this value about one-half (150 ppb) is the concentration of the SO42- ion. In molar concentration units (to which electrical conductivity of firn is physically related) the share of the sulfate ions is about 22%, but still it is the most abundant ion except for H+. It explains why ECM demonstrates the strongest correlation with SO42- (r = 0.4, as mentioned earlier), while the correlation coefficient with the other ions does not exceed 0.05.
We analyze non-marine sulphate data from the VK16 firn core considering that sulphates do not undergo post-depositional modification (Osipov et al., 2014). To determine the sea and non-marine sources of ions, ratios of ion concentrations in the firn to its concentrations in sea water and continental crust are used (Aristarain and Delmas, 2002). The non-sea-salt sulphate concentrations were calculated as:
where
The difference between the non-sea-salt and the total sulfate-ion concentration is actually small, since the ratio of sea-salt to non-sea-salt SO42− is less than 10%. The nss-SO42- profile for VK16 core is presented in Figure 2D.
2.3 Detection of volcanic peaks in the nss-sulfate record
At the next stage we separated the nss-sulfate concentration peaks, likely caused by the presence of the products of volcanic eruptions, from the biogenic background. For this we adopted the approach widely used in the previous studies (e.g., Osipov et al., 2014).
First of all, we calculated the average and standard deviation (STD) of the nss-sulfate values in VK16, and defined the primary cut-off value equal to the average plus 2 STD. The segments of the nss-sulfate record above this cut-off value can be very likely interpreted as volcanic peaks. However, this initial cut-off value is overestimated, since it was calculated using all the nss-sulfate datapoints including the peaks themselves. Thus, we defined the secondary cut-off value excluding from the calculation of the average and STD the datapoints which exceeded the primary cut-off value. The secondary cut-off value is about 22% lower than the primary one (214 against 275 μg·kg−1) and more correctly separates the volcanic peaks from the background (Figure 2D).
Then we used a similar procedure to define the cut-off values for the ECM records. The difference is that for the ECM profiles we calculated running cut-off values (with the width of window equal to 300 cm), taking into account that the background level of electrical conductivity strongly varies with depth (Figures 2A–C).
In Figure 3D we show the excess nss-sulfate concentrations for the VK16 core, i.e., the difference between the total concentration and the cut-off value. We suggest that these excess nss-sulfate corresponds to the SO42- ion fallout due to volcanic eruptions. We also calculated the excess (above the cut-off) values of ECM for all the three cores (Figures 3A–C). Note that the magnitude of the same ECM peaks can be different in different cores. This is because of extremely low signal-to-noise ratio typical for the climatic time-series studied on the firn and ice cores drilled in low-accumulation area of central Antarctica (Ekaykin et al., in review). About 20% of annual snow layers at Vostok are missed due to the wind erosion, thus it is possible that a volcanic peak is present in one core and is absent in another. In this study we use only those peaks that are present in all the four records (the sulfate record from VK16, and the ECM records from cores VK16, VK18, and VK19).
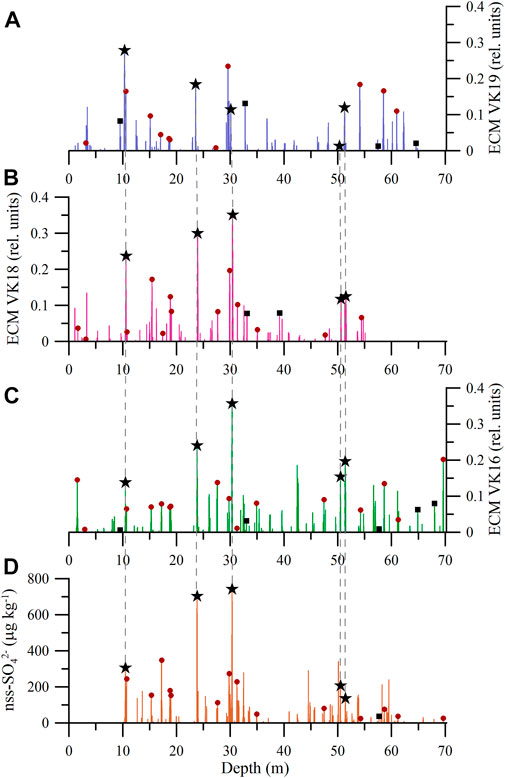
FIGURE 3. Volcanic peaks discovered in 9.90–70.20 m of (D) the nss-sulfate record of the VK16 core and in the ECM records of cores (A) VK19, (B) VK18 and (C) VK16. The stars denote the position of 5 peaks that can be unambiguously attributed to the well-dated volcanic events and thus served as a foundation of the core dating (see Discussion). The red circles are other peaks used in the dating, while the black squares are additional peaks used for the cross-dating of the three cores.
2.4 Calculation of volcanic sulfate flux
Since the sulfate deposition in central Antarctica is dominated by dry deposition (Legrand and Delmas, 1987), the sulfate concentration depends on the snow accumulation rate. Thus, for correct comparison of the volcanic signatures in different cores (and of different peaks within a single core) it is better to operate not with concentrations, but with sulfate fluxes expressed in kg·km−2.
The flux F can be calculated as
where
The data on the firn density in the upper 70 m of Vostok snow-firn thickness was taken from (Ekaykin et al., 2022).
The flux values were calculated for every 2-cm interval of the core within a volcanic peak and then the total sulfate flux for every volcanic peak was defined by integrating the values of the individual 2-cm increments.
3 Results
In Figure 3D all the volcanic peaks discovered in the nss-sulfate record from the VK16 core are shown. Most of them have their counterparts in the ECM records in cores VK16, VK18, and VK19 (shown in Figures 3A–C).
In total, the sulfate data from VK16 allowed to detect 62 volcanic peaks in the depth interval from 9.90 to 70.20 m (Table 1).
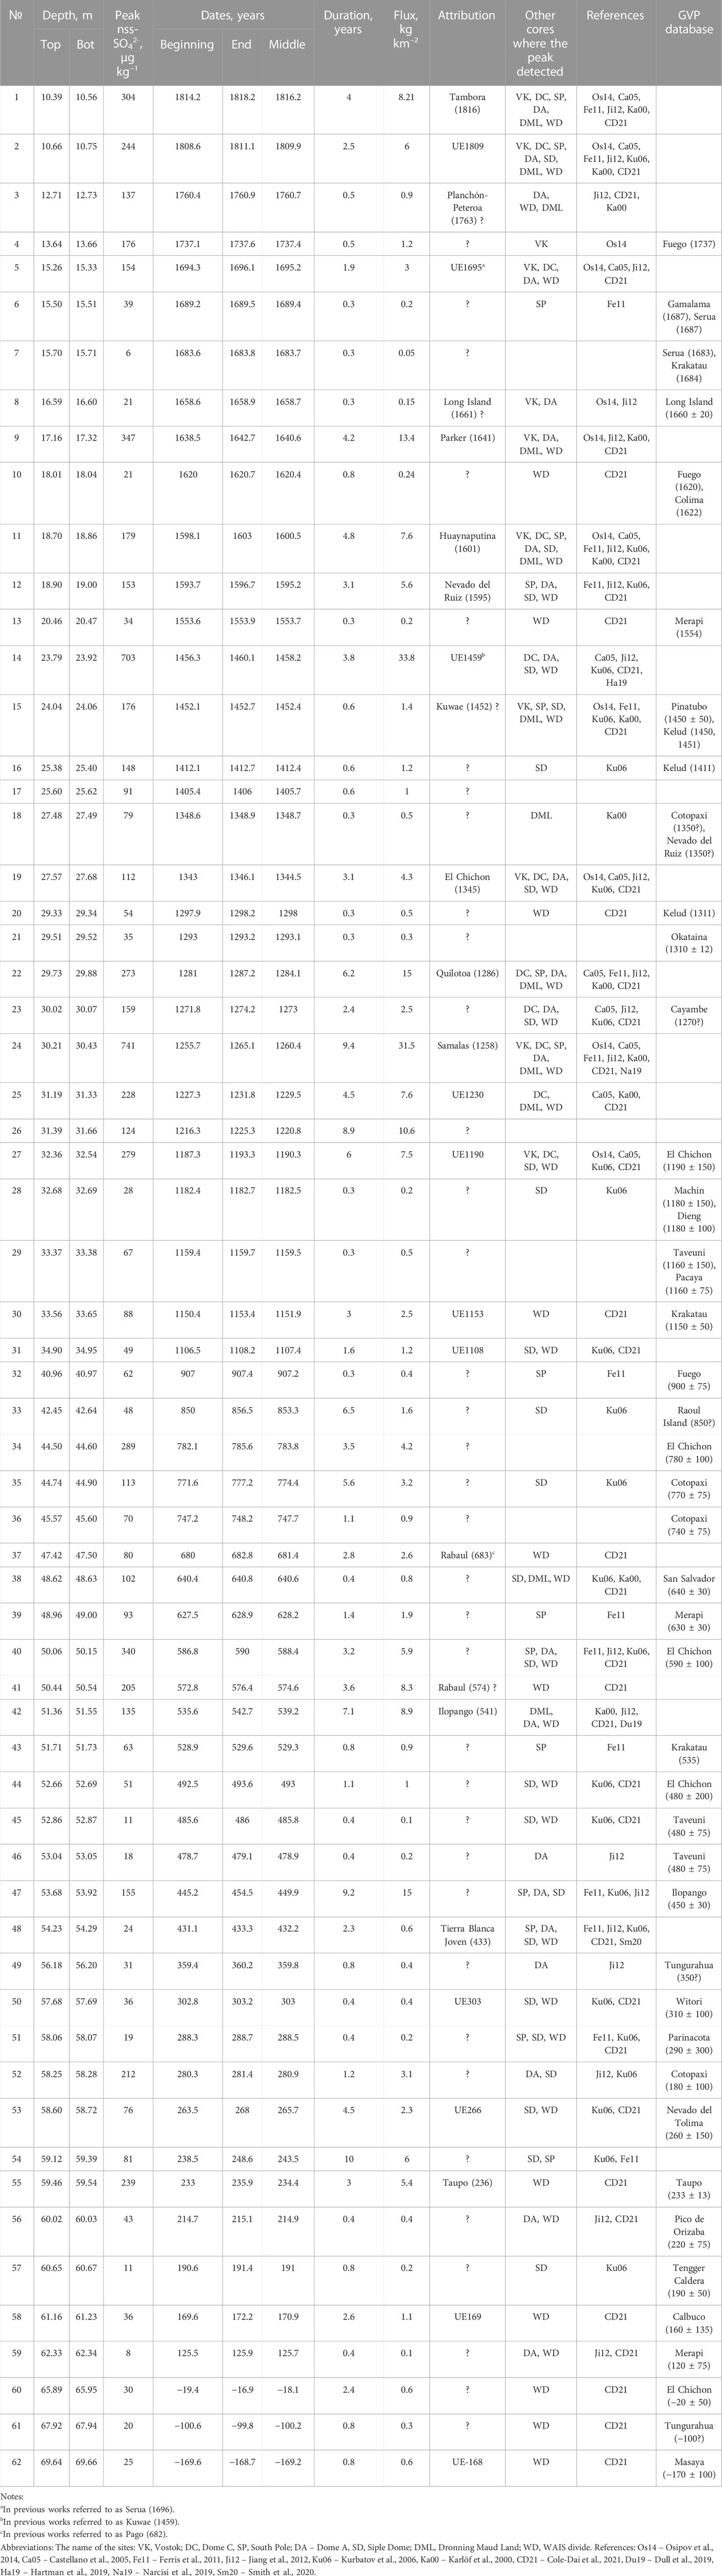
TABLE 1. Inventory of the volcanic peaks found in the sulfate record of VK16 core.
The values of the sulfate concentration vary between 6 μg·kg−1 (peak 7 in Table 1 at 15.71 m) and 741 μg·kg−1 (peak 24, 30.21–30.43 m). As noted before (Castellano et al., 2005), the distribution of the sulfate concentration and fluxes are much closer to a lognormal than to Gaussian one. For instance, the median value of the concentration (80 μg·kg−1) is substantially lower than the mean (129 μg·kg−1).
The minimum value of the flux (0.05 kg·km−2) is characteristic for the same peak where the lowest concentration is observed (peak 7), while the maximum flux (33.8 kg·km−2) is observed for the peak 14 at 23.79–23.92 m which is the second largest in terms of concentration.
The frequency of the peaks and the distribution of the concentrations and fluxes are not homogeneous along the core (Figure 3D): the highest peaks are observed in the upper half of the core, and there are intervals (35–45 m and below 60 m) where very few peaks were found. This picture reflects substantial variability of volcanic activity in the late Holocene, as will be discussed in the next section.
4 Discussion
4.1 Attribution of the peaks to the known volcanic events
As the basis for the procedure of the attribution of the peaks found in the VK16 core to the known volcanic events we used the previously published Vostok volcanic records (e.g., Osipov et al., 2014) as well as the inventories of the largest volcanic events previously found in Antarctic firn and ice deposits (e.g., Sigl et al., 2015). The procedure of the peaks’ identification is three-stage:
At the first stage we determine the position of Tambora volcanic peak (eruption in 1815 and the deposition of the eruption products in central Antarctica in 1816; note that the volcanic sulfates usually reach central Antarctica 1–3 years after the eruption, and in this paper we refer to the dates of the sulfate deposition rather than to the dates of the eruptions themselves). The identification of Tambora peak is absolutely unambiguous because of its specific double summit shape (Tambora itself and an unknown volcanic event dated by 1809 CE) and due to the fact that Tambora have been previously found in all the deep pits and firn cores studied in the vicinity of Vostok (Legrand, 1987; Ekaykin et al., 2004; Ekaykin et al., 2014; Osipov et al., 2014; Veres et al., 2020), so the expected depth of the peak is well known. In the VK16 sulfate record it is situated at the depths 10.39–10.56 m and 10.66–10.75 m (peaks 1 and 2 in Table 1).
As soon as the depth of Tambora is determined, we are able to calculate the mean snow accumulation rate between 1816 and the present day (2.08 g·cm−2 year−1) using the available density-depth profile (Ekaykin et al., 2022) and to extrapolate the depth-age function to the whole core length.
At the second step we find the volcanic peaks of unknown event 1459 CE (UE1459 CE) and Samalas 1258 CE. These peaks are found in all the Antarctic firn cores (Karlöf et al., 2000; Castellano et al., 2005; Kurbatov et al., 2006; Ferris et al., 2011; Jiang et al., 2012; Narcisi et al., 2019; Cole-Dai et al., 2021), and they are the largest peaks in the volcanic record of the last two millennia. Indeed, in our cores we find two largest peaks dated (according to the preliminary age scale) by 1504 CE and 1329 CE (peak 14 at 23.79–23.92 m and peak 24 at 30.21–30.43 m, Table 1). The ages of the peaks are 45 and 72 years too young, which is due to the fact that before 1800 CE the snow accumulation rate in central Antarctica was significantly lower than during the last 200 years (Thomas et al., 2017). Thus, we reduce the accumulation rate before Tambora by 12.5% so that the ages of these two peaks correspond to the ages of UE1459 and Samalas. Interestingly, if we adjust the age of any of these two peaks, we automatically obtain the correct age for the other peak, which gives additional confidence to the interpretation of them.
The same large peaks were described in the previous Vostok cores, as well (Osipov et al., 2014), but they were misinterpreted as Kuwae 1452 CE and El-Chichon 1259 CE. Note that the 1459 peak was initially attributed to Kuwae eruption (Castellano et al., 2005; Sigl et al., 2015, etc.) but later it was re-interpreted as an unknown event dated by 1458 or 1459 (Toohey and Sigl, 2017; Hartman et al., 2019).
Before 1000 CE the volcanic activity on Earth was much reduced compared to the last millennium, so we do not have large prominent peaks in the Antarctic cores (see review in Sigl et al., 2015). However, according to our preliminary depth-age scale (after it is corrected for the reduced accumulation rate before 1816 CE), we have two large peaks dated by 568 CE and 535 CE (peaks 41 and 42, 50.44–50.54 m and 51.36–51.55 m, Table 1). In other volcanic archives (see Sigl and others, 2015 and other papers) one can find peaks of Rabaul 574 CE and Ilopango 541 CE. Note that these two peaks are separated by the time interval of 33 years – the same as in our cores, and that our preliminary dating differs from the true dating by only 6 years. Thus, with very high confidence we may attribute these peaks to Rabaul and Ilopango, and to correct the accumulation rate before Samalas accordingly (by about 1%).
At the next step we scanned the sulfate record in order to identify other peaks that can be attributed to the well-dated volcanic events. In Figures 4A, B we presented the time-series of the volcanic peaks found in the VK16 core and compared it with the largest volcanic events of the past two millennia according to Sigl et al., 2015.
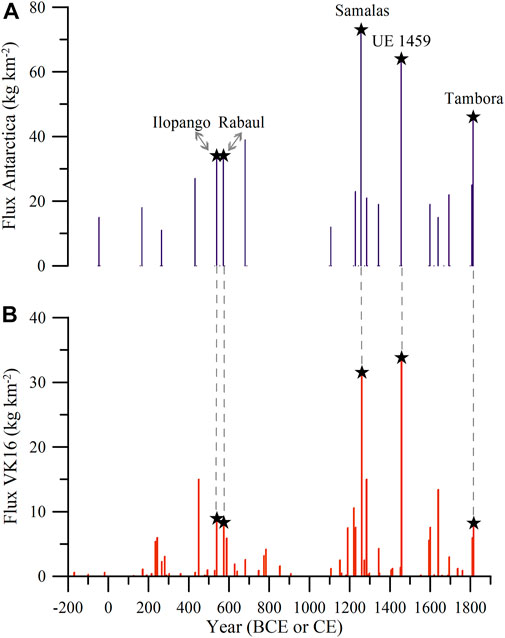
FIGURE 4. Time-series of the volcanic peaks found in (B) the VK16 core versus (A) the time-series of the largest volcanic events found in the Antarctic snow and firn deposits according to (Sigl et al., 2015). By the stars the peaks used to tune the VK16 depth-age function are shown.
First, a group of 3 peaks between UE1809 and UE1459 can be very likely attributed to UE1695 (peak 5, 15.26–15.33 m), Parker 1641 (peak 9, 17.16–17.32 m) and Huaynaputina 1601 (peak 11, 18.70–18.86 m, Table 1). Note that the dates of these peaks according to the preliminary age scale (1697 CE, 1646 CE and 1604 CE) differ only by 2–5 years from their true ages.
Then, two peaks between UE1459 and Samalas 1258 at the depths 27.57–27.68 m (peak 19) and 29.73–29.88 m (peak 22, Table 1) closely resemble El Chichon 1345 and Quilotoa 1286. The preliminary ages of the peaks (1345 CE and 1278 CE) differ from the true ages by, correspondingly, 0 and 8 years.
Between Samalas 1258 and Rabaul 574 we could identify 3 peaks: UE1230 (peak 25 at 31.19–31.33 m), UE1108 (peak 31, 34.90–34.95 m) and Pago 682 (peak 37, 47.42–47.50 m, Table 1). Note that we re-interpret the Pago 682 peak as Rabaul 683 peak (see below). The dates of these peaks according to the preliminary age scale were 1231 CE, 1114 CE and 685 CE, i.e. they differed from the true dates by 1–6 years.
Below Ilopango 541 the identification of the peaks is less confident but it is very likely that peaks 48 (54.23–54.29 m), 53 (58.60–58.72 m) and 58 (61.16–61.23 m, Table 1) correspond to Tierra Blanca Joven 433 (labeled in (Sigl et al., 2015) as UE433), UE266 and UE169. The preliminary ages of them were 436 CE, 267 CE and 167 CE, i.e. they differed from the true ages by 1–3 years.
We compared the values of the sulfate fluxes for the 17 peaks mentioned earlier in this section according to the data reported in (Sigl et al., 2015) and to the results of our study. The correlation coefficient is equal to 0.78 ± 0.16 and is statistically significant with the high level of confidence. On average the sulfate fluxes at Vostok are roughly 2 times lower than over the whole Antarctica probably due to the remoteness of the Vostok region from the sulfate sources.
In total, Sigl et al. (2015) reports 19 largest volcanic events recorded in Antarctic snow, firn and ice over the last 2,200 years. 17 of these 19 peaks were discovered and robustly attributed in the Vostok core. Only two events are missed: Chiltepe (dated by 44 BCE) and UE1171. The first eruption was one of the most powerful over the past 2.5 millennia, but it caused rather small sulfate flux in Antarctica (15.4 kg·km−2, i.e., 3 times smaller than after Tambora). Note that in later works this event was re-interpreted as the signature of the Northern Hemisphere’s Okmok eruption 43 BCE (McConnell et al., 2020), which explains why it resulted in very small sulfate flux in Antarctica. The flux after UE1171 event was 19.5 kg·km−2. The Okmok peak has not been found so far in East Antarctic cores, but only in West Antarctica (Cole-Dai et al., 2021). The UE1171 peak was found in the Dome C ice core (Castellano et al., 2005), but was not reported in the previous Vostok volcanic inventory (Osipov et al., 2014). Interestingly, this peak is found in the ECM records in all the three cores (see below), but not in the sulfate record of VK16 core. We should note that, due to a very small annual snow build-up at Vostok the probability of annual layer hiatus is about 20% (Ekaykin et al., in review), so a layer containing volcanic deposits can be easily missed in the snow-firn thickness.
We compared our inventory of volcanic peaks presented in Table 1 with the published inventories based on the investigation of the cores drilled at Dome C (Castellano et al., 2005), South Pole (Ferris et al., 2011), Dome A (Jiang et al., 2012), Siple Dome (Kurbatov et al., 2006), Dronning Maud Land (Karlöf et al., 2000) and WAIS Divide (Cole-Dai et al., 2021) (see the location of the sites in Figure 1).
All the 62 peaks can be divided into three groups:
The first group consists of 20 peaks that can be robustly associated with well-dated peaks in other cores, and includes 17 peaks mentioned earlier in this section. For some of the peaks we suggest a new attribution compared to what can be found in the previous works. In particular, the strong peak dated by 1459 CE that was repeatedly interpreted as a Kuwae eruption (Castellano et al., 2005; Sigl et al., 2015) is re-interpreted as Unknown Event 1459 CE (UE1459), see (Toohey and Sigl, 2017; Hartman et al., 2019). For the peak dated by 682 CE that is referred to as Pago eruption (Sigl et al., 2015), we suggest a new interpretation: Rabaul (683 CE), according to the (Global Volcanism, 2022) Program database (https://volcano.si.edu/). Finally, we suggest to interpret the UE433 peak (Sigl et al., 2015) as Tierra Blance Joven eruption dated by 433 CE (Smith et al., 2020).
The second group consists of 35 peaks for which we could find a close (±5 years) counterpart in at least 1 other core.
Finally, there are 7 peaks that do not have a close analogue in the other cores.
In most cases the magnitude (sulfate flux) for the first group is larger than for the second and the third. However, there are few exceptions of this rule. For example, peaks 26 (dated by 1223 CE) and 34 (784 CE) have values of the sulfate flux equal to, correspondingly, 10.6 and 4.2 kg·km−2, but no similarly dated peaks were found in the other cores. Moreover, there is no ECM peaks in our cores that correspond to these sulfate peaks (Figures 3A–C). On the other hand, it is difficult to interpret these peaks as a contamination of the samples because of their substantial widths: 26 cm = 13 samples for peak 26 and 10 cm = 5 samples for peak 34. The mystery of these peaks can be solved when they are found in other Antarctic cores.
For the peaks that do not have an attribution in the available literature we suggested a tentative interpretation using the Global Volcanism Program database (the last column of Table 1). One should note that this interpretation is entirely speculative and cannot be confirmed unless geochemical analyses of the volcanic deposits (tephra) in the corresponding layers are made. We argue that it is unlikely that these peaks have not a volcanic origin. Indeed, the largest non-marine sources of the sulfur are anthropogenic activity and volcanism (Legrand and Mayewski, 1997). But the anthropogenic activity mainly injects sulfur to the troposphere, from where it is washed out rather quickly. Also, the main industrial centers are situated in the Northern Hemisphere, so the anthropogenic source may be important for Greenland, but not for central Antarctica. Finally, the anthropogenic production of sulfur is rather constant, without significant interannual variability. The other continental sources of sulfur—soils, vegetation and biomass burning – are too small to produce the observed sulfate fluxes over central Antarctica.
4.2 Dating of the cores
The identification of a number of well-dated volcanic peaks in our cores has allowed us to construct a reliable depth-age function that will be used in further studies.
For constructing the chrono-stratigraphic scale we used a selection of volcanic peaks from our inventory following two rules as described below:
1) Only unambiguously attributed well-dated volcanic peaks were used;
2) Only those sulfate peaks from VK16 core were used that have clearly identifiable counterparts in the ECM record in all three cores (VK16, VK18 and VK19).
In total 20 sulfate volcanic peaks were chosen for the core dating (Table 2).
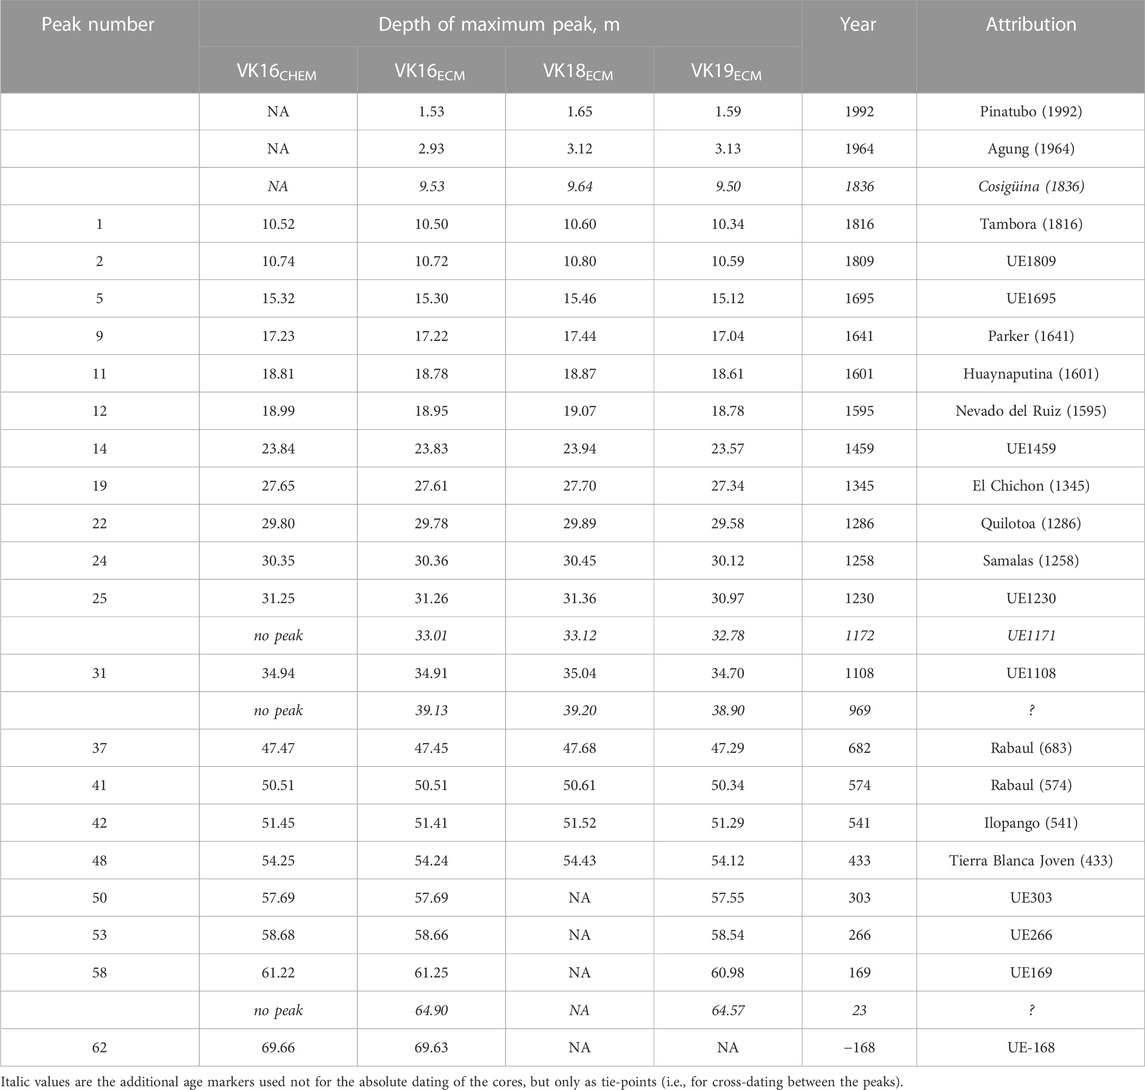
TABLE 2. Volcanic events recorded in the sulfate and ECM record used as age markers for the dating of VK16, VK18 and VK19 cores. The peaks numbers (column 1) refer to Table 1. By italic the additional age markers are shown which are only used as tie-points (i.e., for cross-dating between the three cores).
Then we inspected the ECM records in the interval 0–9.90 m (for which the chemical data is not available) and found two peaks at depths 1.53–1.65 m and 2.93–3.13 m that very likely mark the layers with the products of Pinatubo (1992 CE) and Agung (1964 CE) volcanoes.
The depth-age scale was then interpolated between these 22 age markers along the core VK16 with the use of the density-depth profile (Ekaykin et al., 2022) and assuming a constant accumulation rate between the adjacent age markers.
A thorough scrutiny of the ECM profiles allowed to discover four peaks that are present in all three cores but for some reasons are missed in the sulfate record. Thus, these peaks are used as a tie-points to cross-date the three cores one to another, but was not used as absolute age markers (highlighted in Italic in Table 2). The dates of these peaks were defined for core VK16, and the depth-age scales of cores VK18 and VK19 were adjusted in such a way that the dates of these peaks in their ECM profiles would correspond to the dates of these peaks in VK16. Interestingly, for two of these additional peaks we obtained the ages that allow to associate them with known volcanic events. In particular, the peak at the depths 9.50–9.64 m dates by 1836 CE, which allows to interpret it as Cosigüina (1836 CE) volcano (Toohey and Sigl, 2017; Baroni et al., 2019). The peak at 32.78–33.12 m dates by 1172 CE which corresponds well to UE1171 eruption (Sigl et al., 2015; Baroni et al., 2019). These findings increase confidence in our depth-age scale.
Note that the depths of the peaks differ in different cores (Table 2), which is simply explained, first, by different timing of the cores drilling and, second, by the spatial variability of the snow accumulation rate (Ekaykin et al., in review).
The final depth-age scale for the Vostok snow-firn thickness in the depth interval from 0 to 70 m is shown in Figure 5. Our new age scale (Vos2kdat) corresponds to the one previously published in (Osipov et al., 2014), but is more detailed. We also compared the new depth-age function with the AICC2012 age scale (Veres et al., 2013). In the first 200 years the two curves are identical, but before Tambora the AICC2012 scale is slightly younger. The difference between AICC2012 and Vos2kdat reaches 40 years at the depth of 70 m. The reason for this discrepancy is that the AICC2012 scale underestimate the decrease in snow accumulation rate before 1800 CE.
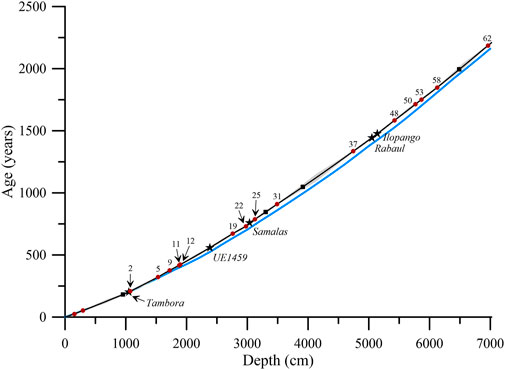
FIGURE 5. The depth-age function for the 0–70 m interval of the Vostok snow-firn thickness. The different symbols show the absolute age markers, as well as the tie-points used for the cross-dating of the three cores (VK16, VK18, and VK19) – the same as in Figure 3. By the blue line the depth-age scale AICC 2012 (Veres et al., 2013) is shown.
The construction of the depth-age scale allowed us to calculate the dates of the beginning and the end of each volcanic peak in the sulfate record of VK16, as well as the duration of the peaks (Table 1). The average duration of peaks is 2.5 years, while the maximum one (10 years) is observed for an unidentified peak 54 situated at the depth 59.12–59.39 m and dated by 239–249 CE.
We also defined the dating error by successively “switching off” one age marker by another and comparing the dates of snow layers with and without these markers [see details in (Veres et al., 2020)]. This approach allowed to establish a simple linear relationship between a maximum dating error, on one hand, and the distance to the nearest age marker, on the other hand:
Both the error and the distance are in years.
The free member in this equation equal to 3 means that even for an age marker itself we assume a possibility of a dating error because, as mentioned earlier, an average peak is spread over 2-3 annual snow layers, and we do not know when exactly the volcanic products were deposited on the snow surface.
The dating error is shown in Figure 5 by the grey shading. For the most of the core the error does not exceed 10 years. The maximum dating error (26.4 years) is observed at the depth of 41.30 m where the firn age is 1,120 years. This snow layer is situated between two age markers dated by 682 CE and 1108 CE (Table 2).
From the dating procedure we automatically obtain the average snow accumulation rate between the adjacent age markers, and the temporal variability of this parameter will be discussed somewhere else.
5 Conclusion
In this work we used data on sulfate concentration and electrical conductivity in three shallow firn cores recovered in the vicinity of Vostok station (central East Antarctica) in order to construct a new detailed robust inventory of the volcanic events over the past 2,200 years.
In total, 68 peaks were found that, with more or less confidence, can be interpreted as those of volcanic origin. Of this number, 22 can be robustly attributed to known and well-dated volcanic events, and this dataset was used as a basis to construct the depth-age function for the studied cores. 37 peaks have counterparts in other published records of volcanic events from the cores drilled in West Antarctica, Dronning Maud Land, Dome A, Dome C, Siple Dome and South Pole. Finally, 9 peaks do not have analogues in the other cores, so they may bear information about not known volcanic events.
The identification of the volcanic peaks in the studied cores allowed us to construct the new detailed depth-age function (Vos2kdat). The comparison of it with the previous age scale AICC 2012 (Veres et al., 2013) demonstrated that the latter is slightly younger than Vos2kdat before 19 century, which is explained by underestimation of the snow accumulation rate decrease before 1800 CE.
Data availability statement
The data used in this study is available at the web-page of CERL: http://cerl-aari.ru/index.php/vos2k-volcanic-inventory/.
Author contributions
AV and AE wrote the manuscript, designed the study and carried out the field works (core drilling, ECM and density measurements, sampling). LG, TK, and OK were responsible for chemical analyses. AT took part in the drilling of the cores.
Funding
The Funding for this research was provided by Russian Science Foundation grant 21-17-00246.
Acknowledgments
We are grateful to all participants of Russian Antarctic Expedition who help us in the fieldworks. We also thank two reviewers whose critical comments helped to greatly improve the manuscript.
Conflict of interest
The authors declare that the research was conducted in the absence of any commercial or financial relationships that could be construed as a potential conflict of interest.
Publisher’s note
All claims expressed in this article are solely those of the authors and do not necessarily represent those of their affiliated organizations, or those of the publisher, the editors and the reviewers. Any product that may be evaluated in this article, or claim that may be made by its manufacturer, is not guaranteed or endorsed by the publisher.
References
Aristarain, A. J., and Delmas, R. J. (2002). Snow chemistry measurements on James Ross Island (Antarctic Peninsula) showing sea-salt aerosol modifications. Atmos. Environ. 36 (4), 765–772. doi:10.1016/S1352-2310(01)00362-4
Baroni, M., Bard, E., Petit, J. R., Viseur, S., and Team, A. (2019). Persistent draining of the stratospheric 10Be reservoir after the Samalas volcanic eruption (1257 CE). J. Geophys. Res. Atmos. 124 (13), 2018JD029823–7097. doi:10.1029/2018JD029823
Büntgen, U., Arseneault, D., Boucher, E., Churakova (Sidorova), O. V., Gennaretti, F., Crivellaro, A., et al. (2020). Prominent role of volcanism in Common Era climate variability and human history. Dendrochronologia 64 (125757), 1–11. doi:10.1016/j.dendro.2020.125757
Castellano, E., Becagli, S., Hansson, M., Hutterli, M., Petit, J. R., Rampino, M. R., et al. (2005). Holocene volcanic history as recorded in the sulfate stratigraphy of the European Project for Ice Coring in Antarctica Dome C (EDC96) ice core. J. Geophys. Res. 110 (D06114), 1–12. doi:10.1029/2004JD005259
Cole-Dai, J., Ferris, D. G., Kennedy, J. A., Sigl, M., McConnell, J. R., Fudge, T. J., et al. (2021). Comprehensive record of volcanic eruptions in the Holocene (11,000 years) from the WAIS Divide, Antarctica ice core. J. Geophys. Res. Atmos. 126 (7), 1–15. doi:10.1029/2020JD032855
Dull, R. A., Southon, J. R., Kutterolf, S., Anchukaitis, K. J., Freundt, A., Wahl, D. B., et al. (2019). Radiocarbon and geologic evidence reveal Ilopango volcano as source of the colossal ‘mystery’ eruption of 539/40 CE. Quat. Sci. Rev. 222 (105855), 105855–105917. doi:10.1016/j.quascirev.2019.07.037
Ekaykin, A. A., Kozachek, A. V., Lipenkov, V. Ya., and Shibaev, Yu.A. (2014). Multiple climate shifts in the Southern Hemisphere over the past three centuries based on central Antarctic snow pits and core studies. Ann. Glaciol. 55 (66), 259–266. doi:10.3189/2014AoG66A189
Ekaykin, A. A., Lipenkov, V. Ya., Kuzmina, I. N., Petit, J. R., Masson-Delmotte, V., and Johnsen, S. J. (2004). The changes in isotope composition and accumulation of snow at Vostok station, East Antarctica, over the past 200 years. Ann. Glaciol. 39, 569–575. doi:10.3189/172756404781814348
Ekaykin, A. A., Lipenkov, V. Ya., and Tebenkova, N. A. (xxxx). 50 years of instrumental surface mass balance observations in central Antarctica. J. Glac. in review.
Ekaykin, A. A., Tchikhatchev, K. B., Veres, A. N., Lipenkov, V. Ya., Tebenkova, N. A., and Turkeev, A. V. (2022). Vertical profile of snow-firn density in the vicinity of Vostok station, Central Antarctica. Ice and Snow 62 (4), 504–511. doi:10.31857/S2076673422040147
Ferris, D. G., Cole-Dai, J., Reyes, A. R., and Budner, D. M. (2011). South Pole ice core record of explosive volcanic eruptions in the first and second millennia A.D. and evidence of a large eruption in the tropics around 535 A.D. J. Geophys. Res. 116 (D17308), D17308–D17311. doi:10.1029/2011JD015916
Global Volcanism (2022). Global volcanism Program database. Avaialable at: https://volcano.si.edu/.
Golobokova, L. P., Khodzher, T. V., Zhamsueva, G. S., Zayakhanov, A. S., Starikov, A., and Khuriganova, O. I. (2022). Variability of the chemical composition of the atmospheric aerosol in the coastal zone of the southern basin of lake baikal (East siberia, Russia). Atmosphere 13 (7), 1090. doi:10.3390/atmos13071090
Hammer, C. U. (1980). Acidity of polar ice cores in relation to absolute dating, past volcanism, and radio-echoes. J. Glaciol. 25 (93), 359–372. doi:10.3189/S0022143000015227
Hartman, L. H., Kurbatov, A. V., Winski, D. A., Cruz-Uribe, A. M., Davies, S. M., Dunbar, N. W., et al. (2019). Volcanic glass properties from 1459 C.E. volcanic event in South Pole ice core dismiss Kuwae caldera as a potential source. Nat. Sci. Rep. 9 (14437), 14437–7. doi:10.1038/s41598-019-50939-x
Jiang, S., Cole-Dai, J., Li, Y., Ferris, D. G., Ma, H., An, C., et al. (2012). A detailed 2840 year record of explosive volcanism in a shallow ice core from Dome A, East Antarctica. J. Glaciol. 58 (207), 65–75. doi:10.3189/2012JoG11J138
Karlöf, L., Winther, J.-G., Isaksson, E., Kohler, J., Pinglot, J. F., Wilhelms, F., et al. (2000). A 1500 year record of accumulation at Amundsenisen Western Dronning Maud Land, Antarctica, derived from electrical and radioactive measurements on a 120 m ice core. J. Geophys. Res. 105 (D10), 12471–12483. doi:10.1029/1999JD901119
Kurbatov, A. V., Zielinski, G. A., Dunbar, N. W., Mayewski, P. A., Meyerson, E. A., Sneed, S. B., et al. (2006). A 12,000 year record of explosive volcanism in the Siple Dome ice core, west Antarctica. J. Geophys. Res. 111 (D12307), D12307–D12318. doi:10.1029/2005JD006072
Legrand, M. (1987). Chemistry of Antarctic snow and ice. Journ. Phys. 48, C177–C186. doi:10.1051/jphyscol:1987111
Legrand, M., and Delmas, R. J. (1987). A 220-year continuous record of volcanic H2SO4 in the Antarctic ice sheet. Nature 327 (6124), 671–676. doi:10.1038/327671a0
Legrand, M., and Mayewski, P. (1997). Glaciochemistry of polar ice cores: A review. Rev. Geophys. 35, 219–243. doi:10.1029/96rg03527
McConnell, J. R., Sigl, M., Plunkett, G., Burke, A., Kim, W. M., Raible, C. C., et al. (2020). Extreme climate after massive eruption of Alaska’s Okmok volcano in 43 BCE and effects on the late Roman Republic and Ptolemaic Kingdom. PNAS 117 (27), 15443–15449. doi:10.1073/pnas.2002722117
Narcisi, B., Petit, J. R., Delmonte, B., Batanova, V., and Savarino, J. (2019). Multiple sources for tephra from AD 1259 volcanic signal in Antarctic ice cores. Quat. Sci. Rev. 210, 164–174. doi:10.1016/j.quascirev.2019.03.005
Osipov, E. Y., Khodzher, T. V., Golobokova, L. P., Onischuk, N. A., Lipenkov, V. Y., Ekaykin, A. A., et al. (2014). High-resolution 900 year volcanic and climatic record from the Vostok area, East Antarctica. Cryosphere 8 (3), 843–851. doi:10.5194/tc-8-843-2014
Sigl, M., Winstrup, M., McConnell, J. R., Welten, K. C., Plunkett, G., Ludlow, F., et al. (2015). Timing and climate forcing of volcanic eruptions for the past 2,500 years. Nature 523 (7562), 543–549. doi:10.1038/nature14565
Sinnl, G., Winstrup, M., Erhardt, T., Cook, E., Jensen, C. M., Svensson, A., et al. (2022). A multi-ice-core, annual-layer-counted Greenland ice-core chronology for the last 3800 years: GICC21. Clim. Past. 18 (5), 1125–1150. doi:10.5194/cp-18-1125-2022
Smith, V. C., Costa, A., Aguirre-Diaz, G., Pedrazzi, D., Scifo, A., Plunkett, G., et al. (2020). The magnitude and impact of the 431 CE Tierra Blanca joven eruption of Ilopango, El Salvador. PNAS 117 (42), 26061–26068. doi:10.1073/pnas.2003008117
Thomas, E. R., van Wessem, J. M., Roberts, J., Isaksson, E., Schlosser, E., Fudge, T. F., et al. (2017). Regional Antarctic snow accumulation over the past 1000 years. Clim. Past. 13, 1491–1513. doi:10.5194/cp-13-1491-2017
Toohey, M., and Sigl, M. (2017). Volcanic stratospheric sulfur injections and aerosol optical depth from 500 BCE to 1900 CE. Earth Syst. Sci. Data 9 (2), 809–831. doi:10.5194/essd-9-809-2017
van Dijk, E., Jungclaus, J., Lorenz, S., Timmreck, C., and Krüger, K. (2022). Was there a volcanic-induced long-lasting cooling over the Northern Hemisphere in the mid-6th–7th century? Clim. Past. 18 (7), 1601–1623. doi:10.5194/cp-18-1601-2022
Veres, A. N., Ekaykin, A. A., Lipenkov, V. Y., Turkeev, A. V., and Khodzher, T. V. (2020). First data on the climate variability in the vicinity of Vostok Station (Central Antarctica) over the past 2,000 years based on the study of a snow-firn core. Arctic and Antarctic Research 66 (4), 482–500. doi:10.30758/0555-2648-2020-66-4-482-500
Keywords: volcanic inventory, Vostok station, Late Holocene, firn core, East Antarctica, non-sea-salt sulfates, electrical conductivity
Citation: Veres AN, Ekaykin AA, Golobokova LP, Khodzher TV, Khuriganowa OI and Turkeev AV (2023) A record of volcanic eruptions over the past 2,200 years from Vostok firn cores, central East Antarctica. Front. Earth Sci. 11:1075739. doi: 10.3389/feart.2023.1075739
Received: 20 October 2022; Accepted: 10 January 2023;
Published: 25 January 2023.
Edited by:
Dennis A. Darby, Old Dominion University, United StatesReviewed by:
Joseph Daniel Ortiz, Kent State University, United StatesPer Sune Andersson, Swedish Museum of Natural History, Sweden
Copyright © 2023 Veres, Ekaykin, Golobokova, Khodzher, Khuriganowa and Turkeev. This is an open-access article distributed under the terms of the Creative Commons Attribution License (CC BY). The use, distribution or reproduction in other forums is permitted, provided the original author(s) and the copyright owner(s) are credited and that the original publication in this journal is cited, in accordance with accepted academic practice. No use, distribution or reproduction is permitted which does not comply with these terms.
*Correspondence: Arina N. Veres, dmVyZXNAYWFyaS5ydQ==; Alexey A. Ekaykin, ZWtheWtpbkBhYXJpLnJ1
†Present addresses: Arina N. Veres, Climate and Environmental Research Laboratory, Arctic and Antarctic Research Institute, St. Petersburg, Russia; Alexey A. Ekaykin, Climate and Environmental Research Laboratory, Arctic and Antarctic Research Institute and Institute of Earth Sciences, Saint Petersburg State University, St. Petersburg, Russia