 Chris E. Conway
 Leo R. Pure
 Osamu Ishizuka
- 1Research Institute of Earthquake and Volcano Geology, Geological Survey of Japan, AIST, Tsukuba, Japan
- 2Environment Approvals Division, Department of Climate Change, Energy, the Environment and Water, Canberra, ACT, Australia
One of the fundamental questions that underpins studies of the interactions between the cryosphere and volcanism is: do causal relationships exist between the ice volume on a volcano and its eruption rate? In particular, it is critical to determine whether the decompression of crustal magma systems via deglaciation has resulted in enhanced eruption rates along volcanic arcs in the middle to high latitudes. Evidence for such a feedback mechanism would indicate that ongoing glacier retreat could lead to future increases in eruptive activity. Archives of eruption frequency, size, and style, which can be used to test whether magma generation and eruption dynamics have been affected by local ice volume fluctuations, exist in the preserved eruptive products of Pleistocene-Holocene volcanoes. For this contribution, we have reviewed time-volume-composition trends for 33 volcanoes and volcanic groups in arc settings affected by glaciation, based on published radiometric ages and erupted volumes and/or compositions of edifice-forming products. Of the 33 volcanic systems examined that have geochronological and volumetric data of sufficient resolution to compare to climatic changes since ∼250 ka, increases in apparent eruption rates during post-glacial periods were identified for 4, with unclear trends identified for a further 12. Limitations in the geochronological and eruption volume datasets of the case studies make it difficult to test whether apparent eruption rates are correlated with ice coverage. Major caveats are: 1) the potential for biased preservation and exposure of eruptive materials within certain periods of a volcano’s lifespan; 2) the relative imprecision of geochronological constraints for volcanic products when compared with high-resolution climate proxy records; 3) the reliance on data only from immediately before and after the Last Glacial Termination (∼18 ka), which are rarely compared with trends throughout the Pleistocene to test the reproducibility of eruptive patterns; and 4) the lack of consideration that eruption rates and magma compositions may be influenced by mantle and crustal processes that operate independently of glacial advance/retreat. Addressing these limitations will lead to improvements in the fields of geochronology, paleoclimatology, and eruption forecasting, which could make valuable contributions to the endeavours of mitigating future climate change and volcanic hazards.
Introduction
An important goal at the Frontier of Earth science research is to understand the connections between volcanic plumbing systems and crustal pressurization and depressurization caused by glacial advance and retreat. Advancing this goal will improve the understanding of volcano-climate feedback processes on regional and global scales, which may support the long-term forecasting and mitigation of volcanic activity and hazards, and the use of volcanic deposits as climate records. The idea that enhanced rates of volcanism occur as a result of deglaciation has attracted much attention over the last 30 years (Sigvaldason et al., 1992). Maclennan et al. (2002) showed that the rate of volcanic activity in Iceland during the early post-glacial period (∼12.5–10 ka) increased by a factor of up to 50. Based on volumetric and geochronologic data for eruptive deposits, this observation has been attributed to a greater degree of mantle melting and a facilitation of magma ascent pathways through the crust as the overburden pressure imposed by glaciers was reduced (Jull and McKenzie, 1996; Figure 1). Patterns of eruption frequency during the Quaternary in eastern California (Jellinek et al., 2004) and western Europe (Nowell et al., 2006) have also been attributed to post-glacial depressurization of the crust in continental intraplate settings. Studies of the response of volcanoes to glacial retreat in continental arc settings have produced varied conclusions. Distal tephra records in marine cores, which provide high temporal resolution to test causality between volcanism and changes in sea-level and/or ice volume over numerous glacial cycles (e.g., Schindlbeck et al., 2018), indicate that periods of enhanced volcanism occurred following deglaciation (Kutterolf et al., 2019). More proximal terrestrial and marine tephra records have provided compositional and volumetric data for studying magma system response to deglaciation, but only for the time period since ∼20 ka (Watt et al., 2013; Praetorius et al., 2016; Rawson et al., 2016). Such records can be hampered by the under-recording of relatively small-scale eruptions (Kiyosugi et al., 2015) and the poor preservation of tephras during glacial periods (Watt et al., 2013).
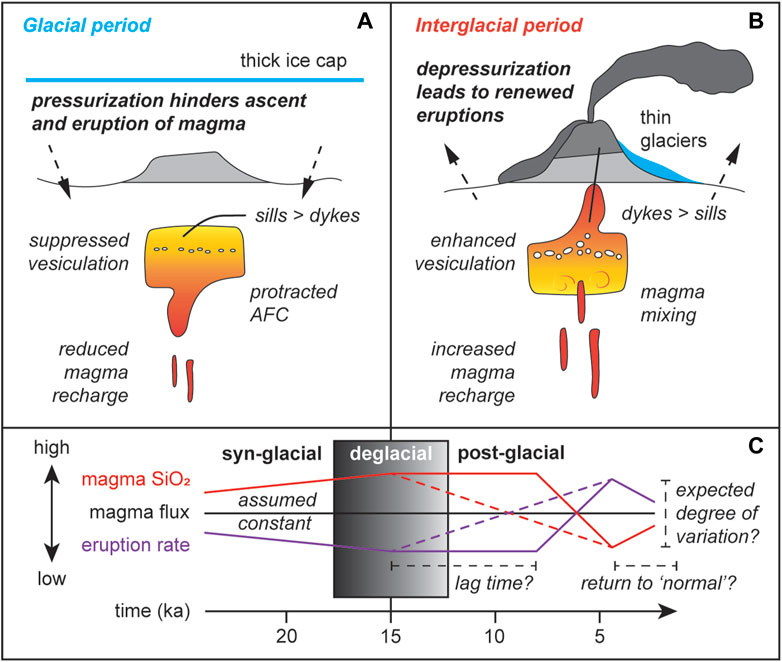
FIGURE 1. Summary of the hypothesis that (A) ice loading on volcanoes suppresses volcanic activity and that (B) deglaciation causes increased eruption rates at volcanoes for a constant supply of magma into the crust. (C) The predicted effects of deglaciation on eruptive rates and whole-rock SiO2 concentrations for the ∼25 to 5 ka interval, which includes the LGM and last deglaciation. Studies have postulated a lag between deglaciation and changes in eruptive rates and compositions due to gradual magma system depressurization (e.g., Jellinek et al., 2004; Rawson et al., 2016; Wilson and Russell, 2020). In (C), the decrease in SiO2 concentrations after 10 ka represents the transition from the situation in (A) where suppressed vesiculation and ascent causes stalled magmas to evolve to elevated SiO2 concentrations to (B) where depressurization after deglaciation allows low-SiO2 magmas to ascend and erupt more often with less time differentiating in the crust.
Constraining volumetric eruption rates and magma chemistry evolution trends for individual Pleistocene volcanic edifices in the context of local ice histories may offer further understanding of the feedbacks between (de)glaciation and eruption dynamics. Some studies that examined relationships between inferred eruption rates, lava compositions, and ice coverage have advocated for a genetic link between ice retreat and eruptive dynamics (e.g., Singer et al., 2008; Figure 1). Other studies have found no clear indication that deglaciation causes enhanced rates of volcanism (e.g., Schmidt and Grunder, 2009). To accompany in-depth analyses of tephra records (e.g., Watt et al., 2013; Kutterolf et al., 2019), a comprehensive review of studies on the proximal eruption records of glaciated volcanic edifices is required to improve our understanding of this topic.
The majority of active volcanoes (i.e., have had eruptions in the Holocene) with coexistent glaciers on Earth are located in subduction zones (190/245; Edwards et al., 2020). In order to investigate whether future eruptive behaviour at these locations may be influenced by current climate warming trends, we have examined the potential influence of (de)glaciation on volcanism during the past ∼500 kyr. This assessment focusses on 33 volcanoes or volcanic groups that occur in circum-Pacific continental and oceanic arcs (Table 1; Figure 2). Our review aims to: (1) assess the evidence for causal relationships between glaciation and eruption rates at arc volcanoes based on currently available high-resolution eruptive histories; (2) identify and describe the limitations that may preclude accurate assessments of feedbacks between ice volume changes and volcanic activity; and (3) outline the future outlook of research on potential volcano-cryosphere feedbacks and highlight the benefits that will result from striving for comprehensive studies of these phenomena.
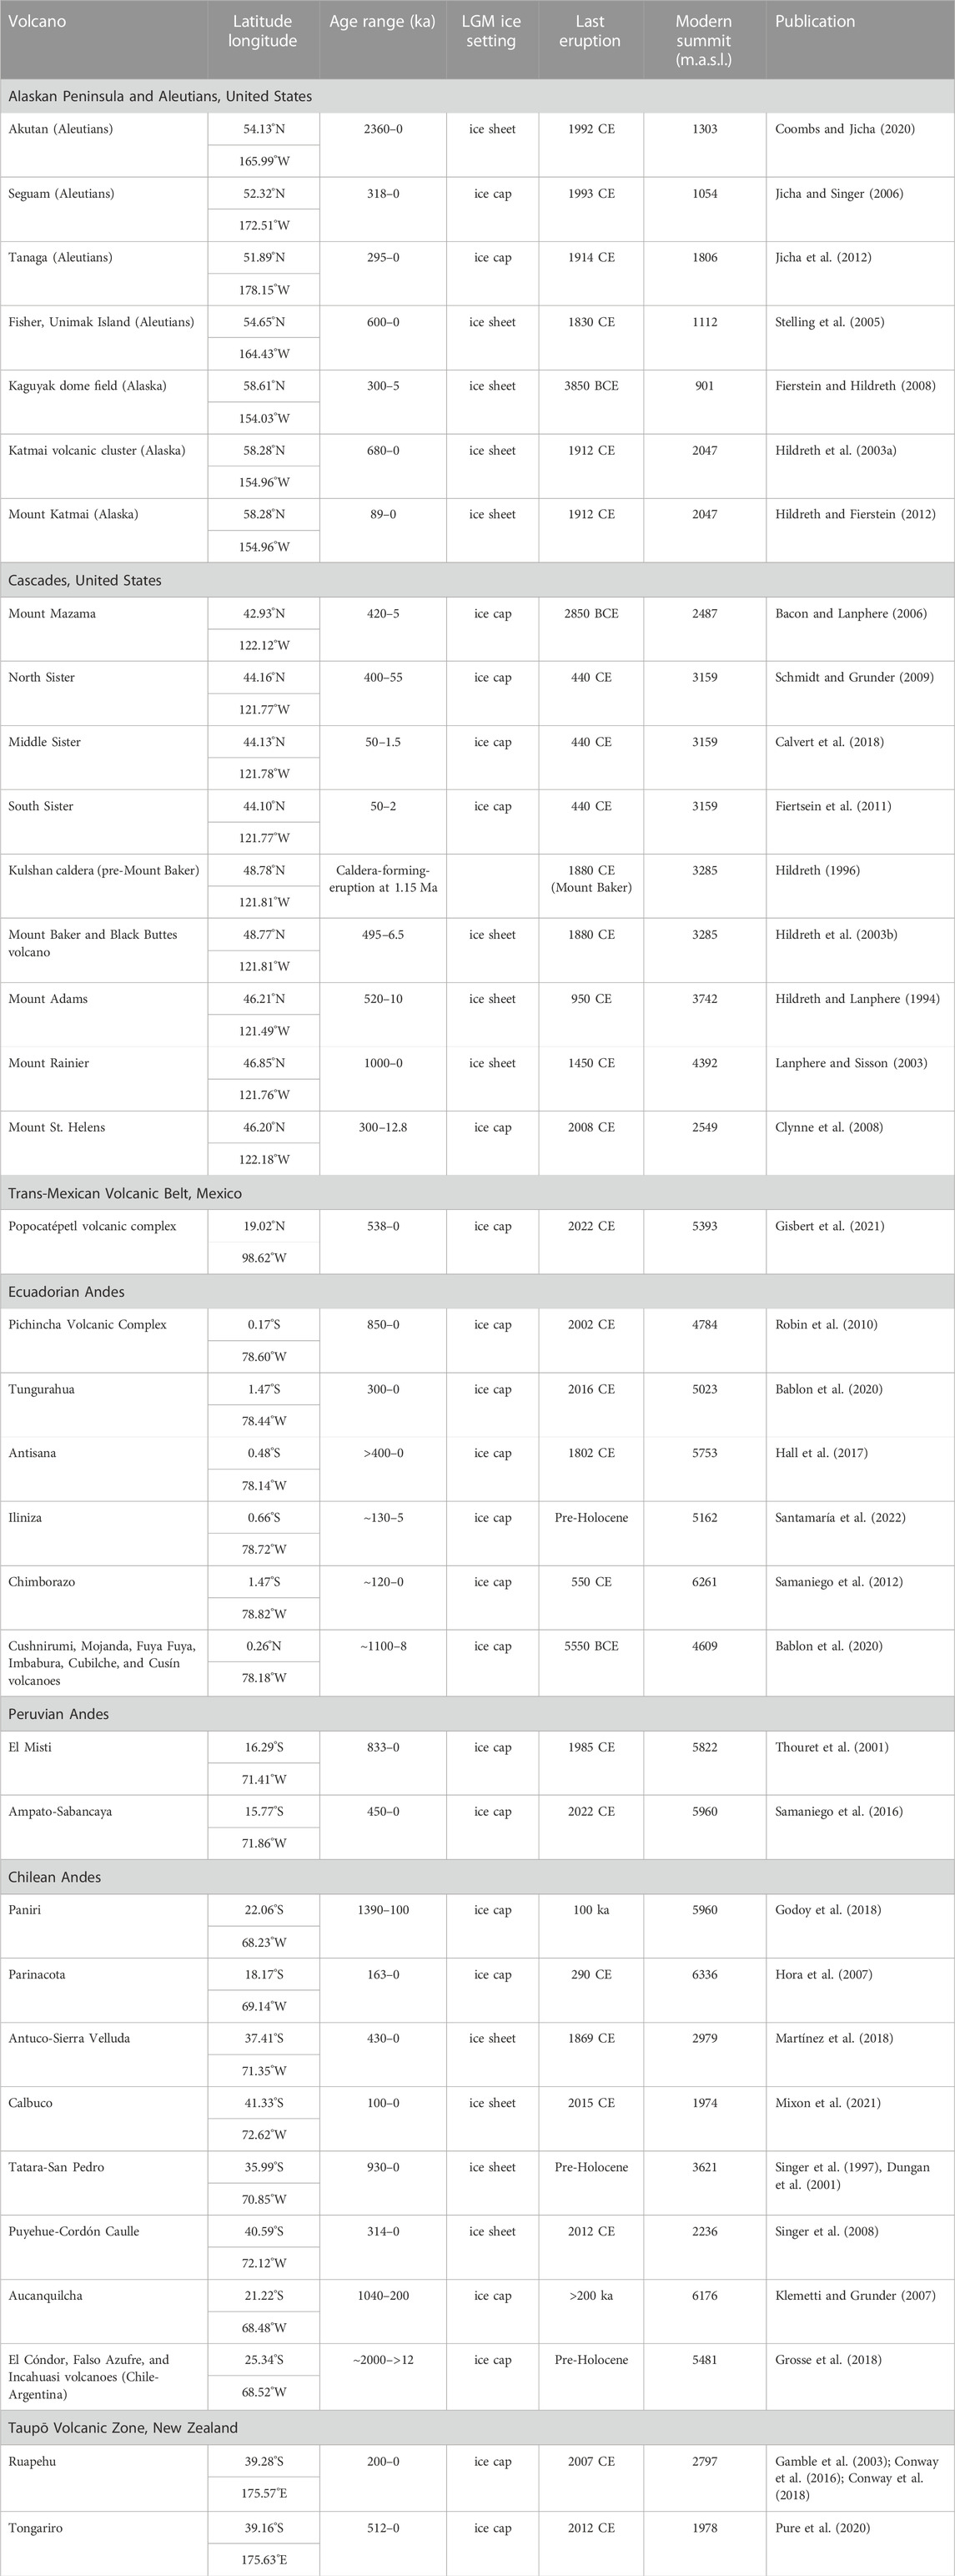
TABLE 1. Glaciated volcanoes considered in this paper.
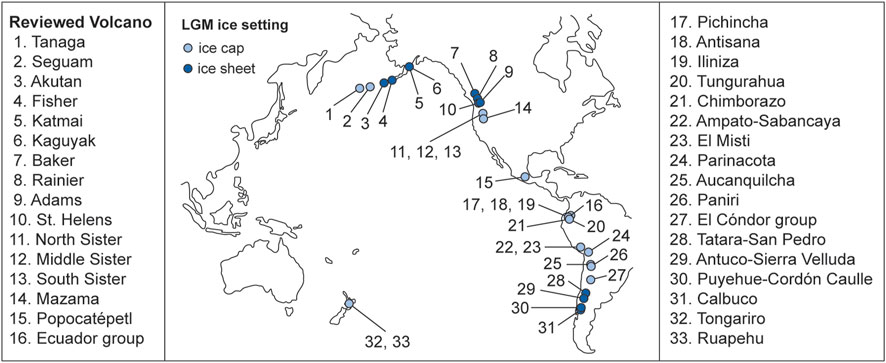
FIGURE 2. Map of circum-Pacific arc volcanoes that are assessed in this paper. The numbers refer to the volcanoes and volcanic systems, and LGM ice thicknesses are shown using light and dark blue dots. See Table 1 for the studies that report data on these volcanoes.
Examination of the hypothesis: Deglaciation leads to increased eruption rates
Surficial changes at volcanoes can impact their magma plumbing systems at depth. Pinel and Jaupart (2000) proposed that edifice construction progressively exerts a load on the crust, meaning that as a volcano grows in height, magmas must become more evolved (i.e., buoyant) if they are to ascend and erupt by overcoming the changing stress field. Conversely, sudden removal of part of an edifice in sector collapses leads to rapidly renewed eruption of primitive, dense magmas as the surface load is removed (Cassidy et al., 2015). In a similar way, the long-term loading of a volcano by prolonged growth of glaciers or ice sheets, and the relatively rapid unloading as ice melts during periods of deglaciation, has been interpreted to impact the rates of volcanism and compositions of erupted magmas in glaciated regions (e.g., Huybers and Langmuir, 2009; Figure 1). In volcanic arc settings, the crust hosts magma systems whose storage and ascent processes can be affected by changes in surficial loading on and around the volcanic edifice (Watt et al., 2013). Accordingly, relationships and feedbacks between ice extent, volcanism and magmatism have also been proposed for arc settings (e.g., Kutterolf et al., 2013).
Subduction zone volcanoes, many of which have been periodically glaciated (Edwards et al., 2020), are responsible for most of Earth’s total subaerial magma output (∼90% of eruptions since 1900; Siebert, 2002). For this reason, any causative links between ice extent and arc volcanism may be fundamentally connected to the evolution of Earth’s climate and the hazard potential of active volcanoes. Studies that have reported such a link propose that magmatic systems become pressurized as ice accumulates on volcanic edifices (or across the continent in some cases) during glacial advance. The associated suppression of vesiculation and favourable formation of sills over dykes is inferred to stifle eruption rates (Jellinek et al., 2004; Mora and Tassara, 2019; Wilson and Russell, 2020; Figure 1A). During glacial retreat, volcanic edifices are depressurized, hence the hypothesis predicts that eruption frequencies and volumes will increase when ice masses disappear as dyke propagation and magma volatile saturation are enhanced (Bindeman et al., 2010; Wilson and Russell, 2020; Figure 1B). The central question underpinning the hypothesis is therefore: are climatically driven changes in ice-loading at volcanoes sufficient to influence eruption rates and/or erupted magma compositions?
While a general hypothesis has been agreed upon (i.e., deglaciation leads to enhanced eruption rates), the assumptions and limitations of studies that test this hypothesis are seldom reported. Testing whether ice loading reduces rates of volcanism implies that eruptible magma ascent is suppressed and/or magma recharge is prevented at the time of ice loading (e.g., Praetorius et al., 2016; Rawson et al., 2016). Such a condition implies that there is a steady-state flux of magma from the mantle to the surface via the crust over the ∼10–100 kyr time periods of interest (Figure 1C), and that deviations from regular eruptive rates or compositions can be interpreted as being driven by external processes (i.e., ice loading). However, volcanoes in non-glaciated regions also exhibit periods of enhanced growth and relative quiescence (e.g., Yamamoto et al., 2018). In such settings, variable time-volume-composition trends can be explained without oscillations in surface loading and therefore must result from crustal and mantle conditions and processes that control magma generation, storage and eruption, and the regional stress field (Mora and Tassara, 2019). Furthermore, neither the anticipated degree of change to eruption rates and magma compositions nor the expected time lag between ice retreat and volcanic response are outlaid in the framing of studies aiming to test the hypothesis (Figure 1C). As such, statistical tests are not utilized in the way they are for other volcanological studies that examine causality (e.g., Cisneros de León et al., 2022), and time-volume-composition trends may be explained via complex, multi-staged, or delayed eruption response models (e.g., Rawson et al., 2016). It is therefore unclear to what degree the erupted magma compositions and volumes are expected to diverge from a baseline due to changes in crustal loading from glacial advance and retreat (Edwards et al., 2002).
Inferences on whether ice loading impacts the volcanic and magmatic system are also entwined with a number of contrasting (but not mutually exclusive) views about how time-volume edifice growth curves should be interpreted. For many volcanic systems it is plausible that glacial erosion, preservation biases, and real eruptive hiatuses have each affected the surviving rock record, but the relative influence from each of these phenomena is debated (e.g., Pure et al., 2020; Mixon et al., 2021). Attempts to assess links between climate and volcanism are often secondary discussion points in studies where the primary objective is to understand the eruption history and hazard potential of a volcano (e.g., Jicha and Singer, 2006; Singer et al., 2008; Conway et al., 2016; Calvert et al., 2018; Pure et al., 2020). Many of the gaps in our knowledge about the links between deglaciation and eruptive dynamics that were identified by Tuffen (2010) are thus yet to be addressed. These include uncertainty in how rapidly arc volcanic systems may react to deglaciation and whether subduction zone volcanoes respond to small changes in ice thickness. Ignoring these complications for the time being, the frequent eruptions and long lifespans of Pleistocene arc volcanoes provide valuable records of evolving eruptive and magmatic activity that can be compared with changes to the regional and global paleoenvironment. The potential causality between deglaciation and eruptive activity at arc volcanoes can therefore be assessed by undertaking extensive field campaigns that establish high-resolution eruptive histories from radiometric age data and detailed mapping work. The approach we have taken for this review is to compile high-fidelity proximal eruptive records for arc volcanoes affected by glaciation and compare them with global (benthic δ18O) and regional (moraine chronology) proxy records for past ice extent.
Time-volume trends for arc volcanoes affected by Pleistocene glaciations
We identified and reviewed studies of arc volcanoes in the middle to high latitudes (plus Mexico and Ecuador) that satisfied the following requirements: (1) the volcano or volcanic cluster has been glaciated at least once in its lifetime; (2) the study reports geochronological data, or an eruptive stratigraphy constrained by radiometric dating; and (3) stratigraphic data are reported with coupled data on erupted magma volumes and/or compositions. Of the 33 volcanoes and volcanic systems that passed these criteria and are considered in this review (Table 1; Figure 2), four are from the oceanic Aleutian arc, two are from the continental Alaskan Peninsula arc, eight are from the continental Cascades arc in the western United States, one is from the continental arc of the Trans-Mexican Volcanic Belt, six are from the Ecuadorian Andes, two are from the Peruvian Andes, eight are from the Chilean Andes, and two are from the Taupō Volcanic Zone in New Zealand. In Table 1; Figure 2, the volcanoes are categorized as those that were affected by ice sheets or ice caps during the Last Glacial Maximum (LGM), according to regional ice thickness reconstructions (Davies et al., 2020; Palacios et al., 2020). The paucity of datasets from the mainland Aleutians, Wrangells, Canadian Cascades, and southern Chile resulted in the inclusion of relatively few (11) volcanoes from areas affected by thick ice (>500 m of ice). The majority (22) of the volcanoes covered in this review were impacted by alpine ice caps and glaciers (∼200 m of ice). Volcanoes from Kamchatka, the Kuriles, Japan, Indonesia, Papua New Guinea, and the Philippines were not considered due to a lack of detailed time-volume data for edifice materials and/or ambiguity about glaciation in these settings.
Table 2 summarizes key results and interpretations presented in the studies of these 33 volcanic systems, as relevant to this review. A compilation of apparent growth rates (time-volume curves) from 20 of these volcanoes is presented in Figure 3, which are taken from the preserved, averaged, or minimum volumes reported in the data sources. Time-volume trends reported for the volcanoes are summarized below and considered in the context of time-varied ice coverage throughout repeated climatic cycles. Time-composition data are discussed in the subsequent section, below.
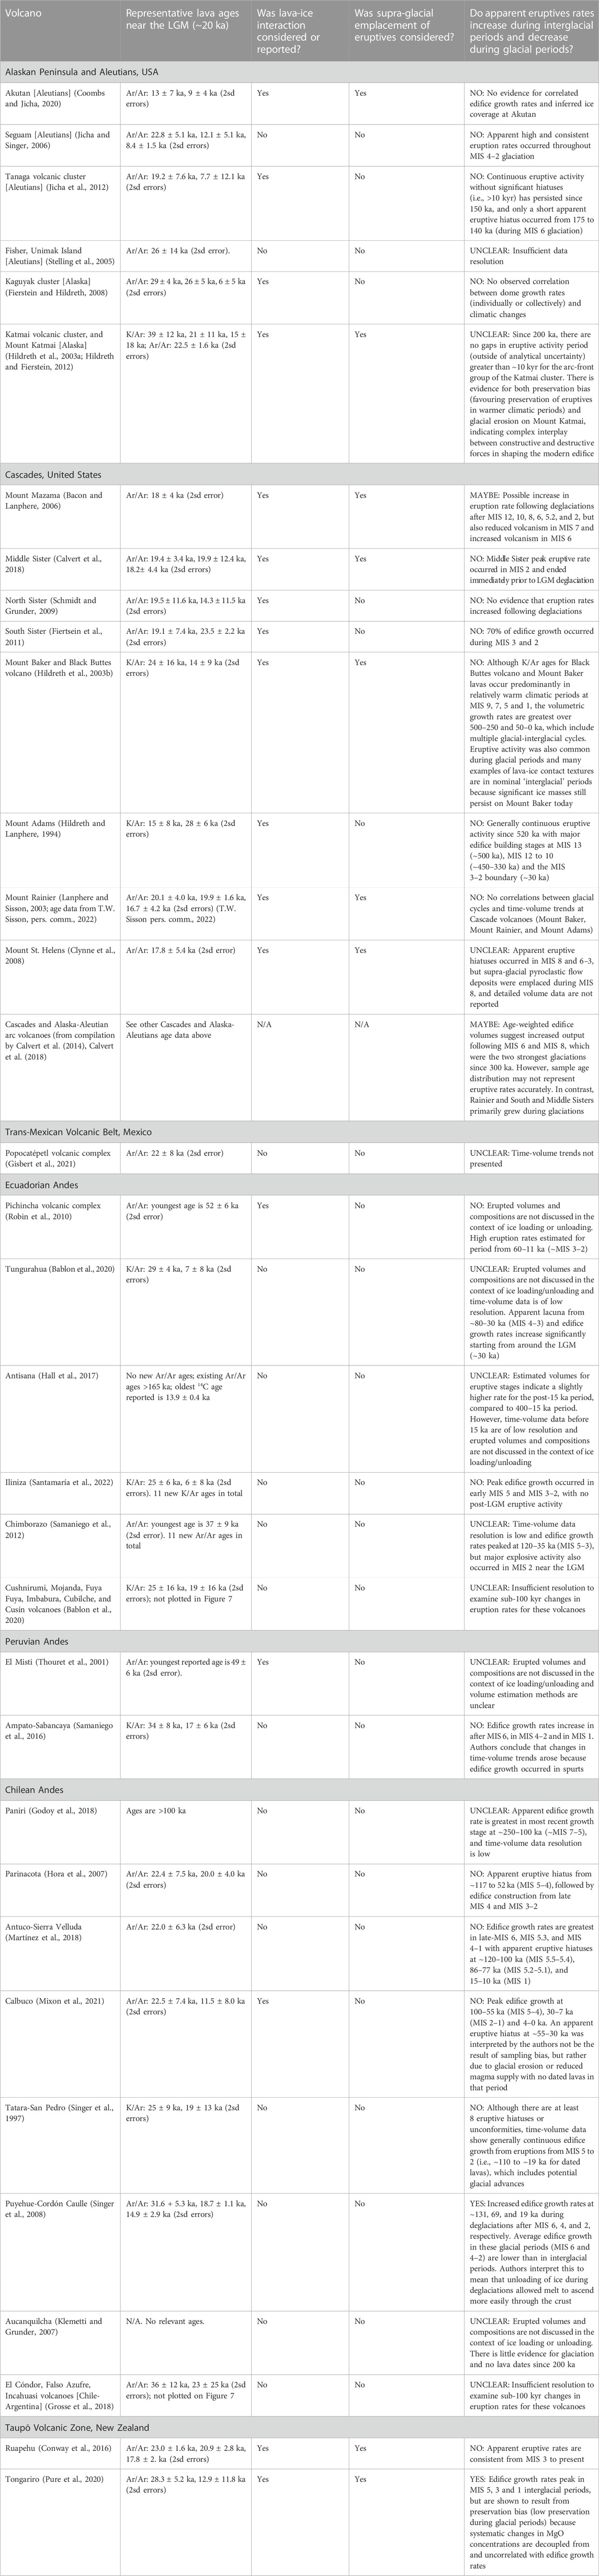
TABLE 2. Summary of geochronological precision, preservation considerations, and time-volume correlations with climatic changes. The radiometric ages and other summarized information are from the references in Table 1, unless otherwise noted.
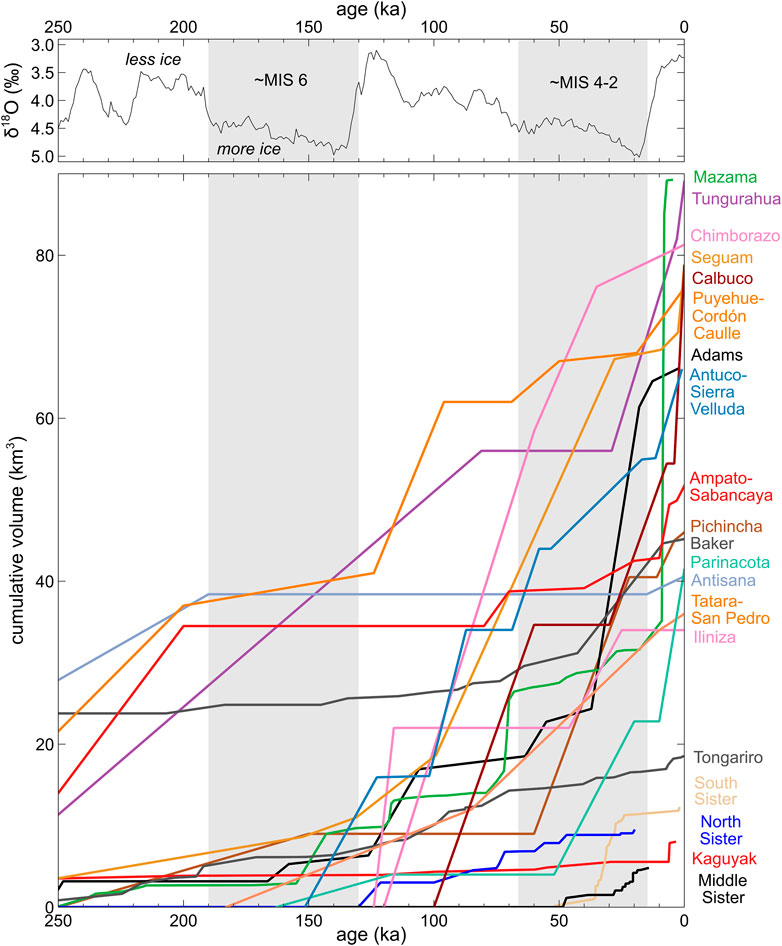
FIGURE 3. Summary of benthic δ18O climate proxy data (Lisiecki and Raymo, 2005) and edifice growth rates for 20 of the volcanic systems assessed in this review since 250 ka. In upper and lower panels, the approximate positions of glacial MIS stages are shaded in grey, and unshaded regions are interglacial MIS stages. Cumulative volcano edifice growth volumes and ages are from the studies in Table 1, which are compiled in the Supplementary File S1. Of the total 33 volcanic systems considered in this review, 13 are excluded from this figure because they are older than ∼100 ka (Paniri, Aucanquilcha), or their time-volume data are of low resolution or absent (Tanaga, Akutan, Fisher, Katmai cluster [including Mount Katmai], Mount Rainier, Mount St. Helens, Mount Hood, Shasta, Lassen, Popocatepétl, El Misti), or their total volumes exceed 100 km3 (Ruapehu); note that Kulshan caldera is counted with Mount Baker. To fit on the diagram, cumulative volume sums begin from ∼0 km3 for Pichincha and Mazama.
Alaskan Peninsula and the Aleutians
The six volcanoes (or volcanic clusters) considered for the Alaska Peninsula and the Aleutian arc cover the Tanaga volcanic cluster, Seguam, Akutan, Fisher, the Katmai volcanic cluster (including Mount Katmai), and the Kaguyak dome field (Tables 1 and 2; Figure 2). Reported geochronological results for these systems date from before 2 Ma to the Holocene, but most radiometric ages are between 300 and 0 ka, and thus document eruption histories that coincided with glacial advance and retreat from Marine Isotope Stage (MIS) 8 through 1 (see references in Table 1). Kaufman et al. (2011) reported the extent of glacial advances during the late Pleistocene which covered the entire volcanic arc component of the Alaskan Peninsula and most (>90%) of the eastern Aleutian Islands (including Akutan, Unalaska and westward to Vsevidof volcano). However, by 18 ka only areas east of (but excluding) Veniaminof volcano were still glaciated as the continental ice sheet retreated (Dalton et al., 2020). Published research therefore shows that Tanaga and Seguam potentially only supported ice caps during peak glacial advances of the late Pleistocene whereas Akutan and Fisher caldera were wholly or partly covered by the continental ice sheet at such times.
Only the studies of Seguam and the Kaguyak domes report time-volume data with sufficient resolution to compare with climatic changes since ∼250 ka (Figure 3; Fierstein and Hildreth, 2008; Jicha and Singer, 2006). During MIS 6 and other nominal glacial periods, some volcanoes display apparent eruptive hiatuses (Tanaga: Jicha et al., 2012; Akutan; Coombs and Jicha, 2020) whereas others underwent persistent edifice growth from new eruptions (Katmai cluster: Hildreth et al., 2003a).
Domes and edifice eruptives commonly display field evidence for syn-glacial lava emplacement, including horizontal column jointing and overthickening of flows (Jicha and Singer, 2006; Fierstein and Hildreth, 2008; Hildreth and Fierstein, 2012; Coombs and Jicha, 2020). Erosion is inferred to have modified the surviving volumes of erupted material. Estimates of eroded volumes are not given for all six volcanic systems but estimates are as high as 50% in the Katmai cluster, based on valley erosion of originally conical edifices (Hildreth et al., 2003a). Of the studies of the six systems, two proposed that variable time-volume trends reflect the incomplete preservation of erupted materials in situations where lavas are erupted onto ice and ‘flushed’ off the edifice as debris (Hildreth and Fierstein, 2012; Coombs and Jicha, 2020). Evidence for glacial erosion on Aleutian Island volcanoes is generally limited to small volumes of till on ring plain areas and smoothed upper surfaces on lava flows (Jicha and Singer, 2006; Jicha et al., 2012). Smoothed lava surfaces are also observed on the Alaskan Peninsula volcanoes (e.g., Katmai) but till and moraine volumes are much greater (Hildreth and Fierstein, 2012).
Cascades
Quaternary volcanoes of the Cascades arc have morphologies and eruption histories that have been significantly impacted by glaciation. Mounts Baker (including Kulshan caldera), Rainier, St. Helens, Adams, Hood, Mazama, and the Three Sisters are complex volcanic edifices, some of which have likely lost up to 70% of their original material due to glacial erosion (Hildreth, 2007).
There is no evidence for increased eruption rates following major deglaciations at the large and long-lived Baker, Rainier, and Adams volcanoes. Ice-contact textures and morphologies are reported in edifice records since 500 ka at both Baker and Adams (Hildreth and Lanphere, 1994; Hildreth et al., 2003b). No correlation between inferred ice extent and eruptive rate or magma compositions is reported for Rainier, which grew during glacial periods, and time-volume trends were inferred to reflect variable tectonic stress regimes in the crust (Lanphere and Sisson, 2003). An apparent eruptive hiatus from ∼250 to 150 ka at St. Helens precludes interpretations about volcanism-glaciation feedbacks for that period (Clynne et al., 2008). However, the absence of notable temporal variations in lava and pyroclast chemistry since ∼300 ka suggests that magma generation and eruption dynamics were not impacted by ice loading and unloading (Clynne et al., 2008).
Detailed eruptive histories and volume reconstructions for the Three Sisters volcanoes provided no evidence that eruption rates increased following periods of glacial retreat. At North Sister, Schmidt and Grunder (2009) estimated that half of the erupted volume has been eroded from the volcano. Whilst acknowledging the large uncertainties in calculating the volumes of edifice-forming products, the authors found no correlation between periods of reduced ice coverage and eruption rate over the growth history from ∼400 to 55 ka. At Middle Sister (∼50–1.5 ka), the peak eruptive episode occurred during increased ice coverage and ended immediately prior to the LGM (Calvert et al., 2018; Figure 3). Similarly, 70% of edifice growth at South Sister (∼50–2 ka) occurred in the presence of extensive ice coverage during MIS 3 and 2 (Fiertsein et al., 2011). The evolution of Mazama includes possible increases in eruption rate following deglaciations after MIS 12, 10, 8, 6, 5.2, and 2. However, periods of reduced volcanism in MIS 7 and increased volcanism in MIS 6 show that the pattern is not reproducible (Bacon and Lanphere, 2006).
Mexico
Ice-caps likely covered the summits of Colima, Nevado de Toluca, Pico de Orizaba, Cofre de Perote, and Popocatépetl at ∼20 ka (Capra et al., 2013), although only the latter has a high-resolution eruptive history available to study volcano-ice interactions. Popocatépetl volcanic complex of the Trans-Mexican Volcanic Belt has an eruptive history dating back to ∼538 ka and is currently one of the most active volcanoes in Mexico. Small summit glaciers have retreated rapidly in historic times (Delgado Granados et al., 2007), but broad valleys on the lower flanks attest to more extensive glaciation in the past.
Despite the likely widespread occurrence of glaciovolcanic products at Popocatépetl, they are not described in a recent overview of its eruptive history that combines new and existing data (Gisbert et al., 2021). This study did not examine the volumes and compositions of erupted magmas within the context of the temporal evolution of the complex and its ice cover. We note here that the Popocatépetl volcanic complex comprises lava flows that show a near-continuous growth history since ∼350 ka, which are recorded by 34 radiometric ages, except for an apparent hiatus in major edifice construction that lasted from ∼190 to 100 ka (approximately MIS 6). Following a major sector collapse event and explosive eruption, construction of the modern Popocatépetl cone has been ongoing since ∼23 ka.
Ecuadorian Andes
We reviewed the eruptive histories of six volcanoes in the Ecuadorian Andes that exhibit evidence for late Pleistocene glacial advances: Pichincha, Antisana, Iliniza, Tungurahua, and Chimborazo. Preserved edifice volumes and ages for Cushnirumi, Mojanda, Fuya Fuya, Imbabura, Cubilche, and Cusín volcanoes in the Ecuadorian Andes were also reported by Bablon et al. (2020) in a multi-volcano study, and are counted as one volcanic system of the total 33 systems considered in this review. For Pichincha, Antisana, Iliniza, Tungurahua, and Chimborazo, the available data on edifice growth histories at these volcanoes are generally of insufficient resolution to draw robust conclusions about volcanism-deglaciation feedbacks, and in some cases the data show contradictory patterns in edifice growth rates at the MIS 6 and 2 (LGM) terminations (Figure 3). Erosion is discussed generally, as it is relevant to estimating eruptive volumes, but syn-glacial edifice construction is not discussed in detail for the studies of these five volcanoes.
Pichincha is characterized by an average eruptive rate of 0.82 km3/kyr from ∼60 to 22 ka (∼MIS 4–2) which is followed by an apparent hiatus until 11 ka and then continued growth at 0.25–0.64 km3/kyr for the rest of the Holocene (Figure 3; Robin et al., 2010). Notably, the apparent hiatus occurs after the LGM. At Antisana only three average growth rates determined since 250 ka are suited for examining potential deglaciation responses following the LGM (Figure 3; Hall et al., 2017). Elevated edifice growth rates after ∼15 ka, relative to the apparent hiatus between 190 ± 23 ka and ∼15 ka, appear to show increased eruptive rates following deglaciation, but a similar pattern is not seen after the MIS 6 deglaciation (ending at ∼130 ka). At Iliniza, the northern edifice was constructed at a rate of 3.5 ± 2.6 km3/kyr over the period of ∼124–116 ka following the MIS 6 glacial termination (Santamaría et al., 2022). After a ∼70 kyr-long apparent lacuna during MIS 5 and 4, construction of the South Iliniza edifice recommenced at ∼46 ka and continued until ∼25 ka (MIS 3–2), with no post-25 lava flows. These time-volume data from Iliniza are of limited resolution and only capture one major deglaciation event (after MIS 6). Over Tungurahua’s ∼300 kyr growth history, there is an apparent lacuna from ∼81 to 29 ka (∼MIS 5.1–3) after which edifice growth continued at 1.0–2.3 km3/kyr from ∼29 ka onwards, hence edifice growth appears decoupled from changes in ice coverage (Bablon et al., 2020; Figure 3). Chimborazo’s basal edifice formed during ∼120–60 ka (∼MIS 5), at a rate of 0.7–1.0 km3/kyr and was followed by a large sector collapse at ∼65 ka (Samaniego et al., 2012). Subsequently, the Intermediary edifice was constructed at a rate of 0.4–0.7 km3/kyr from ∼60–35 ka (∼MIS 3) which slowed to ∼0.1 km3/kyr when 95% of the Young Cone was constructed between ∼30 and 14 ka (MIS 2). These results indicate a progressive decrease of the magmatic output rate during the history of Chimborazo, and no forcing of elevated eruption rates following deglaciation after the LGM. In general, the age data are of insufficient resolution to make meaningful comparisons between edifice growth rates and climatic changes since ∼250 ka at Cushnirumi, Mojanda, Fuya Fuya, Imbabura, Cubilche, and Cusín volcanoes. For example, only two growth rates have been determined for Imbabura in the periods from >47 to ∼30 ka and ∼35 to 0 ka, and the other volcanoes have only a single growth rate reported for the entire eruptive histories.
Peruvian Andes
The eruptive histories of the long-lived volcanic complex of Ampato-Sabancaya (since ∼450 ka) and modern cone of El Misti (since ∼112 ka) contain limited evidence for volcanism-deglaciation feedback processes. Major growth periods at Ampato-Sabancaya occurred at ∼450–400 ka, ∼250–200 ka, and ∼80–70 ka, and appear to be separated by ≥100 kyr lacunae (Figure 3; Samaniego et al., 2016). The resolution of the post-80 ka record is of much higher resolution than the earlier history and shows periodically higher growth rates at ∼80–70 ka (∼MIS 5.1), ∼40–20 ka (∼MIS 4–2), and after 10 ka (MIS 1). These variations in edifice growth rates occur in both periods of elevated and reduced ice coverage as inferred from δ18O climate proxy data.
Edifice construction of the ∼70–83 km3 El Misti volcano (Misti stages 2, 3, and 4) since ∼112 ka occurred during five main periods of increased eruption rates with intervening periods of erosion at ∼45, ∼35, ∼28, and ∼12 ka (Thouret et al., 2001). These periods of edifice growth continued through glacial stages at relatively high rates compared with MIS 5, however, the trends were constrained by only five absolute ages for lavas and volume estimates with large analytical uncertainties. The authors noted that the time-volume trends should be treated as preliminary findings. There are no strong trends when erupted magma compositions are plotted against their age for El Misti (Rivera et al., 2017), and the mapping and geochemical studies indicate ice loading/unloading has not impacted the rates and compositions of volcanism at El Misti.
Chilean Andes
We assessed studies for eight volcanoes from the Chilean Andes that span a latitudinal range of ∼18–41°S. The southernmost cones of Tatara-San Pedro, Antuco-Sierra Velluda, Puyehue-Cordón Caulle and Calbuco experienced advance of the Patagonian Ice Sheet during late Pleistocene glaciations (Davies et al., 2020), whereas the more northerly Parinacota, Aucanquilcha, Paniri, and the El Cóndor group (including Falso Azufre, and Incahuasi: Grosse et al., 2018) were impacted by ice caps and flank glaciers (Figure 2).
Following inception at ∼163 ka, the growth of Parinacota volcano was interrupted by an apparent hiatus in eruptive activity from ∼117 to 52 ka (∼MIS 5–4), which was followed by cone construction throughout MIS 3 and 2 (Hora et al., 2007; Figure 3). Construction of the long-lived Paniri volcano since ∼1.4 Ma is typified by its highest growth rates during the most recent constructional stage from ∼250 to 100 ka (Godoy et al., 2018). Relatively scarce radiometric age data preclude the assessment of temporal variations in eruptions rates on shorter time scales, and as such there is no evidence that glacial loading and unloading of the edifice impacted the rates of volcanism. The eruptive history of Aucanquilcha (since ∼1 Ma) was divided into four stages by Klemetti and Grunder (2007) based on eleven 40Ar/39Ar ages, with most of the edifice growth attributed to effusive activity prior to 800 ka and no apparent activity since 200 ka. Similar to Paniri, Aucanquilcha’s edifice growth rates could not be assessed with respect to sub-100 kyr climatic changes because of the resolution of age data, and the lack of eruptions during the late Pleistocene precluded evaluation of rates of volcanism during recent glaciations.
With an inception age of ∼930 ka, the Tatara-San Pedro volcanic complex preserves ∼55 km3 of lavas within unconformity-bound sequences, which have basal lava ages that generally indicate that the minimum upper limits of lacunae correlate with global ice-volume peak advances. Repeated glacial advances are therefore inferred to have provided a punctuated growth record for the edifice, due to major erosional episodes that removed up to 50%–95% of material during the period from 930 to 200 ka (Singer et al., 1997). Time-volume trends for the Tatara-San Pedro volcanic complex are shown since 250 ka in Figure 3 (Singer et al., 1997).
Volcanism has been near-continuous since ∼100 ka to form the Antuco-Sierra Velluda volcanic complex, at an average growth rate of 0.43 km3/kyr (Martínez et al., 2018; Figure 3). Divided into stages, the minimum flux rates for the periods from 150 to 17 ka, 17–6.2 ka, and 6.2 ka to present were 0.28 km3/kyr, 0.27 km3/kyr, and 0.65 km3/kyr. The authors stated that main growth of the volcano occurred following major deglaciation from MIS 6 and 2, however, there is only one dated lava during early MIS 5 compared with the twelve that coincide with MIS 4-2 that indicate steady growth through the last glacial period. The authors imply that deglaciation induced a stress drop of ∼3–5 MPa, which promoted easier ascent of basaltic magma that was erupted after ∼17 ka. Although a notable increase in eruption rate is reported after the ∼6.2 ka sector collapse event, the effect of this rapid edifice unloading mechanism on the magma system was not discussed by Martínez et al. (2018).
The Puyehue-Cordón Caulle volcanic complex preserves ∼131 km3 of lavas and tephras that have amassed since 314 ka (Singer et al., 2008; Figure 3). Eruptive rates were non-uniform over this time period, with notable cone growth episodes occurring at ∼131, 69, and 19 ka, which coincide with ice retreat at the terminations of MIS 6, 4, and 2. Singer et al. (2008) interpreted this as evidence that unloading of ice during deglaciations allowed magma to ascend more easily through the crust at these times.
Construction of the Calbuco volcano since 100 ka was recently constrained by Mixon et al. (2021), who reported edifice growth rates of 0.43 km3/kyr for the period from ∼100 to 55 ka, 2.2 km3/kyr for the period from ∼30 to 7 ka, and 4.8 km3/kyr from 4 ka to present (Figure 3). The authors suggest that the lacuna between ∼55 and 30 ka may represent elevated glacial erosion or reduced magma supply during the last glacial period, whereas the increased Holocene eruption rate may reflect a delayed response of the magma system to ice unloading during the Last Termination. However, the contribution of sector collapse events at ∼18 and ∼9 ka to post-glacial modifications of the crustal magma system were not considered in this study, and the lack of a marked shift in erupted compositions during the Holocene make it difficult to assess whether ice unloading impacted magma storage and eruption dynamics at Calbuco.
A multi-volcano study from Grosse et al. (2018) presents data for El Cóndor, Falso Azufre, and Incahuasi volcanoes in the southern Central Volcanic Zone of Chile that borders with Argentina. These volcanoes are predominantly older than 250 ka, and the resolution of age and precision of age data in the 250–0 ka period is low (e.g., El Cóndor K/Ar ages of 128 ± 46 ka, 90 ± 30 ka, 36 ± 24 ka, and 23 ± 50 ka) which makes it challenging to compare eruptive outputs to deglaciation events. For these reasons the data are not shown in Figure 3.
New Zealand
Ruapehu and Tongariro are active andesite-dacite volcanoes of the Taupō Volcanic Zone, New Zealand, with inception ages of ∼230 a and ∼350 ka, respectively (Leonard et al., 2021). The edifices are predominantly composed of andesitic lava flows and breccias, and display clear evidence of late Pleistocene lava-ice interaction and glacial erosion, although only small glaciers remain on Ruapehu’s upper flanks today and none remain on Tongariro (Eaves and Brook, 2020). The recent integration of the eruptive and glacial histories for these volcanoes has led to edifice growth models of ‘edifice growth adjacent to glaciers’ (Conway et al., 2016; Pure et al., 2020) that deviate from the past ones of ‘volcano growth spurts separated by erosion during quiescence’ (Hobden et al., 1999; Gamble et al., 2003).
Glaciation of the Tongariro edifice during MIS 8 and 6 is indicated by ridge-forming lava and till on the southern and eastern flanks (Pure et al., 2020), whereas evidence for MIS 6 glaciation of the early Ruapehu edifice exists as hyaloclastite (subglacial) breccias that underlie ∼180 ka lavas and ∼160 ka lavas on the northern and southern flanks, respectively (Gamble et al., 2003; Conway et al., 2016; Cole et al., 2020). Widespread till, u-shaped valleys bounded by moraines, striated lava flows, sub-glacial tephra deposits, and ice-impounded lavas indicate that summit ice caps and flank glaciers persisted on both edifices throughout MIS 4–2, with significant advances at ∼60 ka and ∼20 ka (Figure 4; Conway et al., 2015; Conway et al., 2016; Eaves et al., 2016; Cole et al., 2018; Pure et al., 2020).
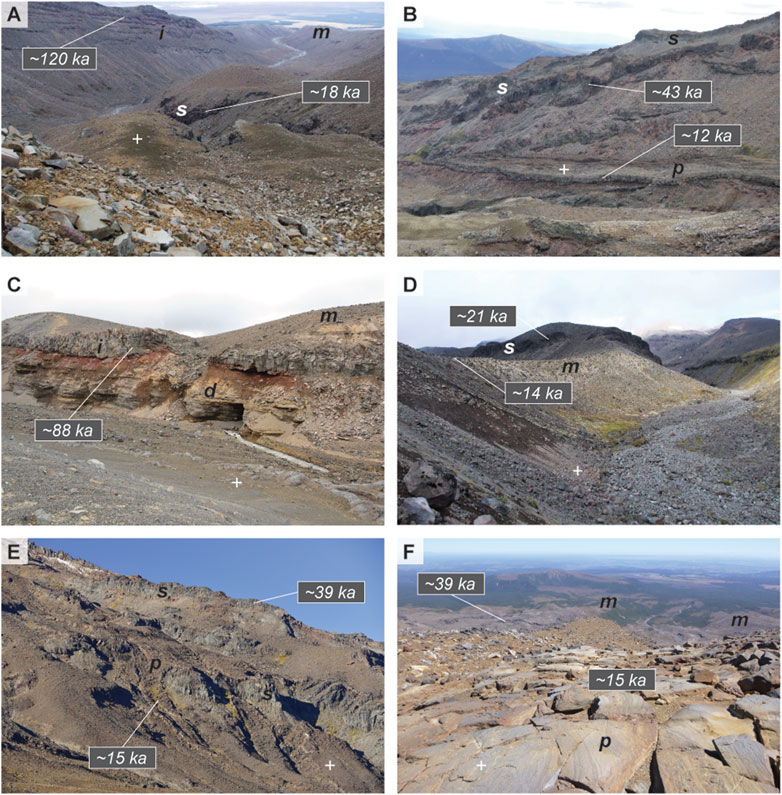
FIGURE 4. Examples of glaciovolcanic landforms at Ruapehu, New Zealand. Lava age constraints are from Gamble et al. (2003) and Conway et al. (2016); moraine age constraint in (D) is from Eaves et al. (2019). Key labelled features are: interglacial lava (i); syn-glacial lava (s); post-glacial lava (p); debris flow deposits (d); moraine (m). Location markers for photos (+) are given in degree decimals for each panel. (A) View towards the southeast down the Wahianoa valley, with MIS 5 interglacial stage lavas exposed on the top left and LGM moraines visible at top right. A lobe of syn-glacial lava was emplaced in a glacial cavity prior to post-LGM glacial retreat (−39.301, 175.590). (B) View to the northwest of ice-bounded syn-glacial lavas and post-glacial valley-filling lavas in the Mangatururu valley (−39.282, 175.534). (C) Outcrop of a MIS 5 interglacial stage lava flow with underlying baked debris flow deposits and overlying moraine in the lower Whangaehu valley (−39.287, 175.630). (D) View towards the northeast of syn-glacial lava that was bounded by an LGM glacier, which later retreated to form ∼14 ka moraines in the Mangaehuehu valley (−39.317, 175.538). (E) View to the south of the northwest flank of Ruapehu volcano. Ice-bounded lavas outcrop as grey bluffs in the centre of the photo and along the skyline ridge, with thinner red-brown post-glacial lavas that flowed around them after glaciers had retreated (−39.259, 175.533). (F) View towards the northwest with moraines bordering the Whakapapaiti valley in the mid-ground and glacially striated post-glacial lavas on the upper flank (−39.263, 175.549).
Both volcanoes show near-continuous growth histories since ∼200 ka, however, there are no dated lavas at Ruapehu with ages between ∼80 and 50 ka, which coincides with the New Zealand peak glacial advance (66–61 ka: Williams et al., 2015). The wide compositional variation during MIS 3 and a steady edifice growth rate since 50 ka (Conway et al., 2016; Conway et al., 2018) indicate that Ruapehu’s magma system was likely not impacted by glacial loading and unloading. At Tongariro, significantly lower edifice growth rates during glacial periods relative to interglacial periods (Figure 3) and the lack of corresponding changes in lava chemistry indicates that deglaciation did not result in pulses of eased ascent of stored magmas (Pure et al., 2020). The reduced preservation of lavas during MIS 6 and 4–2 at Tongariro may be partly attributed to the ‘flushing’ of lavas onto the ring plain following their eruption onto ice. This lost material may be contained within the substantial volcaniclastic sequences that surround the edifice. The preservation of lavas erupted during MIS 3 and 2 at Ruapehu may have been due to the availability of emergent ridges where ice-bounded lava flows were emplaced (Conway et al., 2016). At Ruapehu, collapse events may have been assisted by de-buttressing of steep, fractured, and altered upper flanks during periods of ice retreat (Tost and Cronin, 2015), including the collapse that led to the emplacement of the ∼10.5 ka Murimotu Formation debris flow deposits on the north-western flank (Palmer and Neall, 1989).
The long-term evaluation of time-volume and time-composition trends at Tongariro was interpreted to show that edifice-building rates during glacial periods were only ∼20% of growth rates during periods of lower ice coverage (Pure et al., 2020; Figure 3). Tongariro’s post-230 ka lifespan therefore comprises subequal time in periods of reduced and heightened ice coverage, which equates to a long-term edifice growth rate that is ∼60% of interglacial growth rates. By difference, up to ∼40% of erupted material has been transported to the ring plain by “flushing”. In terms of volumes, the amount of erupted material that was emplaced onto ice masses and flushed to the ring plain was therefore ∼36 km3, relative to the ∼60 km3 ring plain total, but noting that the ring plain contains materials up to ∼1 Ma (Cameron et al., 2010). The remaining ∼24 km3 may represent airfall deposits and/or pre-230 ka volcaniclastic materials.
Time-composition trends for arc volcanoes affected by Pleistocene glaciations
To supplement the assessment of variable edifice growth rates provided above, we briefly review time-composition trends (where the data are available) in the context of climatic changes for the 33 volcanoes in this section. Volcanoes showing similar patterns are grouped and discussed together below. Whole-rock SiO2 contents for dated volcanic products from five representative circum-Pacific arc volcanoes are presented in Figure 5, in order to compare magma chemistry evolution trends with the climate record.
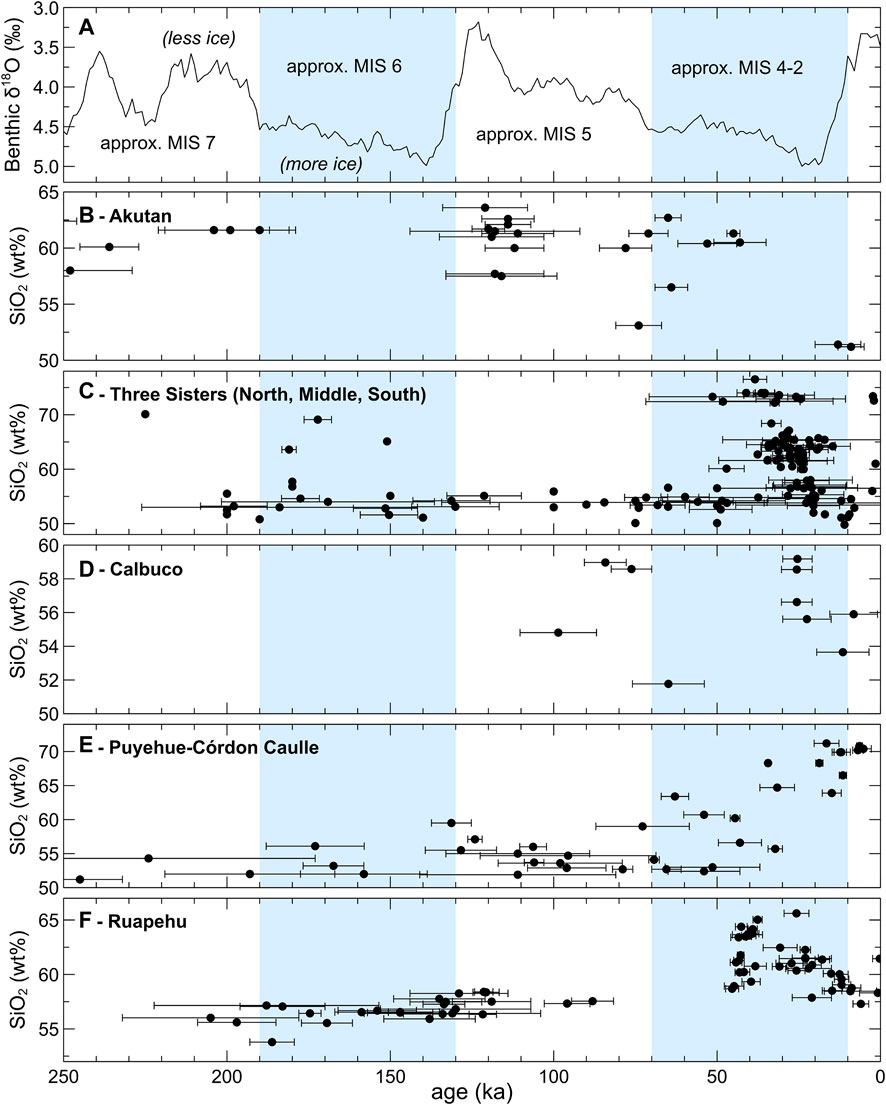
FIGURE 5. Summary of benthic δ18O climate proxy data (A) (Lisiecki and Raymo, 2005) and whole-rock SiO2 contents for dated samples from the following volcanoes: (B) Akutan, Aleutians (Coombs and Jicha, 2020); (C) the Three Sisters (North, Middle and South), Cascades (Calvert et al., 2018)—note that some samples lack age errors; (D) Calbuco, Chile (Mixon et al., 2021); (E) Puyehue-Córdon Caulle, Chile (Singer et al., 2008); (F) Ruapehu, New Zealand (Gamble et al., 2003; Conway et al., 2016; Conway et al., 2018). Compositional diversity is generally greatest in MIS 4–2 (all volcanoes shown), but similar diversity also occurs in MIS 6 (Three Sisters) and MIS 5 (Akutan and Calbuco).
Time-varied pressurization of magmatic systems caused by glacial advance and retreat may be connected to contemporaneous changes in erupted magma compositions (Figure 1). During glacial periods, it is hypothesized that the impedance of magma ascent leads to extended crustal residence, thus resulting in crystal fractionation and assimilation that would increase the SiO2 content of magma batches (Edwards et al., 2002; Wilson and Russell, 2020). Conversely, erupted magmas are expected to be relatively mafic following deglaciation because denser magmas may ascend more easily following depressurization of the crust (Pinel and Jaupart, 2000), although there are examples of mafic magmas that are more buoyant than coexisting felsic magmas (e.g., Eichelberger, 1980). Demonstrating causal connections between ice loading and the compositions of erupted magmas would require strong (and perhaps reproducible) correlations between eruptive compositions and climatic changes.
The time-composition trends in Figure 5 show some patterns that coincided with climatic changes. However, it appears that the range of compositional diversity, rather than shifts to more silicic compositions (or vice versa), are more strongly correlated with climatic changes. Moreover, although the volcanoes in Figure 5 generally display the greatest compositional diversity in MIS 4–2 (e.g., Ruapehu), similar diversity also occurs in MIS 6 (North Sister, Middle Sister and South Sister) and MIS 5 (Akutan and Calbuco). Determining why the amount of compositional diversity at some arc volcanoes is correlated with climatic changes is beyond the scope of this study.
More broadly, there is no reported or evident relationship between glacial loading and erupted magma compositions at the following volcanoes: Mazama, Middle Sister, South Sister, Mount Adams, Mount Baker and Black Buttes volcano, Akutan, the Tanaga cluster, Ruapehu, Tongariro, Paniri, Calbuco, or at Puyehue-Cordón Caulle (references in respective order of listed volcanoes: Bacon and Lanphere, 2006; Calvert et al., 2018; Fiertsein et al., 2011; Hildreth and Lanphere, 1994; Hildreth et al., 2003b; Coombs and Jicha, 2020; Jicha et al., 2012; Conway et al., 2016; Conway et al., 2018; Pure et al., 2020; Godoy et al., 2018; Mixon et al., 2021; Singer et al., 2008). These volcanic systems have age ranges from >500 ka to the Holocene, and most cover multiple glacial-interglacial cycles (Table 1). Furthermore, no correlations between eruptive rates and compositions are observed at Mount Baker and Black Buttes volcano, Mount Rainier, or at Tongariro (Hildreth et al., 2003b; Lanphere and Sisson, 2003; Pure et al., 2020).
Elsewhere, a lack of correlation between eruptive compositions and ages precludes a connection between eruptive compositions and ice-loading, such as at Tatara-San Pedro, Mount St. Helens, Seguam, the Kaguyak domes, and Antuco-Sierra Velluda (Dungan et al., 2001; Jicha and Singer, 2006; Clynne et al., 2008; Fierstein and Hildreth, 2008; Martínez et al., 2018). At Seguam, SiO2 concentrations in lavas and pyroclastic materials are also uncorrelated with the inferred amount of ice coverage on the edifice through time (Jicha and Singer, 2006).
For some of the volcanoes considered in this review, neither erupted volumes nor eruptive compositions are discussed in the context of ice loading or climatic changes through time, even if the data exist, such as at Aucanquilcha (Klemetti and Grunder, 2007), Katmai (Hildreth and Fierstein, 2012), three Chilean-Argentinian volcanoes (Grosse et al., 2018), and six Ecuadorian Andes volcanoes (Bablon et al., 2020). For some volcanoes, such as Tungurahua, Antisana, and the Pichincha complex, magmas became more silicic with time, but no clear changes can be linked to glacial cycles (Robin et al., 2010; Hall et al., 2017; Bablon et al., 2020). At Iliniza, the reverse is observed where magmas became less silicic and more magnesian with time, but changes are also not discussed in relation to changing ice coverage (Santamaría et al., 2022). In other cases, correlations between eruptive rate and compositions occur but they are not causally connected with time-varied ice coverage. An example is North Sister, where apparent eruptive rates decline between ∼300 and ∼100 ka by ∼30% which coincides with a decrease in Ni and MgO concentrations in eruptives and was interpreted to show olivine-dominated fractionation as the magmatic system waned (Schmidt and Grunder, 2009).
For some of the systems the time-composition data is not reported or discussed. Such is the case for El Misti, the Katmai cluster, Chimborazo, Ampato-Sabancaya, and Popocatépetl (Thouret et al., 2001; Hildreth et al., 2003a; Samaniego et al., 2012; Samaniego et al., 2016; Gisbert et al., 2021). At other volcanoes where time-volume-composition data are available, the resolution of geochronological ages is too low to examine magma composition-deglaciation feedbacks, such as for Fisher volcano in the Aleutians (Stelling et al., 2005).
At some volcanoes, sector collapses have been correlated with changes in erupted magma compositions (e.g., Parinacota: Hora et al., 2007), which represent a similar yet more rapid change in lithostatic load on the magmatic system than typically occurs via glacial retreat. Despite this, none of the 33 volcanoes and volcanic systems (and two multi-volcano studies: Grosse et al., 2018; Bablon et al., 2020) examined above show any reproducible correlations between the compositions of erupted materials and ice coverage.
Discussion
In this section we introduce and explain four major caveats that were identified in the review. The discussion is intended to aid interpretation of published results, and to help direct future studies of the causal relationships between deglaciation and volcanism. The outcomes and benefits of addressing these limitations, which currently hamper the reconstructions of complex volcanic histories, are summarized at the end of the discussion section.
Biased preservation and exposure of eruptive products
An important consideration when interpreting time-volume data (e.g., Figure 3) is as follows: do smaller volumes of preserved eruptives in glacial periods indicate reduced eruption rates (i.e., evidence of absence), or do they reflect erosion and/or lack of preservation of syn-glacial eruptives (i.e., absence of evidence)? The degree to which eruptive records at a given volcano are affected and modified by erosion, incomplete preservation, and magma system depressurization depend on specific local and regional contexts. For this reason, it is essential to determine what the estimated volumes of preserved material at a given volcano actually represent when interpreting time-volume data. In many cases, erosion and a lack of preservation can lead to confusing and inaccurate pictures of edifice growth rates because estimated volumes may differ from the original eruptive volumes (Singer et al., 1997; Edwards et al., 2015).
Figure 6 shows three scenarios of ice coverage at a volcano and the associated styles of edifice growth. In these examples, the surviving edifice structure ultimately depends on the interplay between edifice growth, erosion, and the supra-glacial emplacement of eruptives. Subglacial eruptions (Figure 6A) may produce lapilli tuffs, hyaloclastites, and pillow lavas that construct tuyas and asymmetric landforms, which may be associated with outbursts from subglacial lakes known as “jökulhlaups” (e.g., Lachowycz et al., 2015; Cole et al., 2018; Russell et al., 2021). Whether such materials get preserved depends on whether eruptions were explosive or effusive, whether eruptions discharged into subglacial water bodies, the geometries and post-eruptive landforms, the subsequent action of erosion, and whether jökulhlaup events transported syn-eruptive material off the edifice (Smellie, 2021). Alternatively, when volcanoes support ice-caps and flank glaciers (Figure 6B), eruptions may build ridges along the sides of glaciers, as indicated by lava-ice interaction features (see dark orange and green units in Figure 6B), and erupted materials may be emplaced onto glaciers and then flushed off the edifice as debris when glaciers melt (e.g., Lescinsky and Sisson, 1998). Concurrently, glaciers may erode valley floor material where the abrasive force is the greatest (see green units in Figure 6C) whilst also removing subequal or lesser volumes of valley wall material (e.g., Singer et al., 1997; Pure et al., 2020). Subsequent edifice growth in an ice-free environment (Figure 6C) is commonly associated with young lavas flowing into ice-free valley floors and with the construction of “perfect” cone vents (Figures 4B, E, 6C; see also Hobden et al., 1999).
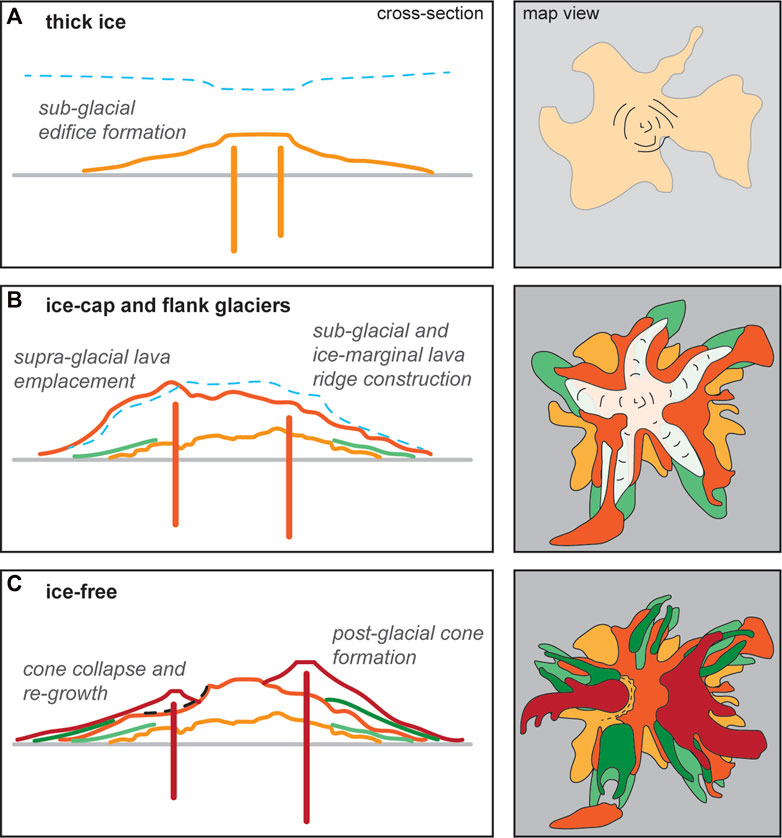
FIGURE 6. Evolution of a volcano that grew with changing ice cover over time (dashed blue line). Cross sections on the left correspond to map views on the right. (A) Tuya-like landform develops under a continental ice sheet. (B) The edifice continues to grow with reduced ice coverage beneath an ice-cap and around valley glaciers (dark orange and green units) that overlie older glacially eroded lavas [light orange units, as in panel (A)]. Irregular and asymmetric landforms in summit areas are constructed subglacially, as shown in the cross section. Flank areas also grow where erupted materials are deposits around glaciers and onto existing flank bedrock (light green and dark orange units). Supra-glacial lavas are only preserved where they are emplaced on bedrock, which results in distal flow areas from being disconnected from high summit areas [compare the bottom-left dark orange unit between panels (B, C)]. (C) Ice-free growth (dark red units) construct ‘perfect’ cone vents that erupt young lavas and pyroclastic deposits into vacant valleys, as also shown in field photos (Figures 4B, E). Irregular summit landforms constructed in the presence of ice may undergo collapse [black dashed line in panel (C)] and be replaced by new cones [compare dark orange unit profiles in the cross sections of panels (B, C)]. Glacial erosion of older units may excavate valley-floor units and widen valleys [compare light and dark green units between panels (B, C)].
Additionally, contrasting methods for estimating volumes can make it difficult to compare time-volume datasets from different studies. In cases where high-resolution time-volume datasets exist, the sum total of estimated lava flow volumes (based on observable surficial distributions and thicknesses) may be much smaller than the total volume between the volcano’s surface and its pre-volcanic datum, because significant volumes of buried material may have poorly constrained age and provenance (e.g., Godoy et al., 2018; Pure et al., 2020). Such obstacles are variably acknowledged in the studies considered by this assessment, and we expand on these ideas below.
Volume estimation methods
A range of methods have been used to estimate the volumes of volcanoes and individual eruptive units. For whole edifices these methods include finding the area between a pre-volcanic datum and a digital elevation model of the volcano’s surface (often with a GIS program: e.g., Samaniego et al., 2016), and using a 3-dimensional shape to approximate the geometry of the edifice (e.g., Godoy et al., 2018). For individual eruptive units, volume estimation methods include taking field thicknesses and multiplying by the areal distribution of lava flows that are either observable, or buried and inferred (e.g., Mazama, Cascades: Bacon and Lanphere, 2006; Three Sisters, Cascades; Fiertsein et al., 2011; Calvert et al., 2018; Tongariro, New Zealand; Pure et al., 2020). Methods for individual eruptive units also include subdividing sectors of a volcano using 3-dimensional shape approximations to estimate volume, based on where each major eruptive sequence occurs (e.g., Parinacota, Chile: Hora et al., 2007; Ruapehu, New Zealand; Conway et al., 2016).
Reconstructed volumes of eroded material
To accurately reconstruct the long-term shifts in eruptive rates at a Pleistocene-age volcano, the volumes of lost materials need to be estimated. In undertaking this exercise, the most common approaches are (1) to assume that each eruptive vent had a perfect cone geometry (Thouret et al., 2001) and/or (2) to assume that valleys were previously filled with erupted deposits and were subsequently eroded (Singer et al., 1997). However, sometimes the surviving edifice volume is simply assumed to represent the total amount of erupted material, even where glacial unconformities are reported (e.g., Samaniego et al., 2012; Samaniego et al., 2016), which may be inaccurate at volcanoes that have experienced glacial advances and sector collapses.
Approaches (1) and (2) noted above are justified for vents and flanks that grew in ice-free environments (e.g., Figure 6C). In such cases, the existence of laterally excavated sequences of planar lava flows (e.g., Figure 4A; green units in Figure 6C) and valley-bounding moraines (e.g., see “m” in Figures 4A, C, D, F) may be used to infer distinct periods of edifice growth and erosion. In applying the ice-free growth model, some studies have estimated the amount of denudation by glaciers within valleys to infer eroded volumes (e.g., Mixon et al., 2021). Using this framework, the estimated volume of eroded material at Paniri (Chile) is 4.4 km3, relative to 79.9 km3 of surviving edifice material (Godoy et al., 2018). Elsewhere, estimates of the down-cutting rates from glacial erosion have been estimated by assuming that lava ridges perched above glaciers are remnants surviving after glacial erosion on surrounding pre-existing lava. Using this approach, Hildreth et al. (2003b) inferred down-cutting rates of 0.4–1.75 m/kyr at Mount Baker. However, lava ridges may also be primary (constructional) landforms rather than secondary (erosional) landforms because many glaciated volcanoes demonstrably grew in the presence of ice (e.g., Conway et al., 2016). Furthermore, although valleys at most volcanoes were occupied by glaciers, in many cases it is difficult to differentiate whether such valleys were built around ice or were eroded by ice, or both (e.g., Singer et al., 1997; Singer et al., 2008).
Eruptive products with high preservation potential
The estimated volumes of Holocene lava flows and consolidated pyroclastic deposits are relatively likely to represent the actual amount of erupted magma because, in most cases, there has been minimal opportunity for erosion to occur via glaciation or through sector collapse events. Evidence for this includes lavas and pyroclastic deposits that have intact carapaces and no glacial striations, and are fully traceable to their source vents, as illustrated by the dark red units in Figure 6C (e.g., the Ngāuruhoe cone of Tongariro, New Zealand: Hobden et al., 1999). In the example shown in Figure 6, the volcano may have had a steady eruptive rate over 200 kyr, but the volume of syn-glacial eruptive products may be under-represented compared with post-glacial products, due to the more complete preservation of the latter.
Eruptive products with low preservation potential
Tephras and unconsolidated pyroclastic deposits are much less likely to be preserved on a volcano’s edifice over its long-term record than lavas and some pyroclastic deposits. A study of tephra record completeness in ice-free regions suggests that <1% of products from eruptions with a volcanic explosivity index of ≥2 have been preserved in post-LGM stratigraphic records, although the total volume of preserved, erupted material may be >1% (Watt et al., 2013). Unconsolidated pyroclastic deposits that are not capped by lavas are rare in the edifice records of most glaciated volcanoes (e.g., Hackett and Houghton, 1989). Typically, explosive eruption deposits on volcanoes comprise the minority of preserved edifice material (e.g., p. 732 of Hildreth et al., 2003b; p. 364 of Fierstein and Hildreth, 2008; p. 405 of Martínez et al., 2018). Collectively, these observations show that edifice records on volcanoes are biased towards preserving lavas and pyroclastic deposits capped by lavas, relative to tephras and uncapped pyroclastic deposits.
Although explosive eruptions can represent a significant proportion of a given volcano’s eruptive output, the pre-LGM record is usually poor and only preserves the largest-volume events (Kiyosugi et al., 2015). In regions affected by continental glaciation, the ring plain tephra record is often obliterated by glacial erosion (e.g., Hildreth, 1996). Accurate reconstructions of past eruptive rates at glaciated volcanoes may only be possible if ring plain records, which comprise lavas and pyroclastic debris (eroded via fluvial or glacial action), tephras, and sector collapse deposits, can be correlated with specific source volcanoes based on radiometric dating, compositional affinity, drainage patterns and detailed stratigraphic mapping (e.g., Tost and Cronin, 2015). Such exercises are extremely resource- and time-intensive and are also undermined by long run-outs of some sector collapse debris flows that can travel hundreds of kilometres from their source volcano (Vallance and Scott, 1997; Waythomas and Wallace, 2002; Tost and Cronin, 2015).
There are also other biases that appear to affect the preservation of erupted materials in the edifice record. The most notable is when eruptives are emplaced onto ice masses but never make contact with bedrock, which prevents them from being preserved because they are flushed away as debris during deglaciation. This has been inferred from eruptive records (e.g., Jicha and Singer, 2006; Conway et al., 2016; Pure et al., 2020) and observed for modern eruptions (e.g., Edwards et al., 2015; Loewen et al., 2021).
The summary in Table 2 shows that of 33 studies, 20 considered lava-ice interaction and 10 of these studies considered or reported evidence of supra-glacial emplacement of erupted materials. Notably, the only studies that considered supra-glacial emplacement were those that also reported evidence or likelihood of lava-ice interaction (Table 2: Akutan, Katmai, Middle Sister, Baker, Rainier, St. Helens, Ruapehu, and Tongariro volcanoes). No studies of Andean volcanoes from Ecuador, Peru, Argentina or Chile considered supra-glacial emplacement of erupted materials, even though the ages of these volcanoes and extents of ice coverage would have made supra-glacial emplacement of eruptives highly likely (Table 2). Lava flows that were emplaced in ice-free valleys during past interglacial periods may also have low preservation and/or exposure potential, because they can be eroded in subsequent glacial advances and buried by younger till and volcanic deposits (e.g., Conway et al., 2016; Figure 4C).
Post-glacial sector collapses of asymmetric landforms that grew in the presence of ice have been reported widely in both northern and southern hemispheres. Capra (2006) identified over 20 post-LGM sector collapse events from Argentina, Bolivia, Chile, Ecuador, Mexico, New Zealand, and the United States, which is not a comprehensive list (cf. Osceola Mudflow at Rainier, Cascades: Vallance and Scott, 1997; Murimotu Formation at Ruapehu, New Zealand; Palmer and Neall, 1989). Such sector collapse events remove edifice material of a variety of ages depending on which materials were part of the collapsed landform. The existence of hydrothermally altered material in sector collapse deposits, which may form in subglacial environments via interactions with meltwater, show that subglacial materials are commonly removed from the edifice in collapse events (e.g., Vallance and Scott, 1997; Waythomas and Wallace, 2002). Subglacial and syn-glacial eruptives are thus likely to have low preservation potential because of their propensity to be fragmented, altered, buried, collapsed, and eroded. The ability to accurately reconstruct eruptive rates in materials that pre-date sector collapse events may be hampered by mass wasting that removes significant volumes of older material from the edifice, which could therefore lead to underestimates of pre-collapse (i.e., syn-glacial) eruptive rates.
Summary
Estimates of erupted volumes are a major source of uncertainty in studies that seek to address the question: does deglaciation cause increased eruptive rates? There is then a marked contrast between studies that interpret variations in time-volume trends as arising from erosion and eruptive quiescence (e.g., Singer et al., 1997; Singer et al., 2008) and other studies that infer a preservation bias whereby erupted materials were flushed off the edifice to the ring plain (e.g., Pure et al., 2020). In many cases, field records provide strong evidence that 1) glacial and fluvial erosion occurs, 2) greater volumes of erupted materials are preserved in periods of reduced ice coverage because of a preservation bias, 3) volcanoes erupt both explosively and effusively, and 4) Pleistocene-age volcanoes contain significant volumes of unobservable buried material. On the contrary, field records struggle to accurately show 1) how much erosion has occurred because assumptions about pre-erosional geometry cannot be verified, 2) what volume of material that was erupted syn-glacially has been flushed to the ring plain because clast provenance can be difficult to establish and continental glaciation can obliterate ring plain records, 3) how much volume has been erupted effusively versus explosively because different lithologies have different likelihoods of being preserved, and 4) the ages and provenance of completely buried edifice materials.
Limitations of geochronological precision
Testing whether causal relationships exist between deglaciation and eruption rates requires chronological data that clearly distinguishes between cause and effect. At arc volcanoes, eruptive records must therefore have sufficient precision and accuracy to make comparisons between the timing of eruptions and fluctuations of ice extent. Geochronological data that constrain fluctuations in ice coverage and eruptive rates should ideally be independent, accurate, and precise. The accuracy and precision of such geochronological data is essential to determining whether the depressurization of arc magmatic systems via ice retreat has led to enhanced eruption rates immediately or by delayed mechanisms. Herein, the methods for determining the timing of ice retreat and volcanic events are examined to assess the strength of evidence that may or may not support causal links between deglaciation and increased eruption rates.
Timing of deglaciation
In Figure 3, volcanic growth histories are compared against the stacked benthic δ18O curve from Lisiecki and Raymo (2005), which largely reflects global ice volume, to assess whether eruption rates at arc volcanoes have been influenced by climate change. Within the reviewed papers, the distinctions between reduced and advanced terrestrial ice cover have generally been taken as those that define each Marine Isotope Stage (MIS). These are sometimes integrated with regional paleoclimate information to confirm the timings of glacial advance and retreat, however, few detailed glacier reconstructions exist for arc volcanoes (cf. Eaves et al., 2016; Eaves et al., 2019). When testing whether sea-level changes have affected volcanism (e.g., Wallmann et al., 1988), it can be assumed that rates of lithostatic (un)loading are constant at the scale of an individual volcano or region. On the other hand, ice advance or retreat can occur at different rates within separate valleys of the same volcano due to local morphological and climatological effects (Eaves et al., 2019). The following discussion focusses on the general timing of ice retreat during the Last Termination for the purpose of comparing that timeframe to the precision of eruption age measurements for lava flows, because links between long-term eruptive rates and small-scale glacier mass fluctuations are not well-studied.
The rapid rise in sea-level from 18 to 11.7 ka reflects the wholesale melting of ice sheets and glaciers during the Last Glacial Termination (Denton et al., 2010), which is supported by the stacked record of benthic foraminiferal δ18O compositions (Lisiecki and Raymo, 2005). For the sea-level record, the average 2σ error on corrected coral ages calculated from published U and Th isotope ratio data over that period is ±0.7 ka (Thompson and Goldstein, 2006). On land, moraine records at or near the volcanoes assessed in this review reflect a period of approximately 10 kyr for the retreat of glaciers from LGM to near-historical extents. Davies et al. (2020) summarized that the Patagonian Ice Sheet in South America started to retreat from greatest extent at ∼28 ka and then stabilised at 21–18 ka. Subsequently, the ice sheet underwent rapid deglaciation and separated into disconnected ice masses by 15 ka, followed by readvances or stabilisations of glaciers at 14–13 ka and 11 ka. These conclusions are supported by 10Be exposure ages from moraines near Lago Palena on the border of Chile and Argentina (43.9° S; 71.5° W), which have 2σ errors on mean moraine ages of 0.8–1.4 ka (Sotores et al., 2022). This level of precision is similar to that (2σ values of 0.4–1.8 ka) reported for 3He exposure dating of LGM and late-glacial moraines at Tongariro and Ruapehu volcanoes in New Zealand reported by Eaves et al. (2016), Eaves et al. (2019).
Timing of volcanism
The 40Ar/39Ar and K-Ar geochronometers have been applied extensively to define the eruptive histories of Quaternary volcanoes worldwide, and they are vital tools for constraining ages for late Pleistocene arc volcanic rocks. One or both of the dating methods have been used for each of the studies that are covered in this review. They are best suited to dating the microcrystalline (non-glassy) groundmass material of lava flows (Gamble et al., 2003; Fleck et al., 2014; Calvert et al., 2018; Sisson et al., 2019). In particular, lavas that were emplaced subaerially next to glaciers provide ideal products for dating because they pond into thick flows with slowly cooled interiors that produce coarsely crystalline groundmass textures (groundmass microlites >20 μm; Conway et al., 2016). In contrast, subglacial volcanism can produce glassy (and hydrothermally altered) volcanic products that are difficult to date using these methods (Flude et al., 2010; Guillou et al., 2010). Eruptive activity during interglacial stages at volcanoes may form rubbly, blocky, or thin lava flows over steep flanks or within ice-free valleys that are also characterized by glassy groundmass textures (Pure et al., 2020). Low radiogenic 40Ar yields and high atmospheric 40Ar in low-K and/or young (<20 ka) lavas also presents a major challenge for defining the recent eruption histories at arc volcanoes (Jicha, 2009).
The precision of geochronological data in studies assessed in this review is compared with the duration of the Last Termination in Figure 7. Out of 44 ages between 30 and 10 ka, five have 2σ values of 6%–9% relative to the age (i.e., 2σ values of 1.1–2.2 ka). A further ten age measurements have 2σ values of >9–20% relative to the preferred age. Sixteen lavas have 2σ values between 21% and 42% relative to the preferred age, and the remaining thirteen have 2σ values of 52%–93%. An age of 17.8 ± 2.2 ka reported by Conway et al. (2016) indicates, with 95% confidence, that the lava erupted between 20.0 and 15.6 ka. Despite being a relatively precise age, this ± 2σ range spans the period from full glacial conditions to major ice retreat at Ruapehu volcano. The 17.8 ± 2.2 ka age is however distinct from a re-advance at ∼14–11 ka corresponding to the Antarctic Cold Reversal (Eaves et al., 2019). At Calbuco, an age of 11.5 ± 8.0 ka reported by Mixon et al. (2021) spans the period from LGM extent of the Patagonian Ice Sheet at 19.5 ka, through rapid retreat at 17 ka, to re-advances of glaciers at 14–13 ka, 11 ka, and 6–5 ka (Moreno et al., 2015). Combined with field observations, these age constraints are suitable for broadly identifying syn-versus post-glacial eruptive stages, but cannot be directly compared with climatic events on sub-kyr-scales (Figure 7). As such, it is difficult with currently available analytical precision to test the sensitivity of the volcanic response to deglaciation. For example, it would be valuable to know whether eruptions are initiated during large-scale glacier retreat, when a threshold of 70% of ice was lost, or 3 kyr after near-modern glacier extents were reached. Similarly, more precise age data may allow testing of whether minor stabilizations or re-advances of glaciers paused or slowed any potential increases in eruptive rates after the LGM. This has significant implications for understanding whether future glacial retreat under current warming will lead to increased rates of volcanism, and our ability to provide meaningful forecasts for such volcanic activity.
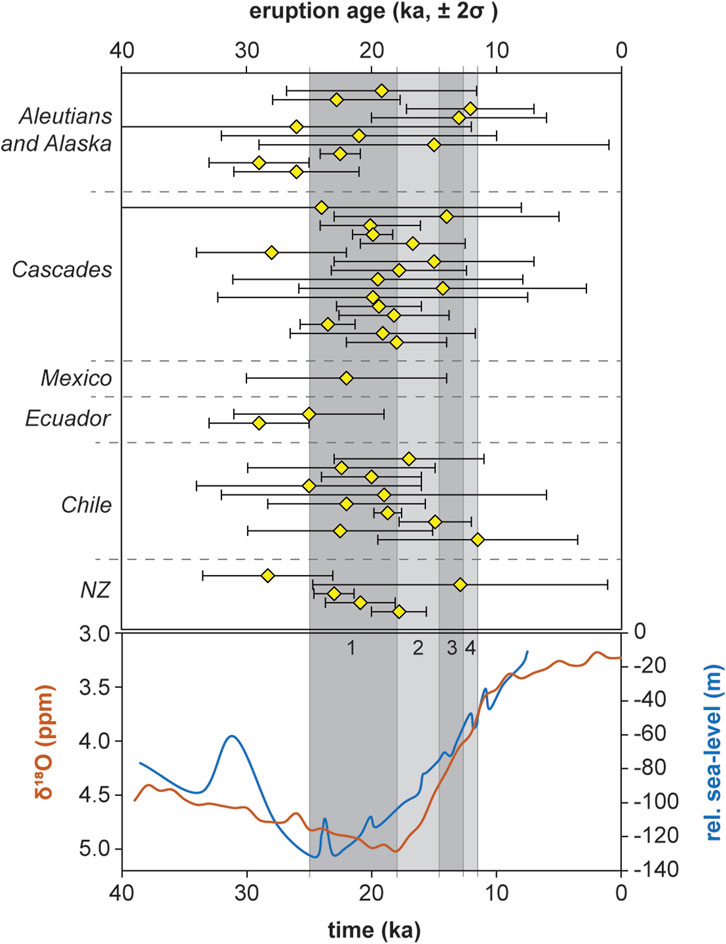
FIGURE 7. Comparison of the precision of radiometric dating constraints for lava eruption ages and the timing of the Last Glacial Termination. 40Ar/39Ar and K-Ar data for lavas with preferred ages between 30 and 10 ka were compiled from the reviewed papers (see Table 2). Error bars are 2σ. The stacked benthic δ18O curve of Lisiecki and Raymo (2005) is plotted in orange, and the reconstructed relative sea-level of Thompson and Goldstein (2006) is plotted in blue in the lower panel. Periods within the Last Termination are labelled with numbers: (1) Last Glacial Maximum; (2) Heinrich Stadial 1; (3) Antarctic Cold Reversal; (4) Younger Dryas.
Calibrated 14C ages for organic material underlying, overlying, or included in layers of volcanic material can provide precise geochronological constraints. Analytical uncertainties of ±100 years (2σ) are regularly reported (e.g., Bromley et al., 2019), which are significantly smaller than uncertainties on typical 40Ar/39Ar and K-Ar age determinations, as summarised above. Radiocarbon dating has been successfully used to establish high-resolution eruptive records from post-glacial tephras in studies that investigate potential causality between deglaciation and apparent eruption rates (Watt et al., 2013; Rawson et al., 2016). Radiocarbon dating is not always feasible, however, particularly for eruptives with ages >50 ka and on the upper flanks of volcanoes in middle to high latitudes that have little organic material interbedded or overlain by lavas and pyroclastic units.
Summary
Neither eruptive episodes nor deglaciation are instantaneous events, and establishing causality between them has been, and will continue to be, a challenging endeavour. The limits of analytical precision with the K-Ar and 40Ar/39Ar geochronometers provide age estimates within 1–2 kyr ranges for medium-to high-K andesite lavas of Late Glacial age, but often 10 kyr or more for low-K lavas. Such uncertainties hinder meaningful assessments of whether variations in eruption rates were caused by deglaciation, and prevent the identification and measurement of time gaps (i.e., “lag times”; Figure 1C) that may occur between deglaciation and episodes of heightened eruptive activity.
Reproducibility of trends over multiple climate cycles
Post-LGM increases in edifice growth rates at arc volcanoes are a commonly reported feature that has been interpreted in some cases as evidence that deglaciation causes increased eruptive rates (e.g., Singer et al., 2008; see also Parinacota and Antuco-Sierra Velluda in Figure 3). Such a finding may indicate that magma systems at numerous volcanoes were primed for a response to unloading during the Last Termination and, therefore, may have experienced a similar evolution during previous transitions from cold to warm climate stages. Alternatively, the finding may indicate that biases in eruption records have affected numerous volcanoes similarly. Whereas some tephra records only permit investigation of post-LGM volcanic activity (e.g., Praetorius et al., 2016), sampling of Pleistocene volcanic edifices allows longer eruption records to be constructed that may permit investigation of eruption rate changes during older glacial/interglacial transitions. The observation of increased eruptive rates following deglaciation over multiple glacial-interglacial cycles at any given volcano would strengthen support for causality between ice unloading and eruption rates. Notwithstanding the challenges created by volcanic record incompleteness, and the uncertainty about whether edifice growth rates accurately reflect eruptive rates, the following discussion considers whether post-glacial increases in apparent eruptive rates at glaciated arc volcanoes are reproducible.
Reproducibility of edifice growth responses to deglaciation
Of the 20 volcanoes shown in Figure 3, 12 show post-LGM (∼20 ka) increases in edifice growth rates (Tables 2, 3). However, only 7 of these 12 volcanoes show increased edifice growth rates after the MIS 6 deglaciation (∼130 ka), which was the most substantial deglaciation event in the ∼150 kyr preceding the LGM (Singer et al., 2000; Kaplan et al., 2004). Furthermore, of the 7 volcanoes that show post-glacial increases in edifice growth rates after MIS 6 and the LGM, 3 volcanoes show relative increases in edifice growth rates in the MIS 4–2 period as well, which is when ice coverage was generally increasing into the MIS 2 glaciation. Thus only 4 of 20 volcanoes examined (Mazama, Puyehue-Cordón Caulle, Antuco-Sierra Velluda, and Tongariro) show repeated increases in apparent eruptive rates following the MIS 6 glaciation and the LGM without contradictory increased growth rates in the MIS 4–2 period (Bacon and Lanphere, 2006; Singer et al., 2008; Martínez et al., 2018; Pure et al., 2020).
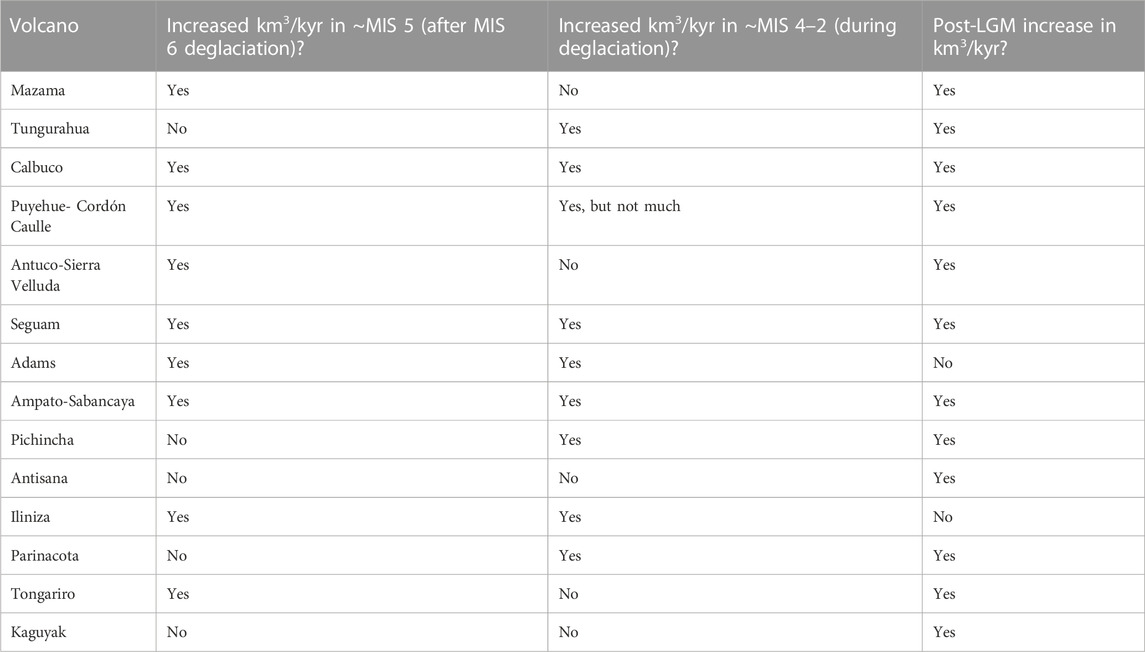
TABLE 3. Summary of changes in edifice growth rates relative to preceding periods as in Figure 3.
At Mazama, the increased eruptive rate in the Holocene is largely due to a large caldera-forming eruption that ejected ∼50 km3 of magma (Bacon and Lanphere, 2006; Figure 3). Eruptions of this size from Quaternary arc volcanoes are rare in the Cascade arc, with only three caldera-forming eruptions having occurred since 1.15 Ma (Hildreth, 2007). On correlations alone, it appears unlikely that the timing of the caldera-forming Crater Lake eruption at Mazama was triggered by deglaciation, noting also that the Kulshan caldera-forming eruption at 1.15 Ma was subglacial (Hildreth, 1996). In comparison, other Quaternary arcs that experienced similar amounts of ice-loading during Pleistocene glaciations have hosted more caldera-forming eruptions than the Cascade arc, such as eight or more in central Chile and >20 in the Alaska-Aleutian arc (Miller and Smith, 1987; Newhall and Dzurisin, 1988).
In the study of Puyehue-Cordón Caulle, the authors interpreted post-glacial increases in edifice growth rates to be the consequence of ice unloading of the crust, which promoted greater melt ascent from the deep crust than in pre-glacial and glacial periods (Singer et al., 2008). However, time versus compositional data from erupted lavas do not provide convincing support for this conclusion because neither edifice growth rates nor δ18O climate proxy data are correlated with changes in the compositions of erupted lavas. The authors also acknowledge the influence of sector collapses and glacial erosion in modifying the amount of preserved edifice material at Puyehue-Cordón Caulle, which questions whether volcanic records are sufficiently representative of Pleistocene and Holocene eruptive rates.
Eruptive records from Antuco-Sierra Velluda have been interpreted to show potential increases in eruptive rates since ∼150 ka, or after the MIS 6 glaciation, with a small decrease in edifice growth rates during 60–17 ka (∼MIS 3–2), which the authors consider may be due to less severe glaciation during MIS 4 than in MIS 6 (Martínez et al., 2018; Figure 3). The growth rates since ∼150 ka, however, are relatively uniform, and the variations in edifice growth rates since ∼150 ka may be due to supra-glacial emplacement of eruptives in MIS 4–2.
At Tongariro, time-volume patterns were interpreted to arise from a preservation bias whereby lavas and pyroclastic deposits were more commonly emplaced onto ice during glacial periods that were subsequently transported to the ring plain as debris upon deglaciation (Pure et al., 2020). Systematic fluctuations in MgO concentrations through time, however, are uncorrelated with climatic cycles. Thus, the correlations between ice coverage and edifice growth rates at Tongariro are unlikely to accurately represent variable eruptive rates that were modulated by ice loading and unloading of the crust. Taken together, the time-volume-composition data from Mazama, Puyehue-Cordón Caulle, Antuco-Sierra Velluda, and Tongariro provide limited support for the idea that deglaciation causes increased eruptive rates at arc volcanoes.
A number of studies have examined potential volcanic responses to deglaciation over multiple glacial-interglacial cycles (e.g., Singer et al., 1997; Edwards et al., 2002; Hildreth et al., 2003b; Lanphere and Sisson, 2003; Bacon and Lanphere, 2006; Jicha and Singer, 2006; Singer et al., 2008; Schmidt and Grunder, 2009; Jicha et al., 2012; Calvert et al., 2014; Conway et al., 2016; Calvert, 2019; Coombs and Jicha, 2020; Pure et al., 2020; Santamaría et al., 2022) whereas other studies only considered or have data for edifice growth rates during and after the last glacial period (e.g., Fiertsein et al., 2011; Calvert et al., 2018). Of the studies that solely consider the MIS 3–1 interval, some show maximum edifice growth rates during the glacial period when ice coverage was greatest (e.g., Middle Sister: Calvert et al., 2018) whereas others show maximum apparent eruptive rates after the LGM (e.g., Calbuco, Chile: Mixon et al., 2021), as in Figure 3. For the former examples with relatively high eruption rates during MIS 3–2, the ages and distributions of ice-affected volcanic products can provide valuable information about the past extents of glaciers on their edifices. Although moraines record outer ice limits during advances, ice-bounded lavas that erupted independently of ice dynamics can provide unique constraints on the presence and thickness of glaciers throughout stages of prior glacial advance and retreat (e.g., Lescinsky and Fink, 2000; Edwards et al., 2002; Conway et al., 2015). Such data from glaciovolcanic deposits can be used to constrain paleoclimate models.
Several studies that examined multiple glacial-interglacial cycles have concluded that the clustering of radiometric ages into interglacial periods does not equate to increases in eruptive rates because time-volume trends do not show post-glacial increases in edifice growth rates (e.g., Hildreth et al., 2003b). Such observations contrast with approaches elsewhere that use the statistical distribution of radiometric ages as a proxy for edifice growth rates in the absence of detailed time-volume data (Calvert et al., 2014; Calvert, 2019). In these cases, although the number of age determinations in interglacial periods is often higher than in glacial periods, as at Mount Rainier, this correlation is not supported by time-volume records from edifice-forming lavas and pyroclastic deposits, because the apparent correlation is an artifact of non-deposition and non-preservation during the periods of abundant ice coverage (Calvert et al., 2014; Sisson and Calvert, 2023).
Progressively increasing edifice growth rates
Preservation and erosion act to reduce the volume of older edifice material, relative to younger edifice material. A potential consequence of this is that reconstructed time-volume data may show ever-increasing edifice growth rates through time. Examples of this pattern are Baker, Adams, and Parinacota (Figure 3), which have upward-facing curves with broadly increasing km3/kyr rates through time (Hildreth and Lanphere, 1994; Hildreth et al., 2003b; Hora et al., 2007). If arguments are made that apparent eruptive rates increase after the LGM because of deglaciation and magma system depressurization, then the same test should be applied to earlier periods of the volcano’s history. For Baker, Adams, and Parinacota, apparent eruptive rates increase during the last glacial period (i.e., ∼MIS 4–2) relative to MIS 5, which contradicts the conclusion that deglaciation is the cause of increased eruptive rates.
Interpretations from global tephra databases
Using a hybrid dataset of tephra records from 40 ka to present, Huybers and Langmuir (2009) reported that subaerial volcanism increased 2 to 6 times against background levels after the post-LGM deglaciation. The authors interpreted the feature to result from mantle decompression following deglaciation and then predicted that sea level rise would suppress eruption rates at mid-oceanic ridges. We note, however, that the tephra dataset reported Bryson et al. (2006), which was used for the analysis of Huybers and Langmuir (2009), acknowledges that terrestrial tephra records may be incomplete because of irregular preservation.
A comparable but more cautionary result was reported in a separate assessment of tephra records from the Andean southern volcanic zone, the Cascades, and Kamchatka by Watt et al. (2013). This study noted that inferred eruptive rates from the LGM to the late-Holocene varied by no more than a factor of two, and time-volume variations were not statistically significant. Watt et al. (2013) also reported that the extent of tephra record incompleteness in post-LGM records is substantial, and may be as little as 0.005% (1 in 20,000 events preserved), and that under-sampling of small (<0.1 km3) eruptions prevents meaningful quantification of LGM vs. post-LGM eruption rates. For these reasons and those outlined in the ‘Biased preservation and exposure of eruptive products’ section above, it is unclear whether tephra records in the Holocene are sufficiently complete or free of preservation bias to make interpretations about whether global volcanic activity levels increased after the LGM.
Summary
Out of 20 time-volume datasets from arc volcanoes affected by glaciation (Figure 3), 4 show reproducible increases in edifice growth rates after deglaciation events and 12 provide unclear evidence for enhanced post-glacial volcanic activity. Interpretations for why edifice growth rates increase after deglaciation events vary widely and do not always consider eroded or unpreserved materials. For these reasons, periods of heightened erosion or reduced preservation may be misinterpreted as eruptive hiatuses. Some edifice records show progressive increases in growth rates through time (e.g., Baker, Adams, and Parinacota in Figure 3), but it is difficult to determine whether such trends are real or if they are artefacts of erosion, mass-wasting events, and burial; each of these phenomena may disproportionately reduce the exposed volumes of older edifice materials relative to younger materials. Terrestrial tephra records are likely to be less useful than lavas for testing the reproducibility of potential volcanism-deglaciation feedbacks because pre-Holocene tephra records are highly incomplete (Watt et al., 2013). Even for the last glacial cycle alone, it is disputed whether tephra records provide credible evidence for increased post-glacial eruptive rates because volcanic records are incomplete and time-volume variations are statistically insignificant (e.g., Huybers and Langmuir, 2009; Watt et al., 2013; Rawson et al., 2016). The response of volcanoes to deglaciation is not expected to be uniform in time or space, considering the differences in ice volume for each glacial stage and each arc. The response is also likely to differ based on which stage of a volcano’s magma production history is intersected by any given deglaciation event. Therefore, although reproducible correlations between increased ice volumes and reduced eruption rates, across multiple glacial-interglacial cycles, would therefore support a causal relationship, the opposite is untrue. That is, increases in ice volume that are uncorrelated with changes in eruptive rate would not support a causal connection. Furthermore, if increased edifice growth rates in the Holocene are cited as evidence for deglaciation causing increased eruptive rates, then this same standard of evidence should apply to previous glacial-interglacial cycles. These points may be useful for (re)considering whether feedback mechanisms between climate and volcanism often or seldom impacted eruption rates throughout the past and whether many or few volcanoes will be “primed” to respond to future ice retreat.
Alternative explanations for eruption rate and magma evolution trends
As noted above, exploring the relationship between deglaciation and volcanism has been hindered by geological record incompleteness (preservation), and our ability to read it in detail (precision) over various temporal and spatial scales (reproducibility). In addition to these challenges, it is also pertinent to consider that trends in long-term eruption rates and magma compositions may be controlled by factors unrelated to surficial ice loading variations at arc volcanoes. Indeed, the traditional paradigm for arc volcanoes is that their life cycles are defined by episodic growth and destruction, and that erupted compositions can vary unsystematically through time (e.g., Hobden et al., 1996; Davidson and de Silva, 2000; Eichelberger et al., 2006; Yamamoto et al., 2018). As such, hypotheses that differ from the one outlined in Figure 1 should also be considered in studies that seek to test causality between deglaciation and volcanism. This section briefly summarizes the processes from the surface to the slab that control magma generation and eruption at arc volcanoes (Figure 8), in order to explore how the potential influence of ice coverage compares with independent petrogenetic processes in the mantle and crust within the context of driving time-volume-composition trends. Firstly, however, we provide some context on glaciostatic loads as a reference for pressure changes that could be associated with deglaciation at typical arc volcanoes, and potential consequences for changed eruptive rates.
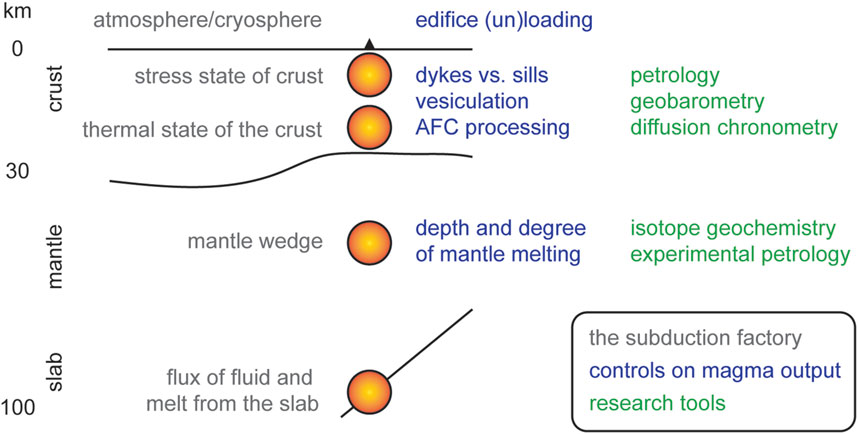
FIGURE 8. A summary of the components and characteristics of glaciated arc systems (grey text) that are influenced by processes controlling magma output (blue text), and some key research tools that can be used to determine how such processes operate (green text). The graphic presents a cross-section of a typical arc with depths and lithologies labelled in black text.
Pressurization of a magma system by surficial ice masses
Several studies have modelled crustal stress responses to deglaciation. Jellinek et al. (2004) estimated that a ∼1–3 MPa decrease in loading pressure during deglaciation of eastern California may have caused stalled magma to ascend, and earlier estimates for silicic magmas were higher (∼10–30 MPa decrease required for magma ascent: Jellinek and DePaolo, 2003). In the southern Chilean Andes at Mocho-Choshuenco, Rawson et al. (2016) estimated that loading pressure on crustal magmas at ∼16 km depth decreased by ∼6 MPa when continental glaciers melted following the LGM. Martínez et al. (2018) also inferred that a stress decrease of ∼3–5 MPa following deglaciation that resulted in a basaltic eruption at 17 ka after the LGM at Antuco-Sierra Velluda. Together, these estimates indicate that pressure changes of about <10 MPa are linked to apparent changes in eruptive rates in arc systems.
Estimates of glaciostatic loads on the magmatic system of a representative, glacierized, arc volcano are given in Table 4, based on the conditions for Tongariro volcano during MIS 4 (Eaves et al., 2016; Cole et al., 2018). For a 70 km3 volcano that is 20% covered by glaciers (200 m thick, in valleys) and 10% covered by a summit ice cap (200 m thick: e.g., Smellie and Skilling, 1994; Magnússon et al., 2012; Cole et al., 2018), the ice forms 7% of the mass load on the pre-volcanic datum, with the remainder coming from the volcano itself. The lithostatic load on a magmatic system, which includes the mass of a 2,000 m-high volcano, increases with its depth in the crust: 151 MPa at 5 km depth, 259 MPa at 10 km depth, and 475 MPa at 20 km depth. When an ice cap and glaciers of uniform thickness cover the volcano, the ice adds a further 1.0–9.8 MPa of pressure onto the magmatic system for ice thicknesses of 100–1,000 m, respectively. For magma systems at 5–20 km depth, this ice contributes 0.2%–5.7% of the total pressure on the magmatic system. The volcanic responses predicted by Jellinek et al. (2004) and Rawson et al. (2016), above, correspond to the pressure decreases that could be caused by removing ∼100–600 m of ice from a glaciated volcano. As a percentage, these changes in glaciostatic loading amount to <3% of the total pressure on a typical continental arc magmatic system (Table 4).
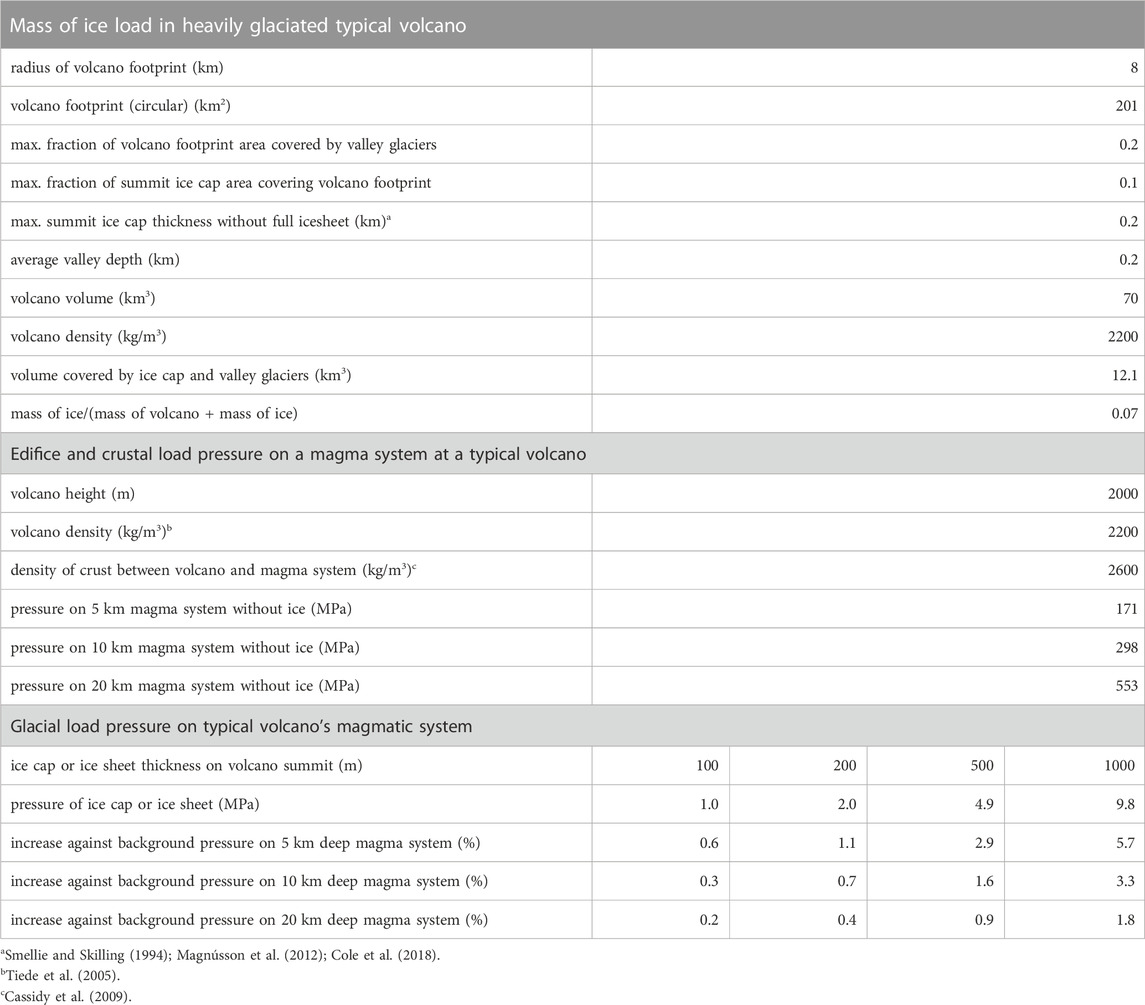
TABLE 4. Estimates of volume and the pressure applied by ice masses, a volcanic edifice, and the crust on a magmatic plumbing system at 5, 10, and 20 km below the pre-volcanic datum (surface of the crust).
Lithostatic loads and sector collapses
The hypothesis in Figure 1 states that deglaciation leads to increased eruption rates and that glaciation supresses eruption rates. However, testing causality between deglaciation and increased eruptive rates is challenging because major sector collapses can occur during or shortly after glacial retreat (Capra, 2006). It is therefore essential to determine the relative influence of glacial retreat versus sector collapse on magma systems when interpreting time-volume data for volcanoes because both phenomena cause magma system depressurization. The opposite situation, whereby rock mass is added to a volcano throughout its lifetime, should also be considered alongside glacial ablation when interpreting changes in apparent eruptive rates because these processes may have cancelling effects on magma system pressurization, especially in cases of rapid edifice growth (e.g., Pinel and Jaupart, 2000).
As noted previously (see ‘Biased preservation and exposure of eruptive products’ section), Capra (2006) surmised that numerous sector collapses at ice-capped volcanoes were induced by ice retreat, due to glacial de-buttressing, load discharge and fluid circulation as ice retreated. There are likely to be many more sector collapses associated with deglaciation than the 23 examples cited in that review, including the early and middle Holocene collapses of Ruapehu volcano (Palmer and Neall, 1989; Donoghue and Neall, 2001), and the Osceola Mudflow collapse event at Mount Rainier (Vallance and Scott, 1997). Such sector collapses removed rock (and remaining ice) masses from the summits and flanks of many volcanoes in catastrophic events. Sector collapse events are therefore relevant to interpreting time-volume-composition trends because collapse events remove in situ portions of the eruptive record (discussed in the “Biased preservation and exposure of eruptive products” section, above), and because collapse events immediately depressurize magma plumbing systems concurrently with gradual depressurization caused by deglaciation.
The response of magmatic systems to sector collapse events has been the topic of numerous studies, and the availability of high-resolution datasets for historical and pre-historical examples has inspired several detailed reviews (e.g., Watt, 2019; Romero et al., 2021). Watt (2019) noted that voluminous effusive eruptions of magma with anomalous compositions have often occurred following large sector collapses at arc volcanoes. Short-lived episodes of more frequent mafic eruptions support the idea that edifice unloading facilitates the ascent of dense, mafic magmas. This presents a challenge for interpreting time-composition-volume trends at deglaciated arc volcanoes: sector collapse events and deglaciation can both occur in the same several-millennia period, but both phenomena lead to magma system depressurization. If changes in time-composition-volume trends are related to magma depressurization, then it may be unclear if these trends were driven by sector collapse (over minutes) or deglaciation (over millennia). Whether magma system pressurization and associated changes in time-composition-volume trends were caused by deglaciation versus sector collapse will require high-resolution geochronological constraints that are supported by field evidence. Ultimately, however, if magma systems respond to sector collapse events that were triggered by ice retreat, then glaciation imparts a fundamental control on the evolution of eruptive activity at such volcanoes. This is pertinent for considering future hazards at glacierized edifices that will experience ice retreat in the future. Although magma systems may not directly respond to ice retreat linked to climate change, sector collapses and associated eruptive activity will pose significant threats in the future.
Crustal controls on the volumes and compositions of erupted magma
When interpreting time-volume-composition trends at glaciated arc volcanoes (Figure 3), it is pertinent to note that volcanic regions where glaciation has had no (or minor) impact also display variability in the rates of volcanism and geochemistry of erupted magma on time scales of 1–100 kyr. For example, thin glaciers may have been present only on a few volcanoes with summit elevations above 2,000 m a.s.l. during MIS 2 in Japan (Sawagaki et al., 2004), and thus deglaciation is not considered to have impacted their eruption rates. In a review of the volumetric and geochemical evolution of 29 arc volcanoes in Japan, Yamamoto et al. (2018) showed that renewed input of mafic magma and instances of crustal melting led to increased eruptive rates at several volcanoes. In contrast, volcanoes that displayed minor variability in erupted magma compositions were shown to be generally characterized by decreasing eruption rates.
None of the 33 volcanoes and volcanic systems covered by our review have exhibited any reproducible correlations between erupted magma composition and ice coverage. In keeping with this, several studies additional to those cited in Table 1 have further explained non-systematic trends for the time-sequenced compositions of erupted material at these volcanoes to be the result of complex open-system processes that operate in crustal magma storage regions (TDungan et al., 2001; Gamble et al., 2003; Mangler et al., 2021). There are very studies that have attributed changes in the composition of post-glacial eruptive products to depressurization via ice retreat. The most commonly cited of these is the case study of Rawson et al. (2016), who identified post-glacial stages of evacuation (eruption of andesite to rhyolite magma), relaxation (basaltic andesite to andesite) and recovery (basaltic andesite to dacite) in the period since 12 ka at Mocho-Choshuenco volcano in Chile. In contrast, Mangler et al. (2022) showed that the sizes, styles, and compositions of eruptions at Popocatépetl since 14 ka can be explained by magma recharge and mixing processes. Conway et al. (2018) showed that a distinct trend towards the eruption of more mafic lavas at Ruapehu commenced at ∼26 ka, prior to deglaciation, and thus was not caused by ice unloading of the magma system. The trend was surmised to reflect changes to the composition of assimilated crustal melts in the plumbing system. The eruption of high-Mg basaltic andesites at ∼45–40 ka at Ruapehu also contradicts the idea of suppressing denser magmas during glacial stages (Conway et al., 2020).
The long-term flux of magma from the mantle to the surface affects the thermal and chemical evolution of the crust that hosts magma systems beneath volcanoes in both non-glaciated and glaciated arcs (Sisson et al., 2013). It is well-documented that this internal evolution (as opposed to the external, surficial evolution of varied ice/edifice load over time) impacts the timescales of magma residence, volumes of magma reservoirs, extents of crystal fractionation, and compositions of crustal assimilants (e.g., Bacon and Lanphere, 2006). It is therefore valid to test alternative hypotheses to the one shown in Figure 1, such as those that explain the evolution of crustal magma systems in non-glaciated regions, when interpreting time-volume and time-composition trends at glaciated volcanoes.
Signals from the slab and mantle
Flare-ups of increased magma production at circum-Pacific arcs have occurred in 5–10 Myr-long pulses since 50 Ma, which has been linked to major tectonic plate reorganizations (Jicha et al., 2009). In addition to variations in the rate, composition, temperature and angle of subducting slabs (e.g., Gill, 1981), mantle processes can also influence the productivity of arc magma systems, even over periods of months to years (e.g., Ruprecht and Plank, 2013). Further examples of mantle and slab control on eruptive activity and magmatic production rates follow.
In young lavas from the Alaska-Aleutian arc, George et al. (2003) reported positive correlations between convergence rate, volcano volume, and 238U excesses that were interpreted to show that the volume of magma produced depends on the size of the fluid flux supplied to the wedge <10 kyr prior to eruption. Evidence presented by Taniuchi et al. (2020) further supports this conclusion by showing that a ∼7 kyr-period of relatively high eruptive output at Rishiri volcano (northwestern Japan) was driven by the production of hydrous primary magmas via aqueous fluid-fluxed melting of mantle peridotite. Geospeedometry data have also provided evidence for fast migration of mantle-derived magmas to the surface. Ruprecht and Plank (2013) reported Ni diffusion time scales for olivine of weeks to months that indicate magma ascent rates of 55–80 m per day through the ∼35 km-thick crust beneath Irazú volcano in Costa Rica. Fe-Mg interdiffusion time scales for orthopyroxene phenocrysts in high-Mg andesite and dacite lavas from Ruapehu volcano indicate mantle-derived magmas hybridized with mid-crustal felsic magmas less than 10 days before voluminous lava eruptions during MIS 3 (Conway et al., 2020).
The eruption of high-Mg andesite at volcanoes in the northern Cascade arc also indicates slab and mantle processes have a fundamental control on short-term episodes of mafic volcanism with no apparent linkage to deglaciation (Sas et al., 2017). Wall et al. (2018) noted that the waxing and waning eruptive output of andesitic volcanoes in the Cascades over the Pleistocene reflects variability in the thermal energy delivered from the mantle at subduction zones, rather than cyclic surficial loading and unloading imposed by climate variability. Variability in magma compositions and eruptive rates along the Cascades volcanic arc was also shown by Till et al. (2019) to predominantly be related to variations in the flux of basalt into the crust.
These examples from arc volcanoes indicate that slab and mantle processes influence eruption rates and the compositions of erupted materials, and that such processes can cause variability on time scales comparable with global climate cycles. Such alternative phenomena should be considered when evaluating whether deglaciation has caused increased eruption rates or variations in erupted magma compositions, or whether such trends were fundamentally controlled by crustal and/or mantle and slab processes that have not been affected by lithostatic or glaciostatic loading changes.
Summary
A number of alternative explanations, beyond the deglaciation hypothesis in Figure 1, should be considered and tested before trends in an arc volcano’s time-volume-composition evolution are interpreted to result from ice loading and unloading. The timescales of magma production and transfer through the crust range from several millennia to several days, which shows that processes other than glaciation and deglaciation can alter eruption rates and magma compositions throughout the life cycles of arc volcanoes.
Future outlook
This discussion has outlined the issues that have so far hindered comprehensive testing of the hypothesis in Figure 1. New studies will have additional tools to overcome some of these challenges, but new challenges may also appear. We outline some of these below.
Large errors on erupted volume estimates will remain a major limitation for investigating volcano growth histories and magma generation processes in the context of glaciation, however, some ongoing technological developments may help. The application of LiDAR and drone-assisted photogrammetry in vegetated and remote areas will improve delineation of map units and calculation of more accurate volume data, as well as integration of edifice and ring plain records of volcano growth and collapse. Despite this, the age and provenance of older volcanic material that is completely buried under younger eruptives will remain difficult to establish in future geological mapping projects.
Improvements in the precision of the K-Ar and 40Ar/39Ar mass spectrometry will greatly assist investigations of potential causality between deglaciation and increased eruption rates, and will create new opportunities for dating Late Pleistocene and Holocene volcanic rocks with relatively low K2O contents. Improved sensitivity and wider dynamic range in Faraday cup detector amplifiers, such as for the Isotopx ATONA type, are particularly promising (Cox et al., 2020; Mixon et al., 2022). These developments that improve our ability to measure large sample sizes for rocks that have low yields of radiogenic 40Ar will make significant contributions to geochronological datasets, particularly for low-K2O and Holocene lavas. Moreover, such advances will benefit related fields in geoscience by providing precise age constraints for volcanic rocks that can be used to reconstruct glacier extents and geomagnetic field characteristics in the past (Ingham et al., 2017; Channell et al., 2020).
Investigations into the reproducibility of eruption trends over multiple glacial cycles and sensitivity of volcanic systems to different unloading scenarios will push forward attempts to carry out long-term forecasting of volcanic activity. Establishing long-term patterns in eruptive behaviour (whether influenced by climate or other factors) should be applicable to understanding and mitigating the risks of future eruptions. Interpretations of time-volume-compositional trends at arc volcanoes will be more accurate if mantle and crustal petrogenetic processes are considered alongside changes in lithostatic and/or glaciostatic loading. Integration between data and models will also lead to an improved understanding of magma genesis, storage, ascent, and eruption at arc volcanoes. Such detailed, multi-disciplinary case studies of target volcanoes are underway and will make significant contributions to our comprehension of arc volcanic systems (Singer et al., 2021).
New focus on the impact of climate change on active volcanoes could bring more urgency to understanding future warming and mitigating volcanic hazards. Volcanic eruptions and sector collapse events have immediate and devastating local to regional consequences relative to other global-scale climate change phenomena (e.g., rising sea level). Future volcanic activity and landslides may be increasingly viewed through the lens of modern-day climate change. To positively affect public and media responses to these potential hazards, a comprehensive understanding of the links between volcanism and the cryosphere should be targeted (Edwards et al., 2022).
Conclusion
The depressurization of a typical arc magmatic system, associated with deglaciation, is approximately 3% but may be up to ∼10% depending on the depth of the magma system and the thickness of ice coverage. Noting this, of the 33 arc volcanoes and volcanic systems examined in this review, only 4 show increased edifice growth rates following the MIS 6 glaciation and the LGM, which are Mount Mazama, Puyehue-Cordón Caulle, Antuco-Sierra Velluda, and Tongariro (Bacon and Lanphere, 2006; Singer et al., 2008; Martínez et al., 2018; Pure et al., 2020). Across these four studies, there is limited agreement on why fluctuations in edifice growth rates and ice coverage are correlated. Phenomena that were proposed to explain correlated edifice growth rates and ice coverage in these four studies are: a post-glacial, ∼50 km3 caldera-forming eruption (Mazama); erosion and sector collapses that resulted in volcanic record incompleteness (Puyehue-Cordón Caulle); reduced preservation in periods of increased ice coverage when eruptives were emplaced supra-glacially onto ice and then ‘flushed’ to the ring plain (Tongariro); and crustal depressurization from deglaciation, although without any correlation between erupted compositions and climatic cycles (Puyehue-Cordón Caulle, Mazama, and Antuco-Sierra Velluda). Notably, none of the 33 volcanoes or systems show reproducible correlations between eruptive compositions and climatic cycles (or with apparent eruptive rates).
Although comparisons between edifice growth rates, eruptive compositions, and climatic cycles have been made here and in the 33 studies in Table 1, it is doubtful that edifice growth rates accurately represent actual eruptive rates for the following reasons.
(1) The total volume of erupted material at an arc volcano may be difficult to estimate because of significant volcanic record incompleteness. Lavas are much more likely to be preserved on the edifice because they are less prone to erosion (Hildreth et al., 2003b; Fierstein and Hildreth, 2008; Martínez et al., 2018), and pyroclastic deposits are generally preserved on the edifice only when they form large volumes (e.g., Bacon and Lanphere, 2006), are post-glacial (e.g., the Ngāuruhoe cone of Tongariro: Hobden et al., 1999; Pure et al., 2020), or are capped by lavas (Hackett and Houghton, 1989). On the ring plain, tephra deposits may be poorly preserved (Watt et al., 2013) or obliterated by continental glaciation (Hildreth, 1996).
(2) Significant proportions of a volcanic edifice are buried by surficial geology, and the buried proportion may be as high as ∼80% of the total edifice volume (e.g., Tongariro, New Zealand: Pure et al., 2020). The unknown age, stratigraphy, and provenance of buried material limits the ability to interpret time-volume trends at arc volcanoes, whether in glaciated or non-glaciated settings.
(3) The volumes of materials that have been eroded from Pleistocene-Holocene age volcanoes via sector collapses, fluvial action, and glaciation are difficult to estimate accurately. Estimates vary widely (5%–50%: Hildreth et al., 2003b; Godoy et al., 2018) and are rarely constrained by volume estimates in drainage systems (e.g., Pure et al., 2020).
(4) Sector collapses are more likely to occur following deglaciation, potentially because unstable, glaciovolcanic landforms can collapse when they are no longer supported by ice masses (Vallance and Scott, 1997; Capra, 2006; Conway et al., 2016). Subsequent edifice growth therefore biases the preserved record to show greater volumes of post-glacial eruptives relative to lesser amounts of old and glacial-age materials that are removed from the edifice during collapse.
(5) Materials that are erupted during periods of high ice coverage, which are emplaced onto ice masses supra-glacially, will be ‘flushed’ to the ring plain as debris during deglaciation (Hildreth and Fierstein, 2012; Coombs and Jicha, 2020; Pure et al., 2020). This biases the edifice record to show lower edifice growth rates during glacial periods, even though there may be no decrease in actual eruptive rates.
Studies that cannot address the five considerations above, to show that edifice growth rates are representative of actual eruptive rates, may lack the evidence needed to make robust interpretations about deglaciation causing increased eruptive rates or affecting other magmatic processes. Noting this, studies that aim to test whether deglaciation causes increased eruptive rates (or that deglaciation controls the compositions of post-glacial eruptives) should satisfy two other requirements, as follows.
(1) Radiometric age data that establishes the timings of eruptions relative to climatic changes must be sufficiently precise to demonstrate sequencing outside of analytical uncertainty. For lavas erupted in the Last Glacial cycle, the 2σ uncertainties of K-Ar and 40Ar/39Ar age determinations (Figure 7) are often ∼1–10 kyr larger than 2σ age uncertainties in records of ice extent and sea level that are constrained with 14C ages (2σ of typically ±100 years: Bromley et al., 2019) and U-Th disequilibria coral ages (2σ of typically ±0.7 kyr: Thompson and Goldstein, 2006). Notably, 3He and other cosmogenic nuclide systems applied to boulders in Pleistocene-Holocene moraines often have similar analytical uncertainties to those of 40Ar/39Ar age determinations on similar-aged lavas (cf., Eaves et al., 2016; Pure et al., 2020).
(2) Alternative processes that can control eruptive rates should be considered when concluding that increased eruptive rates are (solely) caused by deglaciation and associated crustal depressurization. Fluctuations in time-volume trends at non-glaciated arc volcanoes (e.g., Yamamoto et al., 2018) show that eruptive rates can be controlled by processes other than crustal depressurization. Such processes, including tectonically controlled variations in crustal stress states, can influence eruptives rates at arc volcanoes in both glaciated and non-glaciated settings (e.g., Lanphere and Sisson, 2003; Allan et al., 2012).
Within the context of current anthropogenic climate change, interest in the response of volcanoes to deglaciation will continue to grow. Utilization of new mapping and geochronology tools, integration of geological data and models, comprehensive testing of multiple hypotheses, and clear communication of results, limitations, and interpretations will be primary objectives for future research in this field.
Author contributions
All authors listed have made a substantial, direct, and intellectual contribution to the work and approved it for publication.
Funding
CC and OI were supported by JSPS-RSNZ bilateral grant JPJSBP120211003.
Acknowledgments
The authors gratefully acknowledge valuable discussions with Andrew Calvert, Graham Leonard, Thomas Sisson, Dougal Townsend, James Vallance, and Colin Wilson. Thank you to John Smellie and the 3 reviewers for their detailed and helpful comments.
Conflict of interest
The authors declare that the research was conducted in the absence of any commercial or financial relationships that could be construed as a potential conflict of interest.
Publisher’s note
All claims expressed in this article are solely those of the authors and do not necessarily represent those of their affiliated organizations, or those of the publisher, the editors and the reviewers. Any product that may be evaluated in this article, or claim that may be made by its manufacturer, is not guaranteed or endorsed by the publisher.
Supplementary material
The Supplementary Material for this article can be found online at: https://www.frontiersin.org/articles/10.3389/feart.2023.1082342/full#supplementary-material
References
Allan, A. S. R., Wilson, C. J. N., Millet, M.-A., and Wysoczanski, R. J. (2012). The invisible hand: Tectonic triggering and modulation of a rhyolitic supereruption. Geology 40, 563–566. doi:10.1130/G32969.1
Aubry, T. J., Farquharson, J. I., Rowell, C. R., Watt, S. F. L., Pinel, V., Beckett, F., et al. (2022). Impact of climate change on volcanic processes: Current understanding and future challenges. Bull. Volcanol. 84 (58), 58. doi:10.1007/s00445-022-01562-8
Bablon, M., Quidelleur, X., Samaniego, P., Le Pennec, J.-L., Santamaría, S., Liorou, C., et al. (2020). Volcanic history reconstruction in northern Ecuador: Insights for eruptive and erosion rates on the whole Ecuadorian arc. Bull. Volcanol. 82 (11), 11. doi:10.1007/s00445-019-1346-1
Bacon, C. R., and Lanphere, M. A. (2006). Eruptive history and geochronology of MountMount Mazama and the Crater Lake region, Oregon. Geol. Soc. Amer. Bull. 118, 1331–1359. doi:10.1130/B25906.1
Bindeman, I. N., Leonov, V. L., Izbekov, P. E., Ponomareva, V. V., Watts, K. E., Shipley, N. K., et al. (2010). Large-volume silicic volcanism in Kamchatka: Ar–Ar and U–Pb ages, isotopic, and geochemical characteristics of major pre-holocene caldera-forming eruptions. J. Volcanol. Geotherm. Res. 189, 57–80. doi:10.1016/j.jvolgeores.2009.10.009
Bromley, G. R. M., Thouret, J.-C., Schimmelpfennig, I., Mariño, J., Valdivia, D., Rademaker, K., et al. (2019). In situ cosmogenic 3He and 36Cl and radiocarbon dating of volcanic deposits refine the Pleistocene and Holocene eruption chronology of SW Peru. Bull. Volcanol. 81 (64), 64. doi:10.1007/s00445-019-1325-6
Bryson, R. U., Bryson, R. A., and Ruter, A. (2006). A calibrated radiocarbon database of late Quaternary volcanic eruptions. eEarth Discuss. 1, 123–134. doi:10.5194/eed-1-123-2006
Calvert, A. T., Fierstein, J., and Hildreth, W. (2018). Eruptive history of middle sister, Oregon Cascades, USA–product of a late Pleistocene eruptive episode. Geosphere 14, 2118–2139. doi:10.1130/GES01638.1
Calvert, A. T. (2019). “Inception ages, growth spurts, and lifespans of Cascade Arc volcanoes,” in American geophysical union, fall meeting. abstract id. V43G-0170.
Calvert, A. T., Sisson, T. W., Bacon, C. R., and Ferguson, D. J. (2014). “Apparent eruptive response of Cascades and Alaska-Aleutian arc volcanoes to major deglaciations,” in American geophysical union, fall meeting. abstract id. V11B-4710.
Cameron, E., Gamble, J., Price, R., Smith, I., McIntosh, W., and Gardner, M. (2010). The petrology, geochronology and geochemistry of Hauhungatahi volcano, S.W. Taupo Volcanic Zone. J. Volcanol. Geotherm. Res. 190, 179–191. doi:10.1016/j.jvolgeores.2009.07.002
Capra, L. (2006). Abrupt climatic changes as triggering mechanisms of massive volcanic collapses. J. Volcanol. Geotherm. Res. 155, 329–333. doi:10.1016/j.jvolgeores.2006.04.009
Capra, L., Bernal, J. P., Carrasco-Núñez, G., and Roverato, M. (2013). Climatic fluctuations as a significant contributing factor for volcanic collapses. Evidence from Mexico during the Late Pleistocene. Glob. Planet. Change. 100, 194–203. doi:10.1016/j.gloplacha.2012.10.017
Cassidy, J., Ingham, M., Locke, C. A., and Bibby, H. (2009). Subsurface structure across the axis of the Tongariro volcanic centre, New Zealand. J. Volcanol. Geotherm. Res. 179, 233–240. doi:10.1016/j.jvolgeores.2008.11.017
Cassidy, M., Watt, S. F. L., Talling, P. J., Palmer, M. R., Edmonds, M., Jutzeler, M., et al. (2015). Rapid onset of mafic magmatism facilitated by volcanic edifice collapse. Geophys. Res. Lett. 42, 4778–4785. doi:10.1002/2015GL064519
Channell, J. E. T., Singer, B. S., and Jicha, B. R. (2020). Timing of Quaternary geomagnetic reversals and excursions in volcanic and sedimentary archives. Quat. Sci. Rev. 228, 106114. doi:10.1016/j.quascirev.2019.106114
Cisneros de León, A., Mittal, T., de Silva, S. L., Self, S., Schmitt, A. K., and Kutterolf, S. (2022). On synchronous supereruptions. Front. Earth Sci. 10 (827252). doi:10.3389/feart.2022.827252
Clynne, M. A., Calvert, A. T., Wolfe, E. W., Evarts, R. C., Fleck, R. J., and Lanphere, M. A. (2008). “The Pleistocene eruptive history of Mount St. Helens, Washington, from 300,000 to 12,800 years before present,” in A volcano rekindled; the renewed eruption of Mount St. Helens, 2004–2006. Editor D. R. Sherrod, 1750, 593–627. doi:10.3133/pp175028
Cole, R. P., White, J. D. L., Conway, C. E., Leonard, G. S., Townsend, D. B., and Pure, L. R. (2018). The glaciovolcanic evolution of an andesitic edifice, South Crater, Tongariro volcano, New Zealand. J. Volcanol. Geotherm. Res. 352, 55–77. doi:10.1016/j.jvolgeores.2017.12.003
Cole, R. P., White, J. D. L., Townsend, D. B., Leonard, G. S., and Conway, C. E. (2020). Glaciovolcanic emplacement of an intermediate hydroclastic breccia-lobe complex during the penultimate glacial period (190–130 ka), Ruapehu volcano, New Zealand. Geol. Soc. Amer. Bull. 132 (9–10), 1903–1913. doi:10.1130/B35297.1
Conway, C. E., Chamberlain, K. J., Harigane, Y., Morgan, D. J., and Wilson, C. J. N. (2020). Rapid assembly of high-Mg andesites and dacites by magma mixing at a continental arc stratovolcano. Geology 48, 1033–1037. doi:10.1130/G47614.1
Conway, C. E., Gamble, J. A., Wilson, C. J. N., Leonard, G. S., Townsend, D. B., and Calvert, A. T. (2018). New petrological, geochemical, and geochronological perspectives on andesite-dacite magma Genesis at Ruapehu volcano, New Zealand. Amer. Mineral. 103, 565–581. doi:10.2138/am-2018-6199
Conway, C. E., Leonard, G. S., Townsend, D. B., Calvert, A. T., Wilson, C. J. N., Gamble, J. A., et al. (2016). A high-resolution 40Ar/39Ar lava chronology and edifice construction history for Ruapehu volcano, New Zealand. J. Volcanol. Geotherm. Res. 327, 152–179. doi:10.1016/j.jvolgeores.2016.07.006
Conway, C. E., Townsend, D. B., Leonard, G. S., Wilson, C. J. N., Calvert, A. T., and Gamble, J. A. (2015). Lava-ice interaction on a large composite volcano: A case study from Ruapehu, New Zealand. Bull. Volcanol. 77 (21), 21. doi:10.1007/s00445-015-0906-2
Coombs, M. L., and Jicha, B. R. (2020). The eruptive history, magmatic evolution, and influence of glacial ice at long-lived Akutan volcano, eastern Aleutian Islands, Alaska, USA. Geol. Soc. Amer. Bull. 133, 963–991. doi:10.1130/B35667.1
Cox, S. E., Hemming, S. R., and Tootell, D. (2020). The Isotopx NGX and ATONA Faraday amplifiers. Geochronol 2, 231–243. doi:10.5194/gchron-2-231-2020
Dalton, A. S., Margold, M., Stokes, C. R., Tarasov, L., Dyke, A. S., Adams, R. S., et al. (2020). An updated radiocarbon-based ice margin chronology for the last deglaciation of the North American Ice Sheet Complex. Quat. Sci. Rev. 234 (106223), 106223. doi:10.1016/j.quascirev.2020.106223
Davidson, J., and de Silva, S. (2000). “Composite volcanoes,” in Encyclopedia of volcanoes. Editor H. Sigurdsson (London: Academic Press), 663–682.
Davies, B. J., Darvill, C. M., Lovell, H., Bendle, J. M., Dowdeswell, J. A., Fabel, D., et al. (2020). The evolution of the Patagonian Ice Sheet from 35 ka to the present day (PATICE). Earth-Sci. Rev. 204, 103152. doi:10.1016/j.earscirev.2020.103152
Delgado Granados, H., Julio Miranda, P., Huggel, C., Ortega del Valle, S., and Alatorre Ibargüengoitia, M. A. (2007). Chronicle of a death foretold: Extinction of the small-size tropical glaciers of Popocatépetl volcano (Mexico). Glob. Planet. Change. 56, 13–22. doi:10.1016/j.gloplacha.2006.07.010
Denton, G. H., Anderson, R. F., Toggweiller, J. R., Edwards, R. L., Schaeffer, J. M., and Putnam, A. E. (2010). The last glacial termination. Science 328, 1652–1656. doi:10.1126/science.1184119
Donoghue, S. L., and Neall, V. E. (2001). Late Quaternary constructional history of the southeastern Ruapehu ring plain, New Zealand. New zeal. J. Geol. geophys. 44, 439–466. doi:10.1080/00288306.2001.9514949
Dungan, M. A., Wulff, A., and Thompson, R. (2001). Eruptive stratigraphy of the tatara-san Pedro complex, 36degreesS, southern volcanic zone, Chilean Andes: Reconstruction method and implications for magma evolution at long-lived arc volcanic centers. J. Petrol. 42, 555–626. doi:10.1093/petrology/42.3.555
Eaves, S. R., and Brook, M. S. (2020). Glaciers and glaciation of north Island, New Zealand. New zeal. J. Geol. geophys. 64, 1–20. doi:10.1080/00288306.2020.1811354
Eaves, S. R., Mackintosh, A. N., Anderson, B. M., Doughty, A. M., Townsend, D. B., Conway, C. E., et al. (2016). The last glacial maximum in the central north Island, New Zealand: Palaeoclimate inferences from glacier modelling. Clim. Past. 12, 943–960. doi:10.5194/cp-12-943-2016
Eaves, S. R., Winckler, G., Mackintosh, A. N., Schaefer, J. M., Townsend, D. B., Doughty, A. M., et al. (2019). Late-glacial and Holocene glacier fluctuations in north Island, New Zealand. Quat. Sci. Rev. 223, 105914. doi:10.1016/j.quascirev.2019.105914
Edwards, B. R., Belousov, A., Belousova, M., and Melniko, D. (2015). Observations on lava, snowpack and their interactions during the 2012–13 Tolbachik eruption, Klyuchevskoy Group, Kamchatka, Russia. J. Volcanol. Geotherm. Res. 307, 107–119. doi:10.1016/j.jvolgeores.2015.08.010
Edwards, B. R., Kochtitzky, W., and Battersby, S. (2020). Global mapping of future glaciovolcanism. Glob. Planet. Change 195, 103356. doi:10.1016/j.gloplacha.2020.103356
Edwards, B. R., Russell, J. K., and Anderson, R. (2002). Subglacial, phonolitic volcanism at Hoodoo Mountain volcano, northern Canadian Cordillera. Bull. Volcanol. 64, 254–272. doi:10.1007/s00445-002-0202-9
Edwards, B. R., Russell, J. K., and Pollock, M. (2022). Cryospheric impacts on volcano-magmatic systems. Front. Earth Sci. 10 (871951). doi:10.3389/feart.2022.871951
Eichelberger, J. C. (1980). Vesiculation of mafic magma during replenishment of silicic magma reservoirs. Nature 288, 446–450. doi:10.1038/288446a0
Eichelberger, J. C., Izbekov, P. E., and Browne, B. L. (2006). Bulk chemical trends at arc volcanoes are not liquid lines of descent. Lithos 87, 135–154. doi:10.1016/j.lithos.2005.05.006
Fierstein, J., and Hildreth, W. (2008). Kaguyak dome field and its Holocene caldera, Alaska Peninsula. J. Volcanol. Geotherm. Res. 177, 340–366. doi:10.1016/j.jvolgeores.2008.05.016
Fiertsein, J., Hildreth, W., and Calvert, A. T. (2011). Eruptive history of South Sister, Oregon Cascades. J. Volcanol. Geotherm. Res. 207, 145–179. doi:10.1016/j.jvolgeores.2011.06.003
Fleck, R. J., Hagstrum, J. T., Calvert, A. T., Evarts, R. C., and Conrey, R. M. (2014). 40Ar/39Ar geochronology, paleomagnetism, and evolution of the Boring volcanic field, Oregon and Washington, USA. Geosphere 10, 1283–1314. doi:10.1130/GES00985.1
Flude, S., McGarvie, D. W., Burgess, R., and Tindle, A. G. (2010). Rhyolites at kerlingarfjöll, Iceland: The evolution and lifespan of silicic central volcanoes. Bull. Volcanol. 72, 523–538. doi:10.1007/s00445-010-0344-0
Gamble, J. A., Price, R. C., Smith, I. E. M., McIntosh, W. C., and Dunbar, N. W. (2003). 40Ar/39Ar geochronology of magmatic activity, magma flux and hazards at Ruapehu volcano, Taupo Volcanic Zone, New Zealand. J. Volcanol. Geotherm. Res. 120, 271–287. doi:10.1016/S0377-0273(02)00407-9
George, R., Turner, S., Hawkesworth, C., Morris, J., Nye, C., Ryan, J., et al. (2003). Melting processes and fluid and sediment transport rates along the Alaska-Aleutian arc from an integrated U-Th-Ra-Be isotope study. J. Geophys. Res. 108 (B5), 2252. doi:10.1029/2002JB001916
Gisbert, G., Delgado-Granados, H., Mangler, M., Prytulak, J., Espinasa-Pereña, R., and Petrone, C. M. (2021). Evolution of the Popocatépetl volcanic complex: Constraints on periodic edifice construction and destruction by sector collapse. J. Geol. Soc. Lond. 179 (3). doi:10.1144/jgs2021-022
Godoy, B., Lazcano, J., Rodríguez, I., Martínez, P., Parada, M. A., Le Roux, P., et al. (2018). Geological evolution of Paniri volcano, central Andes, northern Chile. J. South Amer. Earth Sci. 84, 184–200. doi:10.1016/j.jsames.2018.03.013
Grosse, P., Orihashi, Y., Guzmán, S. R., Sumino, H., and Nagao, K. (2018). Eruptive history of Incahuasi, Falso Azufre and El cóndor quaternary composite volcanoes, southern central Andes. Bull. Volcanol. 80 (44), 44. doi:10.1007/s00445-018-1221-5
Guillou, H., Scao, V., Nomade, S., van Vliet-Lanoë, B., Liorzou, C., and Guðmunsson, A. (2010). 40Ar/39Ar dating of the Thorsmork ignimbrite and Icelandic sub-glacial rhyolites. Quat. Sci. Rev. 209, 52–62. doi:10.1016/j.quascirev.2019.02.014
Hackett, W. J., and Houghton, B. F. (1989). A facies model for a quaternary andesitic composite volcano: Ruapehu, New Zealand. Bull. Volcanol. 51, 51–68. doi:10.1007/BF01086761
Hall, M. L., Mothes, P. A., Samaniego, P., Militzer, A., Beate, B., Ramón, P., et al. (2017). Antisana volcano: A representative andesitic volcano of the eastern cordillera of Ecuador: Petrography, chemistry, tephra and glacial stratigraphy. J. South Amer. Earth Sci. 73, 50–64. doi:10.1016/j.jsames.2016.11.005
Hildreth, W., and Fierstein, J. (2012). Eruptive history of Mount Katmai, Alaska. Geosphere 8, 1527–1567. doi:10.1130/GES00817.1
Hildreth, W., Fierstein, J., and Lanphere, M. A. (2003b). Eruptive history and geochronology of the Mount Baker volcanic field, Washington. Geol. Soc. Amer. Bull. 115, 729–764. doi:10.1130/0016-7606(2003)115<0729:EHAGOT>2.0.CO;2
Hildreth, W. (1996). Kulshan caldera: A quaternary subglacial caldera in the north Cascades, Washington. Geol. Soc. Amer. Bull. 108, 786–793. doi:10.1130/0016-7606(1996)108<0786:KCAQSC>2.3.CO;2
Hildreth, W., Lanphere, M. A., and Fierstein, J. (2003a). Geochronology and eruptive history of the Katmai volcanic cluster, Alaska Peninsula. Earth Planet. Sci. Lett. 214, 93–114. doi:10.1016/S0012-821X(03)00321-2
Hildreth, W., and Lanphere, M. A. (1994). Potassium-argon geochronology of a basalt-andesite-dacite arc system: The Mount Adams volcanic field, Cascade Range of southern Washington. Geol. Soc. Amer. Bull. 106, 1413–1429. doi:10.1130/0016-7606(1994)106<1413:PAGOAB>2.3.CO;2
Hildreth, W. (2007). Quaternary magmatism in the Cascades–geological perspectives. U. S. Geol. Surv. profess. Pap. 1744, 125.
Hobden, B. J., Houghton, B. F., Davidson, J. P., and Weaver, S. D. (1999). Small and short-lived magma batches at composite volcanoes: Time windows at Tongariro volcano, New Zealand. J. Geol. Soc. Lond. 156, 865–868. doi:10.1144/gsjgs.156.5.0865
Hobden, B. J., Houghton, B. F., Lanphere, M. A., and Nairn, I. A. (1996). Growth of the Tongariro volcanic complex: New evidence from K-Ar age determinations. New zeal. J. Geol. geophys. 39, 151–154. doi:10.1080/00288306.1996.9514701
Hora, J. M., Singer, B. S., and Wörner, G. (2007). Volcano evolution and eruptive flux on the thick crust of the andean central volcanic zone: 40Ar/39Ar constraints from volcán Parinacota, Chile. Geol. Soc. Amer. Bull. 119, 343–362. doi:10.1130/B25954.1
Huybers, P., and Langmuir, C. (2009). Feedback between deglaciation, volcanism, and atmospheric CO2. Earth Planet. Sci. Lett. 286, 479–491. doi:10.1016/j.epsl.2009.07.014
Ingham, E., Turner, G. M., Conway, C. E., Heslop, D., Roberts, A. P., Leonard, G. S., et al. (2017). Volcanic records of the Laschamp geomagnetic excursion from Mt Ruapehu, New Zealand. Earth Plan. Sci. Lett. 472, 131–141. doi:10.1016/j.epsl.2017.05.023
Jellinek, A. M., and DePaolo, D. J. (2003). A model for the origin of large silicic magma chambers: Precursors of caldera-forming eruptions. Bull. Volcanol. 65, 363–381. doi:10.1007/s00445-003-0277-y
Jellinek, A. M., Manga, M., and Saar, M. O. (2004). Did melting glaciers cause volcanic eruptions in eastern California? Probing the mechanics of dike formation. J. Geophys. Res. 109, B09206. doi:10.1029/2004JB002978
Jicha, B. R., Coombs, M. L., Calvert, A. T., and Singer, B. S. (2012). Geology and 40Ar/39Ar geochronology of the medium-to high-K Tanaga volcanic cluster, Western Aleutians. Geol. Soc. Amer. Bull. 124, 842–856. doi:10.1130/B30472.1
Jicha, B. R. (2009). Holocene volcanic activity at koniuji Island, Aleutians. J. Volcanol. Geotherm. Res. 185, 214–222. doi:10.1016/j.jvolgeores.2009.05.018
Jicha, B. R., Scholl, D. W., and Rea, D. K. (2009). Circum-Pacific arc flare-ups and global cooling near the Eocene-Oligocene boundary. Geology 37, 303–306. doi:10.1130/G25392A.1
Jicha, B. R., and Singer, B. S. (2006). Volcanic history and magmatic evolution of Seguam Island, aleutian Island arc, Alaska. Geol. Soc. Amer. Bull. 118, 805–822. doi:10.1130/B25861.1
Jull, M., and McKenzie, D. (1996). The effect of deglaciation on mantle melting beneath Iceland. J. Geophys. Res. 101, 21815–21828. doi:10.1029/96JB01308
Kaplan, M. R., Ackert, R. P., Singer, B. S., Douglass, D. C., and Kurz, M. D. (2004). Cosmogenic nuclide chronology of millennial-scale glacial advances during O-isotope stage 2 in Patagonia. Geol. Soc. Amer. Bull. 116, 308–321. doi:10.1130/B25178.1
Kaufman, D. S., Young, N. E., Briner, J. P., and Manley, W. F. (2011). Alaska palaeo-glacier atlas (version 2). Dev. Quat. Sci. 15, 427–445. doi:10.1016/B978-0-444-53447-7.00033-7
Kiyosugi, K., Connor, C., Sparks, R. S. J., Crosweller, H. S., Brown, S. K., Siebert, L., et al. (2015). How many explosive eruptions are missing from the geologic record? Analysis of the quaternary record of large magnitude explosive eruptions in Japan. J. App. Volcanol. 4, 17. doi:10.1186/s13617-015-0035-9
Klemetti, E. W., and Grunder, A. L. (2007). Volcanic evolution of volcán Aucanquilcha: A long-lived dacite volcano in the central Andes of northern Chile. Bull. Volcanol. 70, 633–650. doi:10.1007/s00445-007-0158-x
Kutterolf, S., Jegen, M., Mitrovica, J. X., Kwasnitschka, T., Freundt, A., and Huybers, P. J. (2013). A detection of Milankovitch frequencies in global volcanic activity. Geology 41, 227–230. doi:10.1130/G33419.1
Kutterolf, S., Schindelbeck, J. C., Jegen, M., Freundt, A., and Straub, S. M. (2019). Milankovitch frequencies in tephra records at volcanic arcs: The relation of kyr-scale cyclic variations in volcanism to global climate changes. Quat. Sci. Rev. 204, 1–16. doi:10.1016/j.quascirev.2018.11.004
Lachowycz, S. M., Pyle, D. M., Gilbert, J. S., Mather, T. A., Mee, K., Naranjo, J. A., et al. (2015). Glaciovolcanism at volcán sollipulli, southern Chile: Lithofacies analysis and interpretation. J. Volcanol. Geotherm. Res. 303, 59–78. doi:10.1016/j.jvolgeores.2015.06.021
Lanphere, M. A., and Sisson, T. W. (2003). Episodic Volcano growth at Mt. Rainier, Washington: A product of tectonic throttling? Geol. Soc. Am. 35 (6), 644.
Leonard, G. S., Cole, R. P., Christenson, B. W., Conway, C. E., Cronin, S. J., Gamble, J. A., et al. (2021). Ruapehu and Tongariro stratovolcanoes: A review of current understanding. New zeal. J. Geol. geophys. 64, 389–420. doi:10.1080/00288306.2021.1909080
Lescinsky, D. T., and Fink, J. H. (2000). Lava and ice interaction at stratovolcanoes: Use of characteristic features to determine past glacial extents and future volcanic hazards. J. Geophys. Res. Solid Earth 105, 23711–23726. doi:10.1029/2000JB900214
Lescinsky, D. T., and Sisson, T. W. (1998)., 26. Washington, 351–354. Ridge-forming, ice-bounded lava flows at Mount Rainier, WashingtonGeology. doi:10.1130/0091-7613(1998)026<0351:RFIBLF>2.3.CO;2
Lin, J., Svensson, A., Hvidberg, C. S., Lohmann, J., Kristiansen, S., Dahl-Jensen, D., et al. (2022). Magnitude, frequency and climate forcing of global volcanism during the last glacial period as seen in Greenland and Antarctic ice cores (60–9 ka). Clim. Past. 18, 485–506. doi:10.5194/cp-18-485-2022
Lisiecki, L. E., and Raymo, M. E. (2005). A Pliocene-Pleistocene stack of 57 globally distributed benthic δ18O records. Paleoceanog. Paleoclimatol. 20 (PA1003). doi:10.1029/2004PA001071
Loewen, M. W., Dietterich, H. R., Graham, N., and Izbekov, P. (2021). Evolution in eruptive style of the 2018 eruption of Veniaminof volcano, Alaska, reflected in groundmass textures and remote sensing. Bull. Volcanol. 83 (72), 72. doi:10.1007/s00445-021-01489-6
Maclennan, J., Jull, M., McKenzie, D., Slater, L., and Grönvold, K. (2002). The link between volcanism and deglaciation in Iceland. Geochem. Geophys. Geosyst. 3, 1–25. doi:10.1029/2001GC000282
Magnússon, E., Gudmundsson, M. T., Roberts, M. J., Sigurđsson, G., Höskuldsson, F., and Oddsson, B. (2012). Ice-volcano interactions during the 2010 Eyjafjallajökull eruption, as revealed by airborne imaging radar. J. Geophys. Res. Solid Earth 117, B07405. doi:10.1029/2012JB009250
Mangler, M., Petrone, C. M., Hill, S., Delgado-Granados, H., and Prytulak, J. (2021). A pyroxenic view on magma hybridization and crystallization at Popocatépetl volcano, Mexico. Front. Earth Sci. 8 (362). doi:10.3389/feart.2020.00362
Mangler, M., Petrone, C. M., and Prytulak, J. (2022). Magma recharge patterns control eruption styles and magnitudes at Popocatépetl volcano (Mexico). Geology 50, 366–370. doi:10.1130/G49365.1
Martínez, P., Singer, B. S., Moreno Roa, H., and Jicha, B. R. (2018). Volcanologic and petrologic evolution of antuco-sierra Velluda, southern Andes, Chile. J. Volcanol. Geotherm. Res. 349, 392–408. doi:10.1016/j.jvolgeores.2017.11.026
Miller, T. P., and Smith, R. L. (1987). Late Quaternary caldera-forming eruptions in the eastern Aleutian arc, Alaska. Geology 15, 434–438. doi:10.1130/0091-7613(1987)15<434:LQCEIT>2.0.CO;2
Mixon, E. E., Jicha, B. R., Tootell, D., and Singer, B. S. (2022). Optimizing 40Ar/39Ar analyses using an Isotopx NGX-600 mass spectrometer. Chem. Geol. 593, 120753. doi:10.1016/j.chemgeo.2022.120753
Mixon, E. E., Singer, B. S., Jicha, B. R., and Ramirez, A. (2021). Calbuco, a monotonous andesitic high-flux volcano in the Southern Andes, Chile. J. Volcanol. Geotherm. Res. 416, 107279. doi:10.1016/j.jvolgeores.2021.107279
Mora, D., and Tassara, A. (2019). Upper crustal decompression due to deglaciation-induced flexural unbending and its role on post-glacial volcanism at the Southern Andes. Geophys. J. Intern. 216, 1549–1559. doi:10.1093/gji/ggy473
Moreno, P. I., Denton, G. H., Moreno, H., Lowell, T. V., Putnam, A. E., and Kaplan, M. R. (2015). Radiocarbon chronology of the last glacial maximum and its termination in northwestern Patagonia. Quat. Sci. Rev. 112, 233–249. doi:10.1016/j.quascirev.2015.05.027
Newhall, C. G., and Dzurisin, D. (1988). Historical unrest at large calderas of the world. U. S. Geol. Surv. Bull. 1855, 1108. doi:10.3133/b1855
Nowell, D. A. G., Jones, M. C., and Pyle, D. M. (2006). Episodic quaternary volcanism in France and Germany. J. Quat. Sci. 21, 645–675. doi:10.1002/jqs.1005
Palacios, D., Stokes, C. R., Phillips, F. M., Clague, J. J., Alcalá-Reygosa, J., Andrés, N., et al. (2020). The deglaciation of the Americas during the Last Glacial Termination. Earth-Sci. Rev. 203, 103113. doi:10.1016/j.earscirev.2020.103113
Palmer, B. A., and Neall, V. E. (1989). The Murimotu Formation–9500 year old deposits of a debris avalanche and associated lahars, Mount Ruapehu, North Island, New Zealand. New zeal. J. Geol. geophys. 32, 477–486. doi:10.1080/00288306.1989.10427555
Pinel, V., and Jaupart, C. (2000). The effect of edifice load on magma ascent beneath a volcano. Phil. Trans. Roy. Soc. A 358, 1515–1532. doi:10.1098/rsta.2000.0601
Praetorius, S., Mix, A., Jensen, B., Froese, D., Milne, G., Wolhowe, M., et al. (2016). Interaction between climate, volcanism, and isostatic rebound in Southeast Alaska during the last deglaciation. Earth Planet. Sci. Lett. 452, 79–89. doi:10.1016/j.epsl.2016.07.033
Pure, L. R., Leonard, G. S., Townsend, D. B., Wilson, C. J. N., Calvert, A. T., Cole, R. P., et al. (2020). A high resolution 40Ar/39Ar lava chronology and edifice construction history for Tongariro volcano, New Zealand. J. Volcanol. Geotherm. Res. 403, 106993. doi:10.1016/j.jvolgeores.2020.106993
Rawson, H., Pyle, D. M., Mather, T. A., Smith, V. C., Fontijn, K., Lachowycz, S. M., et al. (2016). The magmatic and eruptive response of arc volcanoes to deglaciation: Insights from southern Chile. Geology 44, 251–254. doi:10.1130/G37504.1
Rivera, M., Martin, H., Pennec, J.-L., Thouret, J.-C., Gourgaud, A., and Gerbe, M.-C. (2017). Petro-geochemical constraints on the source and evolution of magmas at El Misti volcano (Peru). Lithos 268, 240–259. doi:10.1016/j.lithos.2016.11.009
Robin, C., Samaniego, P., Pennec, J.-L., Fornari, M., Mothes, P., and van der Plicht, J. (2010). New radiometric and petrological constraints on the evolution of the Pichincha volcanic complex (Ecuador). Bull. Volcanol. 72, 1109–1129. doi:10.1007/s00445-010-0389-0
Romero, J. E., Polacci, M., Watt, S., Kitamura, S., Tormey, D., Siefeld, G., et al. (2021). Volcanic lateral collapse processes in mafic arc edifices: A review of their driving processes, types and consequences. Front. Earth Sci. 9 (639825). doi:10.3389/feart.2021.639825
Ruprecht, P., and Plank, T. (2013). Feeding andesitic eruptions with a high-speed connection from the mantle. Nature 500, 68–72. doi:10.1038/nature12342
Russell, J. K., Edwards, B. R., Turnbull, M., and Porritt, L. A. (2021). Englacial lake dynamics within a Pleistocene cordilleran ice sheet at Kima' Kho tuya (British Columbia, Canada). Quat. Sci. Rev. 273, 107247. doi:10.1016/j.quascirev.2021.107247
Samaniego, P., Barba, D., Robin, C., Fornari, M., and Bernard, B. (2012). Eruptive history of Chimborazo volcano (Ecuador): A large, ice-capped and hazardous compound volcano in the northern Andes. J. Volcanol. Geotherm. Res. 221–222, 33–51. doi:10.1016/j.jvolgeores.2012.01.014
Samaniego, P., Rivera, M., Mariño, J., Guillou, H., Liorzou, C., Zerathe, S., et al. (2016). The eruptive chronology of the Ampato–Sabancaya volcanic complex (Southern Peru). J. Volcanol. Geotherm. Res. 323, 110–128. doi:10.1016/j.jvolgeores.2016.04.038
Santamaría, S., Quidelleur, X., Hidalgo, S., Samaniego, P., Le Pennec, J.-L., Liorzou, C., et al. (2022). Geochronological evolution of the potentially active Iliniza Volcano (Ecuador) based on new K-Ar ages. J. Volcanol. Geotherm. Res. 424, 107489. doi:10.1016/j.jvolgeores.2022.107489
Sas, M., Debari, S. M., Clynee, M. A., and Rusk, B. G. (2017). Using mineral geochemistry to decipher slab, mantle, and crustal input in the generation of high-Mg andesites and basaltic andesites from the northern Cascade Arc. Amer. Mineral. 102, 948–965. doi:10.2138/am-2017-5756
Sawagaki, T., Aoki, T., Hasegawa, H., Iwasaki, S., Iwata, S., and Hirakawa, K. (2004). Late quaternary glaciations in Japan. Dev. Quat. Sci. 2, 217–225. doi:10.1016/S1571-0866(04)80127-1
Schindlbeck, J. C., Jegen, M., Freundt, A., Kutterolf, S., Straub, S. M., Mleneck-Vautravers, M. J., et al. (2018). 100-kyr cyclicity in volcanic ash emplacement: Evidence from a 1.1 Myr tephra record from the NW pacific. Sci. Rep. 8, 4440. doi:10.1038/s41598-018-22595-0
Schmidt, M. E., and Grunder, A. L. (2009). The evolution of North Sister: a volcano shaped by extension and ice in the central Oregon Cascade arc. Geol. Soc. Amer. Bull. 121, 643–662. doi:10.1130/B26442.1
Siebert, S. T. (2002). Volcanoes of the world: An illustrated catalog of Holocene volcanoes and their eruptions, global volcanism program digital inf. Ser. GVP-3. Washington, D. C: Smithsonian Institution. Available at: http://www.volcano.si.edu/world.
Sigvaldason, G. E., Annertz, K., and Nilsson, M. (1992). Effect of glacier loading/deloading on volcanism: Postglacial volcanic production rate of the Dyngjufjöll area, central Iceland. Bull. Volcanol. 54, 385–392. doi:10.1007/BF00312320
Singer, B. S., Hildreth, W., and Vincze, Y. (2000). 40Ar/39Ar evidence for early deglaciation of the central Chilean Andes. Geophys. Res. Lett. 27, 1663–1666. doi:10.1029/1999GL011065
Singer, B. S., Jicha, B. R., Harper, M. A., Naranjo, J. A., Lara, L. E., and Moreno-Roa, H. (2008). Eruptive history, geochronology, and magmatic evolution of the Puyehue-Cordón Caulle volcanic complex, Chile. Geol. Soc. Bull. Amer. 120, 599–618. doi:10.1130/B26276.1
Singer, B. S., Marcott, S. A., Ferrier, K., Townsend, M., Edwards, B. R., Huver, C., et al. (2021). “An integrated approach to ice forcing in arc magmatic plumbing systems (IF-AMPS),” in American geophysical union, fall meeting 2021. abstract id. V14B-01.
Singer, B. S., Thompson, R. A., Dungan, M. A., Feeley, T. C., Nelson, S. T., Pickens, J. C., et al. (1997). Volcanism and erosion during the past 930 k.y. at the Tatara–San Pedro complex, Chilean Andes. Geol. Soc. Bull. Amer. 109, 127–142. doi:10.1130/0016-7606(1997)109<0127:VAEDTP>2.3.CO;2
Sisson, T. W., and Calvert, A. C. (2023). “Apparent, but probably false, ice-modulated volcanism at Mt. Rainier, Washington (USA),” in International association of Volcanology and chemistry of Earth’s interior, scientific assembly 2023. abstract id. 1413.
Sisson, T. W., Salters, V. J. M., and Larson, P. B. (2013). Petrogenesis of Mount Rainier andesite: Magma flux and geologic controls on the contrasting differentiation styles at stratovolcanoes of the southern Washington Cascades. Geol. Soc. Bull. Amer. 126, 122–144. doi:10.1130/B30852.1
Sisson, T. W., Schmitt, A. K., Danišík, M., Calvert, A. T., Pempena, N., Huang, C.-Y., et al. (2019). Age of the dacite of sunset amphitheater, a voluminous Pleistocene tephra from Mount Rainier (USA), and implications for cascade glacial stratigraphy. J. Volcanol. Geotherm. Res. 376, 27–43. doi:10.1016/j.jvolgeores.2019.03.003
Smellie, J. L. (2021). Sedimentation associated with glaciovolcanism: A review. Geol. Soc. Lond. Spec. Pub. 520. doi:10.1144/SP520-2021-135
Smellie, J. L., and Skilling, I. P. (1994). Products of subglacial volcanic eruptions under different ice thicknesses: Two examples from Antarctica. Sediment. Geol. 91, 115–129. doi:10.1016/0037-0738(94)90125-2
Sotores, R. L., Sagredo, E. A., Kaplan, M. R., Martini, M. A., Moreno, P. I., Reynhout, S. A., et al. (2022). Glacier fluctuations in the northern Patagonian Andes (44°S) imply wind-modulated interhemispheric in-phase climate shifts during Termination 1. Sci. Rep. 12, 10842. doi:10.1038/s41598-022-14921-4
Stelling, P., Gardner, J. E., and Begét, J. (2005). Eruptive history of Fisher caldera, Alaska, USA. J. Volcanol. Geotherm. Res. 139, 163–183. doi:10.1016/j.jvolgeores.2004.08.006
Taniuchi, H., Kuritani, T., and Nakagawa, M. (2020). Generation of calc-alkaline andesite magma through crustal melting induced by emplacement of mantle-derived water-rich primary magma: Evidence from Rishiri Volcano, southern Kuril Arc. Lithos 354-355, 105362. doi:10.1016/j.lithos.2019.105362
Thompson, W. G., and Goldstein, S. L. (2006). A radiometric calibration of the SPECMAP timescale. Quat. Sci. Rev. 25, 3207–3215. doi:10.1016/j.quascirev.2006.02.007
Thouret, J. C., Finizola, A., Fornari, M., Legeley-Padovani, A., Suni, J., and Frechen, M. (2001). Geology of El Misti volcano near the city of arequipa, Peru. Geol. Soc. Amer. Bull. 113, 1593–1610. doi:10.1130/0016-7606(2001)113<1593:GOEMVN>2.0.CO;2
Tiede, C., Camacho, A. G., Gerstenecker, C., Fernández, J., and Suyanto, I. (2005). Modeling the density at Merapi volcano area, Indonesia, via the inverse gravimetric problem. Geochem. Geophys. Geosyst. 6, Q09011. doi:10.1029/2005GC000986
Till, C. B., Kent, A. J. R., Abers, G. A., Janiszewski, H. A., Gaherty, J. B., and Pitcher, B. W. (2019). The causes of spatiotemporal variations in erupted fluxes and compositions along a volcanic arc. Nat. Commun. 10 (1350), 1350. doi:10.1038/s41467-019-09113-0
Tost, M., and Cronin, S. J. (2015). Linking distal volcaniclastic sedimentation and stratigraphy with the development of Ruapehu volcano, New Zealand. Bull. Volcanol. 77 (94), 94. doi:10.1007/s00445-015-0977-0
Tuffen, H. (2010). How will melting of ice affect volcanic hazards in the twenty-first century? Phil. Trans. Roy. Soc. A 368, 2535–2558. doi:10.1098/rsta.2010.0063
Vallance, J. W., and Scott, K. M. (1997). The Osceola Mudflow from Mount Rainier: Sedimentology and hazard implications of a huge clay-rich debris flow. Geol. Soc. Amer. Bull. 109, 143–163. doi:10.1130/0016-7606(1997)109<0143:TOMFMR>2.3.CO;2
Wall, K. T., Grunder, A. L., Miggins, D. P., and Coble, M. A. (2018). Multistage growth and compositional change at the Goat Rocks volcanic complex, a major Pliocene–Pleistocene andesite center in the southern Washington Cascades. Geol. Soc. Amer. Spec. Pap. 538, 63–91. doi:10.1130/2018.2538(04
Wallmann, P. C., Mahood, G. A., and Pallard, D. P. (1988). Mechanical models for correlation of ring-fracture eruptions at Pantelleria, Strait of Sicily, with glacial sea-level drawdown. Bull. Volcanol. 50, 327–339. doi:10.1007/BF01073589
Watt, S. F. L., Pyle, D. M., and Mather, T. A. (2013). The volcanic response to deglaciation: Evidence from glaciated arcs and a reassessment of global eruption records. Earth-Sci. Rev. 122, 77–102. doi:10.1016/j.earscirev.2013.03.007
Watt, S. F. L. (2019). The evolution of volcanic systems following sector collapse. J. Volcanol. Geotherm. Res. 384, 280–303. doi:10.1016/j.jvolgeores.2019.05.012
Waythomas, C. F., and Wallace, K. L. (2002). Flank collapse at Mount Wrangell, Alaska, recorded by volcanic mass-flow deposits in the Copper River lowland. Canad. J. Earth. Sci. 39, 1257–1279. doi:10.1139/e02-032
Williams, P. W., McGlone, M., Neil, H., and Zhao, J.-X. (2015). A review of New Zealand palaeoclimate from the last interglacial to the global last glacial maximum. Quat. Sci. Rev. 110, 92–106. doi:10.1016/j.quascirev.2014.12.017
Wilson, A. M., and Russell, J. K. (2020). Glacial pumping of a magma-charged lithosphere: A model for glaciovolcanic causality in magmatic arcs. Earth Planet. Sci. Lett. 548 (116500), 116500. doi:10.1016/j.epsl.2020.116500
Keywords: volcano-climate, glaciovolcanic, eruption history, arc volcanism, Ar/Ar age dating
Citation: Conway CE, Pure LR and Ishizuka O (2023) An assessment of potential causal links between deglaciation and eruption rates at arc volcanoes. Front. Earth Sci. 11:1082342. doi: 10.3389/feart.2023.1082342
Received: 28 October 2022; Accepted: 27 March 2023;
Published: 12 April 2023.
Edited by:
John Smellie, University of Leicester, United KingdomReviewed by:
Luis E. Lara, Servicio Nacional de Geología y Minería de Chile (SERNAGEOMIN), ChileVera Ponomareva, Institute of Volcanology and Seismology, Russia
Benjamin Edwards, Dickinson College, United States
Copyright © 2023 Conway, Pure and Ishizuka. This is an open-access article distributed under the terms of the Creative Commons Attribution License (CC BY). The use, distribution or reproduction in other forums is permitted, provided the original author(s) and the copyright owner(s) are credited and that the original publication in this journal is cited, in accordance with accepted academic practice. No use, distribution or reproduction is permitted which does not comply with these terms.
*Correspondence: Chris E. Conway, Yy5jb253YXlAYWlzdC5nby5qcA==