 Xianwei Zeng
 Xinyan Li
 Mengya Li
- Earthquake Administration of Ningxia Hui Autonomous Region, Yinchuan, China
Introduction: The 2015 Ms5.8 Alxa Left Banner earthquake (Alxa Ms 5.8 eathquake) struck a sparsely inhabited area of Inner Mongolia, northwestern China. However, as first > Ms 5 event on the Ningxia–Inner Mongolia segment of the North–South seismic zone for 24 years, the earthquake is of considerable scientific interest.
Methods: In this study, the seismic distribution of the Alxa Ms 5.8 earthquake sequence was redetermined via the analysis of data from permanent and campaign seismic stations using the double-difference (DD) method. To improve the completeness of the earthquake catalog, the match and locate (M&L) method was then used to detect micro-earthquakes.
Results: The mainshock rupture started at the eastern end of the fault, propagating east-to-west and deep-to-shallow. Aftershocks were distributed in a NEE trending (N70°–75°E), with a 12-km length and a dominant depth of 15–25 km. Moreover, the aftershocks formed two distinct segments (the eastern and western segments). The mainshock and early aftershocks were primarily located on the eastern segment and relatively fewer aftershocks occurred on the western segment.
Discussion: Subsequently, from March to June 2016, three earthquakes of > ML3.0 occurred in the seismic gap between the eastern and western segments, releasing stress that was not released by the mainshock. According to the aftershock evolution, the seismogenic fault of Alxa Ms 5.8 eathquake associated with a NEE-striking blind fault that becomes steeply dipping toward the south. Furthermore, the seismogenic fault is a western branch fault of the Dengkou–Benjing blind fault (DBF). The aftershock evolution and inferred seismogenic structure provide a reference for further research in the study area.
1 Introduction
During the morning (UTC 07:39) of 15 April 2015, an Ms5.8 [or Mw 5.4, United States Geological Survey (USGS)] earthquake occurred in Alxa Left Banner, Inner Mongolia, northwestern China. The epicenter was located at the junction of Bayanmuren Sumu and Jilantai Town. The earthquake struck a sparsely inhabited area and caused few casualties; however, it ended 24-years of seismic quiescence along the Ningxia–Inner Mongolia segment of the North–South seismic zone. As the first > Ms 5 earthquake in this region for quarter of a century, numerous studies of the earthquake have been reported. Focal mechanism solutions of the mainshock and locations of early aftershocks show a nearly pure left-lateral strike-slip faulting mechanism of the mainshock (Han et al., 2015). The earthquake was affected by NW tensile stress and NE compressive stress (Li et al., 2020), and the seismogenic structure has been inferred as a blind strike-slip fault with E–W trending (Song and Ge, 2018; Liu et al., 2020). Nevertheless, in the previous reports, the velocity structure inversion were mostly employed via the earthquake relocation and micro-earthquake detection, with little attention paid to aftershock evolution and seismogenic structure. Furthermore, only six permanent seismic stations are within 200 km of the epicenter, of which five are located south of the epicenter with azimuth angle range of 60°. The small number and limited distribution of permanent stations limited the monitoring capability, resulting in poor location accuracy for the mainshock and aftershocks. Moreover, a lack of locatable aftershocks has increased the difficulty in analyzing the aftershocks process and seismogenic structure associated with the earthquake.
The temporal and spatial evolution of aftershocks offers the potential determine the possibility of relatively large magnitude earthquakes, and is critical for determining seismogenic faults, stress fields, and the evolution of seismicity and seismic properties (Syracuse et al., 2012). The aftershocks distribution of the 2021 Ms 6.4 Yangbi earthquake revealed a predominantly unilateral rupture to the southeast, while a cluster of off-fault aftershocks indicated a nearly vertical dipping fault (Zhang et al., 2021; Tang et al., 2022). Aftershocks of the 1999 Izmit earthquake delineated the fault rupture from on-shore, through the Hersek Delta, and into the Marmara Sea (Gulen et al., 2002). Aftershocks of the 2011 Oklahoma earthquake helped to reveal subsurface geologic units and fault structures, including a previously unknown fault, and also provided insight on the second largest earthquake after the mainshock (McMahon et al., 2017). However, an adequate number of aftershocks are needed for aftershocks analysis. The early aftershock catalog around the mainshock rupture zone of the Alxa Left Banner Ms 5.8 earthquake (Alxa Ms 5.8 earthquake) has suffered from incompleteness; in particular, small earthquakes with low signal-to-noise ratios (SNRs) are missing from the main catalog.
The Alxa Ms 5.8 earthquake occurred in the Jilantai Basin, which is bound by the Dengkou–Benjing blind fault to the east and piedmont fault of Bayanwula Mountain to the west. The northern and southern boundaries of the basin are not clearly defined. To date, the internal structure of the Jilantai Basin remains poorly constrained owing to poor data coverage and limited outcrops; however, the basin is known to have a complex internal structure containing a series of small topographical prominences and depressions separated by NW-, NE-, and E-trending secondary faults (Research Group of Active Fault System around the Ordos Massif, 1988). The Alxa Ms5.8 earthquake occurred close to the Dengkou–Benjing blind fault (DBF), a blind fault of ∼120 km in length based on aeromagnetic data (Research Group of Active Fault System around the Ordos Massif, 1988). The extent and Quaternary activity of this fault remain unknown owing to a lack of surface expression. Furthermore, the dominant spread direction of the Alxa Ms 5.8 earthquake sequence is ambiguous; nodal plane focal mechanism solutions (Han et al., 2015) and long-axis directions of intensity differ from the strike of the DBF. Accordingly, an integrated interpretation of its seismogenic structure has not been achieved to date.
Campaign seismic arrays with a mean inter-station distance of 35 km were deployed by the China Seismic Array Exploration Program between 2014 and April 2016. The epicenter region of the Alxa Ms 5.8 earthquake was fully covered by one such array at the time of the earthquake. Among the campaign stations, five stations were located within 50 km of the epicenter and 24 stations were located within 100 km of the epicenter, with a uniform distribution. In this study, data from these stations and from the six permanent seismic stations within 200 km of the epicenter were used to relocate the events of the Alxa Ms 5.8 earthquake sequence using the double-difference (DD) location algorithm (Waldhause and Ellsworth, 2000). In addition, micro-earthquake events were detected using the match and locate (M&L) method (Zhang and Wen, 2015a). The detailed aftershock evolution process and seismogenic structure of the earthquake were determined by combining the spatial distribution of the relocated earthquake sequence, the focal mechanism solutions, and the results of previous studies.
In conclusion, the Jilantai Basin has little knowledge of its internal active structure, and it has rarely recorded earthquakes of magnitude 5 or greater. The Alxa Ms 5.8 earthquake presents a good opportunity to study the active structure and seismogenic process inside the basin. Moreover, it has been concluded that there are differences between the fault–plane solution of this earthquake, the long axis of seismic intensity and the strike of the DBF. In this way, no unified seismogenic structure of this earthquake has been characterized, and the strike, dip, dip angle of the DBF remain unclear. Therefore, a detailed investigation of the aftershock evolution and seismogenic structure of the Alxa Ms 5.8 earthquake based on the analysis of data from permanent and campaign seismic stations play an essential role in understanding the seismogenic process and seismic hazard in the Jilantai Basin.
2 Methods, data, and velocity model
Location methods
The HYPOINVERSE-2000 (HYPO 2000) location algorithm was adopted to determine the absolute position of the master event (Klein, 2002); this approach has been successfully applied to multiple earthquake sequences (Langin, 2003; Clinton et al., 2006; Konstantinou et al., 2006; 2009a; 2009b; Choi and Noh, 2010; Hauksson et al., 2012; Caciagli et al., 2015; Schoenball and Ellsworth, 2017; Yao et al., 2021). In the DD earthquake location algorithm, developed by Waldhause and Ellsworth (2000), the relative positions of event pairs are determined through minimum residuals between observed and theoretical travel-time differences (or double-difference). The DD method has been widely used to improve earthquake locations (Waldhauser and Ellsworth, 2002; Hauksson and Shearer, 2005; Mandal and Horton, 2007; Waldhauser and Schaff, 2008; Mottaghi et al., 2010; Zhao et al., 2013; Fang et al., 2015; Kato et al., 2016; Sippl et al., 2018; Fan et al., 2022).
In the M&L method, the DD travel-time is used to detect micro-earthquakes; the detection depends only weakly on the accuracy of the velocity model. A brief description of the M&L detection algorithm applied in this study is as follows (Zhang and Wen, 2015a). First, seismic events located by the DD method were chosen as template events with low SNR. The study area was then gridded in longitude, latitude, and depth with the positions of template events used as centers. The travel-time difference of the reference phases (S waves) between each potential small event (i.e., grid point) and template event at each station was calculated. Subsequently, based on travel-time differences of multiple stations, sliding window cross-correlation was performed between reference phases of the template events and the continuous data stream at each station and data component. Finally, the mean correlation coefficient (CC) and SNR after the stacking cross-correlation were calculated. When the mean CC and SNR exceeded defined thresholds, a small event was deemed to be a positive detection, and its position was determined as the grid point with the maximum mean CC. The magnitudes of the detected small events were determined based on the median of the amplitude ratios for the reference phases in all station components (Peng and Zhao, 2009).
Data selection
Continuous waveform data recorded by 24 stations (Figure 1) within 100 km of the Alxa Ms 5.8 earthquake (i.e., mainshock) epicenter were selected. The study period was from 1 January 2015, to 28 February 2016 (i.e., 3 months before and 10 months after the mainshock). In order to obtain accurate arrival-times and reliable earthquake locations, event waveforms recorded clearly by at least four stations were first selected and the arrival-times of the direct P and S seismic phases were picked manually. The arrival-time data for each earthquake event were checked and corrected using the Wadati diagram, and data that greatly deviated from the fitting line were removed based on regional-phase travel-time curves for Pg and Sg.
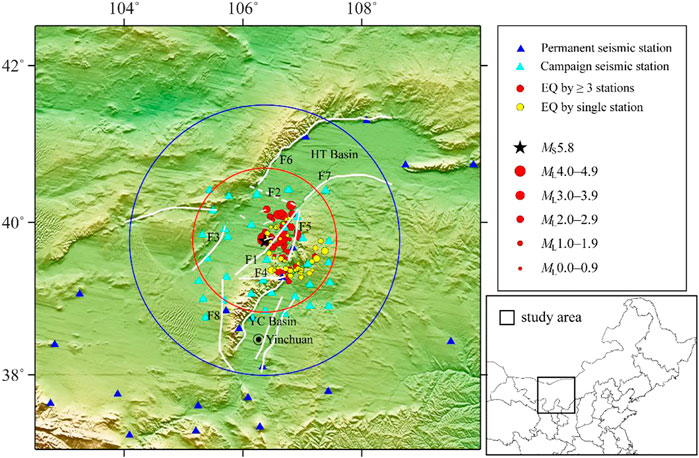
FIGURE 1. Distribution of seismic stations in the study area and epicenter of the Alxa Left Banner Ms 5.8 earthquake sequence. White solid lines represent faults and white dotted lines represent inferred faults. The red and blue circles represents areas of 100 and 200 km radius around the epicenter. F1: Dengkou–Benjing Fault, F2: Dengkou–Xulisitewula Fault, F3: Eastern Piedmont Fault of Bayanwula Mountain, F4: Zhengyiguan Fault, F5: Western Piedmont Fault of Zhuozi Mountain, F6: Piedmont Fault of Lang Mountain, F7: North Fringe Fault of Ordos, F8: Bayanhaote Fault, YC Basin: Yinchuan Basin, HT Basin: Hetao Basin.
Based on the observation data from permanent seismic stations, 90 localizable earthquakes in the Alxa Ms 5.8 (i.e., mainshock) earthquake sequence were obtained using the HYPO2000 method. After the inclusion of data from the campaign arrays, 175 localizable earthquakes were obtained (i.e., the number of localizable earthquakes almost doubled), the minimum complete magnitude decreased from ML1.2 to ML0.8 (Figure 2), and the completeness of the earthquake catalog was significantly improved.
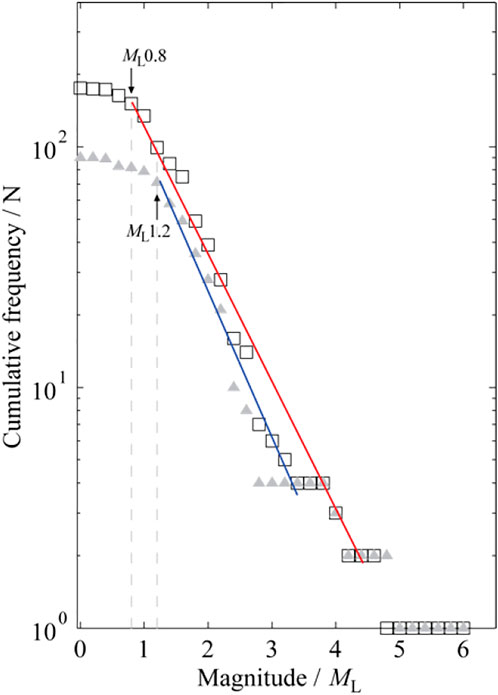
FIGURE 2. Cumulative frequency and magnitude of events in the Alxa Left Banner Ms 5.8 earthquake sequence. Triangles represent earthquakes located using data from permanent seismic stations; squares represent earthquakes located using data from both permanent and campaign seismic stations.
Velocity model
The study area was located in the Hetao Basin. Velocity data for the area are available in the CRUST1.0 velocity model (Laske et al., 2013); however, these data are low resolution. Based on the results of previous research into the one-dimensional crustal velocity structure in Alxa, the subsurface structure of the study area was divided into four layers (Song and Ge, 2018).
3 Results
Earthquake relocation
Based on corrected seismic phase data and uniform station coverage, reliable hypocenter positions can be obtained using the HYPO2000 method. The horizontal and vertical position errors of the mainshock are 0.25 and 0.83 km, respectively. For the earthquake sequence, the horizontal position errors of nearly 95% of earthquakes are within 1 km; the vertical position errors of more than 95% of earthquakes are within 3 km; the arrival residuals of ∼95% earthquakes are within 0.3 s. The average values of horizontal and vertical position errors and arrival residual are 0.55 km, 1.53 km, and 0.175 s, respectively. Thus, the hypocenter position of the Alxa Ms 5.8 earthquake sequence obtained by the HYPO2000 method is reliable.
The HYPO2000 location parameters were taken as input parameters for the DD method. The relative location accuracy of earthquake source was improved and the directional distribution of the occurrence of earthquakes was clearer, representing a difference from the disordered distribution before relocation (Figure 3). The spatial distribution of aftershocks appears to be very similar before and after relocation. In comparison, it was found that the hypocenters of most earthquakes were very close before relocation, and the hypocenters is layered distribution, as shown in Figure 3B. After the relocation, the linear distribution characteristics of the hypocentres became more obvious, as well as the seismic gap.
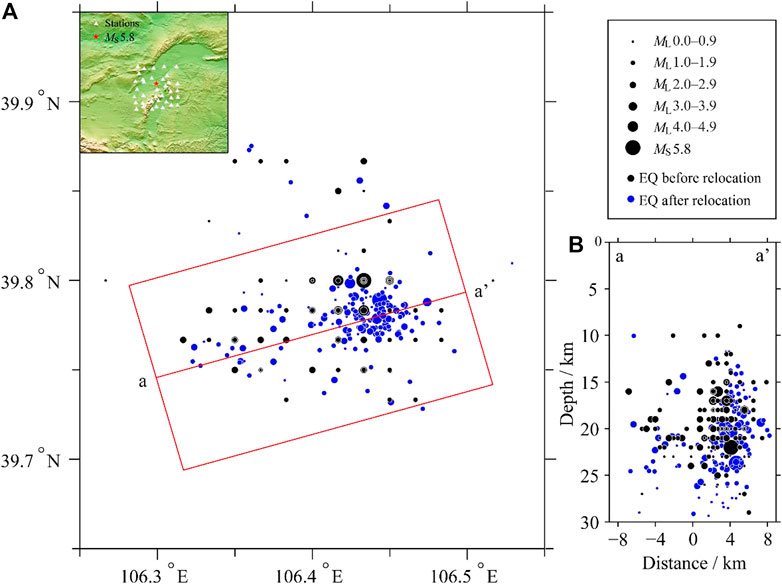
FIGURE 3. Distribution of the (A) epicenters (from 1 January 2015, to 28 February 2016) and (B) focal depths of the studied earthquakes before and after relocation.
Earthquakes at the eastern end of the aftershock zone were found to have undergone an eastward shift after relocation, with an increased spread length of aftershocks (Figure 3A). The focal depths mainly ranged between 16 and 22 km before relocation, while after relocation, the depth spread increased to 15–25 km (Figure 3B). The dominant distribution of the focal depth of the Alxa Ms 5.8 earthquake sequence shows that the seismogenic layer was located in the middle–upper crust.
Micro-earthquake detection
Under the premise of uniform azimuthal distribution of stations and waveforms with high SNR, the number of stations used for micro-earthquake detection should be appropriate, and stations close to the epicenter should be selected to the extent possible. Therefore, six stations were selected for micro-earthquake detection, and 25 earthquakes of > ML2.5 with high SNR waveforms were selected as template events (Table 1); waveforms 1 s before and 3 s after the Sg seismic phases of the template events were chosen as template waveforms. Wave filtering at 2–8 Hz was then performed for the template and continuous waveform data. In accordance with the M&L method, the study area was gridded at 0.01° × 0.01° × 0.5 km (longitude, latitude, depth), with the positions of the template earthquakes used as the centers. Finally, the origin times, seismic-source locations, and magnitudes of the micro-earthquakes were determined using a grid search method. In this study, the average CC threshold value was set as 0.3 (Zhang and Wen, 2015a; 2015b; 2015c) based on existing studies, and the event magnitude was decided based on the median of the amplitude ratios for the reference seismic phases in all station components. When the S wave amplitude is barely above the noise level, the principal component fit method can be used to calibrate the magnitude (Shelly et al., 2016; Meng et al., 2018; Yao et al., 2020; Daniels and Peng, 2022). The Sg seismic phase parameters were calculated using the TauP Toolkit (Crotwell et al., 1999) based on the Preliminary Reference Earth Model (Dziewonski and Anderson, 1981). The event with the largest CC in each 6-s time window was chosen as the detected earthquake to avoid duplicate detection.
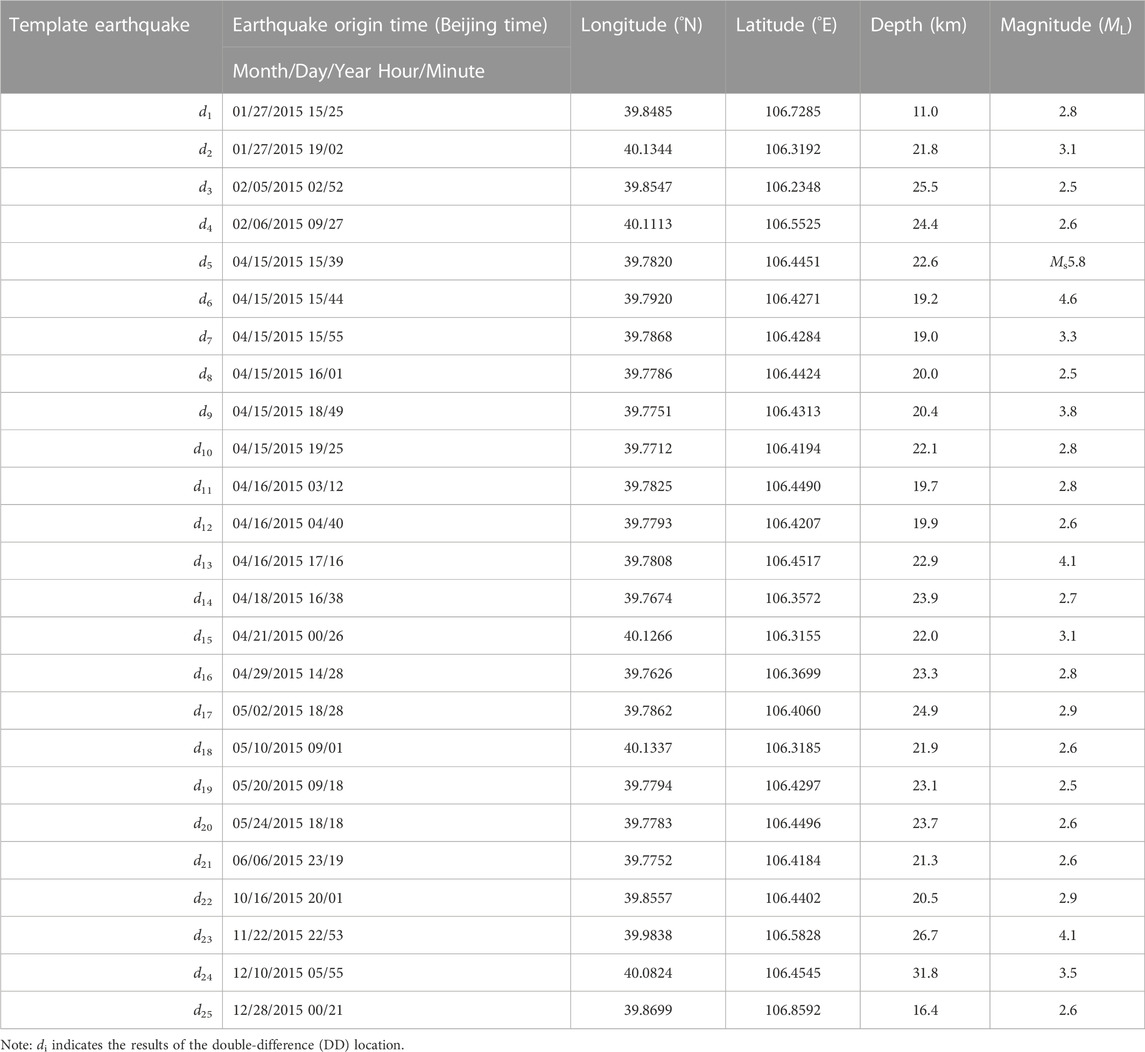
TABLE 1. Parameters of template events.
A total of 803 micro-earthquakes (including 208 DD-located earthquakes) were detected using the M&L method (Figure 4); these were mainly distributed near the mainshock. In addition, two areas of micro-earthquakes were concentrated ∼30 km north of the mainshock. The number of earthquakes showed a sharp increase to nearly four times the number of events before micro-earthquake detection.
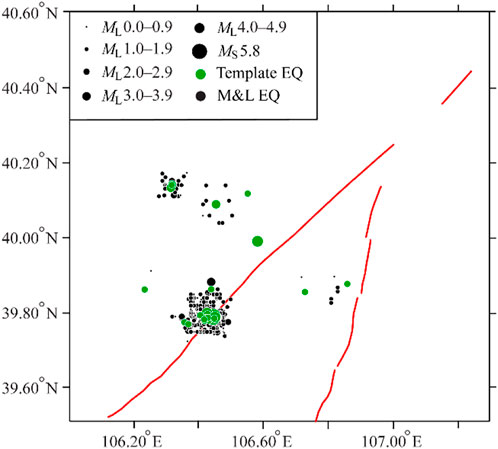
FIGURE 4. Distribution of template earthquakes and detected micro-earthquakes.
After micro-earthquake detection using the M&L method, the minimum complete magnitude decreased from ML0.8 to ML0.6 (Figure 5), and the seismic gap of the earthquake catalog was improved. The resultant richer aftershocks provided an improved basis for detailed analysis of aftershock evolution and seismogenic structure.
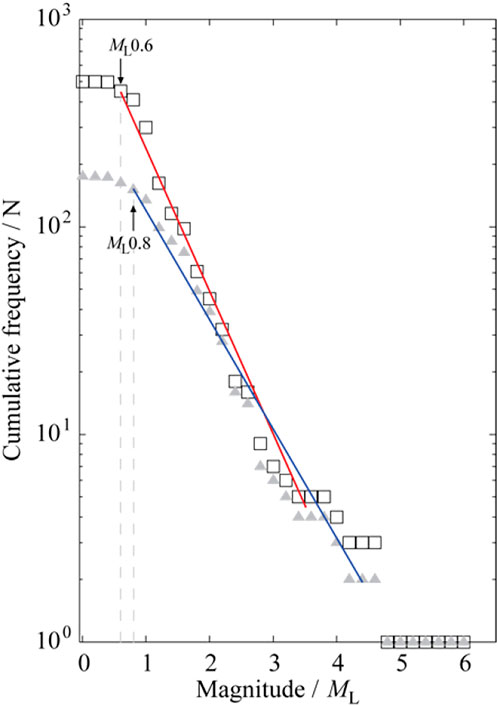
FIGURE 5. Cumulative frequency–magnitude distribution before and after micro-earthquake detection. Triangles represent earthquakes before micro-earthquake detection; squares represent earthquakes after micro-earthquake detection.
Effectiveness of micro-earthquake detection
After micro-earthquake detection using the M&L method, 25 template events were all self-detected, with CCs of 1.0. Figure 6A shows the self-detected result of the mainshock, and Figure 6B shows the detection result of a single ML0.3 micro-earthquake with an average CC of 0.3259.
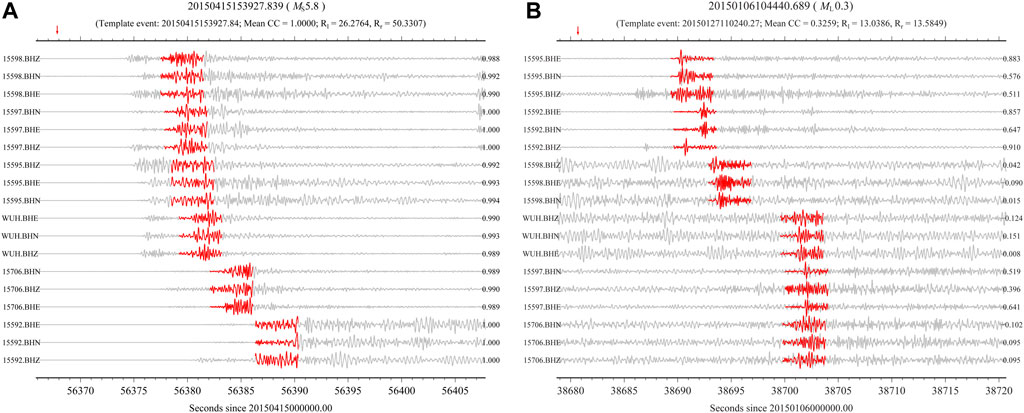
FIGURE 6. Detection results of the match and locate (M&L) method. (A) Self-detection results of the mainshock and (B) detection results of a single micro-earthquake. Red lines represent the waveforms of template earthquakes, gray lines represent the continuous waveforms of the detected earthquakes, and red arrows show the origin times of detected earthquakes. The left- and right-hand ends of the waveforms show the station components and correlation coefficient (CC), respectively. The template earthquake, average correlation coefficient, left and right signal-to-noise ratio (SNR), and magnitude of the detected earthquake are listed above each plot. The starting time of the waveforms is shown below each plot.
The results of the 208 DD-located earthquakes were compared with those of the M&L method for the same earthquake to illustrate the effectiveness of micro-earthquake detection (Figure 7). More than 70% of earthquakes (i.e., 155 events) had an origin time difference of <0.5 s, and >92% of earthquakes (i.e., 195 events) had a magnitude difference of <0.3. In addition, the distance between epicenter positions was <3 km for >95% of earthquakes (i.e., 201 events), while the focal depth difference of >95% of earthquakes (i.e., 199 events) was <4 km. In general, the detection results are similar to the DD location of the same earthquake, confirming the reliability of the micro-earthquake detection.
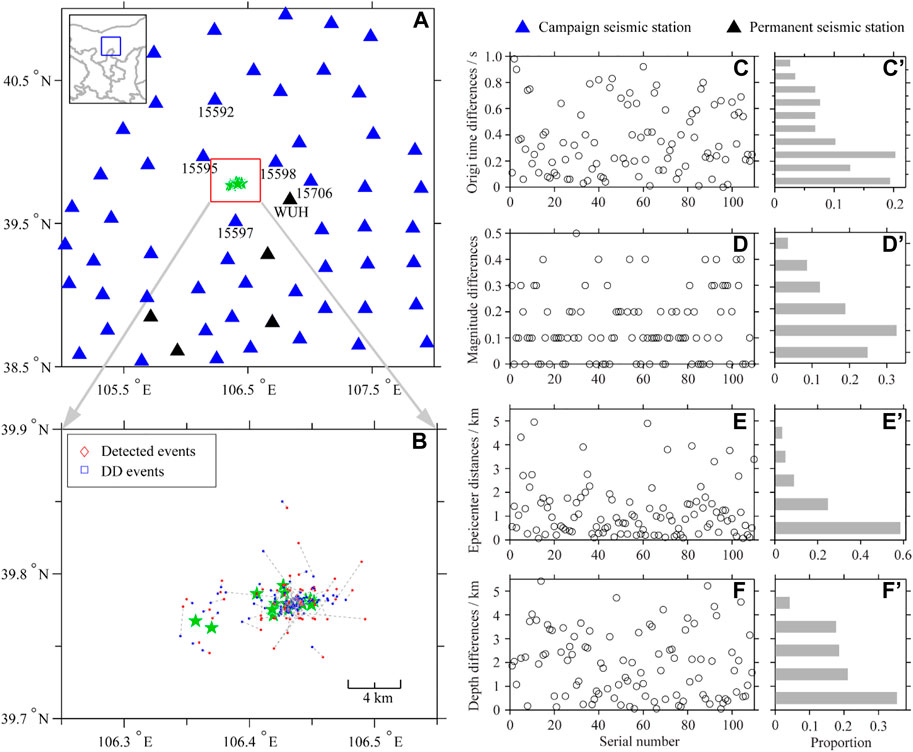
FIGURE 7. Station distribution and distributions of earthquakes from the double-difference (DD) and match and locate (M&L) methods. (A) Locations of permanent seismic stations (black triangles) and campaign seismic stations (blue triangles); the station codes of seismic stations used in the detection are shown; green stars indicate template events. The inset map in the upper left shows the eastern part of northwestern China, with the study area shown by a blue rectangle. (B) For each earthquake within the red rectangle in (A), the detection results of the M&L (red points) and DD (blue points) methods are compared and connected by gray dotted lines. Raw plots and histograms for earthquake origin time differences (C,C′), magnitude differences (D,D′), epicenter distances (E,E′), and depth differences (F,F′).
Focal mechanism solutions
The Cut and Paste (i.e., CAP) method (Zhao and Helmberger, 1994; Zhu and Helmberger, 1996) was applied to invert focal mechanism solutions for the mainshock and the four aftershocks of > ML4.0. The focal mechanism parameters are shown in Table 2.
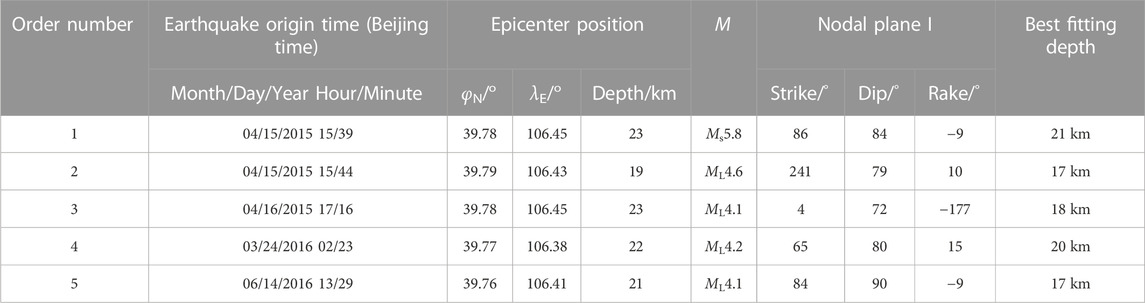
TABLE 2. Focal mechanism solutions of > ML4.0 events in the Alxa Left Banner Ms 5.8 earthquake sequence.
The focal mechanism solution and waveform fitting results were analyzed by taking the mainshock as an example. As shown in Figure 8, the phases and amplitudes of the theoretical and observed seismic waveforms at different stations had a good fit. The nodal plane solution of the focal mechanism of the mainshock was characterized by 86° strike, 84° dip, and −9° rake; the strike, dip, and rake of the alternative nodal plane solution were 177°, 81°, and −174°, respectively. The azimuth and plunge of the P axis were 41° and 11°, whereas those of the T axis were 132° and 2°, respectively. The moment magnitude of the mainshock was Mw5.6. The fit errors corresponding to the mechanism solutions of the mainshock at different focal depths are shown in Figure 9A. The fit error was smallest for a focal depth of 21 km; the mechanism solutions were relatively stable within a depth range from 15km to 31 km and were dominated by strike-slip with some normal components.
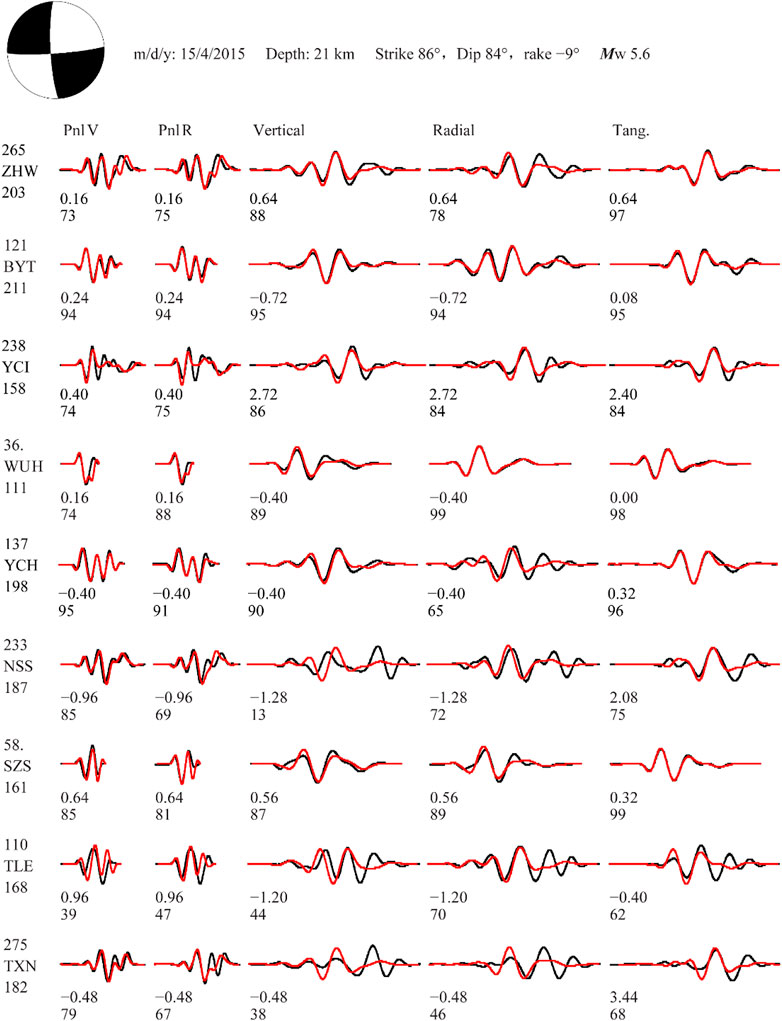
FIGURE 8. Selection of station focal mechanism solutions and waveforms for the Alxa Left Banner Ms5.8 earthquake on 15 April 2015. The lower-hemisphere beach ball focal mechanism, earthquake occurrence date, best fitting depth of the waveforms, mechanism solution, and moment magnitude are shown at the top of the figure. Black and red curves represent theoretical and observed seismograms, respectively. The numbers in the first line below each waveform represent the moving time (s) of the theoretical seismogram relative to the observed seismogram, and values in the second line indicate the correlation coefficient (%) between them. The epicenter distance (km), station name, and azimuth angle (°) are shown to the left of each set of waveforms.
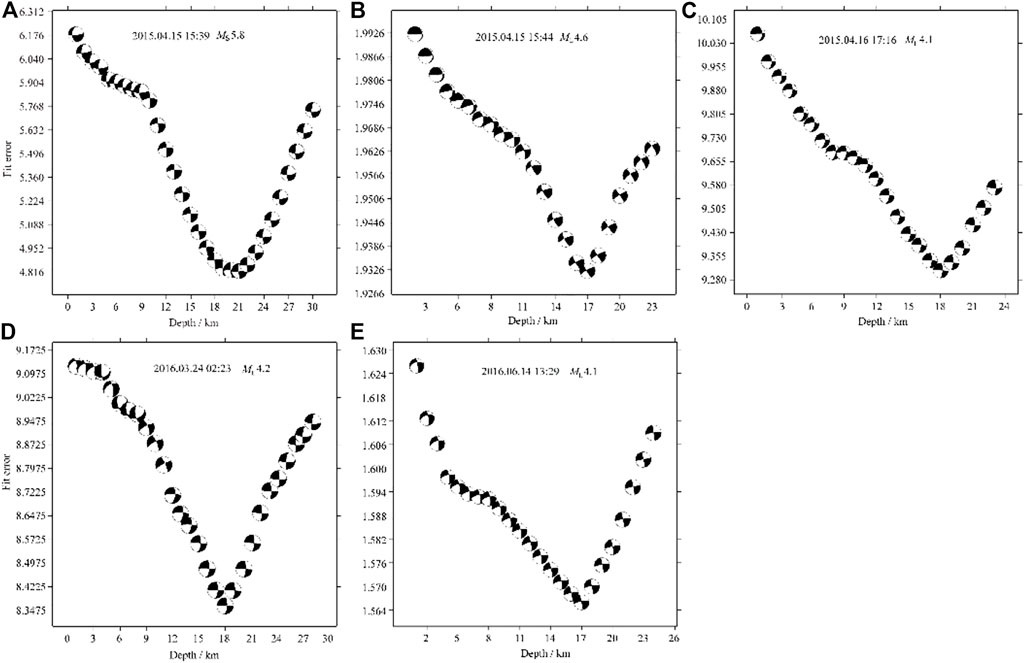
FIGURE 9. Fit errors of focal mechanism solutions of the Alxa Left Banner Ms 5.8 earthquake on 15 April 2015, and its four largest aftershocks.
The mechanism solutions of the four aftershocks of > ML4.0 were also well fitted (Figures 9B–E). The mechanism solutions at different depths were relatively stable and primarily characterized by strike-slip with a smaller number of normal or thrust components. These results are consistent with the focal mechanism solution of the mainshock. Overall, the seismogenic structure of the mainshock was a strike-slip fault, which is consistent with the development of multiple strike-slip faults in the study area (Research Group of Active Fault System around the Ordos Massif, 1988).
4 Discussion
Mainshock depth
The focal mechanism solutions of the Alxa Ms 5.8 earthquake were determined using data from previous literature (Han et al., 2015; Wang et al., 2019) and several institutions, including GFZ, USGS, GCMT, Institute of Geophysics, China Earthquake Administration (CEA-IGP). Focal depths obtained through inversion ranged from 13 to 30 km, with the relocated focal depth of the mainshock being 22.7 km. This depth falls within the upper crust and is essentially consistent with the results of Wang et al. (2019) [20.597 km], but is significantly deeper than the inverted focal depth (18 km) of Song and Ge (2018), the focal depth determined by the China Earthquake Network Center (10 km), the relocated depth (13.2 km) of Wei et al. (2017), and relocated depth (13 ± 1 km) of Han et al. (2015). However, the lack of significant ground surface rupture, major building damage, or casualties (Wang et al., 2019) is inconsistent with such shallow focal depths. Furthermore, the P wave velocity structure in the epicenter region, inverted by Wang et al. (2019) via the TomoDD method, shows a high- and low-velocity conversion zone at 20-km depth in the Alxa Left Banner focus region. Previous studies have shown that the presence of intracrustal high-velocity bodies is essential for high stress concentrations, and strong earthquakes are prone to occur in the transition zone between intracrustal high- and low-velocity zones or on the sides of high-velocity bodies (Lees and Malin, 1990; Zeng et al., 2014; 2017a; Wu et al., 2022). Thus, the above analysis and previous studies of seismogenic dynamics confirm that the focal depth of 22.7 km for the Alxa Ms 5.8 earthquake determined in this study is likely a realistic value.
Spatiotemporal distribution of the earthquake sequence
According to the M-t diagram and 2-day frequency diagram for the Alxa Ms 5.8 earthquake sequence (Figure 10), there were fluctuations in the development of the sequence. Aftershocks mainly occurred before 30 June 2015, followed by a rapid decrease in number. In December 2015, the number of aftershocks abruptly rose; however, these were mostly earthquakes with small magnitudes. Therefore, we selected only earthquakes from before 30 June 2015, for the analysis of aftershock evolution. Notably, after a period of quiescence following the aftershock decay, three larger aftershocks occurred between March and June 2016, including ML4.2, ML3.2 and ML4.1 earthquakes.
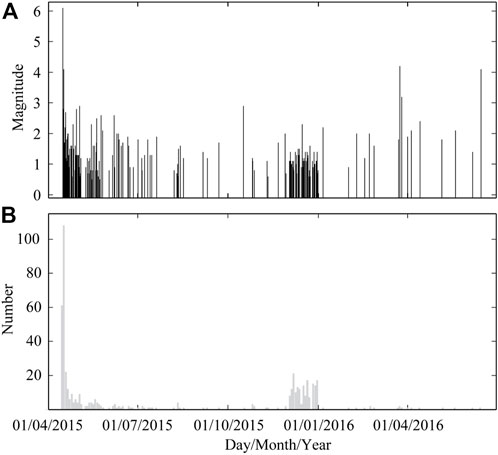
FIGURE 10. (A) M–t and (B) 2-day number N–t plots of ML > 0 events in the Alxa Left Banner Ms 5.8 earthquake sequence.
From analysis of the distribution characteristics of the Alxa Ms 5.8 earthquake sequence from April 15 to 30 June 2015 (Figure 11), we found that the aftershock sequence extended in an NEE direction (N70°–75°E) with a length of 12 km, likely indicating the rupture length of the mainshock. The mainshock rupture started from the eastern end of the aftershock zone and gradually extended to the western end, suggesting unilateral rupture. Aftershock activity was segmented, with eastern and western segments separated by an area of low seismicity extending 5 km horizontally. Both the mainshock and two aftershocks of > ML 4.0 occurred on the eastern segment, with significantly fewer aftershocks on the western segment. The aftershock zone was ∼4 km wide on the western segment and 5 km wide on the eastern segment. From March to June 2016, ML 4.2, ML 3.2 and ML 4.1 earthquakes occurred in the low-seismicity gap.
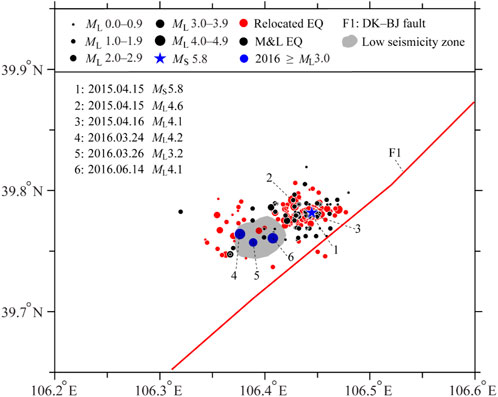
FIGURE 11. Epicenter distribution of the Alxa Left Banner Ms 5.8 earthquake sequence. Red and black dots represent relocated earthquakes (from April 15 to 30 June 2015) using the double-difference (DD) and match and locate (M&L) methods. Blue dots denote three large aftershocks that occurred from March to June 2016.
The NE-oriented DBF lies near the location of the Alxa Ms 5.8 earthquake, with an angle of ∼15° between the spread direction of the earthquake sequence and the direction of the DBF. More, the strike of the DBF does not match the focal mechanism solution of the mainshock. Therefore, the earthquake sequence is tentatively determined to have occurred on an unknown blind fault to the west of the DBF.
Aftershock evolution
The mainshock epicenter (i.e., the starting point of earthquake rupture) was located at the eastern segment of the aftershock zone (Figure 12A), demonstrating a unilateral rupture of the main shock. In addition, it shows that the eastern segment of the aftershock zone should belong to the asperity zone on the seismogenic fault zone. The two largest aftershocks (>ML4.0) also occurred on the eastern segment of the aftershock zone, indicating that mainshock did not release all of the strain in the main asperity zone. The focal depth profile (Figure 12B) illustrates that most aftershocks were shallower than the mainshock (22.7 km), which is consistent with the theory that strong earthquakes nucleation tend to the deeper and propagate upwards (Scholz, 1990). Aftershocks predominantly occurred at depths of 15–25 km, largely consistent with the depth of the mainshock rupture from previous studies (Wang et al., 2019). Few aftershocks above 15 km is compatible with field survey findings that no significant surface rupture was found after the mainshock (Wang et al., 2019). Figure 12A shows an obvious area of low seismicity (∼5 km2 × 5 km2) between the western and eastern segments of the aftershock zone, located at a depth of 20–25 km (Figure 12B). This zone potentially relates to a high strength barrier on the fault (Aki, 1979), and it was also consistent with an Coulomb stress triggering area of the mainshock (Gao et al., 2015). From March to June 2016, three earthquakes of > ML3.0, including two ML4 earthquakes, occurred in a low seismicity zone, indicating that the three large aftershocks were caused by the rupture of this barrier.
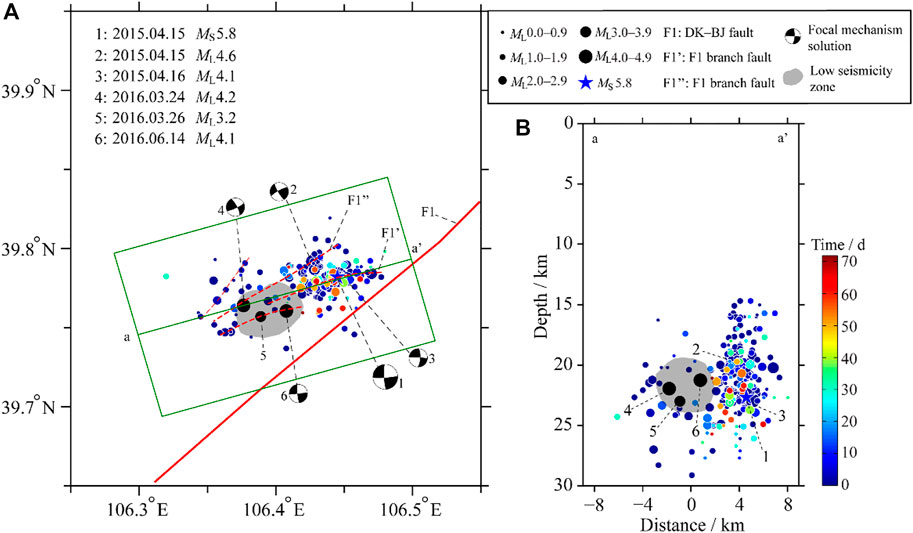
FIGURE 12. (A) Epicenter distribution of the Alxa Left Banner Ms 5.8 earthquake sequence and (B) distribution of the sequence along the a–a’ profile. Colored dots indicate earthquakes after the mainshock until 30 June 2015, where colors indicate time after the mainshock; black dots denote the three ≥ ML3.0 earthquakes that occurred in the first half of 2016. F1: Dengkou–Benjing Fault, F1’: branch fault I of F1, F1”: branch fault II of F1.
In summary, the eastern segment of the aftershock zone formed the main asperity of the seismogenic fault zone. The main rupture was initiated at the eastern segment of the fault, and propagated west, before being blocked by a barrier in the western section of the fault zone. Subsequently, the rupture crossed the barrier and continued for another 2 km. Between the mainshock and February 2016, there were very few aftershocks in the low seismicity zone, and those earthquake that did occur had very low magnitudes. It suggested that the barrier zone remained in a state of high stress until 24 March 2016, after which ML4.2, ML3.2, and ML4.1 earthquakes occurred. Therefore, the location and magnitude of larger aftershocks can be determined through the analysis of aftershock evolution.
Seismogenic structure
There is a significant lack of shallow seismic exploration and deep seismic reflection profiles in the study area. Moreover, the epicenter of the Alxa Ms 5.8 earthquake was located on the edge of a desert with no visible surface faults. As such, our results, which reveal the seismogenic structure of the Alxa Ms 5.8 earthquake sequence, offer a new basis data for further research in the study area.
Comprehensive analysis of cross-sectional focal depth profiles for the eastern and western fault segments (Figures 13A–C) was performed by combining the relocated earthquake locations, focal mechanism solutions (flat and profile projections), and fault interpretation results from adjacent profiles (Wen et al., 2011; Wen et al., 2013; Wen, 2014). The interpreted seismogenic structures of both segments generally show upward bifurcation, forming a negative flower structure that is commonly observed in strike-slip fault zones. This structure consists of the main seismogenic fault (F1’), the DBF (F1), and the main branch fault (F1″). F1′ is a blind fault trending N70°–75°E that dips steeply to the southeast. On the eastern segment of the aftershock zone (Figure 13B), there is an angle of ∼15° between F1 and F1′, and a maximum horizontal distance of ∼4 km was estimated. F1′ and F1″ are sub-parallel, with a maximum horizontal distance of 2.5 km. The dip angle of the structures becomes more gentle below the sub-vertical parts of F1 and F1″ at a depth of 25 km, and F1″ intersects the primary fault at a depth of 27–28 km. In the western segment of the aftershock zone (Figure 13C), F1′ and F1″ also exhibit an upward-bifurcating structure above 24 km depth, and are separated by a distance of 4 km above 20 km depth. A smaller secondary fault along which some ML2 aftershock activity occurred intersects with F1″ at ∼25 km depth.
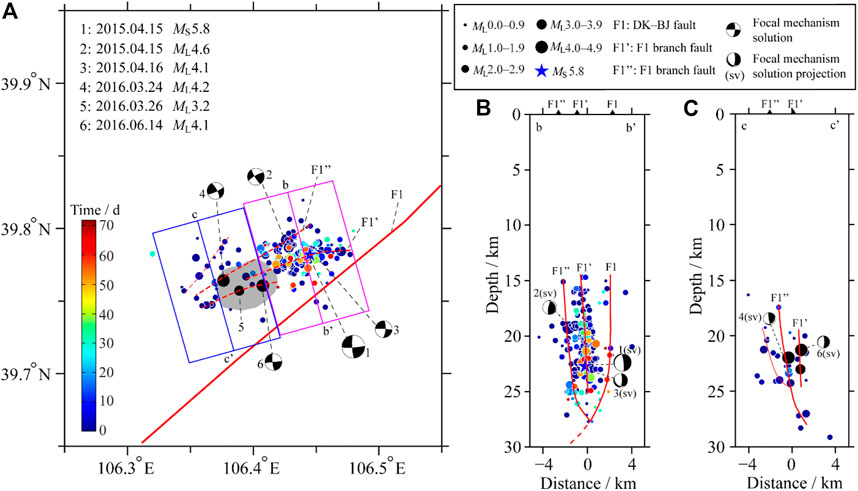
FIGURE 13. Epicenter distribution and segmentation structure of the seismogenic fault of the Alxa Left Banner Ms 5.8 earthquake sequence (A) Extent of two profiles across the seismogenic fault (B,C) Focal depths and interpreted profiles of b–b’ and c–c’, respectively. F1: Dengkou–Benjing fault, F1’: branch fault I of F1, and F1”: branch fault II of F1. Colored dots denote earthquakes from after the mainshock to 30 June 2015, where the color indicates the time after the mainshock; black dots indicate the three ≥ ML3.0 earthquakes that occurred in the first half of 2016. F1′ and F1″ are seismogenic fault interpretation results of the earthquake locations, focal mechanism solutions, and interpretation results for adjacent profiles, which are inferred faults.
Profile b–b’ (Figure 13B) illustrates that the mainshock and ML4.1 aftershock on 16 April 2015, occurred on steeply dipping fault F1’ (≥85°) at a depth of 22–23 km. The focal mechanism solutions of the two events are approximately consistent between one nodal plane and the F1′ fault surface at the corresponding seismic focus. The ML4.6 aftershock on 15 April 2015 occurred at a depth of ∼19 km on the F1″ fault; similarly, one nodal plane from this event’s focal mechanism is approximately consistent with the F1″ fault surface.
Profile c–c’ (Figure 13C) shows a small number of aftershocks along the main F1′ fault in the western segment of the aftershock zone. Due to the profile location within the low-seismicity barrier zone, only limited strain was released during the mainshock. This barrier zone was ultimately ruptured by the three large aftershocks. On 24 March 2016, an ML4.2 aftershock occurred at a depth of ∼22 km± on F1”. The profile projection of its focal mechanism shows that one nodal plane had consistent alignment with the F1” fault plane at the corresponding seismic focus. The ML4.1 aftershock on 14 June 2016, occurred at a depth of ∼21 km on F1’; as above, one nodal plane of the focal mechanism for this event was approximately consistent with the F1’ fault plane.
In summary, the mainshock rupture and aftershock activity of the Alxa Ms 5.8 earthquake were not controlled only by a single fault; activity was dominated by the main fault F1’; however, activity also occurred along branch fault F1” and other secondary faults. The seismogenic fault zone was a maximum of 4 km wide and 12 km long, with a complex structure. The main fault, F1′, is SE-striking, occurs at depths of 15–25 km, and forms an upward bifurcation structure (or a negative flower structure). During the mainshock, the fault moved predominantly in a strike-slip direction but with a component of oblique slip.
Very few large earthquakes have occurred in the study area and there are few supporting evidences of tectonic faults from deep seismic sounding or other studies; therefore, some uncertainties in the interpretation results of seismogenic structure could not be excluded; however, a Ms6.2 earthquake occurred in 1976 at a distance of 25 km from the Alxa Ms 5.8 epicenter. In future work, we plan to investigate the 1976 Bayinmuren Ms6.2 earthquake in more detail, including the relocation of small background earthquakes in order to improve our understanding of the seismogenic structure in this region.
5 Conclusion
In this study, data from permanent and campaign seismic arrays were used to examine the Alxa Ms 5.8 earthquake sequence. The number of earthquakes was dramatically increased compared with previous studies that used only data from permanent stations, and the completeness of the earthquake catalog was improved via the M&L method for micro-earthquake detection. An improved catalog provided a solid basis for a detailed study of this earthquake sequence.
The focal depth of the mainshock was 22.7 km, with aftershocks dominantly occurring between 15 and 25 km. The aftershock distribution spread in an NEE trending (N70°–75°E) over a length of 12 km. The aftershocks formed two distinct segments (the eastern and western segments). The mainshock and early aftershocks were mainly located on an eastern segment, while fewer aftershocks occurred on a western segment. Moreover, there was an area of low seismicity with a horizontal extent of ∼5 km between two segments. Most aftershocks occurred before 30 June 2015, after which the number of aftershocks declined significantly. Three larger aftershocks (ML4.2, ML3.2, and ML 4.1) occurred within the low-seismicity zone from March to June 2016.
The Alxa Ms 5.8 earthquake was caused by a blind, NEE-oriented western branch fault of the DBF. The eastern segment of the seismogenic fault zone formed the main asperity. The mainshock rupture started at the eastern end of the fault and propagated from east-to-west and from deep-to-shallow. There was an barrier zone in the western segment of the seismogenic fault zone with the low-seismicity region, illustrating that the rupture released only some of the accumulated stress. Subsequently, this barrier was ruptured on 24 March 2016, after which three successive large aftershocks occurred.
Data availability statement
The original contributions presented in the study are included in the article/supplementary material, further inquiries can be directed to the corresponding author.
Author contributions
XZ is the first author and the corresponding author. XL is contributed to the language improvement and the other coauthors contributed to the data calculation and analysis.
Funding
This work was supported by the Earthquake Science and Technology Spark Plan Project of China Earthquake Administration (XH21040, XH18053Y), Ningxia Natural Science Foundation Project (2022AAC03690) and the Innovative Teams of the Earthquake Agency of Ningxia Hui Autonomous Region [Grant number CX 2019-4(9)].
Acknowledgments
The earthquake catalog used in this paper comes from the China Seismic Networks Center, the waveform data was provided by China Seismic Array Data Management Center at Institute of Geophysics, China Earthquake Administration, and GMT software was used for data plotting.
Conflict of interest
The authors declare that the research was conducted in the absence of any commercial or financial relationships that could be construed as a potential conflict of interest.
Publisher’s note
All claims expressed in this article are solely those of the authors and do not necessarily represent those of their affiliated organizations, or those of the publisher, the editors and the reviewers. Any product that may be evaluated in this article, or claim that may be made by its manufacturer, is not guaranteed or endorsed by the publisher.
References
Aki, K. (1979). Characterization of barriers on an earthquake fault. J. Geophys. Res. 84 (B11), 6140–6148. doi:10.1029/jb084ib11p06140
Caciagli, M., Camassi, R., Danesi, S., Pondrelli, S., and Salimbeni, S. (2015). Can we consider the 1951 Caviaga (Northern Italy) earthquakes as noninduced events? Seismol. Res. Lett. 86 (5), 1335–1344. doi:10.1785/0220150001
Choi, H., and Noh, M. (2010). Source parameters of the may 2, 2009 andong earthquake in South Korea. Geosci. J. 14 (3), 269–276. doi:10.1007/s12303-010-0025-1
Clinton, J. F., Cua, G., Huerfano, V., Von Hillebrandt-Andrade, C. G., and Cruzado, J. M. (2006). The current state of seismic monitoring in Puerto Rico. Seismol. Res. Lett. 77 (5), 532–543. doi:10.1785/gssrl.77.5.532
Crotwell, H. P., Owens, T. J., and Ritsema, J. (1999). The Taup Toolkit: Flexible seismic travel-time and ray-path utilities. Seismol. Res. Lett. 70 (2), 154–160. doi:10.1785/gssrl.70.2.154
Daniels, C., and Peng, Z. (2022). Fault orientation and relocated seismicity associated with the 12 December 2018 Mw 4.4 Decatur, Tennessee, earthquake sequence. Seismol. Res. Lett. 93 (6), 3454–3467. doi:10.1785/0220220173
Dziewonski, A. M., and Anderson, D. L. (1981). Preliminary reference Earth model. Phys. Earth Planet. Inter. 25 (4), 297–356. doi:10.1016/0031-9201(81)90046-7
Fan, L. P., Li, B. R., Liao, S. R., Jiang, C., and Fang, L. H. (2022). High-precision relocation of the aftershock sequence of the January 8, 2022, MS 6.9 Menyuan earthquake. Earthq. Sci. 35 (2), 138–145. doi:10.1016/j.eqs.2022.01.021
Fang, L. H., Wu, J. P., Wang, W. L., Yang, T., and Wang, C. Z. (2015). Relocation of the 2014 MS7.3 earthquake sequence in yutian, xinjiang. Chin. J. Geophys. 58 (3), 802–808. (in Chinese). doi:10.6038/cjg20150310
Gao, X. W., Wan, Y. G., Huang, J. C., Li, X., and Cui, H. W. (2015). Tectonic stress field analysis and static coulmb stress changes of the Ms5.8 Inner Mongolias Alxa Left Banner earthquake. North China Earthq. Sci. 33 (2), 48–54. (in Chinese).
Gulen, L., Pınar, A., Kalafat, D., Özel, N., Horasan, G., Yılmazer, M., et al. (2002). Surface Fault breaks, aftershock distribution, and rupture process of the 17 august 1999 Izmit, Turkey, earthquake. Bull. Seismol. Soc. Am. 92 (1), 230–244. doi:10.1785/0120000815
Han, X. M., Liu, F., Zhang, F., Hu, B., and Chen, L. F. (2015). Source mechanism of the 2015 Alxa zuoqi Ms5.8 earthquake and its relocation. Acta Seismol. Sin. 37 (6), 1059–1063. (in Chinese). doi:10.11939/jass.2015.06.015
Hauksson, E., and Shearer, P. (2005). Southern California hypocenter relocation with waveform cross-correlation, Part 1: Results using the double-difference method. Bull. Seismol. Soc. Am. 95 (3), 896–903. doi:10.1785/0120040167
Hauksson, E., Yang, W., and Shearer, P. M. (2012). Waveform relocated earthquake catalog for southern California (1981 to June 2011). Bull. Seismol. Soc. Am. 102 (5), 2239–2244. doi:10.1785/0120120010
Kato, A., Fukuda, J., Nakagawa, S., and Obara, K. (2016). Foreshock migration preceding the 2016 Mw 7.0 Kumamoto earthquake, Japan. Geophys. Res. Lett. 43 (17), 8945–8953. doi:10.1002/2016GL070079
Klein, F. W. (2002). User’s guide to HYPOINVERSE-2000, a fortran program to solve for earthquake locations and magnitudes. U. S. Geol. Surv. 171, 1–123. Open-File Rept. 02–.
Konstantinou, K. I., Kalogeras, I. S., Melis, N. S., Kourouzidis, M. C., and Stavrakakis, G. N. (2006). The 8 January 2006 earthquake (Mw 6.7) offshore Kythira Island, Southern Greece: Seismological, strong-motion, and macroseismic observations of an intermediate-depth event. Seismol. Res. Lett. 77 (5), 544–553. doi:10.1785/gssrl.77.5.544
Konstantinou, K. I., Lee, S. J., Evangelidis, C. P., and Melis, N. S. (2009a2009). Source process and tectonic implications of the 8 January 2006 (Mw 6.7) Kythira earthquake, southern Greece. Phys. Earth Planet. Inter. 175, 167–182. doi:10.1016/j.pepi.2009.03.010
Konstantinou, K. I., Melis, N. S., Lee, S. J., Evangelidis, C. P., and Boukouras, K. (2009b). Rupture process and aftershocks relocation of the 8 June 2008 Mw 6.4 earthquake in northwest Peloponnese, Western Greece. Bull. Seismol. Soc. Am. 99 (6), 3374–3389. doi:10.1785/0120080301
Langin, W. R. (2003). Seismicity of central Tibet from project INDEPTH III seismic recordings. Bull. Seismol. Soc. Am. 93 (5), 2146–2159. doi:10.1785/0120030004
Laske, G., Masters, G., Ma, Z. T., and Pasyanos, M. (2013)., Vol. 15. Vienna: EGU. EGU General Assembly.Update on CRUST1.0-A1-degree global model of Earth’s crust
Lees, J. M., and Malin, P. E. (1990). Tomographic images of P wave velocity variations at Parkfield, California. J. Geophys. Res. 95 (B13), 21793–21804. doi:10.1029/JB095iB13p21793
Liu, M., Li, H. Y., Zhang, M., and Wang, T. L. (2020). Graphics processing unit-based Match and Locate (GPU-M&L): An improved match and locate method and its application. Seismol. Res. Lett. 91 (2A), 1019–1029. doi:10.1785/0220190241
Mandal, P., and Horton, S. (2007). Relocation of aftershocks, focal mechanisms and stress inversion: Implicaitons toward the seismo-tectonics of the causative fault zone of Mw7.6 2001 Bhuj earthquake (India). Tectonophysics 429, 61–78. doi:10.1016/j.tecto.2006.09.009
McMahon, N. D., Aster, R. C., Yeck, W. L., McNamara, D. E., and Benz, H. M. (2017). Spatiotemporal evolution of the 2011 Prague, Oklahoma, aftershock sequence revealed using subspace detection and relocation. Geophys. Res. Lett. 44 (14), 7149–7158. doi:10.1002/2017GL072944
Meng, X., Yang, H., and Peng, Z. (2018). Foreshocks, b value map, and aftershock triggering for the 2011 Mw 5.7 Virginia earthquake. J. Geophys. Res. Solid Earth 123, 5082–5098. doi:10.1029/2017JB015136
Mottaghi, A. A., Rezapour, M., and Yaminifard, F. (2010). Double-difference relocation of earthquake hypocenters along the southern flank of the central Alborz, Iran. Bull. Seismol. Soc. Am. 100 (5A), 2014–2023. doi:10.1785/0120090147
Peng, Z., and Zhao, P. (2009). Migration of early aftershocks following the 2004 Parkfield earthquake. Nat. Geosci. 2 (12), 877–881. doi:10.1038/ngeo697
Research Group of Active Fault System around the Ordos Massif (1988). Active Fault System around Ordos Massif. Beijing: Seismological Press. (in Chinese) 20–27.
Schoenball, M., and Ellsworth, W. L. (2017). Waveform-relocated earthquake catalog for Oklahoma and Southern Kansas illuminates the regional fault network. Seismol. Res. Lett. 88 (5), 1252–1258. doi:10.1785/0220170083
Scholz, C. H. (1990). The mechanics of earthquakes and faulting. New York: Cambridge University Press.
Shelly, D. R., Ellsworth, W. L., and Hill, D. P. (2016). Fluid-faulting evolution in high definition: Connecting fault structure and frequency-magnitude variations during the 2014 Long Valley Caldera, California, earthquake swarm. J. Geophys. Res. Solid Earth 121, 1776–1795. doi:10.1002/2015JB012719
Sippl, C., Schurr, B., Asch, G., and Kummerow, J. (2018). Seismicity structure of the northern Chile forearc from >100,000 double-difference relocated hypocenters. J. Geophys. Res. Solid Earth 123, 4063–4087. doi:10.1002/2017JB015384
Song, C., and Ge, Z. X. (2018). An iterative travel time inversion and waveform modeling method to determine the crust structure and the focal mechanism of 2015 Alxa Left Banner Ms5.8 earthquake. Chin. J. Geophys. 61 (4), 1225–1237. (in Chinese). doi:10.6038/cjg2018L0655
Syracuse, E. M., Holt, R. A., Savage, M. K., Hohnson, J. H., Thurber, C. H., Unglert, K., et al. (2012). Temporal and spatial evolution of hypocentres and anisotropy from the darfield aftershock sequence: Implications for fault geometry and age. N. Z. J. Geol. Geophys. 50 (3), 287–293. doi:10.1080/00288306.2012.690766
Tang, T., Li, B. R., Fang, L. H., Su, Y. J., Zhong, Y. S., Yang, J. Q., et al. (2022). Relocation of the foreshocks and aftershocks of the 2021 MS 6.4 Yangbi earthquake sequence, Yunnan, China. J. Earth Sci. 33 (4), 892–900. doi:10.1007/s12583-021-1527-7
Waldhause, F., and Ellsworth, W. L. (2000). A double difference earthquake location algorithm: Method and application to the north Hayward fault, California. Bull. Seismol. Soc. Am. 90 (6), 1353–1368. doi:10.1785/0120000006
Waldhauser, F., and Ellsworth, W. L. (2002). Fault structure and mechanics of the Hayward fault, California, from double-difference earthquake locations. J. Geophys. Res. 107 (B3), ESE 3-1–ESE 3-15. doi:10.1029/2000jb000084
Waldhauser, F., and Schaff, D. P. (2008). Large-scale relocation of two decades of Northern California seismicity using cross-correlation and double-difference methods. J. Geophys. Res. 113 (B08311). doi:10.1029/2007JB005479
Wang, T. L., Liu, M., Li, H. Y., Cui, B. W., and Zhong, S. J. (2019). Relocation of the aftershock sequence and activity of the Ms 5.8 Alxa earthquake. Chin. J. Geophys. 62 (2), 2038–2047. (in Chinese). doi:10.6038/cjg2019N0024
Wei, J. M., Han, X. M., Zhang, F., and Li, T. (2017). The sequence character of alashan left banner Ms5.8 earthquake on April 15, 2015. Seismol. Geomagnetic Observation Res. 37 (1), 32–37. (in Chinese). doi:10.3969/j.issn.1003-3246.2017.01.006
Wen, X. Z., Du, F., Long, F., Fan, J., and Zhu, H. (2011). Tectonic dynamics and correlation of major earthquake sequences of the Xiaojiang and Qujiang-Shiping fault systems, Yunnan, China. Sci. China Earth Sci. 41 (5), 1563–1575. (in Chinese). doi:10.1007/s11430011-4231-0
Wen, X. Z., Du, F., Yi, G. X., Long, F., Fan, J., Yang, P. X., et al. (2013). Earthquake potential of the Zhaotong and Lianfeng fault zones of the eastern Sichuan-Yunnan border region. Chin. J. Geophys. 56 (10), 3361–3372. (in Chinese). doi:10.6038/cjg20131012
Wen, X. Z. (2014). Structures of source regions of the 1979 Ms6.0 wuyuan earthquake and the 1996 Ms6.4 baotou earthquake in inner Mongolia, China. Seismol. Geol. 36 (3), 586–597. (in Chinese). doi:10.3969/j.issn.0253-4967.2014.03.004
Wu, P. P., Chang, L. J., Lu, L. Y., Guo, H. L., Lv, M. M., and Ding, Z. F. (2022). Three-dimensional fine velocity structure of the upper crust of the 2021 Madoi Ms7.4 earthquake, Qinghai. Chin. J. Geophys 65 (6), 2006–2021. (in Chinese). doi:10.6038/cjg2022P0860
Yao, D. D., Huang, Y. H., Peng, Z. G., and Castro, R. R. (2020). Detailed investigation of the foreshock sequence of the 2010 Mw7.2 El Mayor-Cucapah earthquake. J. Geophys. Res. Solid Earth 124, e2019JB019076. doi:10.1029/2019jb019076
Yao, D., Huang, Y., and Fox, J. L. (2021). New insights into the Lake Erie fault system from the 2019 ML 4.0 Ohio earthquake sequence. Seismol. Res. Lett. 92 (4), 2531–2539. doi:10.1785/0220200335
Zeng, X. W., Feng, J. G., Long, F., and Xin, H. L. (2017a). Research on mid-upper crustal velocity tomography of Pg wave in wstern margin of Ordos. J. Seismol. Res. 40 (2), 261–270. (in Chinese).
Zeng, X. W., Feng, J. G., and Lv, J. Q. (2014). Characteristics of lateral variation of Pg wave velocity before and after the 2003 Minle Ms6.1 earthquake. Prog. Geophys. 29 (4), 1601–1608. (in Chinese). doi:10.6038/pg20140415
Zhang, M., and Wen, L. X. (2015a). An effective method for small event detection: Match and locate (M&L). Geophys. J. Int. 200 (3), 1523–1537. doi:10.1093/gji/ggu466
Zhang, M., and Wen, L. X. (2015c). Earthquake characteristics before eruptions of Japan’s Ontake volcano in 2007 and 2014. Geophys. Res. Lett. 42 (17), 6982–6988. doi:10.1002/2015gl065165
Zhang, M., and Wen, L. X. (2015b). Seismological evidence for a low-yield nuclear test on 12 May 2010 in North Korea. Seismol. Res. Lett. 86 (1), 138–145. doi:10.1785/02201401170
Zhang, Y., An, Y., Long, F., Zhu, G., Qin, M., Zhong, Y., et al. (2021). Short-term foreshock and aftershock patterns of the 2021 Ms 6.4 Yangbi earthquake sequence. Seismol. Res. Lett. 93, 21–32. doi:10.1785/0220210154
Zhao, B., Gao, Y., Huang, Z. B., Zhao, X., and Li, D. H. (2013). Double difference relocation, focal mechanism and stress inversion of Lushan Ms 7.0 earthquake sequence. Chin. J. Geophys. 56 (10), 3385–3395. (in Chinese). doi:10.6038/cjg20131014
Zhao, L. S., and Helmberger, D. V. (1994). Source estimation from broadband regional seismograms. Bull. Seismol. Soc. Am. 84 (1), 91–104. doi:10.1029/93JB02965
Keywords: double-difference (DD) location, match and locate (M&L) method, aftershock evolution, barrier, seismogenic structure
Citation: Zeng X, Li X, Li M and Li W (2023) Investigation of the 2015 Ms5.8 Alxa Left Banner earthquake sequence: Aftershock evolution and seismogenic structure. Front. Earth Sci. 11:1082680. doi: 10.3389/feart.2023.1082680
Received: 28 October 2022; Accepted: 23 January 2023;
Published: 03 February 2023.
Edited by:
Fuqiong Huang, China Earthquake Networks Center, ChinaReviewed by:
Lihua Fang, Institute of Geophysics, China Earthquake Administration, ChinaGuixi Yi, Sichuan Earthquake Administration, China
Copyright © 2023 Zeng, Li, Li and Li. This is an open-access article distributed under the terms of the Creative Commons Attribution License (CC BY). The use, distribution or reproduction in other forums is permitted, provided the original author(s) and the copyright owner(s) are credited and that the original publication in this journal is cited, in accordance with accepted academic practice. No use, distribution or reproduction is permitted which does not comply with these terms.
*Correspondence: Xianwei Zeng, emVuZ194d0AxMjYuY29t