 Linlin Cao
 Changchun Xu1,2*
 Nanji Suo
- 1College of Geography and Remote Sensing Science, Xinjiang University, Urumqi, China
- 2Xinjiang Key Laboratory of Oasis Ecology, Xinjiang University, Urumqi, China
Understanding the future drought condition is critical to coping with the challenge of climate change. This study evaluated the simulation capability of 30 Global Climate Models (GCMs) provided by the Coupled Model InterComparison Project Phase 6 (CMIP6) in simulating precipitation (P), potential evapotranspiration (PET) and temperature (T) in arid Central Asia (ACA), and estimated the dry-wet climatic characteristics and trends under four SSP-RCPs (Shared Socio-economic Path-Representative Concentration Path scenarios, SSP126, SSP245, SSP370, and SSP585). Results show that the 30 CMIP6 GCMs have robust simulation ability for precipitation, potential evapotranspiration, and temperature (p < 0.01) over arid Central Asia. The delta-corrected multi-model ensemble mean (Delta-MME) outperforms GWR-corrected one (GWR-MME) and single models. In the future, the precipitation, potential evapotranspiration, and temperature will increase at different rates under the four SSP-RCPs. Uzbekistan, Kazakhstan, Kyrgyzstan and Tajikistan are the regions with faster precipitation and temperature rise, and the northern of arid Central Asia are the main area with the rapid growth of potential evapotranspiration. Arid Central Asia will face more severe drought, especially under high emission scenarios. In the near-term the drought will reduce at a certain extent, but the trend of drought will still be prominent in the mid and long term. Overall, drought in arid Central Asia will show an overall characteristic of decreasing drought number but increasing drought frequency, drought duration, and drought intensity. Drought risk is likely to be higher in Xinjiang of China, Turkmenistan and Uzbekistan. The research can provide a scientific basis for the decision-making of water resources planning and management and socio-economic development of arid Central Asia.
1 Introduction
In the context of global warming, climate change is attracting the attention of scholars around the world (Zhao et al., 2021; Rakovec et al., 2022; Wu et al., 2022). The Intergovernmental Panel on Climate Change (IPCC, 2021) stated in its sixth Assessment Report that global surface temperature (GST) was 0.99°C (0.84–1.10°C) higher in 2001–2020 than in 1850–1900, and yet GST was 1.09°C (0.95–1.20°C) higher in 2011–2020 than in 1850–1900. The global average temperature rise will intensify the hydrological cycle, and precipitation will increase at an unevenly distributed rate across the globe. The increase in temperature will be accompanied by the increase in evaporation. When the increasing trend of precipitation is lower than that of evaporation, the drought risk will increase and lead to the change in dry and wet climate in the world. Since the mid-20th century, drought has been increasing in frequency and severity in many regions of East Asia, South Asia, Africa, southern Europe, western South America, eastern Australia and northern Australia, with serious impacts on agricultural production, human activities and ecological environment (Wang et al., 2021; Lee et al., 2022). Thus, it is of great practical significance to grasp the trend and characteristic of future dry-wet climate to cope with global warming.
Global climate simulation and prediction is an important part of climate change research. The Coupled Simulation Working Group of the World Climate Research Program (WCRP) organized the Coupled Model Intercomparison Project Phase 6 (CMIP6), which differs from previous ones in that CMIP6 has a large number of participating models, a rich set of numerical experiments and a large amount of simulation datasets. The Scenario Model Intercomparison Project (ScenarioMIP) is an important sub-project proposed by CMIP6 (Zhou, 2020). Climate change predictions become more relevant and meaningful when simulations with reference data are considered (Oruc, 2022). However, there can be substantial uncertainties in model simulations. The emergent constraint method mainly uses multi-model integration to identify the relationship between past and future climate change to reduce the uncertainty of prediction. The common method is to use multi-model ensemble mean (MME) as the consensus among multiple models to eliminate the uncertainty caused by heterogeneous internal variability among models. MME can be affected by outliers with extremely high or low values. Therefore, the bias correction methods are often applied to calibrate model results to produce better fitted climate predictions (Hu et al., 2021; Jaiswal et al., 2022).
Arid Central Asia (ACA) has been widely concerned as a significant response area to global warming. Studies have shown that since the late 1940s, the temperature of global dryland has increased by 1.2°C, the potential evapotranspiration has risen sharply at a rate of 5.2 mm per decade, but the overall change in precipitation is not obvious (Li et al., 2019). In dryland Asia, the annual average temperature increased by 1.7°C from 1901 to 2018 and the annual total precipitation increased slightly from 388 to 435 mm, at a rate of 0.14°C/10a and 4.0 mm/10a, respectively (Miao et al., 2020). ACA is extremely sensitive to global warming. A general warm and dry trend for the region occurred between 1901 and 2002, particularly in the western part of Uzbekistan and Turkmenistan, central Kazakhstan, southern Xinjiang of China, and central Mongolia (Wang et al., 2010). The research on global climate change in the next 100 years based on the dryness index (AI) found that under the influence of climate change, the area of global wet zone will decrease, and the area of global drying trend will gradually increase in the future (Asadi Zarch et al., 2017). The previous study based on GCMs under RCP4.5 reveals that the projected temperature shows an ascending trend at a rate of 0.37°C/10a and the projected precipitation shows a general increasing trend at a rate of 4.63 mm/10a (Luo et al., 2019). The future drought under three shared socioeconomic paths (SSP126, SSP245, and SSP585) will became more severe with the increase in emissions from the future climate projections of CMIP6 (Miao et al., 2020; Li et al., 2021). Under the two SSPs (SSP245 and SSP585), both precipitation and evapotranspiration will increase during the whole of the 21st century. However, the increase in evapotranspiration is projected to exceed the increase in precipitation since 2030, which will result in enhanced drought conditions (Hua et al., 2022). The drought frequency will decrease in the near future and increase in the middle and later periods in future 100 years in five Central Asian countries based on the CMIP5 data and the Standardized Precipitation Evapotranspiration Index (SPEI) (Ta et al., 2022).
Given the large uncertainties in variability and geographical distribution of a single climatic factor, there is an urgent need to work with more climatic factors and a new generation of experimental climate model data at this stage. Considering improvements in CMIP6, the latest GCMs has more reliable prediction of drought characteristics in ACA. Currently, there have been a number of studies concerned with the change in climate and drought of ACA in recent years, the raw and uncorrected CMIP6 model data are often used directly even with the multi-model ensemble, which may cause a large deviation in simulation results. This study firstly compared the performance of two bias correction methods in simulating multiple climatic factors. Then employing the winner to conduct the subsequent research, which could reduce the deviation amplitude to a certain degree, despite the same rough trend with other studies. Besides, up to 30 models are used in this study to examine the simulation performance, which could enrich the evidence of CMIP6 model in regional application for future improvements. To achieve the purposes above, this paper is organized as follows: 1) evaluate the performance of 30 CMIP6 GCMs and bias-corrected MME in ACA; 2) investigate the spatial-temporal variations and characteristics of precipitation, potential evapotranspiration and temperature under four SSP-RCPs (SSP126, SSP245, SSP370, and SSP585) during 2015–2100; 3) construct the 1-month and 12-month SPEI time series, and analyzed the dry-wet climatic characteristics and drought trend in 2015–2100.
2 Materials and methods
2.1 Study area
ACA includes Xinjiang of China/XJ CHN and five Central Asian countries, i.e., Kazakhstan/KAZ, Kyrgyzstan/KGZ, Uzbekistan/UZB, Turkmenistan/TKM and Tajikistan/TJK (as six subregions). It covers the area ranging from 34°N to 55°N and from 45°E to 96°E (Figure 1). The region is the largest arid area in the world across continental temperate zone and warm temperate zone in the northern hemisphere. It is characterized by the mountain-basin structure with oases scattered in deserts. Lots of famous mountains, basins and deserts are located, such as the Tianshan Mountains, Pamir Plateau, Taklimakan Desert, and Turan Plain, and so on. River systems are widely developed, including the Aral Sea, Balkhash Lake, Amu Darya River, Syr Darya River, Tarim River, Irtysh River and others. The geographical location of ACA makes it less affected by ocean. Controlled by the westerly circulation, water vapor mainly comes from the Atlantic and Arctic oceans (Hu et al., 2021). The average temperature is 5.4°C, the annual precipitation is 282 mm, and the potential evapotranspiration is close to 1,000 mm over the last 100 years in ACA (Dilinuer and Li, 2018; He et al., 2021).

FIGURE 1. Spatial location, administrative region and elevation of arid Central Asia.
2.2 Data
2.2.1 Observation data
2.2.1.1 GPCC
The precipitation dataset is obtained from Global Precipitation Climatology Centre (GPCC) provided by NOAA ESRL, which is a monthly total precipitation (precip) dataset with time range of 1891–2020 and resolution of 0.5°× 0.5° (Schneider et al., 2017). The GPCC product is reconstructed from gauge observations from about 6,000 to over 50,000 stations, which has been proved to have good applicability in ACA (Dilinuer et al., 2021; Song et al., 2022). The data of 1961–2014 are selected as historical period observations for evaluating the performance of CMIP6 model data in simulating precipitation, and calculating the historical SPEI series.
2.2.1.2 CRU
The latest v4.05 datasets from the Climatic Research Unit (CRU) at the University of East Anglia are used, including the monthly temperature (tmp) and potential evapotranspiration (pet) from 1901 to 2020, with the resolution of 0.5°× 0.5° (Harris et al., 2020). The data of 1961–2014 are selected as historical period observations for the capability assessment of CMIP6 in simulating temperature and potential evapotranspiration and calculating the historical SPEI series.
2.2.1.3 DEM
The SRTM data are used as elevation data, which is jointly measured by the National Aeronautics and Space Administration (NASA) and the National Imagery and Mapping Agency (NIMA), with an initial resolution of 90 m. In this study, it is resampled to 0.5°×0.5° consistent with other variables, to calculate the potential evapotranspiration of CMIP6.
2.2.2 CMIP6 data
The model data used in this study are CMIP6 GCMs (https://esgf-node.llnl.gov/search/cmip6/). Taking variables, time and scenarios into consideration 30 models are selected (Table 1). Variables include monthly precipitation, average temperature, maximum temperature, minimum temperature, relative humidity, wind speed, and downward short-wave radiation. The “historical” (1850–2014) simulations conducted as part of the core DECK experiments are used in the historical phase (1961–2014) of this study, and the four SSP-RCPs (2015–2100) data under Tier-1 trial in ScenarioMIP are used in the future phase (2015–2100). To take full account of future relative historical changes, we also pay special attention to changes in the last 75 years of this century, which are divided into three periods, the near-term (NT, 2026–2050), the mid-term (MT, 2051–2075), and the long-term (LT, 2076–2100). A more detailed picture of the changes is obtained by comparing it with the historical reference period (1986–2010).
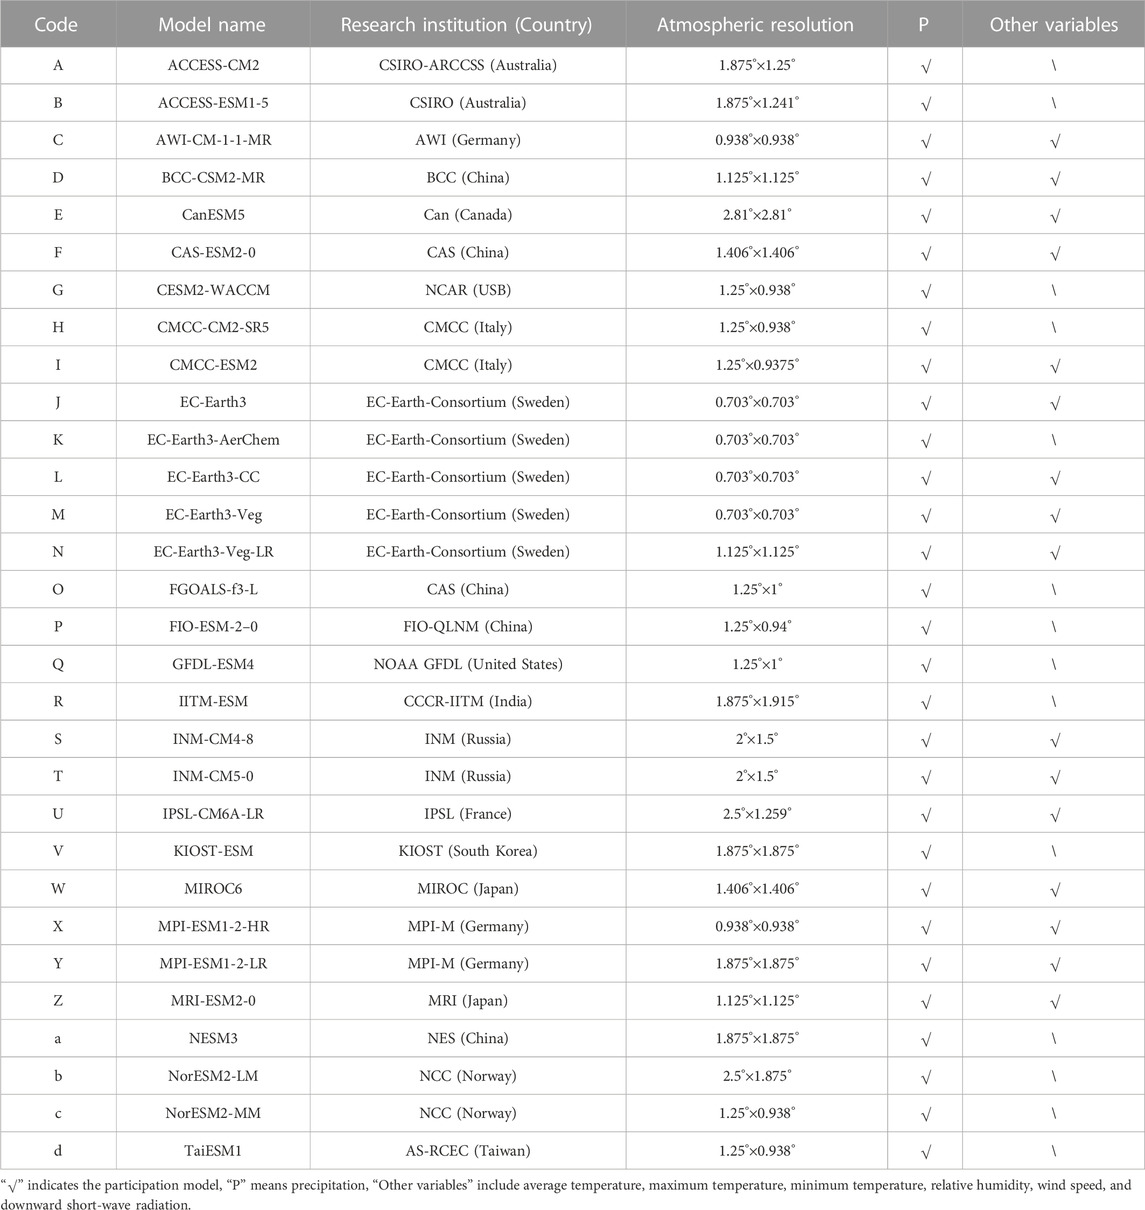
TABLE 1. CMIP6 GCMs used in this study.
To ensure the integrity and consistency of data, the model data used in this study are all monthly data under “r1i1p1f1,” which means the realization number 1 (r1), initialization method indicator 1 (i1), perturbed physics number 1 (p1) and forcing number 1 (Long et al., 2021; Al-Yaari et al., 2022). The SSP126 (+2.6Wm−2, low forcing scenario), SSP245 (+4.5Wm−2, medium forcing scenario), SSP370 (+7.0Wm−2, medium to high forcing scenario) and SSP585 (+8.5Wm−2, high forcing scenario) are selected, representing sustainability, middle of the road, regional rivalry and fossil fuel development path, respectively. Due to the differences in the resolution of the 30 climate models, the CMIP6 data are preprocessed to 0.5°× 0.5° by the bilinear interpolation to facilitate the calculation of PET and the performance evaluation of models.
2.3 Methods
2.3.1 Bias correction
2.3.1.1 Delta
The basic principle of the method is to superimpose the variability characteristics of observed climate elements onto the model climate element sequence. Taking precipitation as an example, the model simulation data are compared with the observed data grid by grid, the absolute rate of change in precipitation is calculated for each grid, and then applied to the model simulation data (Jose and Dwarakish, 2022; Oruc, 2022).
In the equation,
2.3.1.2 Geographically Weighted Regression (GWR)
Build a regression model between the dependent variables (observed data) and the explanatory variables (model data and multiple topographic factors) for each grid through the spatial non-stationarity (Lu et al., 2019; Sun et al., 2022).
where,
2.3.2 SPEI calculation
The Standardized Precipitation Evapotranspiration Index (SPEI) is used to represent the probability of difference between precipitation and evapotranspiration in a certain time range. The index not only considers the sensitivity of evapotranspiration to temperature, but also has the advantages of being suitable for multi-scale and multi-space comparison and high accuracy, which makes it an ideal index for drought research under the background of global warming (Musei et al., 2021; Morsy et al., 2022). In general, three calculation methods are used for potential evapotranspiration, including Thornthwaite, Penman-Monteith (P-M) and Hargreaves. The P-M method, recommended by the Food and Agriculture Organization of the United Nations (FAO), is a physically based method taking radiometric and aerodynamic variables into account. It is an accurate and reliable approximation of PET (Wang et al., 2016). In this study, the P-M method is used to calculate PET (Chen et al., 2015; Yin et al., 2021).
where
The calculation of SPEI is to establish the accumulation of water gains and losses at different time scales by calculating the difference between potential evapotranspiration and rainfall per unit time, and finally normalize the data series. In this study, 1-month timescale and 12-month timescale SPEI are used for analysis. The former fluctuates strongly, which can characterize the inter-monthly variation in dry and wet, and can be used for the identification of finer drought events. The latter is relatively stable, which is often used to analyze the inter-annual variation characteristics of dry and wet. When the temporal change is analyzed, the SPEI is the mean of the whole region.
2.3.3 Trend and significance detection
Theil-Sen Median (TSM) is a robust non-parametric statistical trend calculation method. The fundamental principle is to assess the trend and degree of sequence by calculating the median of slope of data combination (Chatterjee and Olkin, 2006; Rosner and Glynn, 2007). The slope is given by:
In the formula,
The Mann-Kendall (M-K) trend test is a non-parametric way to detect the trend of a sample time series. As its low sensitive to outliers, not requiring the sample series to conform to a specific distribution and allowing for missing values, the M-K method is widely used for trend significance test in climatological studies (Hamed, 2009). The statistic is expressed by Z value. The significance test level is 0.05 in this study.
2.3.4 Run theory
In this study, drought events are identified using the three-threshold run theory to determine the beginning, duration and end of drought events. The three-threshold method is better to identify drought events than the traditional single-threshold method. Referring to previous studies (Wu et al., 2019; Song et al., 2021b), the optimal thresholds are set as R1=−0.3, R2=−0.5, and R3=0, and the steps for identifying drought events in this study are developed. The details are as follows.
(1) Preliminary identification of drought events: when the drought index is lower than R1=−0.3, the occurrence of drought is preliminarily determined, and drought events in the total time series are screened;
(2) Elimination of non-drought events: if the drought event lasts only 1 month and the drought index value is lower than R2=−0.5, the event is retained; Otherwise, it is eliminated;
(3) Merger of drought events: when the time interval of adjacent drought events is only 1 month and the drought index of that month is less than R3=0, they will be combined as one drought event. Otherwise, they are treated as two separate drought events.
When the three thresholds are exceeded, a drought event (DN) is considered occurred. Drought duration (DD) is the continuance from the beginning to the end of drought events in the time series. Drought intensity (DI) is the negative number of the sum of negative runs in drought events. Drought frequency (DF) is defined as the ratio of drought duration to the total length of time series in this study, which can intuitively reflect the change in drought risk to a certain extent (Figure 2).
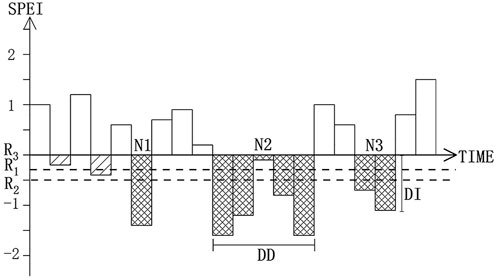
FIGURE 2. Drought events and characteristic parameters identified by the three-threshold run theory. Drought event (N1, N2, and N3), drought duration (DD), drought intensity (DI).
3 Results
3.1 Simulation capability assessment
3.1.1 Single-model
The applicability of 30 CMIP6 GCMs in ACA was evaluated using standard deviation (SD), root mean square error (RMSE) and Pearson correlation coefficient (r). It shows that the simulation ability of the models for each variable is different, and the performance of simulation ability of each model is also different even under the same variable (Table 2). There is a large difference in the precipitation (P) simulation performance between all climate models, but a small difference in the potential evapotranspiration (PET) and temperature (T) simulation. Overall, the 30 climate models have a good simulation ability in simulating P, PET and T, and all the models pass the 0.01 significance test.
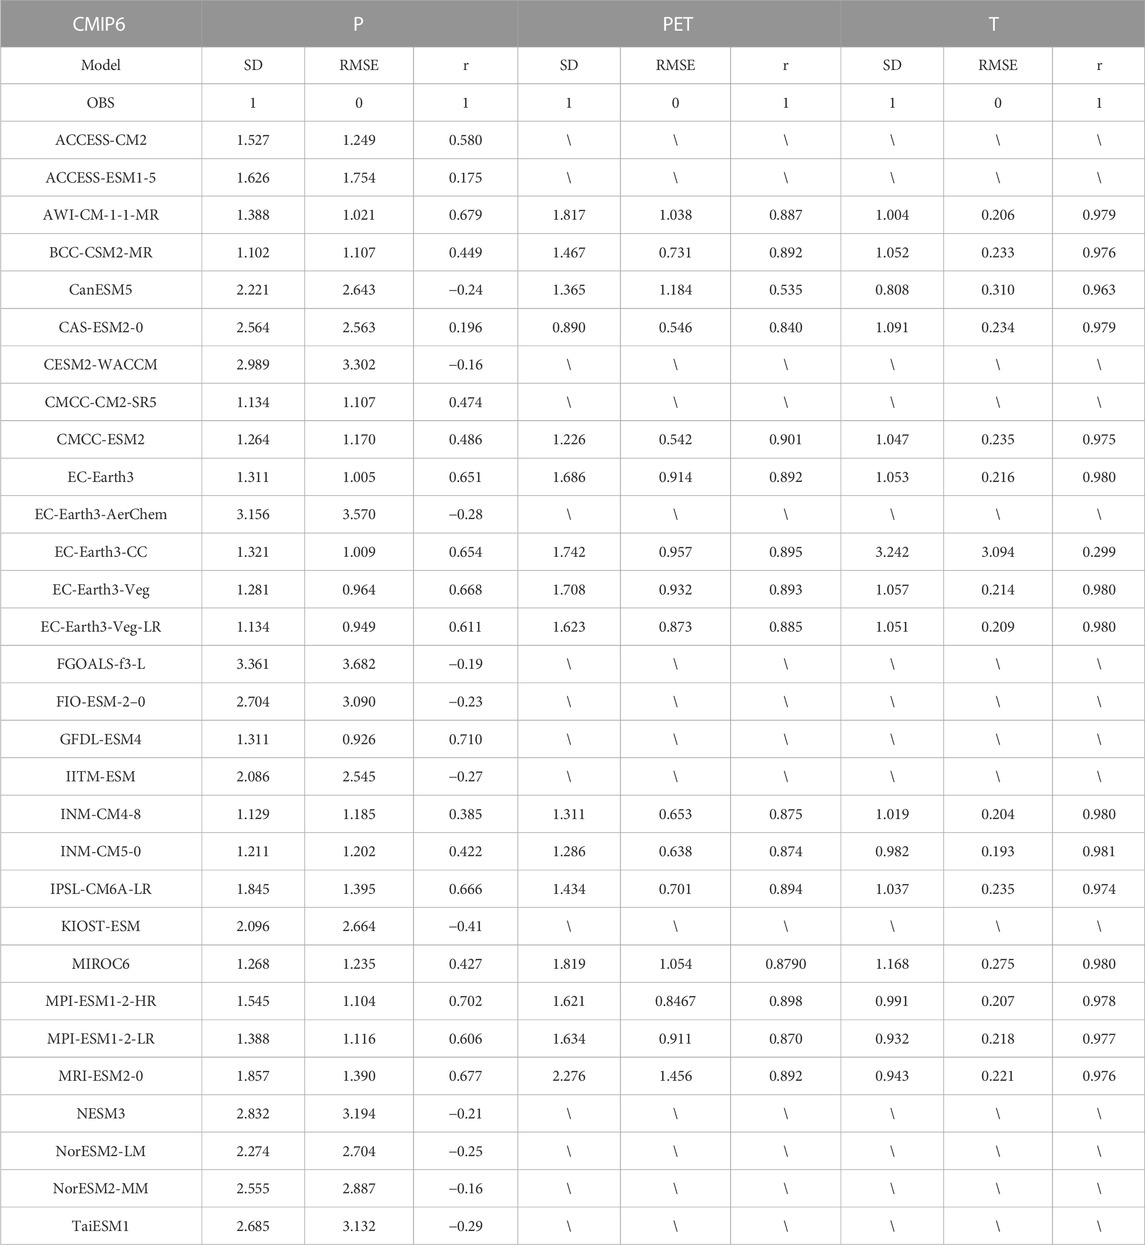
TABLE 2. Simulation capability of 30 CMIP6 GCMs in precipitation (P), potential evapotranspiration (PET) and temperature (T).
3.1.2 Multi-model ensemble and bias correction
The availability of the time span (1961–2100), scenarios (SSP126, SSP245, SSP370, and SSP585) and the coverage of study area, a certain number of models for each variable were selected to establish an ensemble mean. The number of models for P, PET, and T is 13, 7 and 7, respectively.
The simulation capability of selected models in reproducing P, PET, and T can be clearly seen in standardized Taylor diagram (Figure 3). The multi-model ensemble mean (MME) is the arithmetical mean of each variable of CMIP6 GCMs. The spatial r between the P-MME, PET-MME, T-MME and the observed one are 0.62, 0.91, and 0.98, respectively. Considering the uncertainty of the MME, this study used two bias correction methods, delta and GWR, to correct the MME of each variable. The spatial r between the GWR-corrected MME of P and the observed is 0.81, and meanwhile the RMSE and SD are 0.60 and 0.87, respectively. Those for PET are 0.71, 1.62, 0.99 and those for T are 0.98, 0.29, 0.75, respectively. The SD decreases after the GWR correction. Similarly, the spatial r, RMSE and SD by the delta-corrected MME of P is 0.98, 0.19, and 1.07, respectively. Those for PET are 0.99, 0.05, 1.84 and those for T are 0.99, 0.16, 0.99, respectively. The simulation ability results shows that the delta-corrected MME outperforms the GWR-MME and the single models for all variables. The delta-corrected MME can better capture the spatial pattern of P, PET and T in ACA.
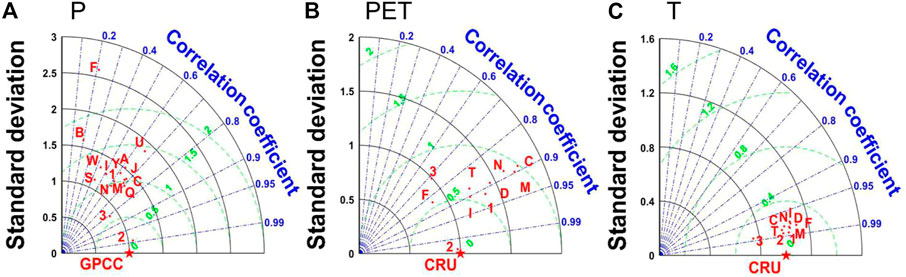
FIGURE 3. Simulation capability of single models shown in Standardized Taylor diagram for (A) precipitation (P), (B) potential evapotranspiration (PET) and (C) temperature (T). Letters denote single models, details seen Table 1; Arabic numbers denote multi-model ensemble mean,1 is MME, 2 is delta-corrected MME and 3 is GWR-corrected MME.
3.2 Future projections of climatic factors
3.2.1 Temporal change
In the historical period (1961–2014), the observed P from GPCC data showed an increasing trend at a rate of 3.15 mm/10a by an increasement of 17.03 mm in ACA. Meanwhile, the PET from CRU data decreased by 0.59 mm at a rate of 0.11 mm/10a, and the T from CRU data increased from 7.05°C to 7.14°C with a rate of 0.016°C/10a. It is not hard to see that the ACA is likely to warm in the future (Figure 4).
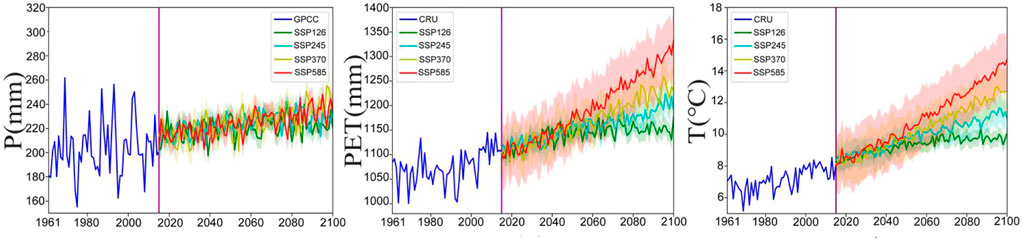
FIGURE 4. Temporal changes in precipitation (P), potential evapotranspiration (PET), and temperature (T) during the historical period (1961–2014) and the future period (2015–2100) under four SSP-RCPs in ACA. The shaded area is the corresponding standard deviation.
In the future period (2015–2100), the P, PET, and T consistently show an increasing trend. The increase rate of P is 2.23 mm/10a, 3.40 mm/10a, 3.60 mm/10a and 3.62 mm/10a for SSP126, SSP245, SSP370, and SSP585, respectively. The increase rate of P under the four SSP-RCPs have a smaller gap. Overall, the increase in P is gently. The increase rate of PET under the four SSP-RCPs is 8.44 mm/10a, 8.94 mm/10a, 14.58 mm/10a, and 26.99 mm/10a, respectively, significantly increasing with the intensify of radiative forcing. Meanwhile, T increases by 1.89°C, 2.57°C, 4.61°C, and 6.76°C, or a warming rate of 0.22°C/10a, 0.30°C/10a, 0.54°C/10a, and 0.79°C/10a, respectively. On the whole, the increase rate of PET is much higher than that of P, indicating that drought will be strongly intensified in the future in the context of rising temperature, especially under high emissions.
For the six subregions, the future change in each climatic factor is different due to the various geographical locations and topographic conditions (Figure 5). The increase rate of P ranges from 0.71 to 8.21 mm/10a, with a strong spatial and temporal heterogeneity. The fastest increase rate is in Tajikistan, followed by Kyrgyzstan, Kazakhstan, Uzbekistan, Turkmenistan, and Xinjiang of China. The increase rate of PET is from 5.68 to 33.43 mm/10a, with the highest increase in Uzbekistan, followed by Turkmenistan, Kazakhstan, Kyrgyzstan, Tajikistan and Xinjiang of China. The increase rate of T is from 0.19 to 0.83°C/10a, with the most intense warming in Kazakhstan, followed by Kyrgyzstan, Xinjiang of China, Uzbekistan, Turkmenistan and Tajikistan. Combined, the faster rising P and T is in Uzbekistan, Kazakhstan, Kyrgyzstan and Tajikistan, while the rapid increase in PET is mainly in the northern of ACA.
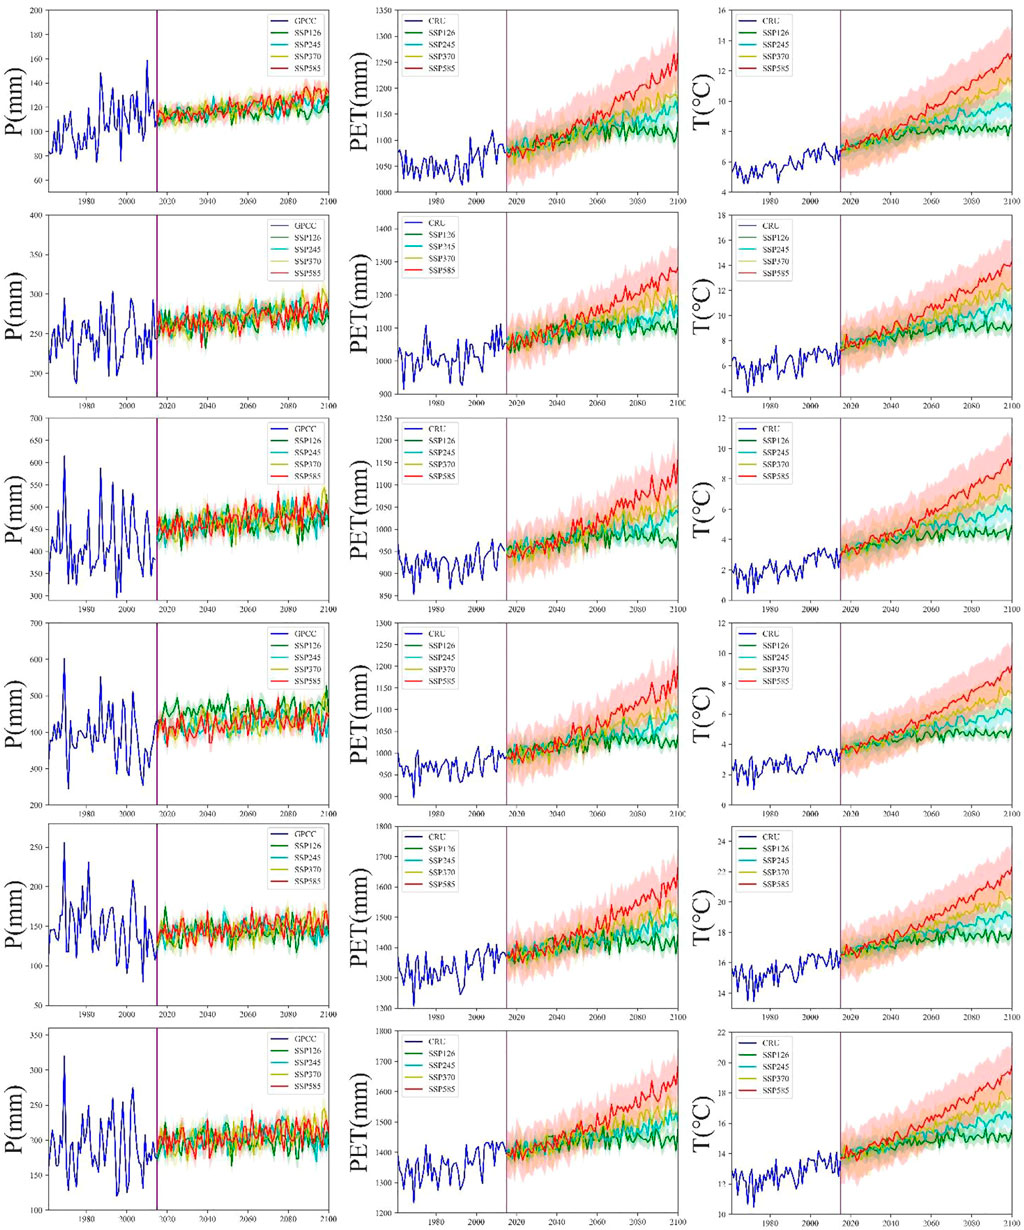
FIGURE 5. Temporal changes in precipitation (P), potential evapotranspiration (PET) and temperature (T) during the future period (2015–2100) under four SSP-RCPs in six subregions. XJ CHN (row 1), KAZ (row 2), KGZ (row 3), UZB (row 4), TKM (row 5), TJK (row 6). The shaded area is the corresponding standard deviation.
3.2.2 Spatial variation
Compared with the historical reference period (1986–2010), the P, PET and T in near-term (NT), mid-term (MT) and long-term (LT) under four SSPs mainly show increasing trend in most area of ACA, which is particularly evident over time and under higher emissions.
Specifically, the widespread increase in P is mainly observed over Kazakhstan, Kyrgyzstan and Tajikistan, with P increased about 10–30 mm. A slight increase in P is seen in the other three subregions. In particular, the northern Xinjiang of China has a decreased p less than 20 mm in NT and MT, showing a weak drying trend (Figure 6). In terms of PET, it appears a general feature of less increase in east and more increase in west. Thus, the regions with large increased PET are mainly seen over the western Kazakhstan, Uzbekistan and Turkmenistan (Figure 7). As to temperature, it shows a general characteristic of more increase in north and less increase in south. The significantly increased T is observed in northern and western Kazakhstan, northern Xinjiang of China, with the 2–4°C increment in NT and MT and even more than 4.5°C in LT (Figure 8).
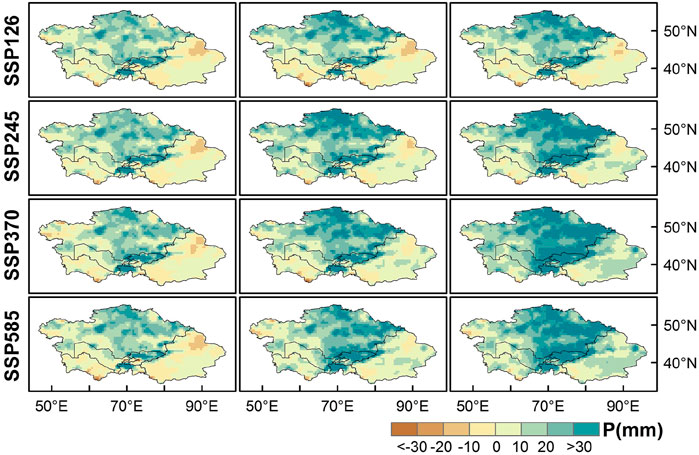
FIGURE 6. Spatial variations in annual total precipitation (P) under SSP126, SSP245, SSP370, and SSP585 in near-term (2026–2050, column 1), mid-term (2051–2075, column 2), and long-term (2076–2100, column 3) relative to the historical reference period (1986–2010) in ACA.
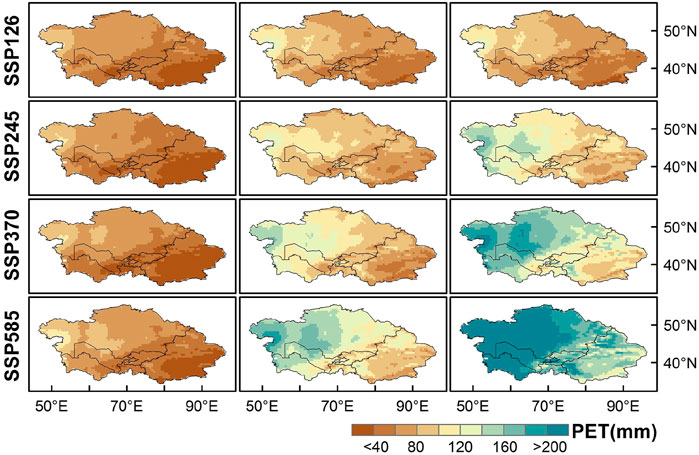
FIGURE 7. Spatial variations in annual total potential evapotranspiration (PET) under SSP126, SSP245, SSP370 and SSP585 in near-term (2026–2050, column 1), mid-term (2051–2075, column 2), and long-term (2076–2100, column 3) relative to the historical reference period (1986–2010) in ACA.
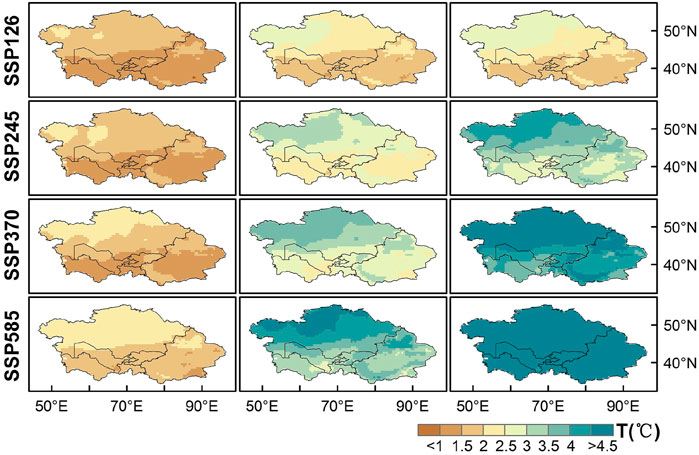
FIGURE 8. Spatial variations in annual average temperature (T) under SSP126, SSP245, SSP370 and SSP585 in near-term (2026–2050, column 1), mid-term (2051–2075, column 2), and long-term (2076–2100, column 3) relative to the historical reference period (1986–2010) in ACA.
3.3 Future projections of drought characteristics
3.3.1 Drought trends
The 12-month SPEI in ACA shows a significant fluctuating downward trend in the future. The drought conditions are slightly aggravated under the scenarios of SSP126 and SSP245, but strongly strengthened under SSP370 and SSP585 (Figure 9).
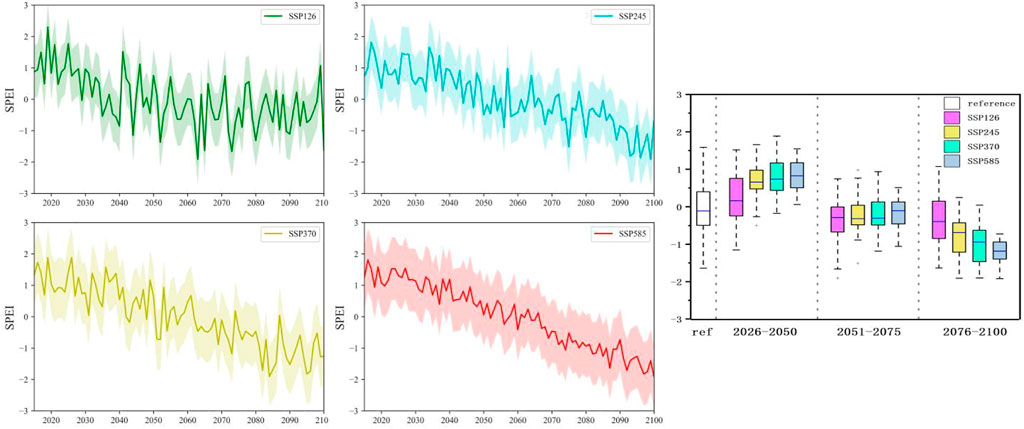
FIGURE 9. Changes in the 12-month SPEI under the four SSP-RCPs in the future period (2015–2100) in ACA. (Left panel) and the comparison of SPEI between the future three periods (NT 2026–2050, MT 2051–2075, LT 2076–2100) and the historical reference period (ref 1986–2010) (Right panel).
Compared with the historical reference period, the drought in NT showing a mitigating trend. In MT, the drought is worse but showing a slightly easing trend, and the differences among the four scenarios is small. In LT, however, the drought will be distinctly aggravated with the radiative forcing intensified, indicating that ACA will face higher drought risk in the long run.
In terms of spatial distribution, the northern Kazakhstan, Kyrgyzstan, and northern Xinjiang of China had a wetting trend in the historical period, and meanwhile the southern Xinjiang of China, western Kazakhstan, Uzbekistan and Turkmenistan had a drying trend (Figure 10A). In the future, the spatial pattern of drying trends under the four scenarios are generally consistent but the amplitude is different. Under SSP126, the slowly wetting trend area accounts for 3.7%, which is mainly located in the northeastern Kazakhstan and Kyrgyzstan (Figure 10B). With the emission increased, the proportion of significant drying trend area is increased by 54%, 88%, 96%, and 99%, respectively, under the four SSPs (Figure 10B-E). The whole ACA will be severely affected by drought under SSP585 (Figure 10E).
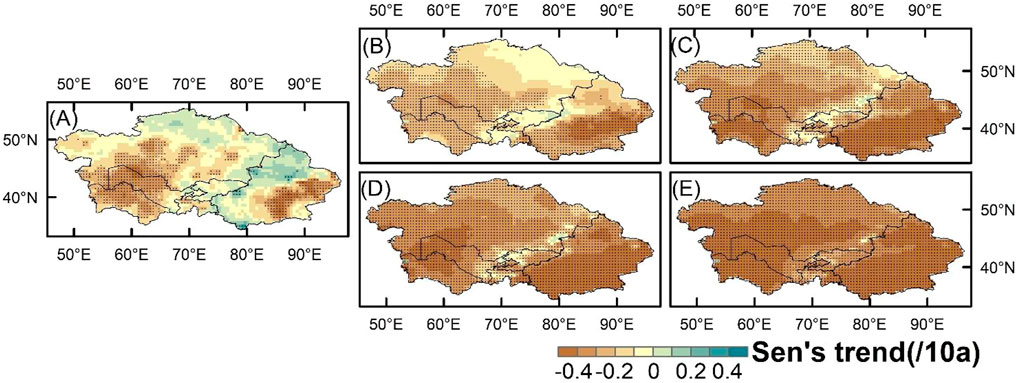
FIGURE 10. Spatial patterns of SPEI-trend in historical period (1961–2014) (A) and future period (2015–2100) in ACA under SSP126 (B), SSP245 (C), SSP370 (D) and SSP585 (E) (Grids with black dots are the area passing the 0.05 significance test).
3.3.2 Drought characteristics
Drought events based on 1-month SPEI were analyzed using the three-threshold run theory. The spatial distribution shows that the characteristics of drought number (DN), drought duration (DD), drought frequency (DF) and drought intensity (DI) are different under four emission scenarios (Figure 11).
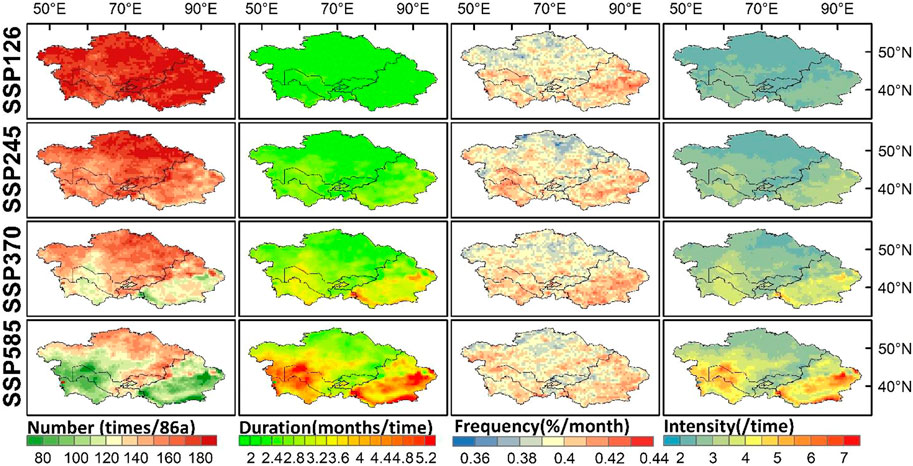
FIGURE 11. Spatial distribution of characteristics of drought events, including the total number of droughts (DN, column 1), drought duration (DD, column 2), drought frequency (DF, column 3) and drought intensity (DI, column 4), based on 1-month SPEI in ACA under four SSP-RCPs (SSP126, SSP245, SSP370 and SSP585) in the future (2015–2100).
In the future period (2015–2100), the average DN of the whole ACA is 180, 163, 143, and 119 under SSP126, SSP245, SSP370, and SSP585, respectively. Notably, there will be a total of 207 droughts in northeastern Xinjiang of China under SSP126. The average DD is 2.28, 2.54, 2.92, and 3.59, respectively, with the longest DD of 6.85 months in southeastern Xinjiang of China under SSP585. The DF is 0.3974, 0.3976, 0.3979, and 0.3983, and the DI is 2.46, 2.73, 3.09, and 3.77, respectively, under the four emissions. With the increase in emissions, the DN decreases, but the DD, DF, and DI all increase, shown evidently in southern Xinjiang of China, Turkmenistan and Uzbekistan, indicating that these subregions will have higher drought risk in the future.
The change in droughts of the future three periods were further analyzed (Figure 12). Compared with the reference period, drought may moderate in NT. The DF and DI will decrease by 10.8%–58.4% and 12.3%–40%, respectively, with a significant downward trend in southeastern Xinjiang of China, southwestern Kazakhstan, central and western Uzbekistan and western Turkmenistan. In MT and LT, drought will strengthen. The DF in MT will increase on the whole, especially in northern Xinjiang of China and southeastern Kazakhstan. In LT, the intensified drought under SSP370 and SSP585 will mainly occur in Xinjiang of China, western Kazakhstan, Uzbekistan and Turkmenistan, which can be largely attributed to the increased temperature and the resulting increased evapotranspiration (Figures 6, 7). On the whole, the DF will mainly show an increasing trend. Combined with the change in DN and DD, drought events in ACA will exhibit an overall characteristic of decreasing DN, increasing DF, stronger DI and longer DD. The drought risk will be higher in Xinjiang of China, Turkmenistan and Uzbekistan, followed by Tajikistan, Kyrgyzstan and Kazakhstan.
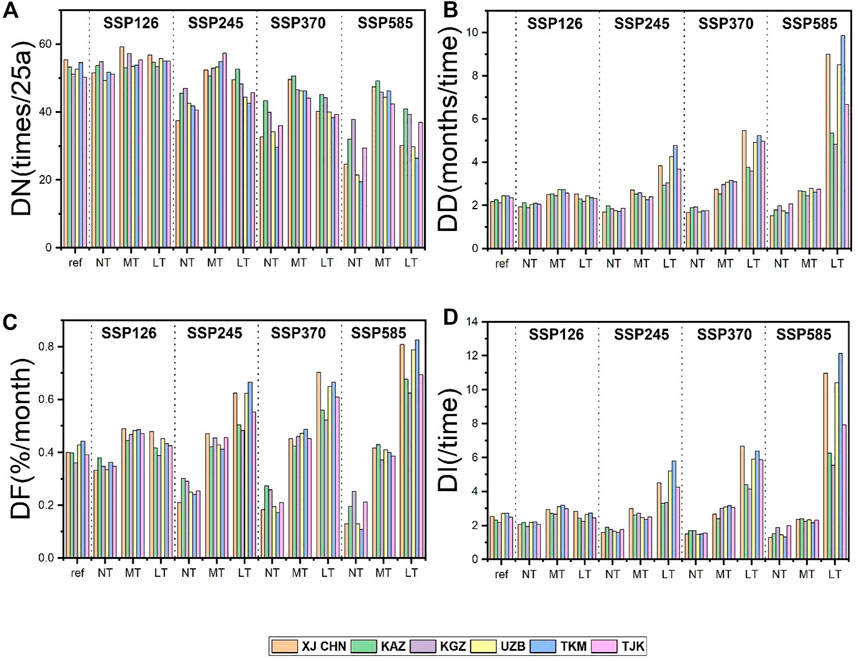
FIGURE 12. Characteristics of drought events in six subregions under four SSP-RCPs (SSP126, SSP245, SSP370, and SSP585) in historical reference period (1986–2010) and future NT (2026–2050), MT (2051–2075) and LT (2076–2100). (A) Drought number (DN), (B) Drought duration (DD), (C) Drought frequency (DF), (D) Drought intensity (DI).
4 Discussion
GCMs are essential tools for providing reliable data to support the projection of future drought trends and spatial-temporal distribution (Jiang et al., 2022; Ma et al., 2022; Qi et al., 2022). Climate is influenced by terrestrial systems, natural factors and anthropogenic activities. Thus, the climate projection by GCMs is affected by multi-source uncertainties, such as greenhouse gas and aerosol emission scenarios, climate model structure and parameterization, and internal variability of the climate system (Salehnia et al., 2019; Chen and Yuan, 2022). In this study, CMIP6 GCMs were found to have better simulation capability by Delta correction method than GWR correction method, indicating that the robust relationship in the multivariable bias correction (MBC) method needs further exploration to better modify the model data (Themeßl et al., 2012; Zhang and Chen, 2021; Vrac et al., 2022). In ACA, drought will strengthen to varying degrees in the future, the uncertainties of which can be reduced by considering more climatic variables, models and scenarios.
Studies have shown that precipitation, potential evapotranspiration and temperature are changing at different rates under the background of global warming. The average annual temperature in ACA has proven to increase by more than 6°C under SSP585 (Didovets et al., 2021; He et al., 2021; Hua et al., 2022). And some of them pointed out that precipitation will seriously differentiate under various emission scenarios by the end of the 21st century (Song et al., 2021a; Hamed et al., 2022). Unlike the above studies, the future precipitation in ACA will not rise sharply and the increase rate is smaller in this study. In its sub-regions, the increase rates in precipitation will increase significantly with the emission intensified in Xinjiang of China, Kyrgyzstan and Tajikistan. Consistent with previous studies, the increase in evapotranspiration will offset the most increased precipitation as the temperature rises in ACA in the future period (Li et al., 2021; Song et al., 2021b; Hua et al., 2022). Although ACA is affected by the westerlies on the whole, the spatial and temporal distribution and variation in climatic factors could be various due to the different topography and geographical locations of subregions (Liu et al., 2018). The enhancement of westerly circulation and its southward movement may be the main reason for the increase of precipitation in Central Asia (Yu et al., 2019). The weakening of summer precipitation and temperature anomalies in Central Asia is not conducive to water vapor input in the west and north of the arid region of Central Asia (Lioubimtseva et al., 2005). In addition, the climatic factors and SPEI were found to be correlated with the Arctic Oscillation (AO), North Atlantic Oscillation (NAO) and El Nino-Southern Oscillation (ENSO) in ACA (Cook et al., 2018; Dilinuer and Li, 2018; Mukherjee and Mishra, 2022).
Different degrees of drought in the future will bring great threats and challenges to the water resources, agricultural and animal husbandry production, economic development and human health in ACA (An et al., 2022; Dou et al., 2022; Prodhan et al., 2022). It is predicted that drought will intensify under different scenarios in the future. The frequency of drought events is generally higher in most areas of ACA (Hua et al., 2022). And the future drought duration based on SPEI decreases in the near-term future periods and increases in the mid-term and long-term future periods (Ta et al., 2022). In this study, droughts are likely to increase dramatically, especially in Xinjiang of China, Turkmenistan and Uzbekistan in the late 21st century. With the emphasis on carbon neutrality in the IPCC report on global warming of 1.5°C, to peak global carbon emissions and achieve carbon neutrality as soon as possible is an urgent need to achieve the long-term temperature targets proposed in the Paris Agreement. Therefore, understanding future changes in drought conditions in the arid Central Asia is critical for developing adaptation measures to cope with the challenge of rapid climate change (Huang and Zhai, 2021).
5 Conclusion
In this study, the performance of 30 CMIP6 GCMs in simulating P, PET and T in ACA were evaluated. To reduce the uncertainties of estimation, the multi-model ensemble mean (MME) and bias correction method were used. After then, the change in future climatic factors and drought characteristics were analyzed. The primary results are as follows.
The 30 CMIP6 GCMs have a good spatial simulation ability for P, PET and T (p<0.01). There are large differences in the P simulation among all climate models, but small in the PET and T simulation. The delta-corrected MME outperforms the GWR-corrected MME.
In the future period (2015–2100), P, PET and T show increasing trends to varying degrees. The increase rate of P is 2.23 mm/10a, 3.40 mm/10a, 3.60 mm/10a and 3.62 mm/10a, under SSP126, SSP245, SSP370, and SSP585, respectively. Meanwhile, the increase rate of PET is 8.44 mm/10a, 8.94 mm/10a, 14.58 mm/10a, and 26.99 mm/10a, and that of T is 0.22°C/10a, 0.30°C/10a, 0.54°C/10a, and 0.79°C/10a, respectively. Uzbekistan, Kazakhstan, Kyrgyzstan and Tajikistan are the regions with faster P and T rise, and the northern of ACA are the main area with the rapid growth of PET.
The total number of drought events will decrease with the emission increased. However, the drought duration, frequency and intensity will increase. Compared with the historical reference period, drought is likely to be moderate in the near-term (2026–2050), but severe in the mid-term (2051–2075) and long-term (2076–2100). Drought events in ACA will show an overall characteristic of decreasing DN, longer DD, increasing DF and stronger DI. Drought risk is increasing in all subregions, especially in Xinjiang, Turkmenistan and Uzbekistan in the future.
Data availability statement
The original contributions presented in the study are included in the article/supplementary material, further inquiries can be directed to the corresponding author.
Author contributions
Conceptualization, LC and CX; Data curation, Formal analysis, Investigation, Methodology, Resources, Software, Validation, LC, NS, LS, and XL; Supervision, Roles/Writing—original draft, Writing—review and editing, LC and CX.
Funding
This work was supported by the National Natural Science Foundation of China (No. 42067062) and Xinjiang Uygur Autonomous Region of China Graduate Education Innovation Program project (XJ 2022G039).
Acknowledgments
We are grateful for the free open access datasets used in this study. The precipitation data from https://psl.noaa.gov/data/gridded/data.gpcc.html. The Climatic Research Unit (CRU) Time-Series (TS) version 4.05 was obtained from https://crudata.uea.ac.uk/cru/data/hrg/cru_ts_4.05/. The CMIP6 data were obtained from https://esgf-node.llnl.gov/search/cmip6/./
Conflict of interest
The authors declare that the research was conducted in the absence of any commercial or financial relationships that could be construed as a potential conflict of interest.
Publisher’s note
All claims expressed in this article are solely those of the authors and do not necessarily represent those of their affiliated organizations, or those of the publisher, the editors and the reviewers. Any product that may be evaluated in this article, or claim that may be made by its manufacturer, is not guaranteed or endorsed by the publisher.
References
Al-Yaari, A., Ducharne, A., Thiery, W., Cheruy, F., and Lawrence, D. (2022). The role of irrigation expansion on historical climate change: Insights from CMIP6. Earth's Future 10, e2022EF002859.
An, S., Park, G., Jung, H., and Jang, D. (2022). Assessment of future drought index using SSP scenario in rep. of korea. Sustainability 14, 4252. doi:10.3390/su14074252
Asadi Zarch, M. A., Sivakumar, B., Malekinezhad, H., and Sharma, A. (2017). Future aridity under conditions of global climate change. J. Hydrol. 554, 451–469. doi:10.1016/j.jhydrol.2017.08.043
Chatterjee, S., and Olkin, I. (2006). Nonparametric estimation for quadratic regression. Stat. Probab. Lett. 76, 1156–1163. doi:10.1016/j.spl.2005.12.022
Chen, S., and Yuan, X. (2022). Quantifying the uncertainty of internal variability in future projections of seasonal soil moisture droughts over China. Sci. Total Environ. 824, 153817. doi:10.1016/j.scitotenv.2022.153817
Chen, Y., Yuan, W., Xia, J., Fisher, J. B., Dong, W., Zhang, X., et al. (2015). Using Bayesian model averaging to estimate terrestrial evapotranspiration in China. J. Hydrol. 528, 537–549. doi:10.1016/j.jhydrol.2015.06.059
Cook, B. I., Mankin, J. S., and Anchukaitis, K. J. (2018). Climate change and drought: From past to future. Curr. Clim. Change Rep. 4, 164–179. doi:10.1007/s40641-018-0093-2
Didovets, I., Lobanova, A., Krysanova, V., Menz, C., Babagalieva, Z., Nurbatsina, A., et al. (2021). Central Asian rivers under climate change: Impacts assessment in eight representative catchments. J. Hydrol. Reg. Stud. 34, 100779. doi:10.1016/j.ejrh.2021.100779
Dilinuer, T., and Li, D. (2018). Characteristics of the dry/wet climate change in central Asia in recent 115 years. J. Arid Meteorol. 36, 11.
Dilinuer, T., Yao, J., Chen, J., Zhao, Y., Mao, W., Li, J., et al. (2021). Systematical evaluation of three gridded daily precipitation products against rain gauge observations over central Asia. Front. Earth Sci. 9. doi:10.3389/feart.2021.699628
Dou, X., Ma, X., Zhao, C., Li, J., Yan, Y., and Zhu, J. (2022). Risk assessment of soil erosion in Central Asia under global warming. CATENA 212, 106056. doi:10.1016/j.catena.2022.106056
Hamed, M. M., Nashwan, M. S., and Shahid, S. (2022). Inter-comparison of historical simulation and future projections of rainfall and temperature by CMIP5 and CMIP6 GCMs over Egypt. Int. J. Climatol. 42, 4316–4332. doi:10.1002/joc.7468
Hamed, K. H. (2009). Exact distribution of the Mann–Kendall trend test statistic for persistent data. J. Hydrol. 365, 86–94. doi:10.1016/j.jhydrol.2008.11.024
Harris, I., Osborn, T. J., Jones, P., and Lister, D. (2020). Version 4 of the CRU TS monthly high-resolution gridded multivariate climate dataset. Sci. Data 7, 109. doi:10.1038/s41597-020-0453-3
He, H., Luo, G., Cai, P., Hamdi, R., Termonia, P., De Maeyer, P., et al. (2021). Assessment of climate change in central Asia from 1980 to 2100 using the köppen-geiger climate classification. Atmosphere 12, 123. doi:10.3390/atmos12010123
Hu, X.-M., Ma, J.-R., Ying, J., Cai, M., and Kong, Y.-Q. (2021). Inferring future warming in the Arctic from the observed global warming trend and CMIP6 simulations. Adv. Clim. Change Res. 12, 499–507. doi:10.1016/j.accre.2021.04.002
Hua, L., Zhao, T., and Zhong, L. (2022). Future changes in drought over Central Asia under CMIP6 forcing scenarios. J. Hydrol. Reg. Stud. 43, 101191. doi:10.1016/j.ejrh.2022.101191
Huang, M.-T., and Zhai, P.-M. (2021). Achieving Paris Agreement temperature goals requires carbon neutrality by middle century with far-reaching transitions in the whole society. Adv. Clim. Change Res. 12, 281–286. doi:10.1016/j.accre.2021.03.004
Jaiswal, R., Mall, R. K., Singh, N., Lakshmi Kumar, T. V., and Niyogi, D. (2022). Evaluation of bias correction methods for regional climate models: Downscaled rainfall analysis over diverse agroclimatic zones of India. Earth Space Sci. 9, e2021EA001981. doi:10.1029/2021ea001981
Jiang, H., Wang, G., Li, S., Ullah, W., Amankwah, S. O. Y., and Lu, J. (2022). Effect of CO2 concentration on drought assessment in China. Int. J. Climatol. 42, 1–18. doi:10.1002/joc.7657
Jose, D. M., and Dwarakish, G. S. (2022). Bias correction and trend analysis of temperature data by a high-resolution CMIP6 model over a tropical river basin. Asia-Pacific J. Atmos. Sci. 58, 97–115. doi:10.1007/s13143-021-00240-7
Lee, J., Kim, Y., and Wang, D. (2022). Assessing the characteristics of recent drought events in South Korea using WRF-Hydro. J. Hydrol. 607, 127459. doi:10.1016/j.jhydrol.2022.127459
Li, Y., Chen, Y., and Li, Z. (2019). Dry/wet pattern changes in global dryland areas over the past six decades. Glob. Planet. Change 178, 184–192. doi:10.1016/j.gloplacha.2019.04.017
Li, H., Li, Z., Chen, Y., Liu, Y., Hu, Y., Sun, F., et al. (2021). Projected meteorological drought over asian drylands under different CMIP6 scenarios. Remote Sens. 13, 4409. doi:10.3390/rs13214409
Lioubimtseva, E., Cole, R., Adams, J. M., and Kapustin, G. (2005). Impacts of climate and land-cover changes in arid lands of Central Asia. J. Arid Environ. 62, 285–308. doi:10.1016/j.jaridenv.2004.11.005
Liu, Y., Wu, C., Jia, R., and Huang, J. (2018). An overview of the influence of atmospheric circulation on the climate in arid and semi-arid region of Central and East Asia. Sci. China Earth Sci. 61, 1183–1194. doi:10.1007/s11430-017-9202-1
Long, Y., Xu, C., Liu, F., Liu, Y., and Yin, G. (2021). Evaluation and projection of wind speed in the arid region of northwest China based on CMIP6. Remote Sens. 13, 4076. doi:10.3390/rs13204076
Lu, X., Tang, G., Wang, X., Liu, Y., Jia, L., Xie, G., et al. (2019). Correcting GPM IMERG precipitation data over the tianshan mountains in China. J. Hydrol. 575, 1239–1252. doi:10.1016/j.jhydrol.2019.06.019
Luo, M., Liu, T., Meng, F., Duan, Y., Bao, A., Frankl, A., et al. (2019). Spatiotemporal characteristics of future changes in precipitation and temperature in Central Asia. Int. J. Climatol. 39, 1571–1588. doi:10.1002/joc.5901
Ma, Z., Sun, P., Zhang, Q., Zou, Y., Lv, Y., Li, H., et al. (2022). The characteristics and evaluation of future droughts across China through the CMIP6 multi-model ensemble. Remote Sens. 14, 1097. doi:10.3390/rs14051097
Miao, L., Li, S., Zhang, F., Chen, T., Shan, Y., and Zhang, Y. (2020). Future drought in the dry lands of Asia under the 1.5 and 2.0 °C warming scenarios. Earth's Future 8, e2019EF001337. doi:10.1029/2019ef001337
Morsy, M., Moursy, F. I., Sayad, T., and Shaban, S. (2022). Climatological study of SPEI drought index using observed and CRU gridded dataset over Ethiopia. Pure Appl. Geophys. 179, 3055–3073. doi:10.1007/s00024-022-03091-z
Mukherjee, S., and Mishra, A. K. (2022). Global flash drought analysis: Uncertainties from indicators and datasets. Earth's Future 10, e2022EF002660. doi:10.1029/2022ef002660
Musei, S. K., Nyaga, J. M., and Dubow, A. Z. (2021). SPEI-based spatial and temporal evaluation of drought in Somalia. J. Arid Environ. 184, 104296. doi:10.1016/j.jaridenv.2020.104296
Oruc, S. (2022). Performance of bias corrected monthly CMIP6 climate projections with different reference period data in Turkey. Acta Geophys. 70, 777–789. doi:10.1007/s11600-022-00731-9
Prodhan, F. A., Zhang, J., Pangali Sharma, T. P., Nanzad, L., Zhang, D., Seka, A. M., et al. (2022). Projection of future drought and its impact on simulated crop yield over South Asia using ensemble machine learning approach. Sci. Total Environ. 807, 151029. doi:10.1016/j.scitotenv.2021.151029
Qi, Y., Yu, H., Fu, Q., Chen, Q., Ran, J., and Yang, Z. (2022). Future changes in drought frequency due to changes in the mean and shape of the PDSI probability density function under RCP4.5 scenario. Front. Earth Sci. 10. doi:10.3389/feart.2022.857885
Rakovec, O., Samaniego, L., Hari, V., Markonis, Y., Moravec, V., Thober, S., et al. (2022). The 2018–2020 multi-year drought sets a new benchmark in Europe. Earth's Future 10, e2021EF002394. doi:10.1029/2021ef002394
Rosner, B., and Glynn, R. J. (2007). Interval estimation for rank correlation coefficients based on the probit transformation with extension to measurement error correction of correlated ranked data. Stat. Med. 26, 633–646. doi:10.1002/sim.2547
Salehnia, N., Hosseini, F., Farid, A., Kolsoumi, S., Zarrin, A., and Hasheminia, M. (2019). Comparing the performance of dynamical and statistical downscaling on historical run precipitation data over a semi-arid region. Asia-Pacific J. Atmos. Sci. 55, 737–749. doi:10.1007/s13143-019-00112-1
Schneider, U., Finger, P., Meyer-Christoffer, A., Rustemeier, E., Ziese, M., and Becker, A. (2017). Evaluating the hydrological cycle over land using the newly-corrected precipitation Climatology from the global precipitation Climatology Centre (GPCC). Atmos. (Basel) 8, 52. doi:10.3390/atmos8030052
Song, Y. H., Chung, E.-S., and Shahid, S. (2021a). Spatiotemporal differences and uncertainties in projections of precipitation and temperature in South Korea from CMIP6 and CMIP5 general circulation models. Int. J. Climatol. 41, 5899–5919. doi:10.1002/joc.7159
Song, Z., Xia, J., She, D., Li, L., Hu, C., and Hong, S. (2021b). Assessment of meteorological drought change in the 21st century based on CMIP6 multi-model ensemble projections over mainland China. J. Hydrol. 601, 126643. doi:10.1016/j.jhydrol.2021.126643
Song, L., Xu, C., Long, Y., Lei, X., Suo, N., and Cao, L. (2022). Performance of seven gridded precipitation products over arid central Asia and subregions. Remote Sens. 14, 6039. [Online]. doi:10.3390/rs14236039
Sun, X., Wang, J., Zhang, L., Ji, C., Zhang, W., and Li, W. (2022). Spatial downscaling model combined with the geographically weighted regression and multifractal models for monthly GPM/IMERG precipitation in hubei province, China. Atmosphere 13, 476. doi:10.3390/atmos13030476
Ta, Z., Li, K., Yu, Y., and Yang, M. (2022). Projections of future drought by CMIP5 multimodel ensembles in central Asia. Atmosphere 13, 232. doi:10.3390/atmos13020232
ThemeßL, M. J., Gobiet, A., and Heinrich, G. (2012). Empirical-statistical downscaling and error correction of regional climate models and its impact on the climate change signal. Clim. Change 112, 449–468. doi:10.1007/s10584-011-0224-4
Vrac, M., Thao, S., and Yiou, P. (2022). Should multivariate bias corrections of climate simulations account for changes of rank correlation over time? J. Geophys. Res. Atmos. 127, e2022JD036562. doi:10.1029/2022jd036562
Wang, J., Chen, F., Jin, L., and Bai, H. (2010). Characteristics of the dry/wet trend over arid central Asia over the past 100 years. Clim. Res. 41, 51–59. doi:10.3354/cr00837
Wang, Q., Wang, J., Zhao, Y., Li, H., Zhai, J., Yu, Z., et al. (2016). Reference evapotranspiration trends from 1980 to 2012 and their attribution to meteorological drivers in the three-river source region, China. Int. J. Climatol. 36, 3759–3769. doi:10.1002/joc.4589
Wang, T., Tu, X., Singh, V. P., Chen, X., and Lin, K. (2021). Global data assessment and analysis of drought characteristics based on CMIP6. J. Hydrol. 596, 126091. doi:10.1016/j.jhydrol.2021.126091
Wu, R., Zhang, J., Bao, Y., and Guo, E. (2019). Run theory and copula-based drought risk analysis for songnen grassland in northeastern China. Sustainability 11, 6032. doi:10.3390/su11216032
Wu, G., Chen, J., Shi, X., Kim, J.-S., Xia, J., and Zhang, L. (2022). Impacts of global climate warming on meteorological and hydrological droughts and their propagations. Earth's Future 10, e2021EF002542. doi:10.1029/2021ef002542
Yin, L., Tao, F., Chen, Y., Liu, F., and Hu, J. (2021). Improving terrestrial evapotranspiration estimation across China during 2000–2018 with machine learning methods. J. Hydrol. 600, 126538. doi:10.1016/j.jhydrol.2021.126538
Yu, Y., Pi, Y., Yu, X., Ta, Z., Sun, L., Disse, M., et al. (2019). Climate change, water resources and sustainable development in the arid and semi-arid lands of Central Asia in the past 30 years. J. Arid Land 11, 1–14. doi:10.1007/s40333-018-0073-3
Zhang, S., and Chen, J. (2021). Uncertainty in projection of climate extremes: A comparison of CMIP5 and CMIP6. J. Meteorol. Res. 35, 646–662. doi:10.1007/s13351-021-1012-3
Zhao, X., Huang, G., Li, Y., Lin, Q., Jin, J., Lu, C., et al. (2021). Projections of meteorological drought based on CMIP6 multi-model ensemble: A case study of henan province, China. J. Contam. Hydrol. 243, 103887. doi:10.1016/j.jconhyd.2021.103887
Keywords: CMIP6, arid central Asia, SSP-RCPs, dry-wet climatic change, drought characteristics
Citation: Cao L, Xu C, Suo N, Song L and Lei X (2023) Future dry-wet climatic characteristics and drought trends over arid Central Asia. Front. Earth Sci. 11:1102633. doi: 10.3389/feart.2023.1102633
Received: 19 November 2022; Accepted: 25 January 2023;
Published: 02 February 2023.
Edited by:
Shanlei Sun, Nanjing University of Information Science and Technology, ChinaReviewed by:
Junqiang Yao, China Meteorological Administration, ChinaYixing Yin, Nanjing University of Information Science and Technology, China
Copyright © 2023 Cao, Xu, Suo, Song and Lei. This is an open-access article distributed under the terms of the Creative Commons Attribution License (CC BY). The use, distribution or reproduction in other forums is permitted, provided the original author(s) and the copyright owner(s) are credited and that the original publication in this journal is cited, in accordance with accepted academic practice. No use, distribution or reproduction is permitted which does not comply with these terms.
*Correspondence: Changchun Xu, eGNjMDExMEAxNjMuY29t