 Juyue Yin1,2
 Junpeng Yuan
 Tao Feng
- 1Key Laboratory of Atmospheric Environment and Processes in the Boundary Layer Over the Low-Latitude Plateau Region, Department of Atmospheric Sciences, Yunnan University, Kunming, China
- 2Yuxi Meteorological Bureau, Yuxi, China
- 3Yunnan Institute of Meteorology Sciences, Kunming, China
Under the wintertime background of westerly flows, heavy rainfall often occurs first over southwestern China and then spreads eastward downstream to southeastern China, causing serious impact on a large scope of southern China. By using the synoptic diagnosis and dynamic analysis methods, we examined a typical eastward-moving heavy rainfall event that occurred over southwestern China on January 8–9, 2015 and then gradually spread eastward to southeastern China on January 10–13. The results show the important role of the Rossby wave train propagating along the subtropical westerly jet in “pushing” the eastward movement of heavy rainfall over southern China. The remote Rossby wave train influenced the variation of heavy rainfall by modifying the local circulation. The Rossby wave train can change the morphology of the East Asian subtropical jet via wave—jet interactions and modify the related secondary upward circulation in the entrance area of the jet, providing favorable dynamic conditions for the occurrence of heavy rainfall. The Rossby wave train can also influence the low-level south branch trough by modifying the associated baroclinic energy conversion process under a background of deep layer subsidence, which favors the transport of plentiful water vapor to the region of heavy rainfall over southern China. The eastward-propagating Rossby wave train pushed the upper level East Asian subtropical jet and the lower level south branch trough as a whole while simultaneously moving east, which caused the region of heavy rainfall to move from southwestern to southeastern China. These results will help to provide a scientific basis for forecasting winter rainfall over southern China.
1 Introduction
The winter climate of China is relatively dry and cold and heavy rainfall mainly occurs south of 35°N (Gao et al., 2020). Heavy rainfall in winter often brings severe icing conditions and may cause serious disasters and great losses to both human society and the economy (Huang et al., 2019; Tan et al., 2022). In the dry, cold conditions of winter, the occurrence of heavy rainfall over southern China is closely related to the triggering effect of warm, moist air flows originating from the tropical regions (Zong et al., 2014; Li et al., 2020). A semi-permanent trough forms in the southern branch of the westerly winds at lower levels (Yeh, 1950). This trough appears south of the Qinghai–Tibetan Plateau and is known as the South Branch Trough (SBT) or the India–Burma Trough (Figure 1). Numerous studies revealed that the SBT shows energetic synoptic variation (e.g., Suo et al., 2008; Duan et al., 2012; Zong et al., 2012; Li and Sun, 2015; Li and Zhou, 2016; Li et al., 2017; Chen and Li, 2022). The SBT often intensifies and migrates from the Bay of Bengal to the South China Sea along the south westerly flow, which is termed an SBT process appearing every 5–6 days (Qin et al., 1991; Guo et al., 2010; Li et al., 2017). The SBT has an essential role in the occurrence of winter rainfall over southern China (Zong et al., 2012; Li and Sun, 2015; Lin, 2016; Liu et al., 2018). The southwesterly flow in front of the SBT can transport large amounts of warm, moist water vapor from the Bay of Bengal to southern China, which favors the occurrence of heavy rainfall in this region (Wang et al., 2011; Li and Zhou, 2016). When the deepening SBT meets the westward-expanding western Pacific subtropical high, widespread heavy rainfall can occur in southwestern China and also further downstream in southeastern China (Duan et al., 2012; Zong et al., 2014; Yuan et al., 2019).
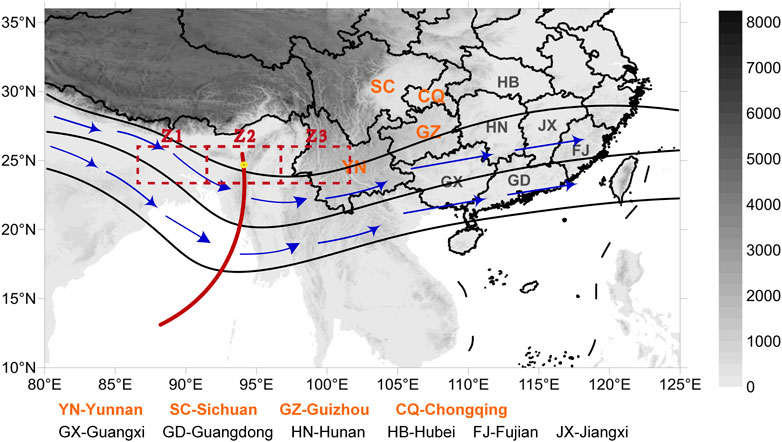
FIGURE 1. Schematic diagram of the topography and southern branch of the westerly winds around the Qinghai–Tibetan Plateau and southern China. The locations of provinces in southwestern (southeastern) China are marked with red (black) acronyms. The digital elevation model of the topography is shown in gray. The black contours and blue vectors show the geopotential height field and the wind field at 700 hPa, respectively. The red solid line shows the trough line of the SBT. The red boxes shown as dashed lines of Z2, Z1, and Z3 represent the trough line region and the regions behind and in front of the SBT in the objective SBT identification method, respectively.
In the upper level, the subtropical westerly jet is located near 30°N, the center of which is located over East Asia and south of Japan, where it is referred to as the East Asian subtropical westerly jet (EASJ; Huang et al., 2014). The EASJ is an important circulation system which is closely related to the variation of the East Asian winter monsoon (Ha et al., 2012; Luo and Zhang, 2015; Liu et al., 2022), and it strongly influences the weather and climate variations over East Asia (Yang et al., 2002; Liao and Zhang, 2013; Ding and Li, 2017; Liu et al., 2022). In winter, Southern China is located under the equator-ward region of the entrance of the EASJ and therefore the secondary upward circulation of the EASJ favors the occurrence of heavy rainfall over southern China (Huang et al., 2017). Thus, both of the variation in the intensity and meridional shift of the EASJ are important to the occurrence of rainfall over southern China (Zhang et al., 2019; Liu et al., 2022). The EASJ was also an important bridge that linked the remote upstream disturbance to the winter precipitation over East Asian (Watanabe, 2004; Hu et al., 2018; Zhang and Chen, 2021). Previous studies have shown that a Rossby wave train originating from the North Atlantic or Mediterranean region may propagate eastward along the subtropical westerly jet into East Asia and have an important role in generating circulation patterns conducive to persistent heavy rainfall events over southern China (Zong et al., 2012; Li and Sun, 2015; Ding and Li, 2017; Li et al., 2017; Huang et al., 2019; Li et al., 2020; Chen and Li, 2022; Tan et al., 2022). The variation in the lower level of the SBT may be closely related to the upstream Rossby wave train (Li and Zhou, 2016; Li et al., 2017). The Rossby wave train propagates eastward along the subtropical westerly jet and strengthen the SBT, which favors the transport of plentiful moisture from the Bay of Bengal and the South China Sea to southern China (Ding and Li, 2017; Li et al., 2017). The Rossby wave train also can modulate the vertical motion and convergence (divergence) in high (low) layers along the eastward-propagating path of the Rossby wave train (Hu et al., 2018; Huang et al., 2019; Tan et al., 2022), favoring dynamic conditions of uplift over southern China (Li and Sun, 2015; Li and Li, 2019). Numerous studies have emphasized that the propagation of the Rossby wave train along the subtropical westerly jet is an important precursory signal influencing the occurrence of heavy rainfall over southern China in winter (Zong et al., 2014; Huang et al., 2019; Li et al., 2020).
Previous studies have mainly focused on the conditions favoring the large region of persistent heavy rainfall over the whole of southern China in winter. Numerous case studies have shown that persistent heavy rainfall events over southern China feature an eastward movement from the perspective of daily variations in the weather (Li and Sun, 2015; Li and Li, 2019; Yuan et al., 2019). Under the winter background of westerly flows over southern China, precipitation tends to occur first over southwestern China and then spreads eastward downstream to southeastern China. For example, a 6-day strong intense and extensive rainfall event occurred over southern China from January 8 to 13, 2015 (Figure 2), causing record-breaking heavy rainfall in most parts of southern China (Li and Li, 2019). Detailed analyses showed that the rainfall process was eastward-moving and that heavy rainfall occurred over southwestern China on January 8–9 and then gradually moved eastward to southeastern China on January 10–13 (Figure 3).

FIGURE 2. Average geopotential height field at 700 hPa (black contours, units: gpm) and the total accumulated precipitation (shading; units: mm) from January 8 to 13, 2015. The red line shows the trough line of the SBT. The gray shading represents the shape of the Qinghai-Tibetan Plateau.
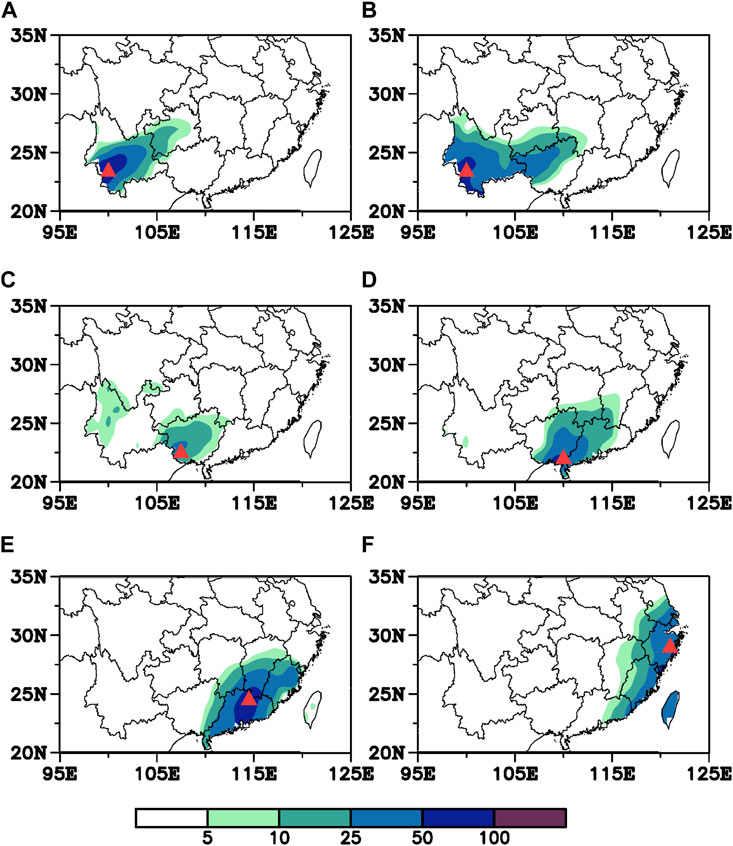
FIGURE 3. Distribution of the daily precipitation on January (A) 8, (B) 9, (C) 10, (D) 11, (E) 12 and (F) 13 in 2015 (units: mm). The red triangle indicates the large-value center of precipitation.
Recently, Chen and Li (2022) reported that about 50% of rainfall events over southwestern China move eastward to southeastern China over the next one to 3 days. It is therefore important to investigate the detailed changes in weather processes and the mechanisms related to eastward-moving rainfall events over southern China in winter. Chen and Li (2022) showed that strong cold air intruding into East Asia is an important factor in blocking heavy rainfall migrating eastward from southwestern to southeastern China. With the strong cold air intruding southward, the related cold Siberian high at the lower level can block the SBT–a low-pressure system–expanding eastward, thus the water vapor transported by the southwesterly wind flow in front of the SBT cannot be converged over southeastern China. Numerous studies also highlighted that the strong cold air activity is unfavorable for the occurrence of heavy rainfall over southeastern China (Wen et al., 2009; Bueh et al., 2011; Li et al., 2020). While, the reason for pushing the eastward movement of rainfall remains unclear. A clear and abnormally active Rossby wave train pattern appears along the subtropical westerly jet in both many individual events (e.g., Li and Sun, 2015; Li and Li, 2019) and the composited results of eastward-moving rainfall events (Chen and Li, 2022). Is the eastward-propagating Rossby wave train along the subtropical westerly jet a crucial factor in “pushing” the heavy rainfall eastward? How does the Rossby wave train along the subtropical westerly jet affect the local circulations favorable for the eastward movement of rainfall over southern China? These questions need further investigation.
A large area of heavy rainfall persisted over southern China for 6 days from January 8 to 13, 2015 (Figure 2). Li and Li (2019) have shown that the continuous eastward propagation of Rossby waves along the subtropical westerly jet helped to maintain this stable and persistent heavy rainfall event. Detailed analysis has shown that the rainfall process clearly moved eastward. Heavy rainfall occurred over southwestern China on January 8–9 and then gradually spread eastward to southeastern China on January 10–13 (Figure 3). We therefore selected this event as a case study of a typical eastward-moving rainfall event to investigate its detailed movement and the influence of the Rossby wave train along the subtropical westerly jet.
The remainder of this paper is organized as follows. The datasets and methods are introduced in Section 2. The detailed characteristics of the eastward-moving heavy rainfall events are described in Section 3. Sections 4, 5 describe the atmospheric circulations and the factors that may affect the variations in heavy rainfall. Our summary is presented in Section 6.
2 Data and methods
2.1 Data
We used the Reanalysis data from the National Center for Environmental Prediction - National Center for Atmospheric Research, with a horizontal resolution of (2.5°× 2.5°) and a vertical resolution of 17 levels (Kalnay et al., 1996). The daily precipitation data used were obtained from the observation data of 834 stations nationwide provided by the China Meteorological Administration. For terrain distribution chart, we used the Shuttle Radar Topography Mission (SRTM) 90 m Digital Elevation Database v4.1 from the Consortium for Spatial Information (CGIAR-CSI). More information is available at the following website (http://srtm.csi.cgiar.org).
2.2 Methods
2.2.1 Wave activity fluxes
To investigate the propagation of the Rossby wave train along the subtropical westerly jet, we calculated the wave activity fluxes using Eq. 1, developed by Takaya and Nakamura (2001):
where
2.2.2 Evaluation of energy conversion
The evaluation of the conversion of energy between the perturbations of the wave train and the mean flows are based on the wave energy Eq. 2, the same as those used by Duan and Wu (2005):
where u and v denote the zonal and meridional wind velocities, respectively. P
2.2.3 Identification of the SBT
We used the westerly trough identification method proposed by García et al. (2001) and Knippertz (2004) to identify the SBT on the daily weather chart. The SBT is climatologically manifested as cyclonic trough and low-pressure system, which frequently appeared over the southern Qinghai–Tibetan Plateau and the northern Bay of Bengal (Figure 1). According to the suggestions of Lin (2015), the area (15°–30°N, 80°–100°E) was chosen as the domain to identify SBT signals.
Z2 area (see Figure 1) was taken to represent the SBT trough line area, and adjacent areas Z1 and Z3 were taken to represent the areas behind and in front of the SBT, respectively. The daily geopotential height at 700 hPa was used to calculate the difference of average geopotential height (DH) between the trough line region of Z2 and the adjacent areasZ1 and Z3, as shown in Eq. 3. A positive value of DH indicated that a trough appeared in the study area. The region with a DH value greater than 35 gpm, which is approximately 1 standard deviation higher than the climatological value over the domain region, was considered an SBT area. The average DH value of the whole area of the SBT was calculated as the intensity of SBT. The location of the maximum DH value at each latitude was linked to the SBT trough line.
About 90% of SBT may move eastward to downstream areas under the background of westerly flows in winter (Duan et al., 2012). We therefore also tracked the trajectory of the moving SBT. On the basis of the identification of the SBT signal in the domain region, we gradually moved the three identification boxes in Figure 1 eastward within 10° of longitude at 2.5 intervals over the next few days. We repeated these processes until the SBT signal could not be identified and thus the eastward shift of the SBT could be shown.
The two-dimensional horizontal frontogenesis function was calculated to investigate the frontogenesis related to rainfall process (Ninomiya, 1984), which was also used in Yuan et al. (2019) and shown good performance in diagnosing frontogenesis over southern China. Empirical orthogonal function (EOF) analysis was used to investigate the modes of SBT variation. We performed a significance test using the Student’s t-test, which represent the probability that the anomalies were statistically different from the climatological state at the 90% or 95% confidence level. The anomalies mentioned in Sections 3–5 were calculated by removing the monthly climatology from 1985 to 2015.
3 Overview of the eastward-moving heavy rainfall event
A 6-day heavy rainfall event occurred over southern China from January 8 to 13, 2015. A large area of heavy rainfall was present in the zonal region 20°–30°N. The climatological daily mean maximum precipitation in winter was about 2 mm in south China (Ding and Li, 2017), while the total accumulated precipitation during the rainfall process exceeded 25 mm in most parts of southern China, including Yunnan, Guizhou, Guangxi, Guangdong, and Fujian provinces (Figure 2), although the spatial distribution of rainfall was uneven, with two large-value centers over southwestern and southeastern China. One center was located in Yunnan Province, southwestern China, where the maximum rainfall was more than 100 mm. The other center was located in Guangdong and Guangxi provinces, southern China, with the maximum rainfall more than 50 mm.
Further detailed analyses showed that the heavy rainfall process exhibited a clearly eastward-moving feature. On January 8, heavy rainfall mainly occurred in Yunnan and Guizhou provinces in southwestern China. Six meteorological stations in southwest Yunnan Province recorded maximum rainfall more than 80 mm (Figure 3A). On January 9, the center of heavy rainfall remained in southwest Yunnan Province, but extended eastward to Guangxi Province (Figure 3B). On January 8–9, heavy rainfall mainly occurred in southwestern China, with 20 counties and cities breaking the records of extreme January precipitation in the time period 1951–2015. The flood disasters and snowstorms caused by this heavy rainfall event affected 1.4 million people and led to about 11.5 billion RMB of economic losses.
The rainfall weakened on January 10, especially in Yunnan Province (Figure 3C). On January 11, the area of heavy rainfall moved eastward to Guangxi and Guangdong provinces and the precipitation over southwestern China gradually weakened and disappeared (Figure 3D). The rainfall continued to move east of 110°E and restrengthened on January 12 (Figure 3E). The main areas of heavy rainfall were located in Guangdong and Fujian provinces, where 18 meteorological stations recorded rainstorms with maximum daily rainfall of about 70 mm (Figure 3E). On January 13, the area of rainfall moved eastward to the coastal areas of southeastern China (Figure 3F).
The eastward-moving heavy rainfall event included multiple complex processes. The whole rainfall process occurred in two stages. In the first stage on January 8–9, 2015, the heavy rainfall was stable over southwestern China. In the second stage on January 10–13, 2015, the area of heavy rainfall gradually moved eastward to southeastern China, while the heavy rainfall weakened and disappeared in southwestern China.
4 Favorable atmospheric environments for the heavy rainfall event
4.1 Background atmospheric circulation in January
In January, the westerly winds in the lower troposphere are divided into northern and southern branches as a result of the blocking effect of the Qinghai–Tibetan Plateau. In the southern branch of the westerlies, the SBT extends from the south of the Qinghai–Tibetan Plateau to the northern Bay of Bengal. The SBT shows a strong cyclonic curve in the wind field and lower pressure signals at 700 hPa, but is relatively weak at 500 hPa (Figures 4A, B), indicating that in the climatology the SBT mainly exists in the mid-to lower troposphere as a result of the blocking effect of the Qinghai–Tibetan Plateau. The western Pacific subtropical high presents as a zonal band expanding from the western Pacific Ocean to the South China Sea around 15°N (Figures 4A, B). As a result of the strong pressure gradient in the regions between the SBT and the western Pacific subtropical high, southwesterly flows emerge in the front of the SBT, which may be favorable for transporting warm, moist air from the northern Bay of Bengal and the South China Sea to southern China (Figure 4C).
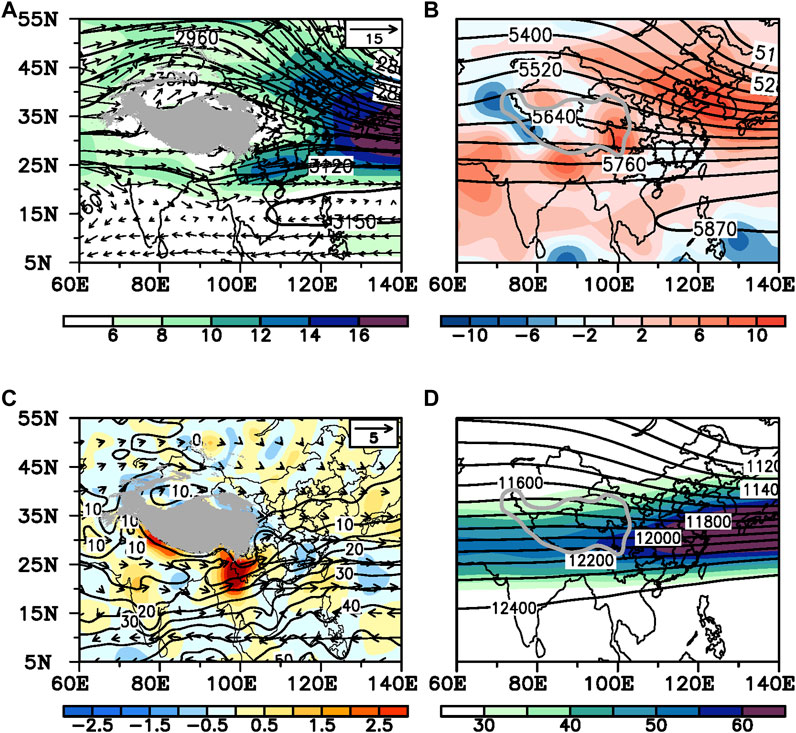
FIGURE 4. Climatology in January for the time period 1985–2015. (A) Geopotential height field (contours; units: gpm), wind field (vectors; units: m s−1) and horizonal wind speed (shading; units: m s−1) at 700 hPa. (B) Geopotential height field (contours; units: gpm) and omega field (shading, units: 10–2 Pa·s−1) at 500 hPa. (C) Water vapor flux (vectors; units: kg m−1·s−1), divergence of the water vapor flux (shading; units: 10–6 kg·m−2·s−1) at 700 hPa and the precipitable water (contours; units: mm). (D) Geopotential height field (contours; units: gpm) and zonal wind speed at 200 hPa. Wind speeds greater than 30 m·s−1 are shaded with intervals of 5 m·s−1. The gray-shaded areas (A,C) and isolines (B,D) show the shape of the Qinghai–Tibetan Plateau.
The water vapor transported by the southwesterly flow in front of the SBT contributes greatly to the rainfall over southern China in winter. In the climatology, the water vapor field shows that the southwesterly water vapor flux diverges over southwestern China and converges over southeastern China, thus the precipitable water value is slightly higher over southeastern China than over southwestern China (Figure 4C). But it should be noted that the climate of southern China is relatively dry in January, the average precipitable water value over the whole of southern China is about 20 mm. In addition, the subtropical westerly jet, which is located between 20° and 35°N in the upper troposphere, extends in a straight line from the Qinghai–Tibetan Plateau to East Asia. Southern China lies below the equator-ward side of the EASJ (Figure 4D).
4.2 Favorable local conditions for the occurrence of heavy rainfall
4.2.1 First stage: Occurrence of heavy rainfall over southwestern China on January 8–9, 2015
On January 8–9, a strong, stable SBT was located around 90°E, with the trough line extending from the south of the Qinghai–Tibetan Plateau to the northern Bay of Bengal at 700 hPa (Figures 5A, B). The average intensity of the SBT was 68 gpm, which was roughly 2.7 times that of the climatic state in winter. An anticyclonic system appeared over the South China Sea, indicating that the western Pacific subtropical high expanded to the west of 110°E. Because of the strong zonal pressure gradient between the SBT and the western Pacific subtropical high, a vigorous low-level southwesterly jet appeared in front of the SBT. Abundant warm, moist air was therefore transported from the Bay of Bengal and the western Pacific Ocean to southwestern China (Figures 6A, B, 7A, B). Strong water vapor converged over the northern Indochina Peninsula and southern China (Figures 6A, B). The average precipitable water was about 25 mm in southwestern China, which was higher than the climatology by about 1.5 standard deviations. The southerly flow in front of the SBT therefore transported plentiful water vapor from the Bay of Bengal and the western Pacific Ocean to southwestern China at this stage, providing favorable moisture conditions for the occurrence of heavy rainfall over southwestern China. A wide ridge was presented in the region (70°–110°E, 40°–50°N) in the northwesterly branch at 700 hPa (Figures 5A, B), whereas strong northerly winds and cold air advection mainly appeared north of 30° N (Figures 7A, B). The heavy rainfall mainly occurred in the warm advection region.
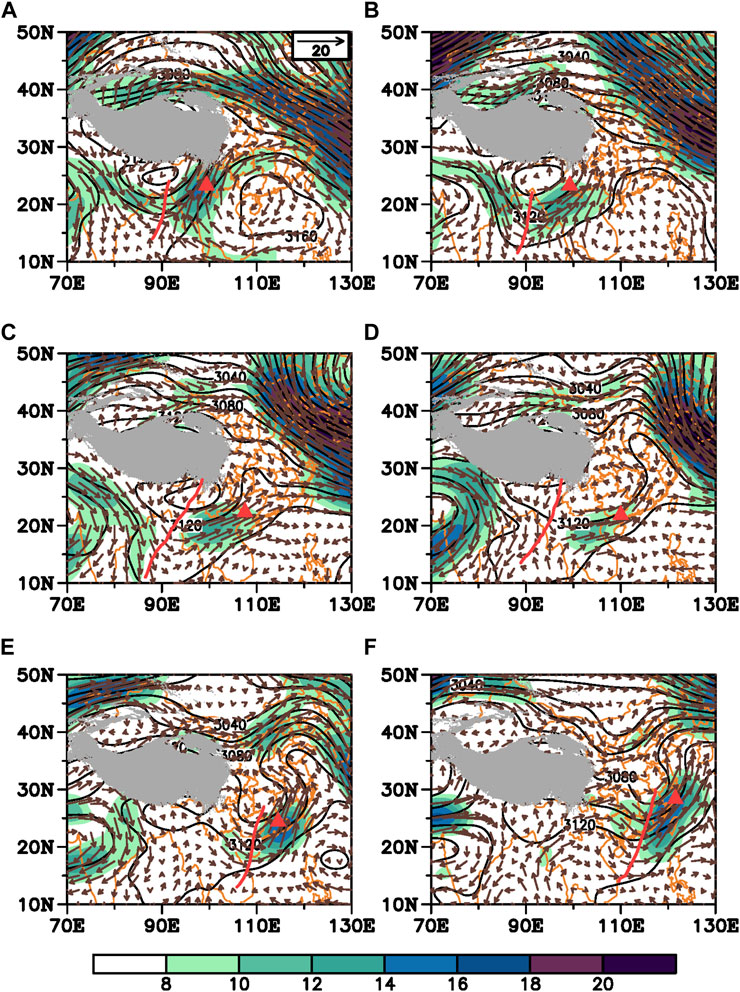
FIGURE 5. Geopotential height (black contours; units: gpm) and wind field (vectors; units: m s−1) at 700 hPa on January (A) 8, (B) 9, (C) 10, (D) 11, (E) 12 and (F) 13 in 2015. Wind speeds greater than 8 m·s−1 are shaded in color. The red line shows the trough line of the SBT. The red triangle indicates the large-value center of precipitation. The gray shading shows the shape of the Qinghai-Tibetan Plateau.
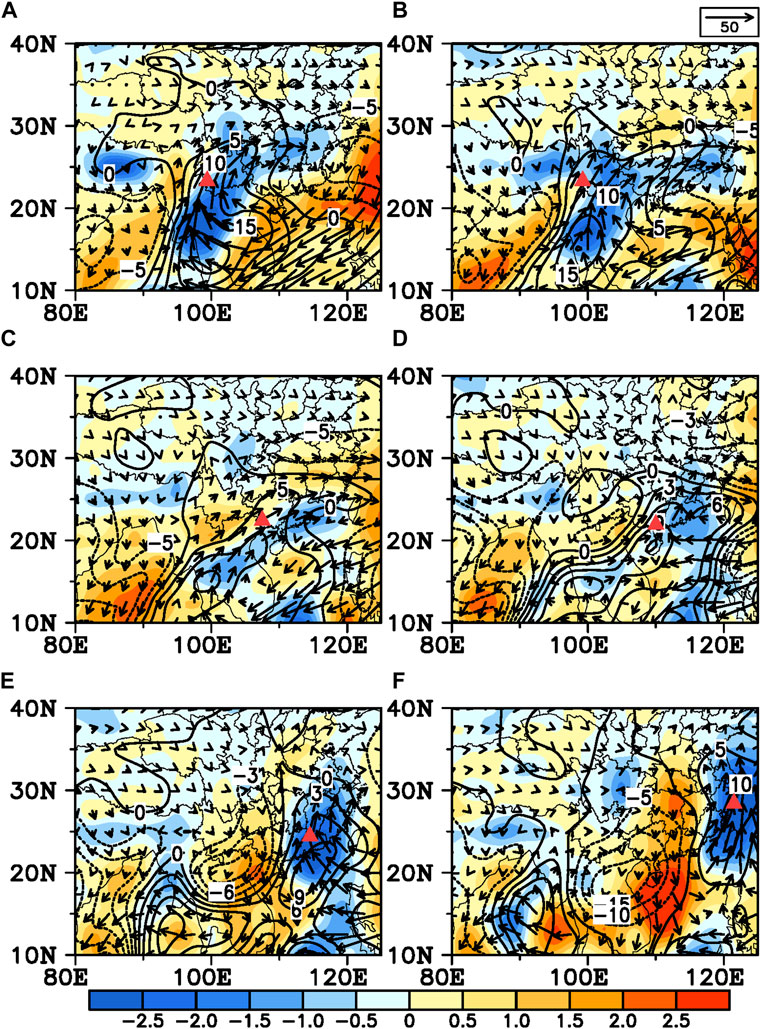
FIGURE 6. Column-integrated water vapor flux (vectors; units: kg m−1·s−1), the divergence of the column-integrated (surface–300 hPa) water vapor flux (shading; units: 10–5 kg·m−2·s−1) and the precipitable water anomalies (contours; units: mm) on January (A) 8, (B) 9, (C) 10, (D) 11, (E) 12 and (F) 13 in 2015. The red triangle indicates the large-value center of precipitation.
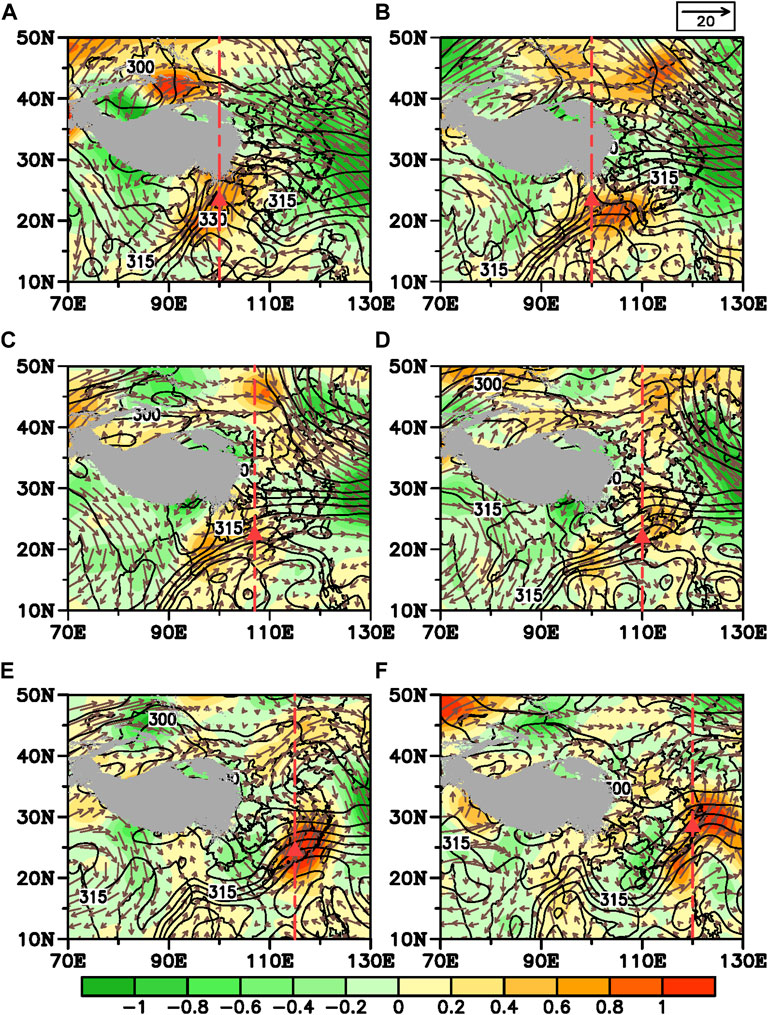
FIGURE 7. Equivalent potential temperature (black contours; units: K), the wind field (vectors; units: m s−1) and the temperature advection (shading; units: 10–4 K·s−1) at 700 hPa on January (A) 8, (B) 9, (C) 10, (D) 11, (E) 12 and (F) 13 in 2015. The red triangle indicates the large-value center of the precipitation. The red dotted line shows the crossing line used for depicting the vertical cross-section profiles in Figures 11, 12. The gray shading shows the shape of the Qinghai-Tibetan Plateau.
In the upper level, the EASJ differed significantly from the climatology. There was a cyclonic curve in the upper level subtropical westerly jet over the eastern Qinghai–Tibetan Plateau (Figures 8A, B). This indicated that the upper level jet was weakened in the cyclonic curve region and the straight jet seemed to “break” over the eastern Qinghai–Tibetan Plateau. The South Asian and East Asian jets were therefore separated. The trough line of the upper level cyclonic curve region can be treated as a boundary between the South Asian jet and the East Asian jet. The center of the EASJ was mainly located east of 120°E over the western Pacific Ocean. Hence, the region of southwestern China was underneath the equator-ward side of the entrance of the upper level EASJ, which exhibited strong anomalous divergence at 200 hPa. The upper level divergence was closely related to the secondary circulation of the EASJ, which can induce strong upward motion and thus favors the occurrence of heavy rainfall over southwestern China.
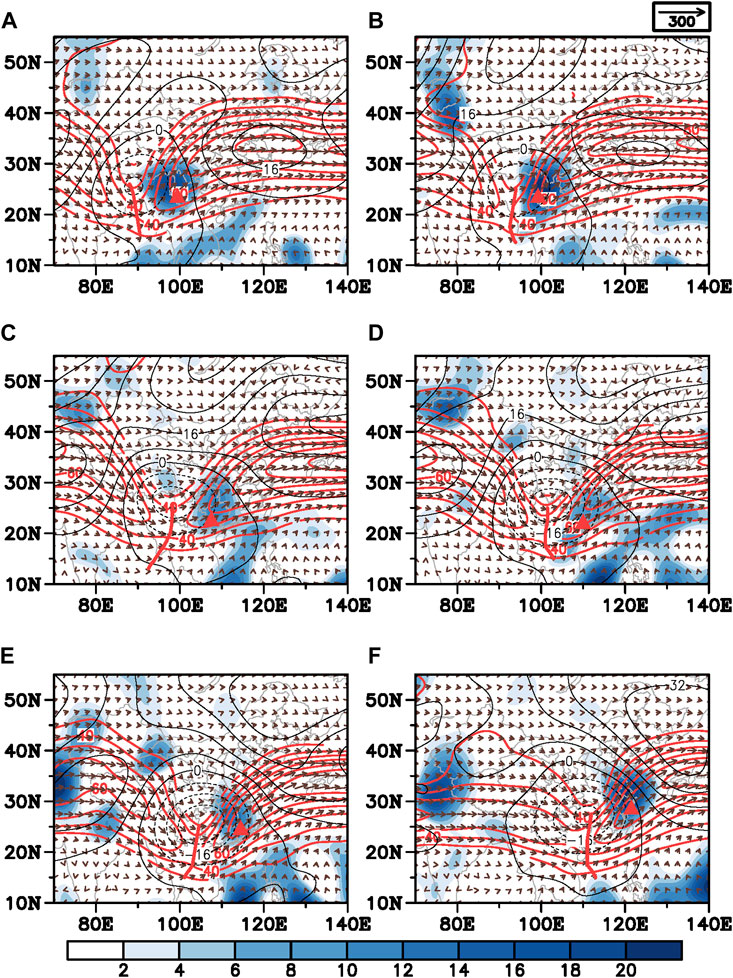
FIGURE 8. Wind field (vectors; units: m s−1), geopotential height anomalies field (black contours; units: 10 gpm) and the divergence of the horizontal winds (shading; units: 10–6 s−1) at 200 hPa on January (A) 8, (B) 9, (C) 10, (D) 11, (E) 12 and (F) 13 in 2015. The red triangle indicates the large-value center of precipitation. Red contours represent zonal wind speeds greater than 30 m·s−1 and the thick red line shows the trough line of the cyclonic curve appearing in the upper westerly jet.
4.2.2 Second stage: Rainfall moving eastward to southeastern China on January 10–13, 2015
On January 10, the SBT began moving downstream in an eastward direction. Especially in the northern part of the SBT, the location of the SBT trough line at 20°–30°N shifted eastward from 90°E to east of 95°E on January 10 (Figure 5C). The intensity of the SBT weakened to 58 gpm. The subtropical high also began to weaken and retreat eastward (Figure 5C). As a result of this weakening of the SBT and the subtropical high, the low-level southwesterly jet and the related transport of water vapor and advection of warm air were also weakened (Figures 6C, 7C). At the same time, the rainfall that occurred over southwestern China began to weaken, especially in Yunnan Province (Figure 3C).
The SBT continued moving eastward on January 11 (Figure 5D) and its intensity weakened to 37 gpm. The circulations in the northern branch of the westerlies also clearly varied. Compared with January 8–9, the ridge in the northern branch of the westerlies disappeared and was replaced by a trough located over the northeast of the Qinghai–Tibetan Plateau on January 11. The SBT in the southern branch of the westerlies and the trough in the northern branch of the westerlies were therefore superimposed in the east of the Qinghai–Tibetan Plateau near 100°–110°E (Figure 5D). The advection of cold air was seen on the eastern edge of the Qinghai–Tibetan Plateau, behind the trough of the northern branch of the westerlies (Figure 7D). The advection of cold air may have invaded southward and interacted with the SBT. In addition, as a result of the eastward movement of the SBT, the tropical water vapor transported by the southwesterly flow appeared in front of the SBT and mainly concentrated in the eastern region of southeastern China (Figure 6D). As a result, the rainfall also moved eastward. Heavy rainfall mainly occurred in Guangdong and Guangxi provinces, while the precipitation over southwestern China gradually weakened and disappeared (Figure 3D).
The SBT continued to move eastward on January 12 to nearly 110°E (Figure 5E). The cold advection originating from mid-latitude invaded southward along the northeastern edge of the Qinghai–Tibetan Plateau to about 20°N and interacted with the SBT, resulting in restrengthening of the SBT (Figure 7E). The intensity of the SBT was reinforced to 58 gpm. The circulation around the SBT showed an almost closed cyclonic system (Figures 5E, 7E). A strong, low-level southerly jet, which appeared in front of the SBT and to the west of the western Pacific subtropical high, transported a plume of warm, moist air from the tropical western Pacific Ocean to southeastern China (Figures 5E, 6E). A warm ridge expanded from the subtropics to mid-latitudes over eastern China (Figure 7E). Correspondingly, rainfall was reinforced in the warm, moist region in front of the SBT and the main areas of heavy rainfall were located in Guangdong and Fujian provinces (Figure 3E). On January 13, the SBT moved eastward to nearly 115° E and gradually merged with the trough of the northern branch of the westerlies (Figure 3F). The regions of heavy rainfall also moved eastward to the coastal areas of southeastern China (Figure 4F).
With the eastward movement of the lower level SBT, the upper level EASJ also exhibited eastward movement during the time period January 10–13 (Figures 8C–F). It seems that the variations in the upper level EASJ were covariant with the lower level SBT activities. The cyclonic curve in the upper level subtropical jet overlapped above the low-level SBT, with slight vertical titling to the west. As a result, the region of strong divergence in the upper levels, which was located on the equator-ward side of the EASJ entrance, overlapped with the lower level region of convergence of moist air, which appeared in the front of the SBT. These vertical configurations contributed to moisture and dynamic conditions favorable for the occurrence of heavy rainfall. Accompanying the synchronous eastward movement of the low-level SBT and the upper level EASJ, the regions of heavy rainfall moved gradually from southwestern to southeastern China (Figure 3).
These variations in the local circulation further confirmed that the heavy rainfall event from January 8 to 13 consisted of two stages. The first stage was from January 8 to 9. The low-level SBT remained stable over the northern Bay of Bengal and the western Pacific subtropical high expanded to the Indochina Peninsula. Southwestern China was located underneath the equator-ward side of the entrance of the upper level EASJ. In this stage, the heavy rainfall mainly occurred over southwestern China. In the second stage (January 10–13), the low-level SBT, the western Pacific subtropical high and the upper level EASJ moved eastward concurrently and the region of heavy rainfall also moved eastward to southeastern China.
4.3 Rossby wave trains along the subtropical westerly jet
In addition to the favorable local conditions, numerous studies have emphasized that the Rossby wave train along the subtropical westerly jet is an important factor in the occurrence of heavy rainfall over southern China in winter (Zong et al., 2014; Huang et al., 2019; Li et al., 2020; Tan et al., 2022). During this rainfall event, the Rossby wave trains clearly propagated downstream in an eastward direction along the subtropical westerly jet (Figure 9). On January 6, the Rossby wave energy originating from western Europe propagated southeastward to the Middle and Eastern Mediterranean and forced disturbance in the subtropical westerly jet (Figure 9A). The waveguide effect of the subtropical westerly jet led to the wave energy dissipating downstream in an eastward direction along the jet (Figure 9B). On January 8–9, the wave energy converged over the Bay of Bengal and southwestern China (Figures 9C, D). The convergence of the wave energy on January 10–13 was gradually moved eastward from southwestern to southeastern China (Figures 9D–H).
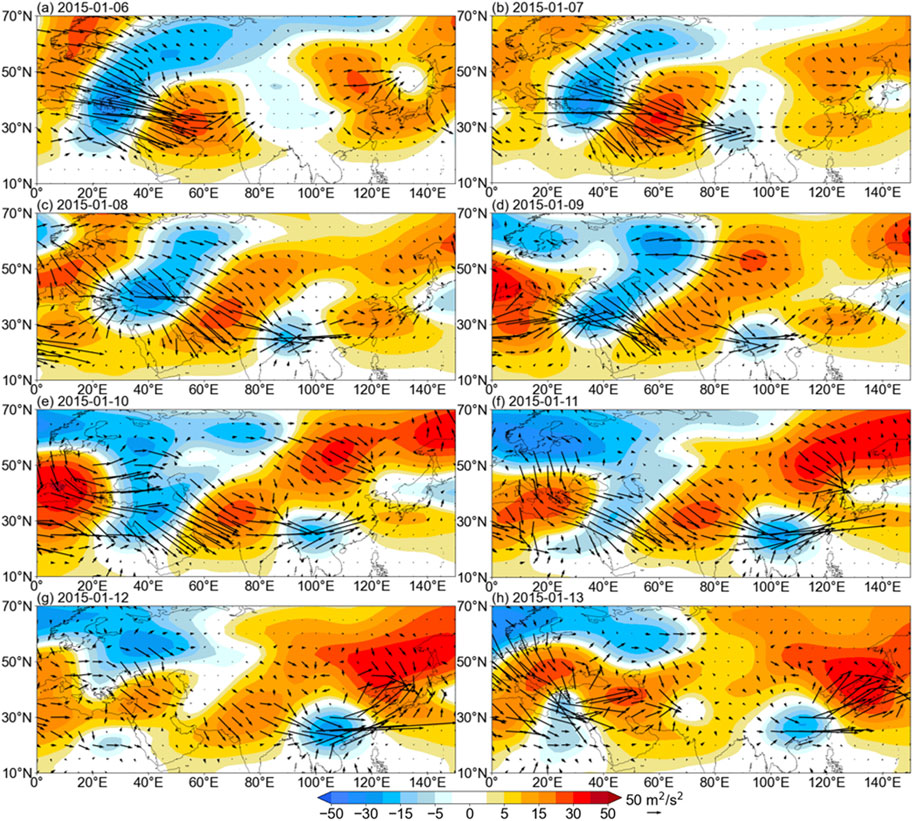
FIGURE 9. Wave activity flux (vectors; units: m2·s−2) and geopotential height anomalies field (shading; units: 10 gpm) at 250 hPa on January (A) 6, (B) 7, (C) 8, (D) 9, (E) 10, (F) 11, (G) 12 and (H) 13 in 2015.
The time–latitude profiles along the axis of the subtropical westerly jet at 25°N shown that there were two distinct Rossby wave packets propagating eastward along the subtropical westerly jet (Figure 10). On January 5–6, the disturbance invaded to the subtropical westerly jet and evoked the Rossby wave trains propagating eastward (Figures 9A, 10). About 4 to 5 days later, the wave energy propagated eastward to, and converged over, southwestern China, where it was associated with the maintenance and occurrence of a stable region of heavy rainfall over southwestern China on January 8–9. The wave train propagated eastward to the west of 100°E and terminated after January 9 as a result of the decay of the wave energy. The rainfall over southwestern China also began to weaken on January 10. On January 8–9, strong wave active fluxes converged near 20°–40°E and evoked a new Rossby wave packet propagating eastward downstream (Figures 9C, D, 10). With the continuous eastward propagation of wave energy, the region of convergence of wave energy over southern China also gradually moved downstream to the east, concurrent with the region of heavy rainfall moving from southwestern to southeastern China.
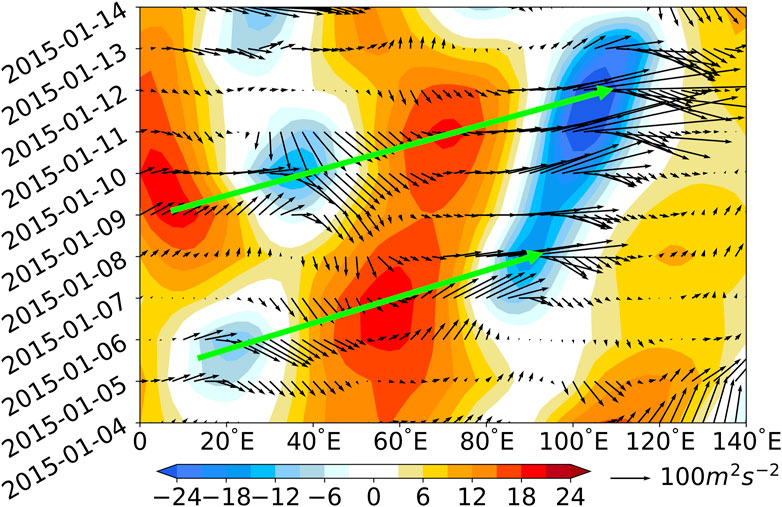
FIGURE 10. Time–longitude profile of the geopotential height anomalies (shading; units: 10 gpm) and the wave activity flux (vectors; units: m2·s−2) at 250 hPa along the axis of the jet stream at 25°N on January 4–14, 2015. The green arrow shows the propagation of the wave train.
The eastward propagation of the Rossby wave trains along the subtropical westerly jet were closely related to the maintenance and movement of rainfall over southern China. The occurrence and development of heavy rainfall over southern China were jointly influenced by the local circulation anomalies and the remote propagation of the Rossby wave train along the upper level subtropical westerly jet.
5 Mechanisms for the variation in heavy rainfall over southern China
5.1 Mechanisms for the occurrence of heavy rainfall over southwestern and southeastern China
5.1.1 First stage: Occurrence of heavy rainfall over southwestern China on January 8–9, 2015
In the first stage, the SBT was stable around 90°E in the northern Bay of Bengal (Figures 5A, B). The western Pacific subtropical high was located over the South China Sea and its western edge expanded to about 105°E (Figure 5A). As a result of the strong pressure gradient between the SBT and the western Pacific subtropical high, a strong low-level southerly jet appeared in front of the SBT (Figures 5A, B) and transported abundant water vapor and warm air from the Bay of Bengal and the western Pacific Ocean to southwestern China (Figures 6A, B, 7A, B). The equivalent potential temperature field was therefore seen as a ridge expanding from the Indochina Peninsula to southwestern China (Figures 7A, B). Strong warm, wet air advection dominated over southwestern China, especially in Yunnan Province.
The topography of southwestern China is very complex (Yuan et al., 2019), which is higher in the northwest and lower in the southeast, and strong orographic gradient appears in the northwest–southeast direction (Figure 1). The southwesterly flow impinged almost perpendicularly on the windward slopes of the mountains in southwestern China. Forced by the topography, the warm, wet air carried by the southerly flow converged and led to frontogenesis at lower levels, thus strong upward motion appeared on the windward slopes of the mountains over southwestern China (Figures 11A, B, 12B). The upward motion transported water vapor from low levels to the mid-troposphere and positive humidity anomalies and saturated moist layers with a relative humidity greater than 90% appeared from the base to the middle of the troposphere over southwestern China, especially on the windward slopes in southwestern China (Figures 11A, B). This is clearly different from the winter climatological condition in that the water vapor is mainly concentrated in the lower troposphere below 700 hPa over southwestern China (Yuan et al., 2018).
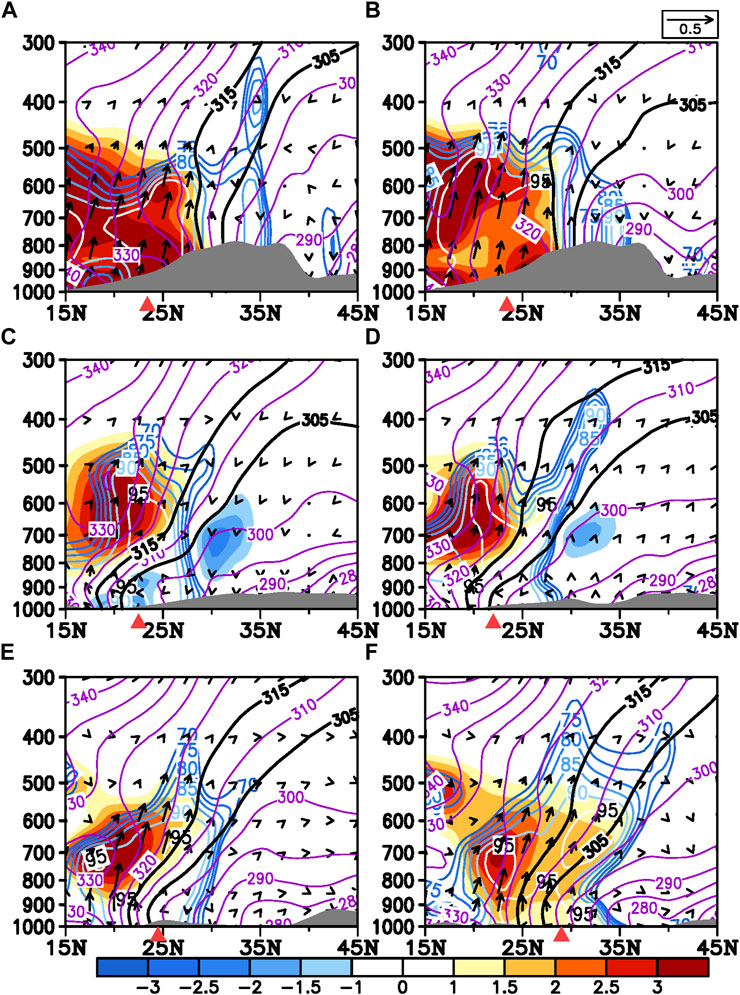
FIGURE 11. Vertical cross-sections along the red dotted lines in Figure 7 for the water vapor flux (vectors; units: kg m−1·s−1), the specific humidity anomalies (shading; units: kg kg−1), the relative humidity (colored contours; units: %), the equivalent potential temperature (purple contour; units: K) along (A) 100°E on January 8, (B) 100°E on January 9, (C) 107°E on January 10, (D) 110°E on January 11, (E) 115°E on January 12 and (F) 120°E on January 13 in 2015. The latitude with the maximum center of daily precipitation is represented by the red triangle. The thick black lines represent the isolines of the equivalent potential temperature at 305 and 315 K. The gray shading shows the shape of the topography.
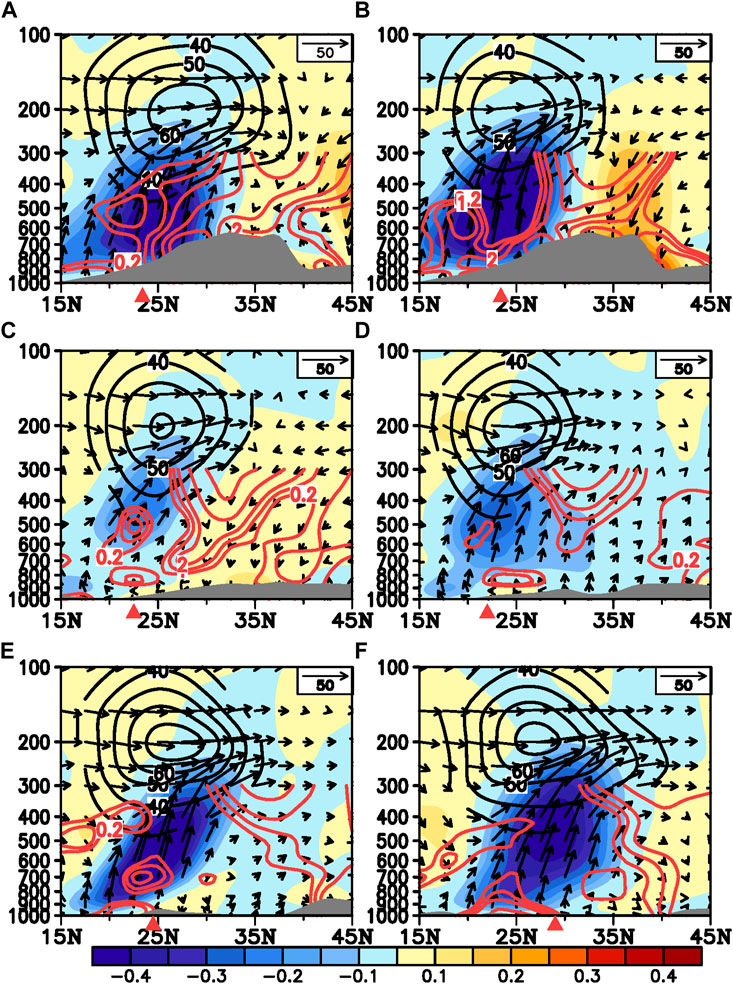
FIGURE 12. Vertical cross-sections along the red dotted lines in Figure 7 for the frontogenesis (positive value as red contours; units: 10 K·m−1·s−1), omega field (shading; units: Pa s−1) and wind field (horizontal wind, units: m s−1; vertical omega, units: 10–2 Pa·s−1) along (A) 100°E on January 8, (B) 100°E on January 9, (C) 107°E on January 10, (D) 110°E on January 11, (E) 115°E on January 12 and (F) 120°E on January 13 in 2015. The black contour indicates the upper level jet with a zonal wind speed greater than 30 m·s−1. The latitude with the maximum center of daily precipitation is represented by the red triangle. The gray shading shows the shape of the topography.
The anomalous increase in moisture in the mid-troposphere led to thickening of the saturated moist layer, which favored the occurrence of heavy rainfall over southwestern China. The orographic effect is therefore an important factor in the first stage, forcing low-level frontogenesis and upward motion and therefore favoring the heavy rainfall that occurred on the southwest windward slopes of the mountains in southwestern China.
Southwestern China was located below the equator-ward side of the entrance of the upper level EASJ (Figures 8A, B). Strong divergence at the upper level caused by the secondary circulation of the EASJ may also have contributed to precipitation over southwestern China. To investigate the configurations of the upper and lower level circulations related to the heavy rainfall process, Figure 12 shows vertical cross-sections along the center of heavy rainfall. On January 8–9, strong, low-level frontogenesis and upward motion appeared on the windward slopes as a result of the orographic forcing effect (Figures 13A, B). As shown in Figure 8A, due to the “deceleration” of the jet stream caused by the wave-current interaction, the upper level of the subtropical jet “broke” on the eastern side of the Qinghai-Tibet Plateau and forms a cyclonic curve, or trough, strong secondary upward motion and related frontogenesis appeared in the mid-to upper levels below the equator-ward side of the entrance of the EASJ (Figure 12B). Deep upward motion therefore occurred throughout the whole troposphere on the windward slopes in southwestern China as a result of the surface orographic forcing effect and the secondary circulation of the upper level EASJ, favoring the occurrence of heavy rainfall. The deep jet-front system, including low-level orographic forcing frontogenesis and the secondary circulation of the upper level EASJ, therefore greatly contributed to the occurrence of heavy rainfall over southwestern China during the first stage of the rainfall event on January 8–9.
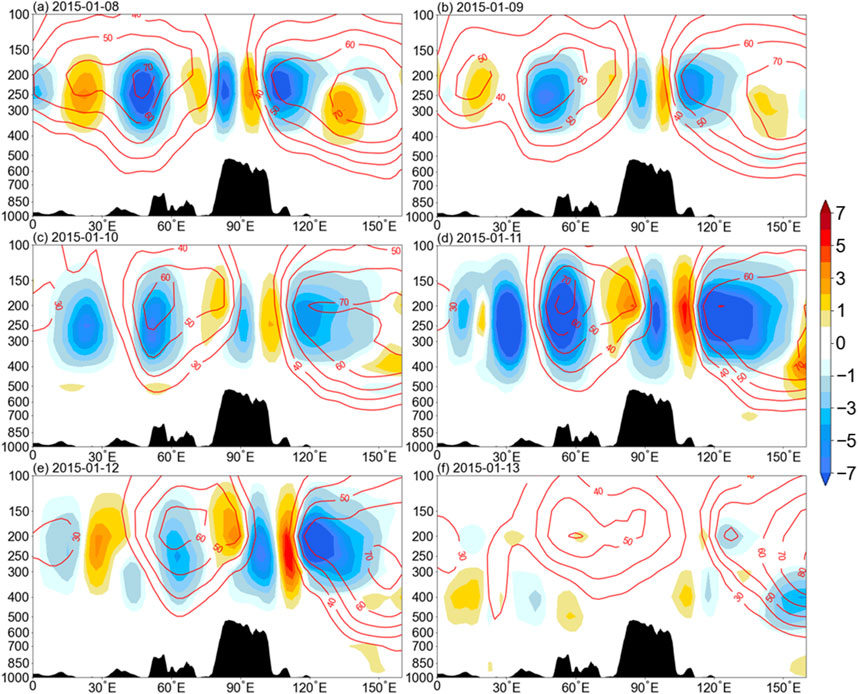
FIGURE 13. The term SA for the transformation of the zonal mean and wave disturbance kinetic energy (shading; units: 10–3 m2·s−3) along the subtropical westerly jet stream axis of 30°N on January (A) 8, (B) 9, (C) 10, (D) 11, (E) 12 and (F) 13 in 2015. The red contour indicates zonal wind speeds greater than 30 m·s−1. The black shading shows the shape of the topography.
5.1.2 Second stage: Occurrence of heavy rainfall over southeastern China on January 10–13, 2015
The subtropical high weakened from January 10 to 13 and its western edge retreated from the Indochina Peninsula to the western Pacific Ocean. The SBT also began to move eastward (Figures 5C–F). On January 10–11, a southwesterly airflow appeared in the front of the SBT and to the west of the subtropical high, transporting water vapor from the Bay of Bengal and the South China Sea to southern China (Figures 6C, D). However, the strength of the transport of water vapor seemed to be weaker than in the first stage on January 8–9 and the region of convergence was further to the east (Figures 6, 11C, D). Correspondingly, the rainfall over southwestern China weakened and the center of rainfall moved from Yunnan Province to the eastern regions of Guangxi and Guangdong provinces (Figures 3C, D).
On January 12–13, the SBT moved eastward to the southeast of the Qinghai–Tibetan Plateau (Figures 5E, F), leading warm, wet air from the South China Sea and the western Pacific Ocean to southeastern China (Figures 6E, F, 7E, F). There was also a deep trough on the northern branch of the westerlies, which was located on the northeast of the Qinghai–Tibetan Plateau (Figures 5E, F). The troughs on the northern and southern branches of the westerlies gradually overlapped near 110°–120°E on January 12–13 (Figures 5E, F). This led to strong advection of the cold air intruding into southeastern China along the southeastern edge of the Qinghai–Tibetan Plateau, which interacted with the warm, wet flow in the front of the SBT, causing it to restrengthen. The average intensity of the SBT on January 12–13 was 73 gpm, which was about 2.9 times that of the climatological value.
The robust warm advection in the front of the SBT intensified the temperature gradient and densified the temperature isolines that appeared in the region (110°–120°E, 25°–30°N) over southeastern China. The cold flow intruding into the back of the SBT also caused an increase in the temperature gradient in the region (100°–115°E, 15°–20°N) (Figures 7E, F). This suggests that warm and cold fronts were both formed in the deep SBT, which therefore featured a cyclonic system over southern China (Figures 5E, F, 7E, F). The heavy rainfall mainly occurred in the region of the warm front over southeastern China, which may be a result of the favorable warm, moist conditions in the front of the SBT.
The vertical profiles showed that the moist airflow in the lower level was transported upward along the warm front and thickened the moist layer from the surface to 500 hPa (Figures 11E, F). The low-level baroclinic frontogenesis forced strong upward motion and transported plentiful water vapor upward to the mid-troposphere, which reinforced the favorable thermal and dynamic conditions for heavy rainfall over southeastern China. Horizontal temperature advection and baroclinic frontogenesis in the second stage therefore greatly contributed to the reinforcement of heavy rainfall over southeastern China.
Interestingly, the “broken” region of the subtropical westerly jet at the upper level also presented an eastward movement during the time period January 10–13. The trough line of the cyclonic curve and the “broken” region moved eastward from 100 to 115°E from January 10 to 13 (Figures 8C–F). The trough line of the cyclonic curve region can be treated as the dividing boundary between the upper level South Asian jet and the East Asian jet. This indicates that the entrance region of the EASJ gradually moved eastward in the second stage. Accordingly, the regions of heavy rainfall were always located below the equator-ward side of the entrance of the EASJ, which exhibited strong divergence in the upper level. Apparent secondary vertical upward motion appeared in the mid-to upper level over the EASJ entrance region (Figures 12C–F). This suggests that the upper level EASJ also had an essential role in the occurrence of heavy rainfall over southeastern China in the second stage. Strong upward motion dominated the whole of the troposphere in the region of heavy rainfall over southeastern China, especially on January 12–13 (Figures 12E, F), indicating that both the lower level upward motion forced by the baroclinic frontogenesis and mid-to upper level uplifting related to the secondary circulation of the EASJ were favorable dynamic factors for the reinforcement of heavy rainfall over southeastern China.
5.2 Roles of the Rossby wave train associated with the occurrence of heavy rainfall
5.2.1 Interactions with the upper level EASJ
The Rossby wave can spread downstream to the east along the subtropical westerly jet. There may be strong interactions between the eastward-propagating Rossby wave train and the westerly jet flow. The wave energy kinetic conversion terms were calculated for the heavy rainfall event of January 8–13 (Figure 13). Associated with the Rossby wave train propagating eastward along the subtropical westerly jet, the conversion term of kinetic energy showed a positive–negative wave train-like pattern and mainly occurred in the upper troposphere above 400 hPa.
On January 8–9, the Rossby wave train triggered by the disturbance near the Mediterranean on January 5–6 propagated eastward and arrived at the eastern Qinghai–Tibetan Plateau (Figures 9, 10). There was positive kinetic energy conversion over the eastern side of the Qinghai–Tibetan Plateau at 90°–110°E above 400 hPa (Figures 13A, B). This indicated that the kinetic energy of the westerly mean flow was converted to the kinetic energy of the wave train. The westerly mean flow therefore weakened and the disturbance of the wave strengthened over the eastern side of the Qinghai–Tibetan Plateau. The subtropical westerly jet was relatively weak and featured as a “break” in the zonal wind speed and a characteristic of the cyclonic curve of the horizontal flow in the upper level (Figures 8A, B). The weakness of the subtropical westerly jet at 90°–110°E caused the jet to “break” and this area became the entrance area of the EASJ. Southwestern China was located underneath the equatorial side of the entrance of the EASJ (Figures 8A, B). The secondary upward circulation of the EASJ favored the powerful dynamic conditions required for the occurrence of heavy rainfall over southwestern China. As a result of the decay of the wave energy, the eastward propagation of the Rossby wave packets just arrived at the eastern side of the Qinghai–Tibetan Plateau and gradually terminated after January 9 (Figure 10). The precipitation process also began to weaken on January 10 (Figure 3C). However, with a new Rossby wave packet propagating eastward downstream on January 8–9, the eastward propagation of the Rossby wave train along the jet stream was re-excited on January 11–12 and spread further eastward downstream to southeastern China (Figure 9D). On January 11–12, associated with the eastward propagation of the Rossby wave train, there was strong positive kinetic energy conversion over the eastward downstream area of 100°–120°E, implying the kinetic energy loss and weakening of the zonal mean flow over there, and the entrance region of the upper level EASJ move further eastward to and above southeastern China. This may have partly contributed to the eastward shift in the heavy rainfall over southern China on January 11–12. On January 13, with the decaying of the wave energy, the eastward propagation of the Rossby wave packets and the conversion of the kinetic energy of the jet wave also gradually weakened (Figure 13F).
The eastward-propagating Rossby wave train can change the morphology of the EASJ via wave–jet interactions and lead to variations in the location of the entrance area of the EASJ. The related secondary upward circulation in the entrance area of the EASJ provided favorable dynamic conditions for the occurrence of heavy rainfall over southwestern and southeastern China.
5.2.2 Impact on the lower level SBT
The Rossby wave train that propagated along the subtropical westerly jet showed a barotropic structure from 700 to 100 hPa, with a slight westward tilt in the vertical direction over East Asia (Figure 14). Associated with the Rossby wave train propagating eastward along the subtropical westerly jet, the conversion term of baroclinic energy also showed a positive–negative wave train-like pattern and mainly occurred in the mid-to lower troposphere below 300 hPa. On January 8–9, accompanying the wave packets eastward propagation and convergence of the Rossby wave train over the northern Bay of Bengal and the western side of the Qinghai–Tibetan Plateau (Figure 10), negative geopotential height anomalies appeared in almost the whole troposphere. This was related to the cyclonic curve trough that appeared in the upper level jet and the strong SBT located at mid-to lower levels over the northern Bay of Bengal. A deep trough was present in the whole of the troposphere over the northern Bay of Bengal (Figures 14A, B). Positive conversion of baroclinic energy appeared behind the vertical deep trough line over the northern Bay of Bengal near 90°E. This indicated that the available potential energy was converted from the basic westerly mean flow to the wave disturbance, which favored the maintenance and strengthening of the SBT in the mid-to lower troposphere. The strengthened SBT provided favorable water vapor conditions for the occurrence of heavy rainfall over southwestern China. On January 10–13, accompanying the second time of the advent of the Rossby wave packets that propagated further eastward downstream along the subtropical westerly jet (Figures 10C–F), the deep trough, which included both the cyclonic trough in the upper level jet and the SBT at mid-to lower levels, gradually moved further eastward from the western to the eastern side of the Qinghai–Tibetan Plateau. (Figures 14C–F). Associated with the deep trough moving eastward, positive and negative conversion of baroclinic energy always accompanied behind and in front of the deep trough line, respectively. While, the positive values behind the trough line were greater than the negative values in front of the trough line. Thus, the net positive baroclinic energy conversion over the deep trough region was favorable for strengthening the lower level SBT, thus keeping the deep trough as a whole move to eastward. This indicated that the eastward movement of the mid-to lower level SBT may be closely related to the eastward propagation of the Rossby wave train. The eastward-propagating Rossby wave train can push the mid-to lower level SBT eastward by modifying the associated baroclinic energy conversion process under the background of the subsidence behind the deep vertical trough over the Qinghai–Tibetan Plateau region. Hence the Rossby wave train along the upper level jet may be an important factor pushing the SBT eastward, which favored the transport of plentiful water vapor further east in the downstream region via the southerly flow in front of the SBT, causing the occurrence of heavy rainfall over southeastern China.
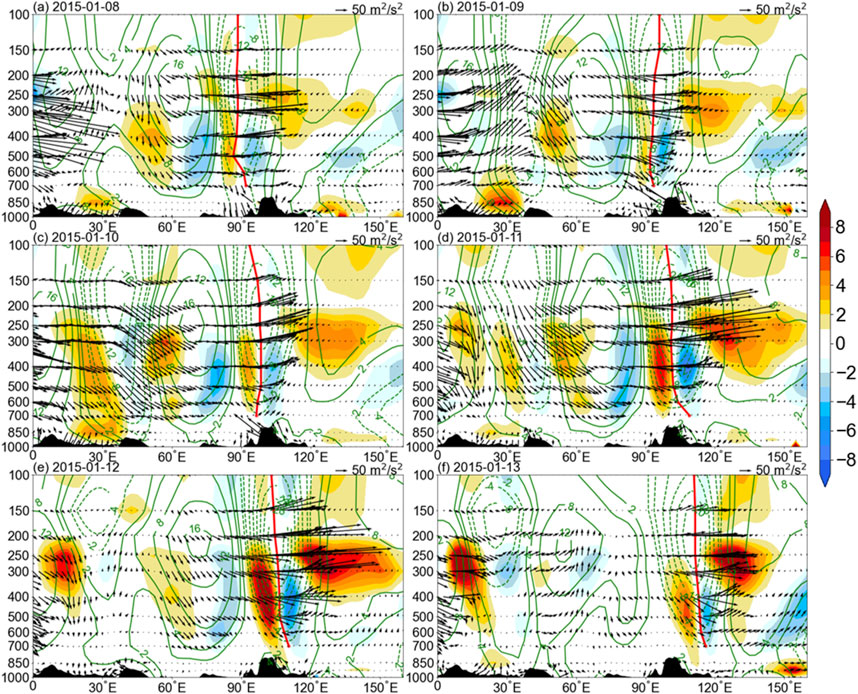
FIGURE 14. The term SB for the potential energy conversion (shading; units: 10–3 m2·s−3), the wave activity flux (vectors; units: m2·s−2) and the geopotential height anomalies (contours; units: 10 gpm) along the subtropical westerly jet stream axis at 25° N on January (A) 8, (B) 9, (C) 10, (D) 11, (E) 12 and (F) 13 in 2015. The red line shows the vertical trough line with the maximum DH value in each layer. The black shading shows the shape of the topography.
6 Summary
Under the background of westerly winds in winter, persistent heavy rainfall over southern China often presents an eastward-moving feature. Heavy rainfall may first occur over southwestern China and then move eastward to southeastern China during the next few days. We analyzed a 6-day heavy rainfall process that occurred over southwestern China on January 8–9, 2015 and then gradually spread eastward to southeastern China on January 10–13, from the perspective of the daily variations in the weather.
Our results showed the important role of the Rossby wave train propagating along the subtropical westerly jet in “pushing” the eastward movement of heavy rainfall over southern China. The remote Rossby wave train influenced the variation of heavy rainfall by modifying the local circulation. The Rossby wave train can change the morphology of the East Asian subtropical jet via wave–jet interactions and modify the related secondary upward circulation in the entrance area of the jet, providing favorable dynamic conditions for the occurrence of heavy rainfall. The Rossby wave train can also influence the low-level SBT by modifying the associated baroclinic energy conversion process, which favors the transport of plentiful water vapor to the region of heavy rainfall over southern China. The eastward-propagating Rossby wave train pushed the upper level East Asian subtropical jet and the lower level SBT as a whole while simultaneously moving east, which caused the region of heavy rainfall to move from southwestern to southeastern China.
The result indicated that the covariations of the upper level jet and lower level SBT linked with the Rossby wave train were important for the eastward movement of the rainfall event. We also obtained the related co-variation mode from the climatological perspective. Previous studies have shown that the activity of the lower level SBT is closely related to the location of the rainfall over southern China in winter (Duan et al., 2012; Li and Li, 2019). Heavy rainfall often occurs over southwestern China when a stationary SBT was located in the northern Bay of Bengal, whereas the expansion of heavy rainfall to southeastern China was associated with eastward movement of the SBT. By identifying the signal of the moving SBT as introduced in Section 2, we carried out EOF analysis of the SBT appearance frequency during the winter in 1981–2016. The EOF2 mode was shown to be an eastward-moving mode of the SBT, with the SBT frequently appearing in the eastern Bay of Bengal and moving further eastward in the downstream regions (Figure 15A). The composite analysis, obtained by using the months in PC2 that were greater than one standard deviation, indicated that the eastward-moving SBT mode is closely related to the pattern of the Rossby wave train along the subtropical westerly jet, and the related rainfall mode shown as a zonal expansion from southwestern to southeastern China that was located under the equatorial-ward of the entrance of the EASJ (Figures 15C, D). These configurations were very similar to the results for the case study on January 8–13, 2015.
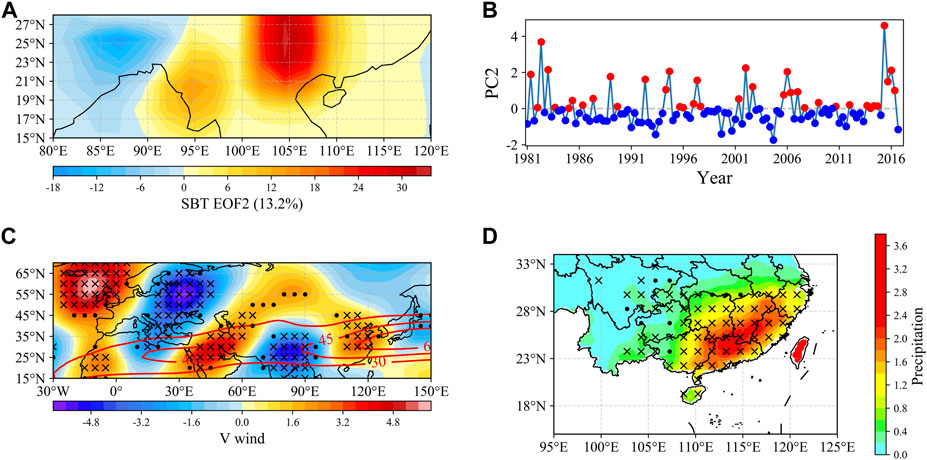
FIGURE 15. EOF2 mode of the SBT appearance frequency during the time period 1981–2016. (A) Spatial distribution. (B) Time series. (C) The 200 hPa meridional wind anomalies (shading; units: m s−1) and zonal winds (red contours; units: m s−1) and (D) the precipitation anomalies (shading; units: mm day−1). The values in parts (C,D) are both composited using the PC2 time series >1.0 standard deviation. The black cross (solid circle) represents the meridional winds in part (C) and the precipitation anomalies in part (D) that are significant at the 95% (90%) confidence level.
Therefore, the results from our case study might successfully revealed the common features in the eastward-moving heavy rainfall events that occurred over southern China in winter. These results will help to provide a scientific basis for forecasting winter rainfall over southern China. However, further more case studies are needed to confirm these features from the climatological perspective.
In addition, the results also shown that this persistent heavy rainfall event occurred in two different stages. In the first stage—that was, from January 8 to 9, 2015—the related heavy rainfall occurred mainly on the windward slopes of the mountains in southwestern China. In the second stage—that was, from January 10 to 13, 2015—the regions of heavy rainfall moved eastward to southeastern China. The favorable configurations of the large-scale circulation were similar during the two rainfall stages. At the lower to mid-level, strong southerly flows, which appeared in front of the SBT and to the west of the subtropical high, transported abundant water vapor to the regions of rainfall. At the upper level, the EASJ had an important role in the occurrence of heavy rainfall over both southwestern and southeastern China. While, the detailed local physical processes and mechanisms favorable to the occurrence of heavy rainfall in southwestern and southeastern China showed some differences. The heavy rainfall over southwestern China was closely related to orographic forcing and mainly occurred on the windward slopes of mountains. The rainfall over southeastern China was mainly attributed to the baroclinic frontogenesis caused by strong warm, wet advection. Numerous previous studies also revealed that the local conditions favored for heavy rainfall occurrence over southwestern China and southeastern China were different, including the underlying surface conditions, the impact of weather systems and cold air activity (Yuan et al., 2018; Li and Li, 2019; Yuan et al., 2019; Chen and Li, 2022; Li et al., 2022), etc. These findings suggested that the characteristics of rainfall and its mechanisms may have regional differences in southern China. These questions also require further deep discussion in the future.
Data availability statement
The original contributions presented in the study are included in the article/supplementary material, further inquiries can be directed to the corresponding author.
Author contributions
Conceptualization, JYu, JYi; formal analysis, JYi, JYu; methodology, JYi, JYu; resources, JYu, WD; writing—original draft, JYi, JYu; writing—review and editing, JYu, TF, JYi; visualization, JYi, JP, XC, MM; translation, JYu, YN, JYi.
Funding
This work was supported by the National Natural Science Foundation of China (Grant No. 41875109 and Grant No. 41930972) and the Natural Science Foundation of Yunnan Province (Grant No. 2018FB074).
Acknowledgments
The authors thank all the scientists and crew members who were involved in the program.
Conflict of interest
The authors declare that the research was conducted in the absence of any commercial or financial relationships that could be construed as a potential conflict of interest.
Publisher’s note
All claims expressed in this article are solely those of the authors and do not necessarily represent those of their affiliated organizations, or those of the publisher, the editors and the reviewers. Any product that may be evaluated in this article, or claim that may be made by its manufacturer, is not guaranteed or endorsed by the publisher.
References
Bueh, C., Shi, N., and Xie, Z. (2011). Large-scale circulation anomalies associated with persistent low temperature over southern China in January 2008. Atmos. Sci. Lett. 12, 273–280. doi:10.1002/asl.333
Chen, W. L., and Li, X. Z. (2022). Synergistic effects of winter heavy precipitation and high and low latitude wave trains in South China. J. Atmos. Sci. 46 (01), 55–69. (In Chinese). doi:10.3878/j.issn.1006-9895.2102.20246
Ding, F., and Li, C. (2017). Subtropical westerly jet waveguide and winter persistent heavy rainfall in south China. J. Geophys. Res. Atmos. 122, 7385–7400. doi:10.1002/2017jd026530
Duan, A. M., and Wu, G. X. (2005). Wave-current interaction and atmospheric energy cycling under non-adiabatic conditions. Sci. China Earth Sci. 04, 352–360.
Duan, X., Tao, Y., and Xu, M. L. (2012). Influence of the south branch trough of the westerly flow on the weather in Yunnan. Plateau Meteorol. 31, 1059–1065. (In Chinese).
Gao, T., Zhang, Q., and Luo, M. (2020). Intensifying effects of El Niño events on winter precipitation extremes in southeastern China. Clim. Dyn. 54, 631–648. doi:10.1007/s00382-019-05022-6
García, H. R., Gallego, P. D., Hernández, M. E., Presa, L. G., and Rodriguez, P. R. (2001). Influence of the North Atlantic oscillation on the canary islands precipitation. J. Clim. 14 (19), 3889–3903. doi:10.1175/1520-0442(2001)014<3889:iotnao>2.0.co;2
Guo, R. F., Gao, A. S., and Yang, S. Y. (2010). Comparison analysis of two heavy rain processes on the plateau at low latitude caused by the southern branch trough in winter Trans. J. Atmos. Sci. 33 (1), 82–88. (In Chinese).
Ha, K. J., Heo, K. Y., Lee, S. S., Yun, K. S., and Jhun, J. G. (2012). Variability in the East asian monsoon: A review. Meteorol. Appl. 19, 200–215. doi:10.1002/met.1320
Hu, K. M., Gang, H., Wu, R. G., and Wang, L. (2018). Structure and dynamics of a wave train along the wintertime Asian jet and its impact on East Asian climate. Clim. Dyn. 51, 4123–4137. doi:10.1007/s00382-017-3674-1
Huang, D. Q., Zhu, J., Zhang, Y. C., and Huang, A. N. (2014). The different configurations of the East Asian polar front jet and subtropical jet and the associated rainfall anomalies over eastern China in summer. J. Clim. 27, 8205–8220. doi:10.1175/jcli-d-14-00067.1
Huang, D., Dai, A., Zhu, J., Zhang, Y., and Kuang, X. (2017). Recent winter precipitation changes over Eastern China in different warming periods and the associated East Asian jets and oceanic conditions. J. Clim. 30 (12), 4443–4462. doi:10.1175/jcli-d-16-0517.1
Huang, W. Y., Yang, Z. F., He, X. S., Lin, D. Y., Wang, B., JonathonWrightChen, S. R. Y., et al. (2019). A possible mechanism for the occurrence of wintertime extreme precipitation events over South China. Clim. Dyn. 52, 2367–2384. doi:10.1007/s00382-018-4262-8
Kalnay, E., Kanamitsu, M., Kistler, R., Collins, W., Deaven, D., Gandin, L., et al. (1996). The NCEP/NCAR 40-year Reanalysis project. Am. Meteorological Soc. 3, 437–471. doi:10.1175/1520-0477(1996)077<0437:tnyrp>2.0.co;2
Knippertz, P. (2004). A simple identification scheme for upper–level troughs and its application to winter precipitation variability in northwest africa. J. Clim. 17 (6), 1411–1418. doi:10.1175/1520-0442(2004)017<1411:asisfu>2.0.co;2
Li, Y., and Li, C. (2019). An analysis on a heavy rain weather process during 8-13 January, 2015 in Southern China. Period. Ocean Univ. China 49, 11–19. (In Chinese). doi:10.16441/j.cnki.hdxb.20180157
Li, C., and Sun, J. (2015). Role of the subtropical westerly jet waveguide in a southern China heavy rainstorm in December 2013. Adv. Atmos. Sci. 32, 601–612. doi:10.1007/s00376-014-4099-y
Li, X. Z., and Zhou, W. (2016). Modulation of the interannual variation of the India–Burma Trough on the winter moisture supply over Southwest China. Clim. Dyn. 46, 147–158. doi:10.1007/s00382-015-2575-4
Li, X. Z., Chen, D., and Zhou, W. (2017). Response of winter moisture circulation to the India–Burma trough and its modulation by the South asian waveguide. J. Clim. 30 (4), 1197–1210. doi:10.1175/jcli-d-16-0111.1
Li, X. Z., Wen, Z. P., and Huang, W. R. (2020). Modulation of south Asian jet wave train on the extreme winter precipitation over southeast China: Comparison between 2015/16 and 2018/19. J. Clim. 33, 4065–4081. doi:10.1175/jcli-d-19-0678.1
Li, C., Li, Y., Fu, S. M., Jiang, X. W., Wang, X. F., Li, S. S., et al. (2022). A new perspective on the orographic effect of the windward slope on the multi-scale eastward-Moving southwest vortex systems. Atmos. Res. 279, 106365. doi:10.1016/j.atmosres.2022.106365
Liao, Z., and Zhang, Y. (2013). Concurrent variation between the East Asian subtropical jet and polar front jet during persistent snowstorm period in 2008 winter over southern China. J. Geophys. Res. Atmos. 118 (12), 6360–6373. doi:10.1002/jgrd.50558
Lin, Z. Q. (2015). Objective identification method of south branch trough and its climatic characteristics. Plateau Meteorol. 34, 684–689. (In Chinese). doi:10.7522/j.issn.100020534.2014.00016
Lin, Z. Q. (2016). Influence of the south trough on the half-year daily precipitation in winter over the southwest plateau region. Plateau Meteorol. 35, 1456–1463. (In Chinese).
Liu, K., Zha, J. L., Yang, R. W., and Chen, J. L. (2018). A new dynamical index for India-Burma trough. Adv. Meteorol. 2018, 1–10. doi:10.1155/2018/5215093
Liu, A., Huang, Y., and Huang, D. (2022). Inter-model spread of the simulated winter surface air temperature over the Eurasian continent and the physical linkage to the jet streams from the CMIP6 models. J. Geophys. Res. Atmos. 127, e2022JD037172. doi:10.1029/2022JD037172
Luo, X., and Zhang, Y. (2015). The linkage between upper-level jet streams over East Asia and East Asian winter monsoon variability. J. Clim. 28 (22), 9013–9028. doi:10.1175/jcli-d-15-0160.1
Ninomiya, K. (1984). Characteristics of Baiu front as a predominant subtropical front in the summer Northern Hemisphere. J. Meteorol. Soc. Jpn. 62, 880–894. doi:10.2151/jmsj1965.62.6_880
Qin, J., Pan, L. N., and Shi, L. (1991). Influences of the southern trough and strong cold air on the winter weather over Yunnan province. Meteorological 17, 39–43. (In Chinese). doi:10.7519/j.issn.1000-0526.1991.3.009
Suo, M. Q., Ding, Y. H., and Wang, J. Y. (2008). Relationship between Rossby wave propagation in southern branch of westerlies and the formation of the southern branch trough in wintertime. J. Appl. Meteorol. 19 (6), 731–740. (In Chinese). doi:10.11898/1001-7313.20080613
Takaya, K., and Nakamura, H. (2001). A formulation of a phase-independent wave-activity flux for stationary and migratory quasi-geostrophic eddies on a zonally varying basic flow. J. Atmos. Sci. 58, 608–627. doi:10.1175/1520-0469(2001)058<0608:afoapi>2.0.co;2
Tan, G. R., Wang, X. Z., Wang, Y. G., and Yu, M. (2022). Possible causes of the excessive precipitation over South China in 2021/22 winter. Atmos. Res. 280, 106432. doi:10.1016/j.atmosres.2022.106432
Wang, T. M., Yang, S., Wen, Z. P., Wu, R. G., and Zhao, P. (2011). Variations of the winter India–Burma Trough and their links to climate anomalies over southern and eastern Asia. J. Geophys. Res. Atmos. 116 (D23). doi:10.1029/2011jd016373
Watanabe, M. (2004). Asian jet waveguide and a downstream extension of the North Atlantic oscillation. J. Clim. 17, 4674–4691. doi:10.1175/JCLI-3228.1
Wen, M., Song, Y., Kumar, A., and Zhang, P. (2009). An analysis of the large-scale climate anomalies associated with the snowstorms affecting China in january 2008. Mon. Weather Rev. 137 (3), 1111–1131. doi:10.1175/2008mwr2638.1
Yang, S., Lau, K. M., and Kim, K. M. (2002). Variations of the East Asian jet stream and Asian—Pacific—American winter climate anomalies. J. Clim. 15 (3), 306–325. doi:10.1175/1520-0442(2002)015<0306:VOTEAJ>2.0.CO;2
Yeh, T. C. (1950). The circulation of the high troposphere over China in the winter of 1945-46. Tellus 2, 173–183. doi:10.1111/j.2153-3490.1950.tb00329.x
Yuan, J. P., Zhao, D., Yang, R. W., and Yang, H. F. (2018). Predecessor rain events over China's low-latitude highlands associated with Bay of Bengal tropical cyclones. Clim. Dyn. 50, 825–843. doi:10.1007/s00382-017-3643-8
Yuan, J. P., Lü, J., Feng, D., Mao, M. N., Feng, T., Yin, J. Y., et al. (2019). Heavy rainfall events in southern China associated with tropical cyclones in the Bay of bengal: A case study. Atmosphere 10, 574. doi:10.3390/atmos10100574
Zhang, D., and Chen, L. (2021). Possible mechanisms for persistent anomalous rainfall over the middle and lower reaches of Yangtze River in winter 2018/2019. Int. J. Climatol. 41, 6324–6335. doi:10.1002/joc.7197
Zhang, Y., Yan, P., Liao, Z., Huang, D., and Zhang, Y. (2019). The winter concurrent meridional shift of the East Asian jet streams and the associated thermal conditions. J. Clim. 32 (7), 2075–2088. doi:10.1175/JCLI-D-18-0085.1
Zong, H. F., Bueh, C., Wei, J., and Chen, L. T. (2012). Intensity of the trough over the Bay of bengal and its impact on the southern China precipitation in winter. Atmos. Ocean. Sci. Lett. 5, 246–251. doi:10.1080/16742834.2012.11446998
Keywords: eastward moving heavy rainfall event, southern China, Rossby wave train, south branch trough, East Asian subtropical jet
Citation: Yin J, Yuan J, Peng J, Cao X, Duan W, Nan Y, Mao M and Feng T (2023) Role of the subtropical westerly jet wave train in the eastward-moving heavy rainfall event over southern China in winter: A case study. Front. Earth Sci. 11:1107674. doi: 10.3389/feart.2023.1107674
Received: 25 November 2022; Accepted: 27 January 2023;
Published: 08 February 2023.
Edited by:
Jianhua Sun, Institute of Atmospheric Physics (CAS), ChinaReviewed by:
Cholaw Bueh, Institute of Atmospheric Physics (CAS), ChinaYali Zhu, Institute of Atmospheric Physics (CAS), China
Copyright © 2023 Yin, Yuan, Peng, Cao, Duan, Nan, Mao and Feng. This is an open-access article distributed under the terms of the Creative Commons Attribution License (CC BY). The use, distribution or reproduction in other forums is permitted, provided the original author(s) and the copyright owner(s) are credited and that the original publication in this journal is cited, in accordance with accepted academic practice. No use, distribution or reproduction is permitted which does not comply with these terms.
*Correspondence: Junpeng Yuan, anB5dWFuQHludS5lZHUuY24=