 J. P. Bernal1*
 F. Revolorio2M. Cu-Xi2F. Lases-Hernández3
 P. Piacsek1
 Matthew S. Lachniet4
 Patrica A. Beddows5
 G. Lucia4K. López-Aguiar3S. Capella-Vizcaíno3†R. López-Martínez6O. J. Vásquez2
- 1Centro de Geociencias, Universidad Nacional Autónoma de México, Campus UNAM Juriquilla, Querértaro, Mexico
- 2Carrera de Geología, Centro Universitario del Norte, Universidad de San Carlos Guatemala, Alta Verapaz, Guatemala
- 3Facultad de Química, Universidad Nacional Autónoma de México, Unidad de Química en Sisal, Parque Científico y Tecnológico de Yucatán, Mérida, YUC, Mexico
- 4Department of Geoscience, University of Nevada, Las Vegas, NV, United States
- 5Department of Earth & Planetary Sciences, Northwestern University, Evanston, IL, United States
- 6Instituto de Geología, Universidad Nacional Autónoma de México, Ciudad Universitaria, Mexico City, Mexico
Guatemala is located at the core of one of the largest warming pools in the planet, the Western Hemisphere Warm Pool, an important source of tropical moisture to middle and high latitudes and, thus, a key area for paleoclimatic studies. This, along the karst pervasiveness in the area provides the opportunity to obtain high-resolution records of past hydroclimatic conditions using stalagmites. Despite this, the atmospheric and geochemical processes that might affect the variability of geochemical proxies in stalagmites are yet to be constrained, as no cave-monitoring in the area has been carried out previously. Here, we present a 2.5-year cave-monitoring study from Gruta del Rey Marcos, Guatemala, which allows to understand the effect of external atmospheric and environmental conditions upon the variability of δ18O, Mg/Ca, Sr/Ca, and Ba/Ca in drip water. By incorporating cave ventilation dynamics, isotopic information of local rainfall and cave-river water, we are able to understand the most relevant processes that affect the variability of the geochemical proxies in drip water, hence stalagmites. Our results suggest that two-isotopically distinct rainfall regimes, as well as tropical cyclones affecting the area contribute to the composition of the drip-water, hence the resulting stalagmites, with low δ18O (∼-6‰ VSMOW) values indicative of strong convective activity, whilst high δ18O values (−4.5 and −5‰ VSMOW), are indicative of poor convection and proportionally more significant winter-frontal rainfall. We also demonstrate that the trace-element composition of drip water is largely modulated by PCP, and thus, the variability in underlying stalagmites can be interpreted to reflect changes in karst humidity, with low E/Ca ratios (E = Mg, Sr, Ba), indicative of a wet epikarst and high E/Ca ratios indicative of a dry epikarst. Our results provide essential information for the interpretation of the δ18O and trace element variability in stalagmites, which can result in robust paleoclimatic reconstructions from Gruta del Rey Marcos and elsewhere in central America and southern Mexico.
1 Introduction
Cave-monitoring has become an essential protocol to interpret the observed variability of geochemical proxies in stalagmites; as it allows for the potential identification and characterization of the atmospheric, environmental, and geochemical processes occurring in the epikarst, that can control the isotopic and elemental composition of drip-waters and neo-formed calcite (Fairchild and Baker, 2012; Treble et al., 2022), providing a more robust interpretation of the observed variability in stalagmites. Whilst most paleohydroclimatic reconstructions are based on the variability of carbonate δ18O (Lachniet, 2009), there is increasing interest in using additional geochemical proxies, such as trace elements, to extract further environmental information from stalagmites that can yield potentially more robust paleohydroclimate and paleoenvironmental reconstructions from stalagmites. Trace-elements (TE) systematics in karstic aquifers, however, can be significantly more complex than those for δ18O due to a myriad of local geochemical and environmental factors that impinge a degree of complexity not observed for δ18O, and so far, hinders the widespread use of TE variability in stalagmites as a proxy for different environmental processes.
The understanding of the geochemical and environmental processes that might control the abundance or variability of TE in drip-water, hence stalagmites has improved significantly during the last decades (e.g., Huang et al., 2001; Borsato et al., 2007; Fairchild and Treble, 2009; Hartland et al., 2012; Wassenburg et al., 2020). However, the general recognition of epikarstic complexity, and its influence on the drip-water composition, requires careful monitoring of its seasonal and annual variability for each location, with a special focus on drip sites feeding stalagmites with potential for collection (Treble et al., 2015). The prolonged monitoring allows to identify the seasonal signals, characterize the drip-water flow and carbonate precipitation regimes, identify the effects of atmospheric and environmental conditions on drip-water chemistry, and the chemical and isotopic composition of the calcite or aragonite precipitated. Consequently, based upon the key assumption that such processes occurred during stalagmite growth, cave and drip water monitoring enhances the robustness of the corresponding paleohydrological records by providing information on the processes that modulate TE and δ18O variability in the corresponding stalagmite.
Here, we report the 2.5-year monitoring of two drip-sites at Gruta del Rey Marcos, in Cobán, Alta Verapaz, Guatemala, a touristic cave hosted in Cretaceous limestone from the Cobán formation (Sapper, 1937). Guatemala is located at the core of the Western Hemisphere Warm Pool, one of the largest warming pools in the planet (Figure 1A), and one of the main sources of tropical moisture to middle and high latitudes, including the North American Monsoon (Adams and Comrie, 1997; Barlow et al., 1998). The area has been considered a climate-change “hot-spot” due to its sensitivity to the anthropogenic warming of the atmosphere (Giorgi, 2006), with expected reductions in rainfall between −10% and −30% (IPCC, 2014), or larger by the end of the 21st century (Fuentes-Franco et al., 2015; Depsky and Pons, 2020), as well as an increase in the frequency of extreme events (Durán-Quesada et al., 2020). Recent paleohydrological reconstructions from the Late Quaternary have shown that the amount of moisture arriving to Central America are poorly correlated with insolation (Hodell et al., 2008; Winter et al., 2020), in contrast to the observed strong correlation between moisture and insolation in southern Mexico (Bernal et al., 2011; Lachniet et al., 2013). The latter, highlights the complexity of the atmospheric dynamics in Central America and Southern Mexico, as well as the necessity to improve our understanding of the processes that can modulate the variability of different geochemical proxies in stalagmites to provide more robust paleohydrological reconstructions. Additionally, such records from the area can provide crucial climatological context to the rich cultural history of the area. The long-term monitoring generates information that supports the identification of the main processes modulating the variability of TE and δ18O in stalagmites in two drip sites under different dripping regimes.
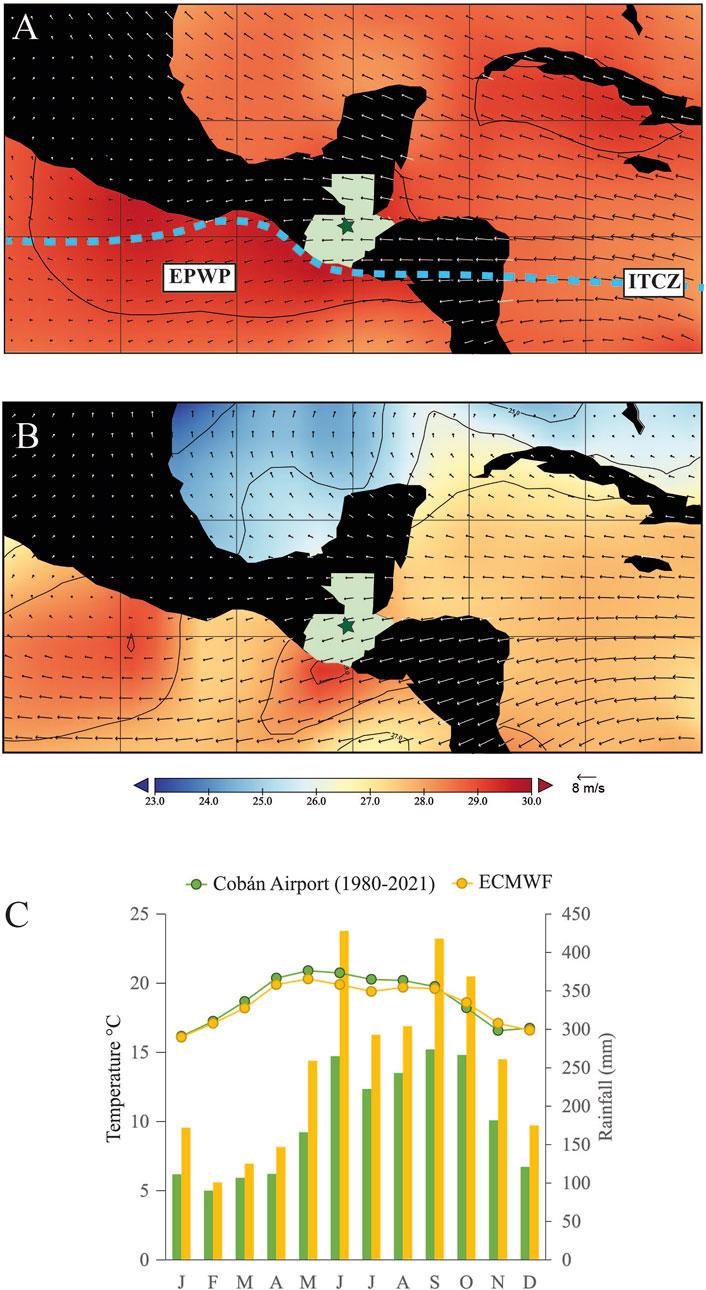
FIGURE 1. Location of Gruta del Rey Marcos in central Guatemala (A) May-October 1980–2010 average sea surface temperature and 850 mBar wind vectors, highlighting the Eastern Pacific Warm Pool (EPWP). Image provided by the NOAA/ESRL Physical Sciences Laboratory, Boulder Colorado from their Web site at http://psl.noaa.gov/- blue dashed line indicates the approximate position of the ITCZ during the northern hemisphere summer. (B) November–April 2,980–2010 average SST and wind vectors. (C) Monthly average (1980–2020) temperature and rainfall for Coban using data for Coban Airport (INSIVUMEH, 2021) and from the European Center for Medium-Range Weather Forecast, obtained from climate-data.org.
2 Study area
2.1 Climatic setting
The climate in Cobán is humid tropical, with a mean annual temperature (MAT) of 18.5 +/− 1.5°C and significant rainfall throughout the year, with mean annual precipitation (MAP) for the 1980–2020 period of ∼2000 mm (INSIVUMEH, 2021; climate-data.org). Historic data from Coban airport and EWCP models show that summer rainfall (May-October) accounts for approximately 65% of total precipitation (Figure 1C) and it is associated with strengthening of the trade winds, high eastern Pacific, and Caribbean/western Atlantic SST, and the ITCZ reaching its northern position (Figure 1A), which foster convection over the continent (Giannini et al., 2000). The summer rainfall has a bimodal distribution due to a mid-summer drought or break (Figure 1C), associated with strengthening of subsidence over the Caribbean basin (Knaff, 1997), leading to a further intensification of the trade winds and reduced convection, hence reduced precipitation during July-August (Magaña et al., 1999). The Caribbean SST increases during late August and early September, leading to a second precipitation maximum in October. The so-called dry-season (November to April) results from low Caribbean SSTs, weakened trade winds (Figure 1B) and enhanced subsidence over the Caribbean basin, hampering the development of convection (Giannini et al., 2000). However, significant extratropical precipitation can reach Guatemala due to the incursion of cold and dry polar air-masses (also called “nortes”) that interact with warm and moist air producing significant frontal rain, that accounts for ∼35% of the annual precipitation, Figure 1C (Nowlin and Parker, 1974; Garreaud, 2001). We note that throughout the paper we refer to “wet season” to the monsoon related rainfall between May and November, and “dry season” to the rainfall between December and April; despite the climatological data (Figure 1C) indicating that clearly shows that a significant amount of rainfall reaches the area during the “dry-season”.
Interannual variability in the area is mostly modulated by ENSO (Giannini et al., 2001). During El Niño phase, the reduction of the SST gradient between the eastern Pacific cold tongue region and the Mexican coast warm pool, leads to a more southerly ITCZ, resulting in decreased summer precipitation in Central America and southern Mexico (Magaña et al., 2003). However, the incursion of polar air masses results in increased precipitation between November and April. In contrast, during the wet season in La Niña years, Northern Guatemala is also susceptible to the arrival of tropical storms from the Caribbean and the Pacific basins, with more tropical storms approaching southern Mexico (Curtis, 2002).
2.2 Geological and topographical setting
Gruta del Rey Marcos (GRM) is located in the locality of San Juan Chamelco (15° 25'28"N; 90° 19'42"W), Alta Verapaz, in the Guatemalan highlands (Figure 1A). Alta Verapaz is mainly located in one of the four central geological provinces of Guatemala, dominated by limestones in the high- and lowlands. GRM is situated 15 km to the east-southeast (ESE) from Cobán City and approximately 220 km northeast of Guatemala City (Figure 1A). The cave is hosted in the lower Cobán Formation (Wug et al., 1995), composed of crystalline calcite (CaCO3) and dolomite (CaMg(CO3)2), the latter particularly abundant in the upper section of the formation (Valdés Paredes, 2017). The cave is 675 m in length and its entrance is located at 1,350 m a.s.l; the first 100 m from the entrance slopes upwards, with grades of 18°–20° with some thalweg and channel facies during the first 50 m (Figure 2), with a phreatic morphology guided by an active river. The morphology changes after a narrow passage to a flatter and wider morphology, with ceilings up to 12 m high. In this part (points 5 to 9 in Figure 2), the near-flat morphology allows the formation of small terraces and ponds and is the only section of the cave with significant speleothem formation. After point 9, the morphology abruptly changes to a more sloping conduit of about 12°–15°. The slope gradient through the cave allows an altitude difference of approximately 18.7 m between the entrance and point 9 (the deepest monitoring point). The two water monitoring sites reflect the most abundant dripping types that distinguish between the drip rate and fractures in the host rock structure. Drip site 1 (DS1) is located among a wide variety of “candlestick” speleothems, characteristic of a matrix seepage flow infiltration regime, whilst drip site 2 (DS2) nearby location has reduced speleothem formation and is characteristic of a storage fracture-dominated regime (Fairchild and Baker, 2012). Their flow characteristics are discussed below.
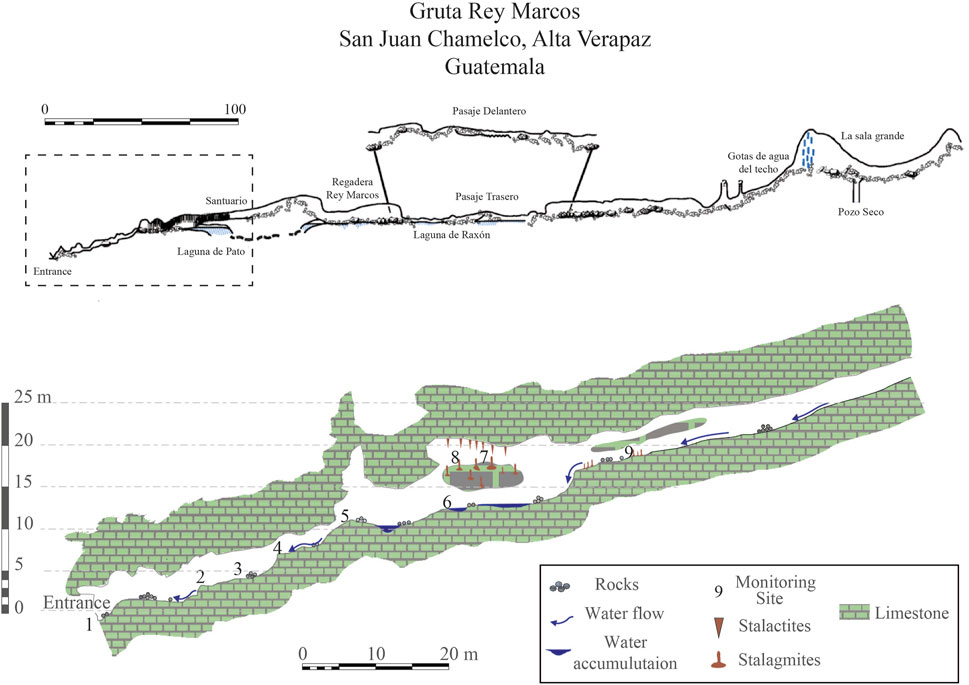
FIGURE 2. Top: Topographic map of Gruta del Rey Marcos originally drawn using compass and measuring tape. Bottom: High-resolution map of the first 100 m drawn using a laser of the cave indicating the different points monitored during this study. Points 8 and 9 are DS1 and DS2, respectively, in the text. Note that vertical and horizontal scales differ.
3 Methods
3.1 Rainfall collection
Prior to initiating the cave monitoring in GRM, rainfall water was collected during the wet season (June-November) of 2012 in Cobán, AV. A wedge rain gauge was installed at an open field at a farm near the cave (Finca Monte-Azul Chiraxque 15°26’N, 90°20’W), at ground level, free from interferences from buildings or trees. Rainfall was collected daily before 8 a.m. to minimize the potential for evaporation. After recording the rainfall from the previous 24-h period, an aliquot was extracted and stored in vacutainers, sealed, and cool-stored before analyses. We note that the rainfall samples collected here correspond to an ENSO-neutral period.
3.2 Cave monitoring and drip-water sampling
The cave was monitored with nearly monthly visits between July 2019 and November 2021, at the end of a short-lived El Niño phase (January—March 2019) but in the midst of a 7-year long drought characterized by a summer rainfall deficit of ∼35% in central and northern Guatemala (Depsky and Pons, 2020). Based upon the Multivariate ENSO Index Version 2 (NOAA, 2002), the first half of the monitoring was under ENSO neutral conditions, whilst the second half (May-2020 onwards) under La Niña conditions. The monitoring period was characterized by one important cold-front reaching Guatemala (C.F. 23 January 2020)), and 3 significant tropical storms in 2020: Nana (September), Eta (early November), and Iota (late November). The latter two punctuate the rainfall record with more than 1,000 mm of rainfall within one month.
Cave monitoring include cave temperature, atmospheric pressure, CO2, and relative humidity were systematically monitored at nine different positions in the cave, starting the cave entrance (Figure 2). Two drip sites were instrumented with two Hobo U23 temperature and %RH data loggers, and two Arduino-based, custom-made drip sensors (Beddows and Mallon, 2018). Additionally, temperature and CO2 were measured with a pSENSE portable CO2 monitor, and atmospheric pressure was measured with an LPS25H barometer sensor from STMicroelectronics. Each measurement was recorded only after allowing the sensor to stabilize for a minimum of 10 min at each site. We note that pCO2 values reported here correspond to the partial pressure of CO2, calculated as the product between the CO2 concentration recorded at the cave (ppmV) and the measured cave atmospheric pressure (mBar), divided by 106.
During each visit, an acid-clean HDPE bottle was placed under the monitored drip sites and left to collect water until the next visit. We also monitored each drip-site pH, conductivity, alkalinity, and Ca concentration using selective electrodes (Horiba LAQUAtwin) calibrated with factory-provided standard solutions. All measurements and calibrations were carried out inside the cave and immediately after sample collection. Aliquots of 5–10 mL of the collected sample were separated and stored in a vacutainer for stable-isotope analysis; the remaining sample was filtered with a 0.44 μm PTFE Teflon membrane and acidified with two drops of 3x-distilled concentrated HNO3 and sealed. All samples were stored and refrigerated until analysis. Finally, we note that despite efforts to grow neoformed calcite from the monitored drip water points, no calcite growth was observed throughout the monitoring period in either drip-site.
3.3 Analysis of trace elements and δ18O, δ2H in water samples
Trace element analyses in drip and river water samples were carried out at Laboratorio de Geoquimica Ambiental in Centro de Geociencias, México. The samples were diluted 10x in ultrapure 2% HNO3 and analyzed for Mg/Ca, Sr/Ca, and Ba/Ca ratios using a Thermo iCap duo 6500 ICPOES. The analysis consisted of a block of ten samples bracketed by an in-house cave-water standard previously characterized for its elemental composition, and acid blanks. The intensity ratios were converted to elemental ratios following de Villiers et al. (2002); the resulting elemental ratios have uncertainties of ∼3%. Mg, Ca, Sr and Ba concentrations were also calculated against IV-ICPMS-71A reference material. These concentrations, along with the physicochemical parameters measured inside the cave were used to calculate saturation indices (Appelo and Postma, 2004) using PHREEQc 3.7.1 (Parkhurst and Appelo, 1999). Unfortunately, S.I. calculations are limited to the first half of the monitoring period, as precise pH-measurements were not possible due to instrument failure and the impossibility of replacement due to the COVID-19 pandemic, during the second half of the monitoring period.
Rainfall water samples were analyzed at the Las Vegas Isotope Science Laboratory at the Department of Geoscience, University of Nevada Las Vegas. The samples were analyzed on a high-temperature thermal conversion elemental analyzer (TC/EA) by pyrolysis at 1,450°C in a stream of ultra-high purity helium. Microliter size injections were repeated six times for each water sample, discarding the first 2-3 injections to remove any memory effect. The resulting CO and H2 gases were analyzed relative to reference gases via a ConFlo III interface on a ThermoElectron Delta V Plus isotope ratio mass spectrometer. An offline correction was applied using internal standards that have values defined on a scale such that δ18O and δ2H values of the VSLAP standard are exactly −55.5 and −428‰, respectively (Coplen, 1996). Typical uncertainties are 0.1‰ and 2‰ for δ 18O and δ 2H, respectively.
Drip and river-water samples were analyzed at Laboratorio de Análisis de Isótopos Estables in Yucatán, Mexico using a Gasbench II sample preparation system coupled with a ThermoElectron Delta-V PLUS IRMS. For δ2H analyses, the samples were purged with a 2% H2/He mixture and were left to equilibrate for 2 hours at room temperature; then, an H2 aliquot was extracted and analyzed. For δ18O analysis, the samples were equilibrated with a 0.3% CO2/He mixture and then left to equilibrate for 20 h, also at room temperature. An aliquot of the gas was then extracted and analyzed for its isotopic composition. The analysis of samples was bracketed by the analysis of VSMOW2 and VSLAP. Typical uncertainties are 0.1‰ and 2‰ for δ18O and δ2H, respectively. Finally, we note that all δ2H and δ18O values reported here are referenced against the Vienna Standard Mean Ocean Water (Coplen, 1996).
3.4 Air density
We calculated the cave-air density, ρ (kg/m3), based upon the temperature, relative humidity, pCO2 and atmospheric pressure data collected during each visit from all the monitoring sites following Sánchez-Cañete et al. (2013) which, considers the contribution of CO2 into the calculation of the virtual temperature (Kowalski and Sánchez-Cañete, 2010). All calculations were done assuming cave and external air behave as an ideal gas.
4 Results
4.1 Isotopic composition of rainfall
We collected seventy-two rainfall samples between June and November 2012. Rainfall in northern Guatemala shows a wide range of δ18O values, between + 0.7‰ and −13.4‰, and δ2H between + 22.5‰ and −97.1‰, with an δ18O amount-weighted annual average of −5.4‰ ± 3.2‰ and δ2H amount-weighted annual average of −31.5‰ ± 28.3‰. Our results yield a preliminary Local Meteoric Water line:
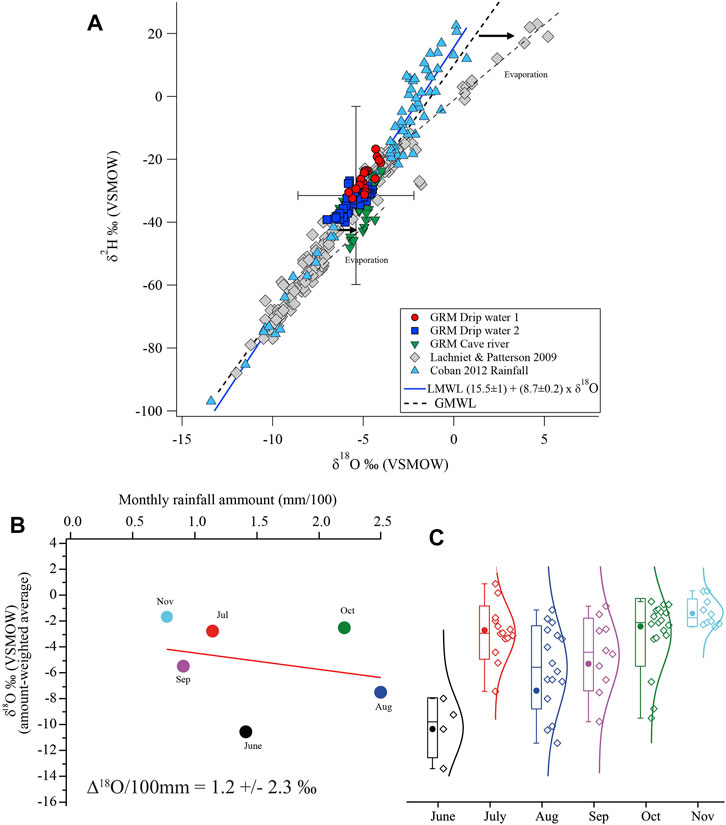
FIGURE 3. Isotopic composition of summer rainfall for 2012 from Cobán, Alta Verapaz, GT. (A) δ2H vs. δ18O for 2012 June–November rainwater collected at Finca Monte Azul near Cobán, Alta Verapaz, (cyan), dripwater from DS1 (red) DS2 (dark blue) and cave river water (green), compared to the composition of natural waters from Guatemala (Lachniet and Patterson, 2009). Error bars correspond to the amount-weighted δ18O and δ2H for the rainfall samples collected. Global Meteoric Water Line (continuous blue) and the Local Meteoric Water Line (dashed black) are also presented. (B) amount-weighted monthly average δ18O vs. monthly rainfall amount (mm/100), red-line corresponds to the linear regression, with the slope (Δ18O/100 m), (C) whisker plot (solid: amount-weighted δ18O average, line = average, box: +/− 1SD, whisker = Max and min) showing the progression of the 2012 rainfall δ18O composition from June to November. Colors in B and C correspond to different months. Reader is referred to electronic version of the manuscript.
The amount-weighted δ18O averages for the 2012 rainfall are poorly correlated with rainfall amount (Figure 3B), despite most of the rainfall samples corresponding to wet-season events from the peak of convective activity season over Central America. We note, however, that the rate of depletion (Δ18O/100 mm) for our samples (−1.2 +/− 2.3) ‰/100 mm is identical to that previously estimated for El Salvador and Veracruz, Mexico (Lachniet and Patterson, 2009) and northeast of the Yucatan Peninsula (Lases-Hernandez et al., 2019), albeit with larger uncertainty due to the limited sample size. Figure 3C shows that the lightest rainfall corresponds to that of June 2012, and between August and November 2012 there is a gradual increase in rainfall δ18O, as reflected in the progression from low to high amount weighted δ18O averages.
4.2 Cave environment
Figure 4 shows the %RH, Temperature, pCO2 and air-density variations measured throughout the monitoring period (July-2019—November 2021), either recorded by data-loggers or point measurements during each visit. Relative humidity at DS-1 and 2 (deepest monitored sites) remained essentially constant and above 99% throughout the monitoring period. Temperature at these sites showed very little variability, with an average temperature of 17.3 +/− 0.3°C (1SD) for the whole period, and only small seasonal variations can be detected. The average temperature inside the cave is within the lower range of the corresponding MAT (18.5 +/− 1.5°C) at the nearest weather station in Cobán Airport. We note that the temperature records from within the cave do not show a significant effect from the presence of cold fronts (January 2020), nor tropical storms affecting the area.
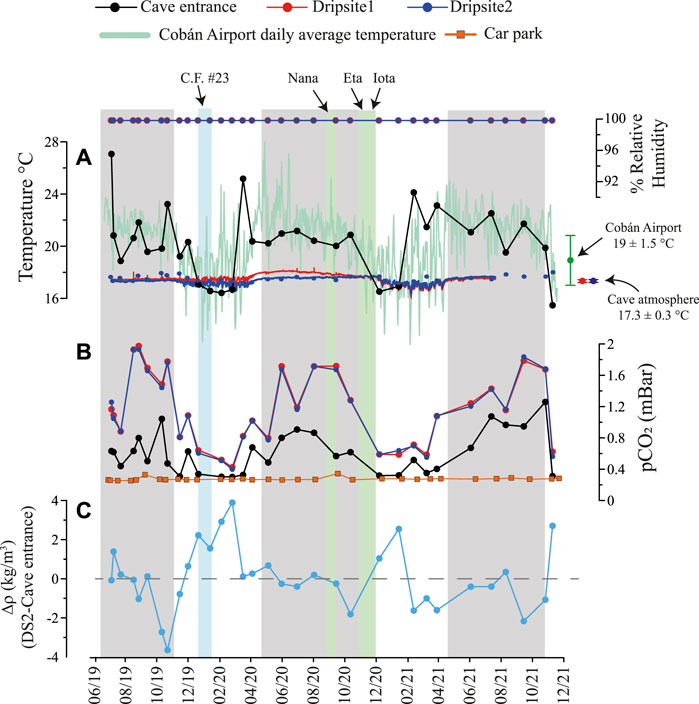
FIGURE 4. Summary of cave environment monitoring from sensors and point-measurements during each visit. Grey band represent the monsoon wet season, blue stripe: cold-front 23, green stripes: Hurricanes Nota, eta and Iota. (A) Relative humidity, (B) temperature at DS1, DS2, cave entrance and Cobán Airport daily average temperature. Data at the extreme-right represent average +/− 1 standard deviation. (C) CO2 partial pressure (pCO2—mBar) data measured at different points in the cave and the car park as a baseline. (D) Difference in air-cave density between DS2 (the deepest point of the cave monitored) and the cave entrance.
In contrast to temperature and relative humidity, pCO2 at both drip sites shows a large and seasonal variability that it is also visible at the cave entrance, albeit slightly muted. Both drip sites show consistently high pCO2 values during the peak of the wet season, and low values during the dry season. Similar seasonal variability at the cave entrance is also evident, however, the pCO2 at this location never reaches the levels observed at the monitoring sites. We also note that pCO2 from outside the cave, and ∼500 m from the entrance (Car park in Figure 4) remained constant (0.318 +/− 0.007 mBar) throughout the 2.5 years of monitoring, with no seasonal variability and in reasonable agreement with the current atmospheric CO2 levels (∼400 ppmv).
The mean air density values at the drip sites were ∼13% higher than at the entrance to the cave (1.5 ± 0.03 kg/m3 vs 1.3 ± 0.2 kg/m3, respectively); however, because of the larger variations in temperature the air density is significantly more variable at the entrance of the cave. Figure 4 shows that the difference in air density between DS2 and the cave entrance has a systematic seasonal periodicity, with positive Δρ values (i.e., lighter air outside the cave) during the second-half of the dry-season, most of the wet season. In contrast, air density in the cave decreases during early stages of the dry-season, when the temperature at the cave entrance drops below 17.3°C (cave annual average). As discussed below, such seasonal behavior is likely to play a significant role in cave ventilation.
4.3 Isotopic composition of stream and drip-water
We collected 19 drip water samples from DS-1, and 30 drip samples, respectively, from DS-2 and cave river water between July 2019 and November 2021. Slow drip-rates at DS-1 precluded collecting enough sample during some visits at the early stages of the monitoring period.
Drip water in GRM has little variability in their δ18O values: DS-1 δ18O oscillated between −4.0 and −5.1‰, whilst DS-2 between −4.5 and −6.1‰, in contrast to local rainwater. These compositions fall well upon the LMWL (Figure 3A) and are close to the amount-weighted δ18O average for the 2012 rainfall, in particular drip water from DS-2, whilst those from DS-1 are slightly heavier, but well within the uncertainty of the 2012 rainfall average (Figure 3A), confirming the meteoric origin of the drip water samples from Gruta del Rey Marcos. The isotopic composition of the cave river water ranges between −4.0 and −6.3‰ and, similarly to the drip water, fall well within the uncertainty of the amount-weighted δ18O average for the 2012 rainfall. However, the river water samples appear to cluster in two different groups: one that falls upon the LMWL, with isotopic composition nearly identical to that from the drip water, and a second group that is slightly displaced below the LMWL displaying incipient signs of evaporation. Figure 5C shows the temporal variability of δ18O in both DSs and the cave river water. The most evident characteristic of the cave-river water is its apparent sub-annual periodicity, with periods 4–5 months long with δ18O ∼ −6‰, which are abruptly followed by 5–8 months-long periods with δ18O ∼ −4.5‰. Such shifts are not coincident with the accepted wet and dry-season periods, yet they could be interpreted to respond to seasonal variations in rainfall composition, which is discussed more thoroughly below.
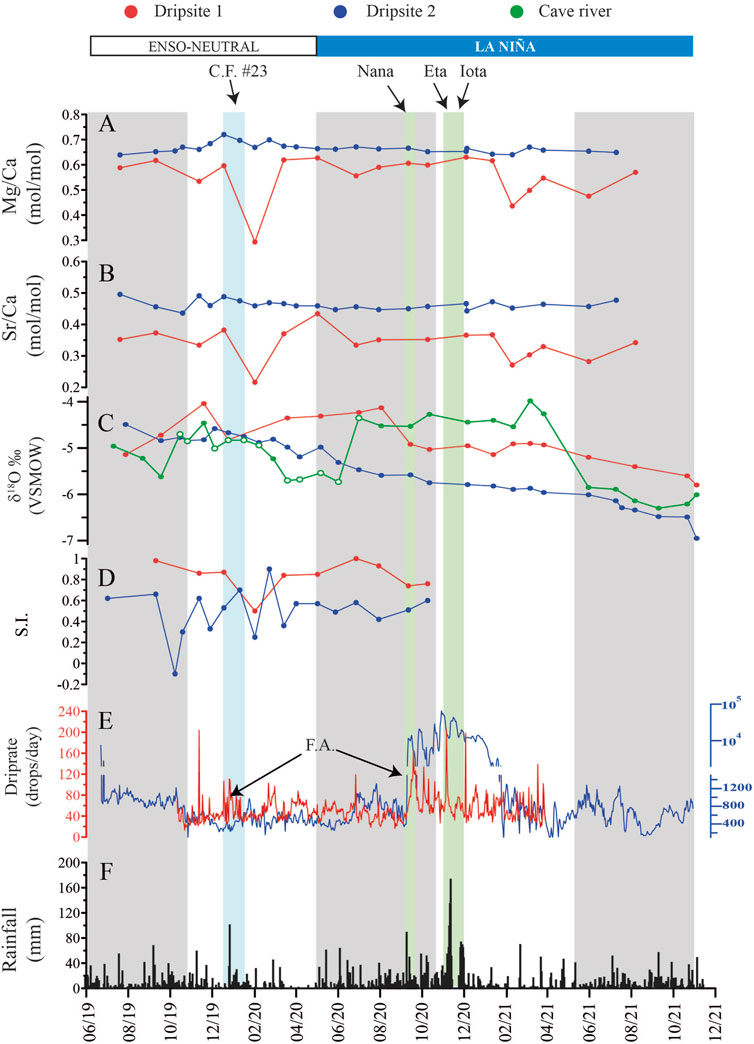
FIGURE 5. Time-series of (A) Mg/Ca, (mol/mol) (B) Sr/Ca (mmol/mol), (C) δ18O ‰ (VSMOW)¸ (D) calcite saturation indices (Parkhurst and Appelo, 1999), (E) driprate, and (F) recorded rainfall at Coban Airport during the monitoring period. Note that the driprate for DS2 (right side) is initially at linear scale, but due to the significant increase in drip-rate continues on log-scale. Gray, blue and green stripes are the same as in Figure 4.
In contrast to the caver river water, the isotopic composition from drip waters shows an evident lack of seasonal variability; both records appear to show little variability during the first 8–10 months of monitoring with δ18O values between −4 and −5‰, similar to the cave-river water. After February 2020, however, the isotopic composition of DS-2 gradually migrates towards lighter values for the subsequent 20 months, with δ18O values nearly identical to those from the cave-river water during the wet season of 2021. In contrast, the δ18O composition of drip water from DS-1 remains between −4 and −4.5‰ until an abrupt drop of ∼1‰ in early October 2020, coincident with the arrival of Hurricane Nana, which also resulted in an abrupt increase in drip rates in both sites (Figure 5E). The isotopic composition remains relatively constant at ∼ −5‰ for the next few months until it gradually decreases during the latter stages of monitoring.
4.4 Mg/Ca and Sr/Ca
Figures 5A, B show the variability of the Mg/Ca and Sr/Ca, respectively, for both drip sites; relatively high Mg/Ca and Sr/Ca are observed throughout the monitoring period, with those from DS-2 systematically higher than those from DS-1. Despite the monitoring period being punctuated by a cold front and 3 significant hurricanes, there is no evident effect upon the measured Mg/Ca and Sr/Ca ratios, despite the same events temporally associated with a notable increase in drip rates at both sites (Figure 5E).
DS-1 displays an apparent seasonal variability, with low Mg/Ca and Sr/Ca values during the dry season, and high values during the wet season, whereas the Mg/Ca and Sr/Ca in DS-2 remain essentially constant, with less than 3% variability throughout the monitoring period. In both drip sites there is a tight covariance between Mg/Ca and Sr/Ca, which is supported by a nearly constant aseasonal Mg/Sr in both drip sites 1.6 +/− 0.1 mol/mol and 1.4 +/− 0.07 mol/mol for DS-1 and DS-2, respectively. This suggests that the observed variability in Mg/Ca and Sr/Ca, particularly in DS1, is due to changes in the water/rock interaction, with prior-calcite-precipitation likely the main process modulating the variability. This is further discussed below.
Figure 5D shows that the drip-water at DS1 is consistently supersaturated against calcite, a condition that can only be achieved by CO2 degassing and calcite precipitation upstream the drip site. The saturation indices for DS2 also indicate that the drip water in this site is supersaturated in calcite, albeit the values are systematically lower than those from DS1, are more variable, and within the range in which small biases in any of the factors involved in the S.I. calculation (pH, Ca concentration, alkalinity), can result in large variations in S.I. (Parkhurst and Appelo, 1999). Consequently, the geochemical composition of dripwaters at DS2 are interpreted to be at equilibrium with calcite or, only slightly supersaturated.
Figure 6A shows a plot of ln (Mg/Ca) vs. ln (Sr/Ca) for the data from DS1 and DS2. The slope of these types of plots has been used as a diagnostic parameter of water/calcite interaction, in particular prior calcite precipitation, PCP, and/or incongruent calcite dissolution, ICD (Sinclair, 2011). If PCP/ICD is modulating the observed variability in drip-water, thermodynamical constrains limit the slope of ln (Mg/Ca) vs. ln (Sr/Ca) plot to 0.88 +/− 0.13, implying that observed variability in Mg/Ca and Sr can be interpreted to reflect hydrological changes in the epikarst associated with the amount of water in the unsaturated zone, permitting, or not, CO2 degasification and calcite precipitation within the epikarst, upstream from the drip site, and, consequently can be used as a proxy of the amount of water in the epikarst. The results in Figure 6A indicate that the observed variability in Mg/Ca in DS1 can be explained by changes in the water/rock interaction during the monitoring period (slope 0.89 +/− 0.07), and that such changes are likely due to PCP occurring in the epikarst. In contrast, the data from DS2 yields a slope (1.07 +/− 0.21) that it is higher than expected if the variability would be modulated largely by PCP. Wassenburg et al. (2020) have correctly argued that the boundary conditions stablished by Sinclair (2011) are too strict, and that PCP can yield datasets with slopes as high as 1.4. We note, however, that the observed correlation for the DS2 dataset corresponds to a statistical artifact, since removing the 3 points with the highest Mg/Ca and Sr/Ca results in a non-correlation. Consequently, whilst the elemental ratios in DS2 might reflect the water/rock interaction during the monitoring period, this was not likely affected by PCP/ICD.
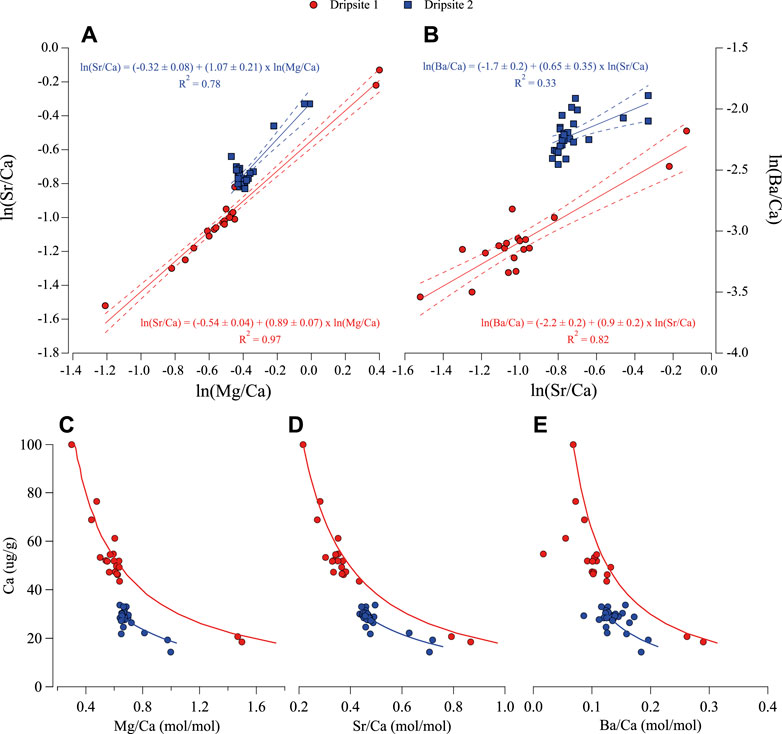
FIGURE 6. Tests for ICD/PCP using (A) Mg/Ca vs. Sr/Ca following Sinclair (2011) and (B) Sr/Ca vs. Ba/Ca following Bernal et al. (2016). Dashed lines correspond to the slope uncertainty. (C) mass-balance calculations testing for PCP modulation of Mg/Ca variability in drip water. (D), same as (C) but for Sr/Ca and (E) Ba/Ca.
Figure 6B shows the plot of ln (Sr/Ca) vs. ln (Ba/Ca) for both drip sites. It has been previously shown that, following the similar assumptions of Sinclair (2011), a data set whose variability is dominated by PCP should yield a slope of 1.02 +/− 0.08 in such space (Bernal et al., 2016). As above, DS1 falls within the limits of the expected slope (0.9 +/− 0.1), supporting the conclusion that the observed trace element variability in DS1 is modulated by water/rock interaction. However, samples from DS2 fail to form a meaningful correlation, supporting the previous observation that the drip water is not likely to be affected by PCP/ICD.
To further demonstrate that the drip water chemistry is controlled by PCP, we model the variation of Mg/Ca, Sr/Ca and Ba/Ca using a mass-balance approach (Tremaine and Froelich, 2013; Treble et al., 2015), in which the composition of the sample with the lowest Mg/Ca, Sr/Ca and Ba/Ca is assumed to be closest to the original solution not affected by PCP, and that further changes in E/Ca ratios are only due to calcite precipitation (Ca loss) under equilibrium conditions. Distribution coefficients for Mg/Ca, Sr/Ca and Ba/Ca between water and calcite were calculated following Day and Henderson (2013) at 18°C and are 0.014, 0.127, and 0.112, respectively. Figures 6C–E compares the measured E/Ca ratios with their expected compositions for DS1 and DS2 and supports the previous observation that the PCP is likely to be the main driver of Mg/Ca, Sr/Ca and Ba/Ca variability in drip water from DS1, whilst the very small variability at DS2 precludes an effective comparison with the modeled compositions.
5 Discussion
The data collected after 2.5 years of monitoring Gruta del Rey Marcos provide essential information for understanding the main processes modulating the cave environment and controlling the observed variability in δ18O and TE. In general, whilst the pCO2 and cave-air density respond more rapidly to the external environmental conditions, these are not clearly imprinted in the physicochemical properties of drip water, nor its isotopic composition, suggesting a complex hydrological array in the epikarst, leading to slow response from the epikarst to external forcing. In the following sections we discuss the general behavior of the cave and its potential implications for speleothem records from Gruta del Rey Marcos.
5.1 Cave environment
It is usually assumed that cave ventilation can drive calcite precipitation, since a large pCO2 gradient between the dripwater and the cave leads to calcite precipitation through degasification, whilst a smaller gradient will reduce the amount of precipitated carbonate (Fairchild and Baker, 2012), potentially biasing records towards the season where calcite preferentially grows (Banner et al., 2007; Baldini, 2010).
The dynamics of the cave atmosphere and ventilation in Gruta del Rey Marcos (GRM) are characterized by the seasonal variation of pCO2 inside the cave, with high pCO2 during the warm and wet season and low pCO2 during the cool and “dry” season (Figure 4B). These differ from those expected from the suggested model for cave ventilation by James et al. (2015) which predicts that for caves with an entrance at lower elevation than the chambers, such as GRM (Figure 2), CO2 accumulates when ρentrance > ρcave. Figure 4C shows that high pCO2 levels in GRM during the wet season occur when ρcave > ρentrance (Δρ >0), when monsoonal rains saturate the upper levels of the epikarst, reducing CO2 degasification though soil cracks and transporting it towards the cave, further enhancing limestone/dolostone dissolution. Moreover, since Δρ > 0 during this period, CO2 would seep through the cave entrance (Figure 4C). The end of the monsoonal period is accompanied by a decrease in outside temperature and heavier air at the cave entrance (i.e., ρcave < ρentrance), effectively reducing cave ventilation through the entrance. However, no increase in cave pCO2 is observed, as it would be expected, but rather are the lowest pCO2 values of the record, suggesting that CO2 supply into the cave is either reduced, or escapes through cracks in the epikarst and the soil, facilitated by its relative buoyancy. During the second half of the dry season (i.e., early spring) higher temperatures outside the cave enhance soil-CO2 production, thus supply into the cave. The increase in temperature also results in ρcave > ρentrance, thus, it would be expected for some of the CO2 to escape through the cave entrance, however we observe the increasing of pCO2 at both cave monitoring sites.
We note that whilst the observed ventilation regime at GRM differs from the proposed global model for cave ventilation (James et al., 2015), it is similar to many other caves where ventilation is promoted during cooler months, when air temperature outside the cave is lower than the temperature inside the cave (e.g., Frisia et al., 2011; Treble et al., 2015). Moreover, the presence of the cave river in GRM (Figure 2) might contribute to the observed ventilation regime two-fold: as seasonal changes in stream flow and water level affect the effective diameter of the cave entrance; a higher stream during the wet season, could reduce CO2 degassing through the entrance. In contrast, low cave-river levels during the dry-season, would enlarge the cave entrance effective diameter, promoting cave ventilation and CO2 degassing. The second effect from the cave-river would stem from the fact that higher cave-river levels during the wet season can reduce the effective chamber volume, increasing the atmospheric pressure.
The observed seasonal variability in pCO2 at GRM (Figure 4C), suggest that the cave atmosphere could play a significant role in modulating calcite precipitation, with more calcite precipitating when large pCO2 gradients between drip water and cave atmosphere are present, likely during the dry season, and moderated to reduced calcite precipitation during the wet season, when the pCO2 gradient between drip water and the cave atmosphere is likely to be lower. Such conditions have been shown to affect drip-water chemistry and even modulate calcite precipitation at the tip of stalactites, resulting in calcite precipitation at the stalactite tip, and yielding the diagnostics for PCP (Sherwin and Baldini, 2011; Wong et al., 2011; Treble et al., 2015)
5.2 Drip-rate, the aquifer, and its isotopic and elemental composition
The combined record of δ18O, trace elements, and drip-rate provide (Figure 5E) an insight into the hydrological framework above GRM, and the processes affecting both drip sites. Following Fairchild et al. (2006), we determined that both drips exhibited a matrix-dominated discharge regime based upon the drip-rate and its variance throughout the monitoring period, however, as previously observed DS1 corresponds to a seepage flow, while DS2 is seasonal drip. During the first part of the record (June 2019-August 2020) drip-rate at DS2 shows a clear seasonal signal, with 800–1,200 drips per day during the wet season, which abruptly decreases to 400–500 drips per day during the dry season; and such “low” drip-rates extend into the early wet season, suggesting some inertia in the aquifer. September-November 2020 was a significant period in terms of rainfall for Guatemala, as the transit of three hurricanes, Nana, Eta and Iota, delivered more than a 1,200 mm of rainfall to the area (Figure 5E). This resulted in a significant increase in drip rates at DS2 that lasted more than 6 months, presenting fracture activation that implied rates up to 50-times the observed drip-rate prior to the activation of fractures that gradually decayed onto “normal” dry-season drip rate until March 2021. Despite the important fracture activation at DS2 exhibited in its drip rate and seasonality of its discharge, the wettest period of September-November 2020 did not have an immediate effect on δ18O, Mg/Ca, Sr/Ca or Ba/Ca.
In contrast to DS1, the drip-rate at DS1 shows relatively more variability for the first part of the monitoring period without evident seasonality but with a clear influence from atmospheric events affecting Northern Central America; for example,: during January 2020, the arrival of cold-front 23 to Guatemala delivered ∼160 mm of rainfall in less than a week, this resulted in an abrupt increase in drip rate that lasted approximately two weeks, after which drip rate returned to “base line” level. The wettest period between September-November 2020 was recorded at DS1 as several peaks in drip rate, and a change in the base line from 45 to 60 drips per day; after this period, this shift in baseline drip rate conditions seems to replicate as reduction shift for Mg/Ca and Sr/Ca for the same post hurricanes period at DS1. Moreover, the abrupt increase in drip rate at DS1 in early October as a response to the arrival of hurricane Nana, also results in a ∼1‰ drop in the δ18O composition of the drip water at DS1 and remains nearly constant for the next several months. In contrast, the isotopic composition of drip water at DS2 remains nearly unchanged throughout October 2020, despite the significant increase in drip rate.
The isotopic composition of the 2012 rainfall (Figure 3) and cave river (Figure 5C) provide important information to further understand the observed variability at the drip sites in GRM. Figure 3 provides preliminary evidence indicating that, in contrast to southern Mexico and El Salvador, the δ18O composition of summer rainfall in eastern Guatemala might not be solely modulated by the amount effect, and that the relatively high δ18O values observed during October and November 2012 might be the result of polar incursions (“nortes”) that reached northern Central America (Supplementary Figure S1), bringing moisture from the Gulf of Mexico, and suggesting that the source of the moisture reaching the area might also play a significant role in controlling the isotopic composition of the local rainfall, as observed in other locations (e.g., Cruz et al., 2005). Whilst this preliminary result should be confirmed with more extensive rainfall sampling and detailed calculation of air masses back-trajectories (Stein et al., 2015), when combined with the observed variability of the δ18O composition of the cave-river water, allow us to obtain a more complete picture of the isotopic composition of the water feeding the epikarst above GRM.
The isotopic composition of stream water exhibited a δ18O variability of ∼2.3‰ during the monitoring period, similar to that observed for DS1 and DS2 (∼1.8‰ and ∼2.5‰, respectively); suggesting that the isotopic composition of the stream water could be a good indicator of the seasonal isotopic composition of rainwater, as they usually average the atmospheric processes modulating the isotopic composition of rainfall (Lachniet and Patterson, 2009; Reckerth et al., 2017). Under this light, it seems reasonable to assume that the δ18O values from the non-evaporated cave river samples (Figure 5C) are a good indicator of the variability on the isotopic composition of the water entering the epikarst feeding DS1 and DS2. In general, the cave-river water during the monitoring period clusters around two groups with different oxygen-isotope compositions: one with δ18O ranging between −4.5 and −5‰, and a second group with δ18O values ∼ −6‰. Despite both groups not being temporally coincident with the wet and dry seasons, based on the 2012 rainfall data, it is reasonable to assume that the cave-water with δ18O ∼ −4.5‰ might be reflective of winter frontal rainfall, with significant contribution of moisture sourced in the Gulf of Mexico, whilst the lighter water (i.e., δ18O ∼ −6‰) reflect convective rainfall sourced mostly from the Caribbean and western tropical Atlantic. Consequently, the observed variability in cave-river water can be interpreted to reflect changes in the source of the moisture arriving to northern Central America and entering the epikarst in Gruta del Rey Marcos.
As previously noted, the drip water in both sites shows a similar δ18O range to the stream water, but without a clear seasonal variability. The isotopic composition of dripwater at DS2 shows a very slow migration from “dry” season values (−4.5—−5‰) during the early stages of monitoring, to “wet” season values (−6‰) at the final stages of the monitoring period. The slow response of DS2 to external forcing, even after fracture activation, suggests a large stratified aquifer feeding such drip, integrating at least one hydrological year and resulting in significant isotopic inertia (i.e., Lases-Hernández et al., 2020). Moreover, since the monitoring period started at the end of a 7-year long drought characterized by a summer rainfall deficit of ∼35% in central and northern Guatemala (Depsky and Pons, 2020), it appears that the δ18O values (∼-4 to −5‰) observed during the 2019 wet season might be characteristic of such dry period.
The δ18O composition of drip water at DS1 shares some of the features of DS2, such as the lack of a clear seasonal signal, and significant inertia, but in contrast to the DS2, the two fracture activation events affecting DS1 during C.F. 23 and the transit of tropical cyclones over the area (Figure 5E), do have an effect upon the δ18O composition of the DS1 drip water, as in both cases a contemporaneous drop of ∼1‰ was registered. Distinctively negative isotopic compositions form tropical cyclone rainfall compared to other rainfall events of similar magnitude for the same region have been widely documented (Gedzelman et al., 2003; Vieten et al., 2018; Lases-Hernández et al., 2020). A recent study by Lases-Hernández et al. (2020) examined the influence of several tropical cyclone events over the drip water composition of epikarst reservoirs with different rainfall time integration at Rio Secreto cave (Yucatán, Mexico) and concluded that, in order for a drip site to record the isotopic signal of a tropical cyclone, the tropical cyclone must contribute with a significant amount of rainfall relative to normal rainfall events preceding the tropical cyclone and have a significantly different isotopic composition to that of the baseline reservoir.
Here we observed that whilst the drop in δ18O in January 2020 was only transient, the observed change in δ18O in September 2020 after the arrival of hurricane Nana, and later the arrival of Eta and Iota, remains for more than 12 months after the fracture activation, and even after drip rates have reached the pre-October 2020 levels. These observations suggests that the significant amount of rainfall and their very characteristic isotopic composition was enough to influence significantly the isotopic composition of the epikarst reservoir, allowing the signal from hurricanes Nana, Eta and Iota to remain in drip water for several months. Moreover, after the wettest period of September-November 2020, drip water at both drip sites and stream water exhibited very similar d-excess variability and values (Supplementary Material S1), revealing that despite the inertia, a baseline isotopic composition values due to the different size reservoirs, the important income of rainfall and its characteristic isotopic composition resulted in a same kind of post tropical cyclones waters mixing in the monitored sites.
Because of the aquifer inertia, the isotopic signal of tropical storms affecting GRM is stored in the epikarst and delivered to the cave throughout several months, increasing the likelihood of being recorded by the stalagmite calcite, a feature recently discussed in Lases-Hernández et al. (2020), where it was demonstrated that drip-sites that responded rapidly to the effect from tropical storms, with a short-lived isotopic shifts in δ18O that are less likely to yield calcite recording such excursions, whilst drip-sites where the signal from tropical storms is maintained for several months, are more likely to yield calcite that records such shifts, as the latter usually integrated the isotopic composition of the drip-water for several months.
2020 years was the most active cyclone season recorded in instrumental history in the Atlantic, and as mentioned, it represented an anomalous wet period for our study site, this allowed us to detect a d8O shift in drip waters and stream water of GRM, despite that these cave drip sites, and stream water are likely to integrate several months of rainfall δ18O variability. This is a remarkable finding, since in other tropical regions, the isotopic composition of some cyclones has been found to be distinctively negative with respect to other rains; however, such isotopic signal could not be detected in the coeval cave drip waters, either because the cyclones did not left a significant amount of meteoric precipitation, or because the characteristics of the karst pipe do not reflect the variability of rainfall on such a time scale (Partin et al., 2012; Vieten et al., 2018; Yang et al., 2021). Despite several studies indicating that tropical cyclones detection is possible in stalagmites from tropical regions (Frappier et al., 2007; Frappier, 2013; Baldini et al., 2016), cave monitoring studies that demonstrate with empirical data how the isotopic signal is transferred from rain to calcite or aragonite remain scarce.
Stalagmites that grow under drips that can be affected by fracture activation are prone to capture only a partial picture of the environmental conditions outside the cave, and thus likely biased to record wet events (Treble et al., 2022). This, however, is not likely to affect stalagmites growing under and nearby DS1 or DS2, because drip rate is largely matrix-dominated, and the influence of facture activation upon drip rate is only transient. The effect of aquifer inertia in the δ18O composition of drip water from both sites, strongly suggests that their isotopic composition integrate several months—to years, of local rainfall, and despite this, the system is able to effectively record periods of extreme rainfall in the drip waters and likely in the stalagmites from this cave.
While δ18O in drip water provides a history of the regional atmospheric processes affecting Guatemala, which is subsequentially imprinted in the stalagmite calcite, the trace-element composition of drip water, also fixed in the stalagmite, provides information of the environmental processes occurring in the epikarst. The results in Figures 5A, B, D and 6 indicate that dripwater chemistry is mostly controlled by PCP, particularly that of DS1, where saturation indices systematically indicate that dripwater is supersaturated in calcite (Figure 5D), and Mg/Ca Sr/Ca and Ba/Ca vary along the expected trends from PCP mass-balance modelling (Figure 6). The temporal evolution of the E/Ca ratios during the monitoring period is, however, not coincident with the usual expectation that high E/Ca ratios coincide with the dry season, whilst low E/Ca ratios with the wet season. In contrast, low E/Ca ratios are observed in DS1 during the midst of the “dry season”, and high ratios during the wet season. This is consistent, however, with the previous observation where a 6–8-month groundwater residence time was estimated from the temporal variability of δ18O. Under this light the low E/Ca ratios observed in DS-1 represent the peak of the previous wet season, and its short duration (∼1 month) a reflection of the short and subdued wet season resulting from the 7-year long drought affecting the area between 2012 and 2019. Further support for such residence time stems from the unusually wet period of October 2020, which resulted in an immediate ∼1‰ drop in δ18O, but the decrease in trace Mg/Ca and Sr/Ca is only detected after the 6-month delay. Moreover, similarly as δ18O, the E/Ca ratios remain persistently low for the rest of the monitoring period, even after the drip-rates have returned to their corresponding base-line levels.
In contrast to DS1, the elemental composition of DS2 shows very little variability with average Mg/Ca of 0.67 +/− 0.03 (mol/mol) and Sr/Ca of 0.47 +/− 0.04 (mmol/mol), respectively, for most of the monitoring period. The lack of variability hints to a constant water/rock interaction throughout the monitoring period, independent from the environmental variables that usually modulate groundwater chemistry in karstic environments, and since the calcite saturation indices indicate that the dripwater is near or at equilibrium with calcite, it is reasonable to assume that no significant CO2 degassing has occurred upstream from DS2. Moreover, the very high Mg/Ca ratios systematically observed at DS2, resulting from weathering of the dolomitic bedrock, are likely to hamper the precipitation of calcite from groundwater with such composition (De Choudens-Sánchez and González, 2009), either in the epikarst or in the cave.
Precipitation of secondary calcite in the cave is mostly observed downstream from DS2 (Figure 2), and geochemical signs of PCP are present in the drip water of DS1. This suggests an important change in the physicochemical conditions of dripwater that allow for the groundwater to lose CO2 and be oversaturated against calcite. We hypothesize that the latter is likely due to the presence of conduits reaching the surface that allow the entry of calcite-saturated surficial water into the epikarst, which mixes with high Mg/Ca groundwater, resulting in groundwater with lower Mg/Ca and Sr/Ca downstream the mixing area, as observed in DS1. Moreover, such conduits and fractures also allow for CO2 degassing, thus leading to supersaturation and precipitation of calcite in the epikarst. This allows for the dripwater in DS1 to capture the atmospheric variability signal through the δ18O composition of dripwater, and the hydrological response through the trace-element composition, albeit the signals are not simultaneous, the observed lag in the hydrological response is not significant in terms of speleothem growth.
5.3 Implications for paleohydrological reconstruction using δ18O and trace elements in stalagmites
The environmental conditions inside the cave are conducive for the formation of secondary calcite in isotopic equilibrium, as no significant changes in temperature and relative humidity are observed. Whilst it has been previously observed in other locations that cave-ventilation can drive calcite precipitation, it does not appear to be the case for GRM, as no correlation between cave pCO2 and calcite saturation indices, nor with Mg/Ca, Sr/Ca and Ba/Ca ratios was observed during the monitoring period.
It is evident that the δ18O in dripwater from GRM reflects the atmospheric dynamics affecting northern central America and southern Mexico. However, two previously undetected features need to be considered for robust speleothem δ18O interpretations: First, based on the observed variability of δ18O, it is highly likely that these do not reflect the local amount of rainfall reaching the area (Figure 3B), as expected for tropical areas, but instead, two distinct rainfall regimes affect the area routinely throughout the year, as indicated by the annual rainfall distribution in Figure 1C (convective precipitation during wet season vs. frontal precipitation during the dry season) with periods where both regimes are present, particularly at the end of the monsoon (September–November). Because of aquifer inertia, both regimes are not clearly imprinted in the isotopic composition of dripwater but are more evident in that of the stream water, that has a significantly shorter residence time in the epikarst. We suggest that the isotopic composition of drip-water is not dominated solely by one precipitation regime, but rather reflect a balance between summer and winter rainfall. Consequently, low δ18O are reflective of mostly convective rainfall reaching the area, whilst high δ18O values are likely to reflect a more significant contribution of winter precipitation to the accumulated annual rainfall and suggesting that more negative speleothem δ18O values from GRM and nearby caves should be interpreted as proxies of stronger monsoons, and less negative speleothem δ18O are indicative of decreased monsoon. Our results also indicate that the variability of Mg/Ca, Sr/Ca and Ba/Ca are modulated by PCP, as a result from the external hydrological conditions. This implies that, on longer timescales, high Mg/Ca ratios in stalagmites form GRM can be interpreted to reflect a dry epikarst, likely the result from a depressed monsoon, whilst low Mg/Ca ratios are indicative of a wet epikarst, with very little space for PCP, likely resulting from enhanced monsoonal activity. Therefore, a multiproxy record from GRM based on the variability of δ18O and Mg/Ca, Sr/Ca and Ba/Ca, can provide a unique reconstruction of the atmospheric variability over northern Central America and Southern Mexico, as well as their paleohydrological dynamics.
Data availability statement
The raw data supporting the conclusion of this article will be made available by the authors, without undue reservation.
Author contributions
All authors contributed to this project. Fieldwork was carried out by FR, MC-X, JPB, PP, ML, RL-M, and OS. Analytical infrastructure provided by JPB, SC-V, ML, and FL-H. Analysis of samples was carried out by FR, MC-X, PP, KL-A, and GL. Data interpretation and discussion was carried out by JPB, FL-H, PP, PB, and ML. The manuscript was mostly written by JPB, FL-H, and PP.
Acknowledgments
This work was carried out during a very complex period for everybody, and thus, required extraordinary assistance from different parties. The authors would like to thank Diego Fernández at Gruta del Rey Marcos for allowing continuous access to the cave even during the most challenging period of the COVID-19 pandemic. Otto Inque Chavarria Robles and Otto Inque Chavarria Sr are thanked for providing access to Monte Azul Farm and welcome us at their home during several trips, and dutifully collecting rain samples during the early stages of this project. Sergio Morán at USAC-CUNOR for logistical support throughout the project. Nancy Pistole, provided original indications for the cave as well as the original map, which was plotted by her and Matt Oliphant, Salvador Brizuela, Peter Haberland, Matt Krammar, Oscar Rivera, Mike Shawcross, and upon which Figure 2 is based. M en C. Ofelia Pérez-Arvizu, M. en C. Liliana Corona, M. en C Carolina Muñoz-Torres, and Q. Jessica Olivares Amador are thanked for essential laboratory support. This work was supported through a UNAM-PAPIIT grant IN108419 to JPB, IA202222 to FLH, and NSF grant AGS-1804263 to MSL. The authors would like to acknowledge the comments and suggestions by two reviewers, whose comments significantly enhanced the clarity of the manuscript. This work is published in Memoriam of Santiago Capella Vizcaíno (1948–2022), who set up some of the analytical instrumentation and provided guidance for several years to some of the authors of this manuscript.
Conflict of interest
The authors declare that the research was conducted in the absence of any commercial or financial relationships that could be construed as a potential conflict of interest.
Publisher’s note
All claims expressed in this article are solely those of the authors and do not necessarily represent those of their affiliated organizations, or those of the publisher, the editors and the reviewers. Any product that may be evaluated in this article, or claim that may be made by its manufacturer, is not guaranteed or endorsed by the publisher.
Supplementary material
The Supplementary Material for this article can be found online at: https://www.frontiersin.org/articles/10.3389/feart.2023.1112957/full#supplementary-material
References
Adams, D. K., and Comrie, A. C. (1997). The North American monsoon. Bull. Am. Meteorological Soc. 78, 2197–2213. doi:10.1175/1520-0477(1997)078<2197:tnam>2.0.co;2
Appelo, C. A. J., and Postma, D. (2004). Geochemistry, groundwater and pollution. London: CRC Press.
Baldini, J. U. L. (2010). Cave atmosphere controls on stalagmite growth rate and palaeoclimate records. Geol. Soc. Lond. Spec. Publ. 336, 283–294. doi:10.1144/sp336.15
Baldini, L. M., Baldini, J. U. L., Mcelwaine, J. N., Frappier, A. B., Asmerom, Y., Liu, K.-B., et al. (2016). Persistent northward North Atlantic tropical cyclone track migration over the past five centuries. Sci. Rep. 6, 37522. doi:10.1038/srep37522
Banner, J. L., Guilfoyle, A., James, E. W., Stern, L. A., and Musgrove, M. (2007). Seasonal Variations in Modern Speleothem Calcite Growth in Central Texas, U.S.A. J. Sediment. Res. 77, 615–622. doi:10.2110/jsr.2007.065
Barlow, M., Nigam, S., and Berbery, E. H. (1998). Evolution of the North American Monsoon System. J. Clim. 11, 2238–2257. doi:10.1175/1520-0442(1998)011<2238:eotnam>2.0.co;2
Beddows, P. A., and Mallon, E. K. (2018). Cave Pearl Data Logger: A Flexible Arduino-Based Logging Platform for Long-Term Monitoring in Harsh Environments. Sensors 18, 530. doi:10.3390/s18020530
Bernal, J. P., Lachniet, M., Mcculloch, M., Mortimer, G., Morales, P., and Cienfuegos, E. (2011). A speleothem record of Holocene climate variability from southwestern Mexico. Quat. Res. 75, 104–113. doi:10.1016/j.yqres.2010.09.002
Bernal, J. P., Cruz, F. W., Strkis, N. M., Wang, X., Deininger, M., Catunda, M. C. A., et al. (2016). High-resolution Holocene South American monsoon history recorded by a speleothem from Botuverá Cave, Brazil. Earth Planet. Sci. Lett. 450, 186–196. doi:10.1016/j.epsl.2016.06.008
Borsato, A., Frisia, S., Fairchild, I. J., Somogyi, A., and Susini, J. (2007). Trace element distribution in annual stalagmite laminae mapped by micrometer-resolution X-ray fluorescence: Implications for incorporation of environmentally significant species. Geochimica Cosmochimica Acta 71, 1494–1512. doi:10.1016/j.gca.2006.12.016
Clark, I. D., and Fritz, P. (1997). Environmental isotopes in hydrogeology. Boca Raton, FL: CRC Press.
Coplen, T. B. (1996). New guidelines for reporting stable hydrogen, carbon, and oxygen isotope-ratio data. Geochimica Cosmochimica Acta 60, 3359–3360. doi:10.1016/0016-7037(96)00263-3
Cruz, F. W., Karmann, I., Viana, J., OduvaldoBurns, S. J., Ferrari, J. A., Vuille, M., et al. (2005). Stable isotope study of cave percolation waters in subtropical Brazil: Implications for paleoclimate inferences from speleothems. Chem. Geol. 220, 245–262. doi:10.1016/j.chemgeo.2005.04.001
Curtis, S. (2002). Interannual variability of the bimodal distribution of summertime rainfall over Central America and tropical storm activity in the far-eastern Pacific. Clim. Res. 22, 141–146. doi:10.3354/cr022141
Day, C. C., and Henderson, G. M. (2013). Controls on trace-element partitioning in cave-analogue calcite. Geochimica Cosmochimica Acta 120, 612–627. doi:10.1016/j.gca.2013.05.044
De Choudens-Sánchez, V., and González, L. A. (2009). Calcite and aragonite precipitation under controlled instantaneous supersaturation: Elucidating the role of CaCO3 saturation state and Mg/Ca ration on calcium carbonate polymorphism. J. Sediment. Res. 79, 363–376. doi:10.2110/jsr.2009.043
De Villiers, S., Greaves, M., and Elderfield, H. (2002). An intensity ratio calibration method for the accurate determination of Mg/Ca and Sr/Ca of marine carbonates by ICP-AES. Geochem. Geophys. Geosystems 3. doi:10.1029/2001gc000169
Depsky, N., and Pons, D. (2020). Meteorological droughts are projected to worsen in Central America’s dry corridor throughout the 21st century. Environ. Res. Lett. 16, 014001. doi:10.1088/1748-9326/abc5e2
Durán-Quesada, A. M., Sorí, R., Ordoñez, P., and Gimeno, L. (2020). Climate Perspectives in the Intra–Americas Seas. Atmosphere 11, 959. doi:10.3390/atmos11090959
Fairchild, I. J., and Baker, A. (2012). Speleothem science. From process to past environments. United Kingdom: Wiley- Blackwell.
Fairchild, I. J., Smith, C. L., Baker, A., Fuller, L., Spotl, C., Mattey, D., et al. (2006). Modification and preservation of environmental signals in speleothems. Earth-Science Rev. 75, 105–153. doi:10.1016/j.earscirev.2005.08.003
Fairchild, I. J., and Treble, P. C. (2009). Trace elements in speleothems as recorders of environmental change. Quat. Sci. Rev. 28, 449–468. doi:10.1016/j.quascirev.2008.11.007
Frappier, A. B. (2013). Masking of interannual climate proxy signals by residual tropical cyclone rainwater: Evidence and challenges for low-latitude speleothem paleoclimatology. Geochem. Geophys. Geosystems 14, 3632–3647. doi:10.1002/ggge.20218
Frappier, A. B., Sahagian, D., Carpenter, S. J., González, L. A., and Frappier, B. R. (2007). Stalagmite stable isotope record of recent tropical cyclone events. Geology 35, 111–114. doi:10.1130/g23145a.1
Frisia, S., Fairchild, I. J., Fohlmeister, J., Miorandi, R., Spötl, C., and Borsato, A. (2011). Carbon mass-balance modelling and carbon isotope exchange processes in dynamic caves. Geochimica Cosmochimica Acta 75, 380–400. doi:10.1016/j.gca.2010.10.021
Fuentes-Franco, R., Coppola, E., Giorgi, F., Pavia, E. G., Diro, G. T., and Graef, F. (2015). Inter-annual variability of precipitation over Southern Mexico and Central America and its relationship to sea surface temperature from a set of future projections from CMIP5 GCMs and RegCM4 CORDEX simulations. Clim. Dyn. 45, 425–440. doi:10.1007/s00382-014-2258-6
Garreaud, R. D. (2001). Subtropical cold surges: regional aspects and global distribution. Int. J. Climatol. 21, 1181–1197. doi:10.1002/joc.687
Gedzelman, S., Lawrence, J., Gamache, J., Black, M., Hindman, E., Black, R., et al. (2003). Probing Hurricanes with Stable Isotopes of Rain and Water Vapor. Mon. Weather Rev. 131, 1112–1127. doi:10.1175/1520-0493(2003)131<1112:phwsio>2.0.co;2
Giannini, A., Kushnir, Y., and Cane, M. A. (2000). Interannual Variability of Caribbean Rainfall, ENSO, and the Atlantic Ocean. J. Clim. 13, 297–311. doi:10.1175/1520-0442(2000)013<0297:ivocre>2.0.co;2
Giannini, A., Chiang, J. C. H., Cane, M. A., Kushnir, Y., and Seager, R. (2001). The ENSO Teleconnection to the Tropical Atlantic Ocean: Contributions of the Remote and Local SSTs to Rainfall Variability in the Tropical Americas. J. Clim. 14, 4530–4544. doi:10.1175/1520-0442(2001)014<4530:tetttt>2.0.co;2
Giorgi, F. (2006). Climate change hot-spots. Geophys. Res. Lett. 33, L08707. doi:10.1029/2006gl025734
Hartland, A., Fairchild, I. J., Lead, J. R., Borsato, A., Baker, A., Frisia, S., et al. (2012). From soil to cave: Transport of trace metals by natural organic matter in karst dripwaters. Chem. Geol. 304–305, 68–82. doi:10.1016/j.chemgeo.2012.01.032
Hodell, D. A., Anselmetti, F. S., Ariztegui, D., Brenner, M., Curtis, J. H., Gilli, A., et al. (2008). An 85-ka record of climate change in lowland Central America. Quat. Sci. Rev. 27, 1152–1165. doi:10.1016/j.quascirev.2008.02.008
Huang, H. M., Fairchild, I. J., Borsato, A., Frisia, S., Cassidy, N. J., Mcdermott, F., et al. (2001). Seasonal variations in Sr, Mg and P in modern speleothems (Grotta di Ernesto, Italy). Chem. Geol. 175, 429–448. doi:10.1016/s0009-2541(00)00337-5
Instittuto de Sismología, Vulcanología, Meteología e Hidología (INSIVUMEH) (2021). Available at: https://insivumeh.gob.gt/.
IPCC (2014). “Climate change 2014: Impacts, adaptation, and vulnerability. Part B: Regional aspects,” in Contribution of Working Group II to the Fifth Assessment Report of the Intergovernmental Panel on Climate Change. Editors V. R. Barros, C. B. Field, D. J. Dokken, M. D. Mastrandrea, K. J. Mach, T. E. Biliret al. (Cambridge, United Kingdom: Cambridge University Press), 688.
James, E. W., Banner, J. L., and Hardt, B. (2015). A global model for cave ventilation and seasonal bias in speleothem paleoclimate records. Geochem. Geophys. Geosystems 16, 1044–1051. doi:10.1002/2014gc005658
Knaff, J. A. (1997). Implications of Summertime Sea Level Pressure Anomalies in the Tropical Atlantic Region. J. Clim. 10, 789–804. doi:10.1175/1520-0442(1997)010<0789:iosslp>2.0.co;2
Kowalski, A. S., and Sánchez-Cañete, E. P. (2010). A New Definition of the Virtual Temperature, Valid for the Atmosphere and the CO2-Rich Air of the Vadose Zone. J. Appl. Meteorology Climatol. 49, 1692–1695. doi:10.1175/2010jamc2534.1
Lachniet, M. S., Asmerom, Y., Bernal, J. P., Polyak, V. J., and Vazquez-Selem, L. (2013). Orbital pacing and ocean circulation-induced collapses of the Mesoamerican monsoon over the past 22,000 y. Proc. Natl. Acad. Sci. 110, 9255–9260. doi:10.1073/pnas.1222804110
Lachniet, M. S. (2009). Climatic and environmental controls on speleothem oxygen-isotope values. Quat. Sci. Rev. 28, 412–432. doi:10.1016/j.quascirev.2008.10.021
Lachniet, M. S., and Patterson, W. P. (2009). Oxygen isotope values of precipitation and surface waters in northern Central America (Belize and Guatemala) are dominated by temperature and amount effects. Earth Planet. Sci. Lett. 284, 435–446. doi:10.1016/j.epsl.2009.05.010
Lases-Hernandez, F., Medina-Elizalde, M., Burns, S., and Decesare, M. (2019). Long-term monitoring of drip water and groundwater stable isotopic variability in the Yucatán Peninsula: Implications for recharge and speleothem rainfall reconstruction. Geochimica Cosmochimica Acta 246, 41–59. doi:10.1016/j.gca.2018.11.028
Lases-Hernández, F., Medina-Elizalde, M., and Benoit Frappier, A. (2020). Drip water δ18O variability in the northeastern Yucatán Peninsula, Mexico: Implications for tropical cyclone detection and rainfall reconstruction from speleothems. Geochimica Cosmochimica Acta 285, 237–256. doi:10.1016/j.gca.2020.07.008
Magaña, V., Amador, J. A., and Medina, S. (1999). The midsummer drought over Mexico and Central America. J. Clim. 12, 1577–1588. doi:10.1175/1520-0442(1999)012<1577:tmdoma>2.0.co;2
Magaña, V., Vázquez, J. L., Pérez, J. L., and Pérez, J. (2003). Impact of El Niño on precipitation in Mexico. Geofísica Int. 42, 313–330.
NOAA (2002). Multivariate ENSO Index version 2 (MEI. v2). Available at: https://psl.noaa.gov/enso/mei/.
Nowlin, W. D., and Parker, C. A. (1974). Effects of a Cold-Air Outbreak on Shelf Waters of the Gulf of Mexico. J. Phys. Oceanogr. 4, 467–486. doi:10.1175/1520-0485(1974)004<0467:eoacao>2.0.co;2
Parkhurst, D. L., and Appelo, C. a. J. (1999). “User's guide to PHREEQC (version 2)-A computer program for speciation, batch-reaction, one-dimensional transport, and inverse geochemical calculations,” in U.S. Geological survey water-resources investigations report (Denver, CO: U.S. Geological Survey).
Partin, J. W., Jenson, J. W., Banner, J. L., Quinn, T. M., Taylor, F. W., Sinclair, D., et al. (2012). Relationship between modern rainfall variability, cave dripwater, and stalagmite geochemistry in Guam, USA. Geochem. Geophys. Geosystems 13. doi:10.1029/2011gc003930
Reckerth, A., Stichler, W., Schmidt, A., and Stumpp, C. (2017). Long-term data set analysis of stable isotopic composition in German rivers. J. Hydrology 552, 718–731. doi:10.1016/j.jhydrol.2017.07.022
Sánchez-Cañete, E. P., Serrano-Ortiz, P., Domingo, F., and Kowalski, A. S. (2013). Cave ventilation is influenced by variations in the CO2-dependent virtual temperature. Int. J. Speleology 42, 1–8. doi:10.5038/1827-806x.42.1.1
Sherwin, C. M., and Baldini, J. U. L. (2011). Cave air and hydrological controls on prior calcite precipitation and stalagmite growth rates: Implications for palaeoclimate reconstructions using speleothems. Geochimica Cosmochimica Acta 75, 3915–3929. doi:10.1016/j.gca.2011.04.020
Sinclair, D. J. (2011). Two mathematical models of Mg and Sr partitioning into solution during incongruent calcite dissolution: Implications for dripwater and speleothem studies. Chem. Geol. 283, 119–133. doi:10.1016/j.chemgeo.2010.05.022
Stein, A. F., Draxler, R. R., Rolph, G. D., Stunder, B. J. B., Cohen, M. D., and Ngan, F. (2015). NOAA’s HYSPLIT Atmospheric Transport and Dispersion Modeling System. Bull. Am. Meteorological Soc. 96, 2059–2077. doi:10.1175/bams-d-14-00110.1
Treble, P. C., Fairchild, I. J., Griffiths, A., Baker, A., Meredith, K. T., Wood, A., et al. (2015). Impacts of cave air ventilation and in-cave prior calcite precipitation on Golgotha Cave dripwater chemistry, southwest Australia. Quat. Sci. Rev. 127, 61–72. doi:10.1016/j.quascirev.2015.06.001
Treble, P. C., Baker, A., Abram, N. J., Hellstrom, J. C., Crawford, J., Gagan, M. K., et al. (2022). Ubiquitous karst hydrological control on speleothem oxygen isotope variasbility in a global study. Commun. Earth Environ. 3, 29. doi:10.1038/s43247-022-00347-3
Tremaine, D. M., and Froelich, P. N. (2013). Speleothem trace element signatures: A hydrologic geochemical study of modern cave dripwaters and farmed calcite. Geochimica Cosmochimica Acta 121, 522–545. doi:10.1016/j.gca.2013.07.026
Valdés Paredes, S. A. (2017). Análisis estratigráfico de los niveles de brechas calcareas de la Formación Cobán dentro del cuadrángulo Cobán. Coban, Guatemala: Tesis de Licenciatura, Universidad San Carlos de Guatemala.
Vieten, R., Warken, S., Winter, A., Schröder-Ritzrau, A., Scholz, D., and Spötl, C. (2018). Hurricane Impact on Seepage Water in Larga Cave, Puerto Rico. J. Geophys. Res. Biogeosciences 123, 879–888. doi:10.1002/2017jg004218
Wassenburg, J. A., Riechelmann, S., Schröder-Ritzrau, A., Riechelmann, D. F. C., Richter, D. K., Immenhauser, A., et al. (2020). Calcite Mg and Sr partition coefficients in cave environments: Implications for interpreting prior calcite precipitation in speleothems. Geochimica Cosmochimica Acta 269, 581–596. doi:10.1016/j.gca.2019.11.011
Winter, A., Zanchettin, D., Lachniet, M., Vieten, R., Pausata, F. S. R., Ljungqvist, F. C., et al. (2020). Initiation of a stable convective hydroclimatic regime in Central America circa 9000 years BP. Nat. Commun. 11, 716. doi:10.1038/s41467-020-14490-y
Wong, C. I., Banner, J. L., and Musgrove, M. (2011). Seasonal dripwater Mg/Ca and Sr/Ca variations driven by cave ventilation: Implications for and modeling of speleothem paleoclimate records. Geochimica Cosmochimica Acta 75, 3514–3529. doi:10.1016/j.gca.2011.03.025
Wug, L. A., Matias, R. M., De Leon, C. A., and De La Cruz, J. S. (1995). “The Cobán Formation in the Petén Basin, Guatemala,” in Energy and mineral potential of the central American-caribbean region. Editors R. L. Miller, G. Escalante, J. A. Reinemund, and M. J. Bergin (Berlin, Heidelberg: Springer Berlin Heidelberg), 115–121.
Keywords: cave-monitoring, trace elements, drip sites, epikarst, Guatemala, oxygen isotopes
Citation: Bernal JP, Revolorio F, Cu-Xi M, Lases-Hernández F, Piacsek P, Lachniet MS, Beddows PA, Lucia G, López-Aguiar K, Capella-Vizcaíno S, López-Martínez R and Vásquez OJ (2023) Variability of trace-elements and δ18O in drip water from Gruta del Rey Marcos, Guatemala; seasonal and environmental effects, and its implications for paleoclimate reconstructions. Front. Earth Sci. 11:1112957. doi: 10.3389/feart.2023.1112957
Received: 30 November 2022; Accepted: 13 February 2023;
Published: 24 February 2023.
Edited by:
Daniel Enrique Ibarra, Brown University, United StatesReviewed by:
Christos Katrantsiotis, Umeå University, SwedenXinggong Kong, Nanjing Normal University, China
Copyright © 2023 Bernal, Revolorio, Cu-Xi, Lases-Hernández, Piacsek, Lachniet, Beddows, Lucia, López-Aguiar, Capella-Vizcaíno, López-Martínez and Vásquez. This is an open-access article distributed under the terms of the Creative Commons Attribution License (CC BY). The use, distribution or reproduction in other forums is permitted, provided the original author(s) and the copyright owner(s) are credited and that the original publication in this journal is cited, in accordance with accepted academic practice. No use, distribution or reproduction is permitted which does not comply with these terms.
*Correspondence: J. P. Bernal, anBiZXJuYWxAdW5hbS5teA==
†Deceased