 Siyi Chen1,2
 Fei You1,2*Jixiang Xu1
 Zhenhua Wang1,2Yun Zhang3Yaopeng Zhao1,2Haoyuan Yang1,2Zhiqiang Jiang1,2
- 1Jiangsu Key Laboratory of Urban and Industrial Safety, College of Safety Science and Engineering, Nanjing Tech University, Nanjing, China
- 2Institute of Fire Science and Engineering, Nanjing Tech University, Nanjing, China
- 3China Southern Power Grid Extra High Voltage Power Transmission Company Wuzhou Branch, Wuzhou, China
In recent years, events of transmission line tripping caused by wildfires have occurred frequently in many mountain areas. In order to understand the mechanism of such events, an experimental system for simulating breakdown discharge processes of model wires induced by a simulated fire source is designed. In this experiment, propane jet flame (somewhat like eruptive fires in real wild fires) is used as a simulated flame source. By setting three different gas flow rates and five different wire-wire gaps, discharge breakdown behaviors and characteristics between two ACSR (aluminum conductors steel reinforced) segments in propane flames with three flame zones are explored. The influences of these different factors on the breakdown characteristics and mechanisms of wire-wire air gaps are analyzed. Results show that breakdown voltages increase almost linearly with the increase of wire-wire gaps in continuous zone of the flames for three gas flow rates. For a short wire-wire gap like 5.0 cm, the pilot discharge channels can be formed more easily, stably and completely under a lower voltage and weaker external ionization environment. The propane jet flame conditions are complex and affected by multiple actions like initial jet force (affected by gas flow rate), temperature distribution, soot particle, ion wind. As a result, local electric field will be distorted, a streamer channel is established dependently in different cases. These factors play individual, competitive or synergistic roles at the same time in breakdowns of real ACSR wire-wire gaps.
1 Introduction
With the rapid development of society and the continuous improvement of power demand, constructing large-scale, long-distance and cross-regional power transmission systems has become a necessity (Zeng et al., 2016; Shu and Chen, 2018). As a result, the distribution densities of high voltage transmission lines also increase. Due to limited land resources, these lines may pass through many complex terrains like mountain areas where wildfires inevitably occur. Such fires usually lead to breakdown processes of long-distance air (usual electrical insulator) gaps around transmission lines. On the contrary, wild fires can also be caused by failures or faults of overhead power transmission lines.
Meanwhile, weather-related transmission line tripping accidents accounted for 78.09% of the total (Yang et al., 2019). Besides, no less than 80 wildfire accidents were caused by transmission lines with voltages of 110 kV and above from 2011 to 2017 (Huang and Shu, 2011; Jiang et al., 2017). Moreover, researchers found that the number of landslides in southern areas such as Guizhou Province, Jiangxi Province and Three Gorges in China has increased in recent year, which may lead to the failure of high-voltage transmission lines and wildfires (Huang et al., 2020a; Huang et al., 2020b; Chang et al., 2020). Certainly, wild fires in the United States, Australia, Canada, Mexico and other countries have also caused significant economic impacts (Huang et al., 2015). As reported, a wild fire emerged in California state of America in October 2019. It has caused electricity interruptions for at least 2 days and affected the normal power consumption of nearly 10 million households and enterprises in 36 counties (China Plus, 2019).
The above facts are enough to prove that wild fires have notable impacts on safe operations of overhead transmission lines and these disasters seriously affect the safety of life and economic development (Huang et al., 2020c). Related studies (Tse and Carlos, 1998) have shown that, when the three phases of a transmission line are close enough, discharge arcs will be generated. Such a discharge arc may first melt partial aluminum strands in ACSR lines in the form of molten aluminum beads. Once they fall off to the ground, they will cause new wild fires or aggravate former wild fires (Psarros et al., 2009). Additionally, it is generally believed that temperatures and electrical conductivity levels of forest vegetation flames have important influences on arc generations (Maabong et al., 2018). Therefore, a forest vegetation flame with a considerable size is an important factor to induce high voltage transmission line tripping accidents.
Besides, it is known that a flame itself is a weakly ionized plasma and can act as a conductor for current. Therefore, there should be inevitable interactions between electric fields and combustion processes in which flames are often involved and developed. Robledo Martinez et al. (1991) used a 70 kV three-phase AC line to study the influence of a butane flame on a wire-wire breakdown process, and found that temperature and air ionization play promotion roles in the breakdown of the wire-wire gaps. Gao et al. (2022) found that an electric field can promote both laminar and turbulent combustion processes under experimental conditions like air pressure of 0.3 MPa, excess air ratio of 1.2–1.6 and voltages of 1.0 kV–5.0 kV. Kuhl et al. (2017) studied the effect of an electric field on the structure and temperature of a CO (fuel) laminar flame and found that the electric field will deform the flame and increase its maximum temperature (2043 K without electric field) by 40–110 K. Jayaratne et al. (2008) used air ion counter to monitor 41 locations under an AC high voltage transmission line, and found that the pure concentrations of small ions vary from 0 to 3300 cm−3, indicating air molecules can be ionized to some extent even without flames. Based on above facts, flames promote the formation of a possible discharge channel to reach the electrodes of an electric field (in practice, the transmission lines) and cause a potential breakdown.
Meanwhile, researchers at home and abroad have addressed the effects of simulated fire sources (reduced-scale environments of a wild fire) on gaps between two model electrodes or practical transmission lines, corresponding breakdown characteristics and mechanisms. Huang et al. (2019) studied on the changes of breakdown voltages under three plant flames (fir stem, fir branch, thatch). They found that the effects of different types of vegetation flames on the gap breakdown characteristics are significantly different. You et al. (2011) used wood stacks (single, two and three copies) as fire sources and power frequency high voltage power supplies (110 kV, 220 kV and 500 kV) to simulate trips of simulated split wires under fires. It was found that the average breakdown field strengths for single, double and quadruple bundle simulated conductors in the flames are lower than those in pure air. Wang et al. (2022) found that the breakdown voltages are decreased by 27.8 %–70.5% in the non-bridged gap and by 68.3 %–77.1% in the bridged gap by ethanol flames as compared to the pure air gap. Yang et al. (2022) found that the average breakdown strength in a propane flame decreases and tends to be stable as the gap between the two electrodes increases. Zhao et al. (2021) found that the leakage current of the wire-wire gap at the place where the flame is continuous is more than twice by that at the place where the flame is intermittent.
Obviously, these studies offer some preliminary understandings of influences of simulating fire conditions especially various flames on breakdown behaviors and characteristics of model transmission lines. In addition, voltage application method (Li et al., 2016), ambient wind speed and slope gradient (Wu et al., 2011) are also found to exert varying effects on the breakdown phenomena of transmission lines.
In this work, a propane jet flame was used as a simulated fire source comparing with a vegetation fire. Two real ACSR transmission line segments (representing two electrodes) were fixed and immersed under continuous or intermittent flame zones. Five gaps (5.0 cm, 10.0 cm, 15.0 cm, 20.0 cm and 25.0 cm) between two segments and three gas flow rates (6 L/min, 12 L/min and 18 L/min) were altered to explore corresponding breakdown behaviors, characteristics (average breakdown voltages, average breakdown field strengths and leakage currents) and their effects. Related mechanisms of such influencing factors were explored.
2 Experimental
2.1 Material
The selected transmission wire (conductor) materials are the same type of ACSR segments. The model is LGJ-400/35. It is suitable for 220 kV or 500 kV high-voltage transmission lines. It is a conductor with 48 aluminum strands laid in three layers and 7 galvanized steel cores laid in two layers. Its physical and sectional views and key performance parameters are shown in Figure 1 and Table 1. Before the experiments, several wires (280–300 mm in length) were intercepted and wrapped with sealed bags to prevent them from absorbing dust particles in the air, being oxidized and corroded.
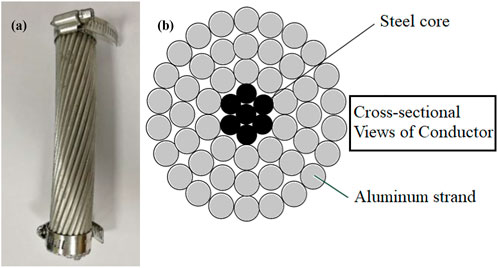
FIGURE 1. Physical and cross-sectional views of ACSR transmission line segment. (A) real photo; (B) cross-sectional view.
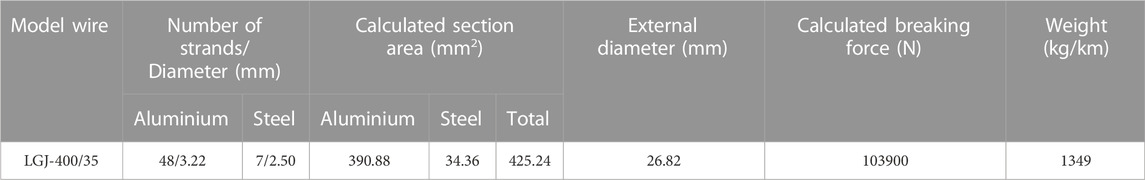
TABLE 1. Key performance parameters of ACSR transmission line segments.
2.2 Apparatus
The temperature acquisition system (Figure 2) consists of armored thermocouple beams, temperature acquisition modules and a laptop. The armored K-type thermocouples were adopted with probe diameters of 2 mm each. They were used for measurements of temperature fields of designed fire scenarios. The probe length is 400 mm, the length of compensation line is 2.0 m, and the temperature measurement range is 0–1200°C. The thermocouple compensation line was connected with a temperature acquisition module. The temperature acquisition module transmitted electrical signals obtained by the temperature sensors to the laptop through USB data lines.

FIGURE 2. Photo of temperature acquisition system.
An independently designed platform (Figure 3A) was used to simulate breakdown discharge processes of model wires induced by a simulated fire source. The main units include a flame generator with propane gas as the fuel (provided by Shandong Yongquan Co., Ltd., China), armored thermocouple beams (provided by Anhui Beichen Electric Technology Co., Ltd., China), two temperature acquisition modules (typed JY-DAM-TC12, provided by Anhui Beichen Electric Technology Co., Ltd., China), an oscilloscope (typed MDO3014, provided by Tektronix Co., Ltd., the United States), a console and a personal laptop. The thermocouples were linearly distributed along the central axis of the propane jet flame. They were distributed in the fire field as shown in Figure 3B. The thermocouples were numbered T1-T15 from bottom to top, and the vertical spacing of each thermocouple was 10.0 cm, and the thermocouple T1 was 10.0 cm from the upper edge of the propane gas nozzle. Figure 4 shows the simulated wild fire source generator (burner system). Figure 5 shows real photos of some platform units.
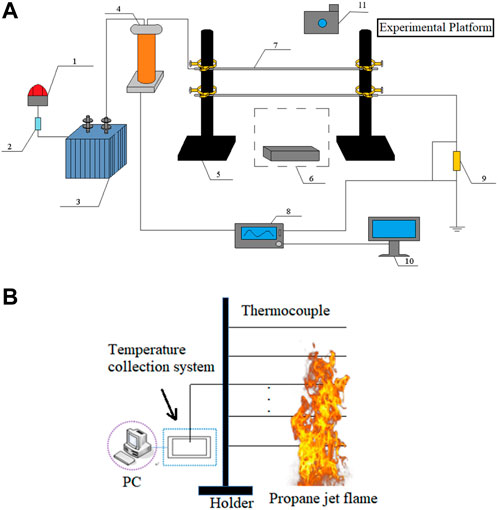
FIGURE 3. Schematic diagram of experimental platform for simulating breakdown discharge processes of model wires induced by a simulated fire source and the arrangement of the thermocouple. (A) Schematic diagram of experimental platform; (B) the arrangement of the thermocouple. (1-Power frequency power supply; 2-Water resistance; 3–30 kVA/50 kV light-weight high voltage test transformer; 4-Voltage divider; 5-Polytetrafluoroethylene (PTFE) electrical insulation holder; 6-Fire source generator; 7-ACSR segments; 8-Oscilloscope; 9–200 Ω resistance; 10-Laptop; 11-High-speed camera).
FIGURE 4. Schematic diagram of simulated wild fire source generator. (12-Propane gas cylinder; 13-Gas flowmeter; 14-Pressure relief valve; 15-Pressure gauge; 16-Ball valve; 17-Jet flame generator).
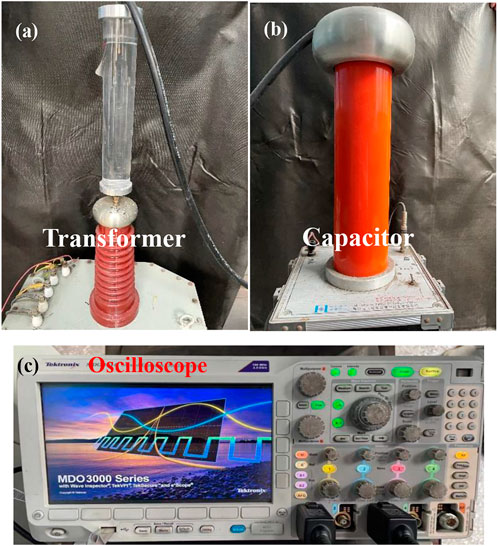
FIGURE 5. Photos of some parts of the experimental platform. (A) transformer; (B) capacitor; (C) oscilloscope.
2.3 Experimental data acquisition
The power frequency discharge simulation experiments in propane jet flames were carried out in an open space. The breakdown discharge and data acquisition system (provided by Wuhan Huadian Meilun Power Technology Co., Ltd., China) consists of a transformer console, a transformer, a capacitor, an isolation transformer, a DC microammeter, two ACSR segments (typed LGJ-400/35, provided by China Southern Power Grid Co., Ltd., China) and a oscilloscope (Figure 5C). In this work, a 30 kVA-50 kV AC power frequency power supply was adopted. The oscilloscope can be used to simultaneously collect different signal amplitude waveform curves with time, such as breakdown voltage and leakage current. The analog channel bandwidth was 100 MHz, the sampling rate was 2.5 GS/s and the recording capability was 10 M bytes.
2.4 Experimental method
According to the schematic diagram (Figure 3), two 1.5 m long ACSR segments were fixed on the clamping slots of two Polytetrafluoroetylene (PTFE) insulation holders, the upper wire was connected with the transformer equipment, and the lower wire was connected with a grounding wire and the data acquisition system. The flame generator (Figure 3) was used to generate a stable and clean propane jet flame (Figure 6A). The flame zone closest to the propane nozzle is defined as continuous zone 1. Due to the large initial momentum of the nozzle, propane gas is not easy to diffuse to the periphery, resulting in a narrower flame width in this zone, and the temperature is lower than that of the next continuous zone 2 because of incomplete combustion. The top end of the flame is defined as the intermittent zone (buoyancy plume). Due to the farthest distance from the nozzle, the flame here is more dispersed and unstable. Sometimes it can not fully bridge the gap. The zone between the continuous zone 1 and the intermittent zone is defined as continuous zone 2. Due to its relatively proper distance from the nozzle, it can maintain a more uniform and intenser flame phase with higher combustion efficiency, and its temperature is hence higher due to its better combustion conditions. This conforms to fire dynamics theory. As shown in Figure 6B, the soot chains, ion wind and other factors cause the non-uniformity of electric filed in the flame and the surrounding air, resulting in a constant change and movement of the breakdown arc in the line. Inside the flame bulk, compared with the flame intermittent zone, the flame in the continuous zone can often completely cover the entire gap. According to previous studies, when a flame completely bridges the gap, the flame conductivity is often relatively uniform (Wang et al., 2022). At the same time, the uniformity levels of the thermal particle density and the charged particle density in the flame continuous zone are enhanced. This also leads to the smaller fluctuations of the breakdown field strengths in the flame continuous zone with the changes of distances than those in the flame intermittent zone. From the above analyses, it can seen that the flame can significantly reduce the breakdown field strengths of the involved air. Besides, the electric field in the continuous flame zone is also more uniform than that in the intermittent flame zone (due to the stability of the flame in the continuous region and the uniformity of the internal high heat and charged particles). In the propane flame experiments at specific gas flow rates, in order to ensure that the narrowest flame can be filled with wire-wire gap at close distance, the wire-wire gap can be larger than the widest flame at long distance, and experimental variables are relatively uniform. After the propane gas jet was ignited, the operation console of the 30 kVA/50 kV light-weight high voltage test transformer (Figure 3) was manually operated to uniformly boost the power frequency voltage of the equipment at a constant speed of 1 V at the beginning. When there was a "Zi Zi" corona discharge sound in the wire-wire gap, the power frequency voltage was slowly increased until there was a breakdown arc in the wire-wire air gap and a line tripping was triggered. In the process, the leakage current waveform corresponding to the integer voltage was recorded at that time, and then the voltage was then continued to be increased. The leakage current waveform at the other three voltages were recorded. Thus, four leakage current waveform patterns at four applied voltages were obtained in each group of gap distance condition. The data obtained by the data acquisition module was saved to the laptop. In order to ensure the reliability, each experiment was repeated 5 times, and the average value of breakdown voltages was calculated.
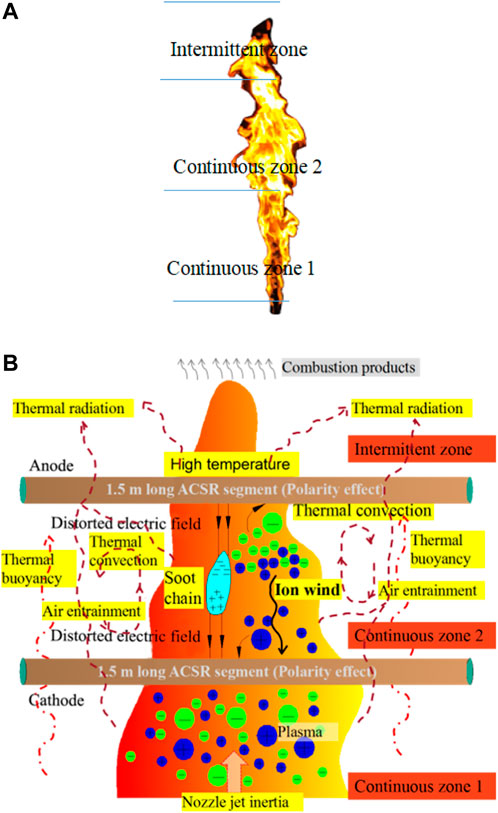
FIGURE 6. Division of three zones of a propane jet flame and working condition diagram of a wire-wire breakdown. (A) division of three flame zones; (B) working condition diagram of a wire-wire breakdown.
3 Results and discussions
3.1 Temperature distributions along the central axes of a propane jet flame under three flow rates
Figure 7 shows variations of temperatures with distances of 10.0–150.0 cm up from the fire source nozzle along the central axes of the vertical propane gas diffusion flames under three gas flow rates of 6 L/min, 12 L/min and 18 L/min. It can be seen from Figure 7 that for propane gas jet flames, the temperatures first increase and then decrease with increasing distances, and their temperature curves are similar to normal distributions.
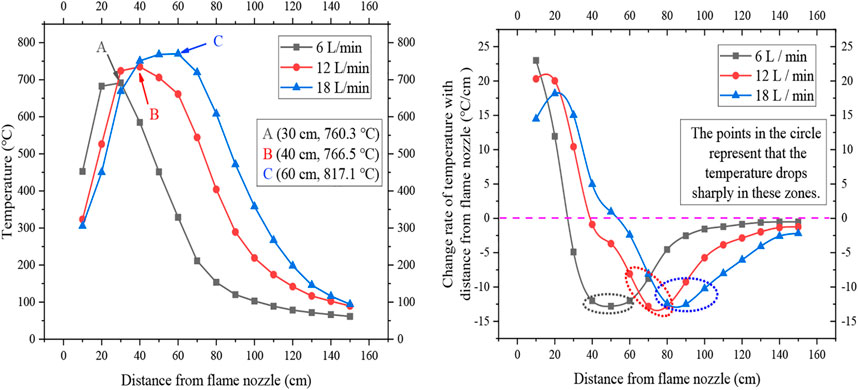
FIGURE 7. Variations of temperatures (left) with distances from propane jet flame nozzle along the central axes of propane gas flames with three gas flow rates and the change rates (right) of temperatures with distances from flame nozzle.
Besides, the heat release rate will increase with the increase of the propane gas flow rate. The heat release rate can be obtained by Eq. 1.
Where Q repersents the heat release rate, J/s; m repersents the mass flow rate, kg/s; H repersents the heat value of the propane gas, J/kg; ρ repersents the density of the propane gas at ambient temperature, kg/m3; V repersents the volumetric flow rate of the gas flow rate, m3/s. The value of H here is 5.037×10⁷ J/kg. The value of ρ here is 1.83 kg/m3. As a result, the heat release rates are [9.22×10³ J/s, 1.84×10⁴ J/s and 2.77×10⁴ J/s] with the gas flow rate of 6 L/min, 12 L/min and 18 L/min, respectively. Since the heat release rate obtained here is proportional to the corresponding gas flow rate, the gas flow rate is used to represent the heat release rate in the following text.
With increases of gas flow rate, the maximum temperatures measured by the temperature sensors are increasing, and their positions are rising up along the central axis of the flame (Figure 7, left part). This is related to the combustion characteristics of propane gas, that is, when the gas flow rate increases, not only the flame height increases, but also the continuous zone and intermittent zone of the flame are clearly elongated (HySafe, 2008). Meanwhile, in the jet flame, the high temperature zone is raised due to the nozzle pressure and gas velocity itself. The maximum temperatures of three kinds of gas flow rates are 760.3°C, 766.5°C and 817.1°C, and the distances between the location points and the fire source nozzle are 30.0 cm, 40.0 cm and 60.0 cm, respectively. The flame temperatures fluctuate at 40.0–60.0 cm, 60.0–80.0 cm and 80.0–100.0 cm under three gas flow rates.
Combined with the flame temperature curves and actual flame appearances, continuous zone 1, continuous zone 2 and intermittent zone are divided into [0.0–20.0, 20.0–40.0, 40.0–60.0] cm, [0.0–30.0, 30.0–60.0, 60.0–90.0] cm and [0.0–40.0, 40.0–70.0, 70.0–110.0] cm for three propane gas flow rates of 6 L/min, 12 L/min and 18 L/min, respectively. According to the temperature curve shown in Figure 7, the average temperature of continuous zone 1, continuous zone 2 and intermittent zone under three fire source powers are [571.0, 656.0, 456.0] °C, [531.0, 709.0, 509.0] °C, [565.0, 762.0, 509.0] °C for three propane gas flow rates, respectively.
Based on previous studies, it is found that the free radical concentrations in the air are related to temperatures and heat release rates. Besides, the formation of current column and air conductivity are also closely related to temperature (Hu et al., 2013). Therefore, the degree of air ionization is also related to the flame temperature (Aleksandrovy and Bazelyan, 1996; Pancheshnyi et al., 2005; Briels et al., 2008; Briels et al., 2008). The flame produces high conductivity, which intensifies the conduction of a streamer channel and induces a breakdown between wires easier (Dandaron et al., 1970; Lanoie and Mercure, 1989; Sadurski and Reynders, 1989; Uhm, 1999; Sukhnandan and Hoch, 2002; Kim, 2009). The subsequent sections also prove that the breakdown characteristics of the wire-wire gaps are related to the characteristics of propane flames. Based on these average temperatures, the connections between characteristics of breakdowns (breakdown voltages, breakdown field strengths, leakage currents) and multiple action factors (different heat effects, ion winds <ion concentrations>, soot particles, air flow <entrainment> and propane gas flow rates) can be analyzed in the later text.
3.2 Breakdown behaviors of wire-wire gap bridged by propane flames
3.2.1 Variation behaviors of flame and arc in the experiment
Through the breakdown experiments of wire-wire gaps bridged by propane gas flames, discharge arcs between two wires are found to be stable for a long time about 3.52 s. With uniformly increasing voltage, the discharge evolution behaviors in a propane flame within 4.88 s are more obvious than other cases when the wire-wire gap is 5.0 cm and the gas flow rate is 12 L/min. The upper wire is the anode and the lower wire is the cathode. Therefore, such working conditions are taken as examples as shown in Figure 8.
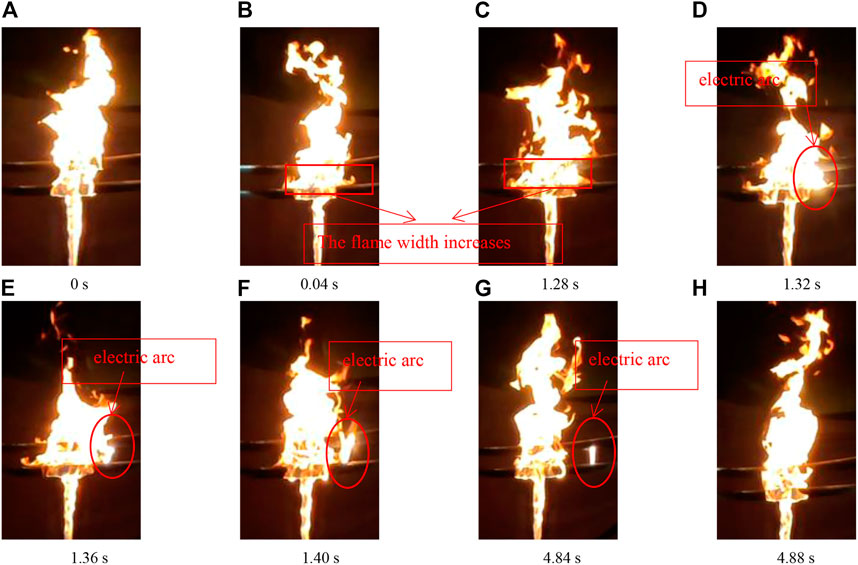
FIGURE 8. Discharge behaviors of a wire-wire gap (5.0 cm) in a propane flame with a gas flow rate of 12 L/min at different times.
As shown in Figure 8A, the flame is not obviously affected in the electric field at the beginning. This moment is defined as the starting time (0 s) of a wire-wire gap breakdown discharge.
When time comes to 0.04 s, obvious ion winds begin to appear in the wire-wire gap and continuously blow down the flame with the continuous increase of supplied power frequency voltage from 0.0 kV to 5.0 kV after 0.04 s. This phenomenon is in agreement with previous studies (Wang and Yao, 2007; Borgatelli and Dunn-Rankin, 2012) that ion migration affects the direction of thermal convection. In this sense, a competitive mechanism is generated and the flame morphology is affected due to the generation of the arc. The phenomenon also confirms that ion winds can interfere with the flames and change their shapes.
When time comes to 1.32 s, the wire-wire gap is bridged by the flame center zone and starts to break down, and an AC arc appears with obviously stronger brightness than that of the flame. At this time, the wire-wire gap has been completely short circuited by the arc, and the voltage does not increase. The arc deviates from the flame and continuously moves to the right along the wires. Actually, in many subsequent experiments, an arc deviates left or right from the flame randomly. The reason is that the arc tends to discharge from the maximum potential difference channel.
As shown in Figures 8E–G, the arc will slide to the right of the flame center and finally stay at a certain position. The reason may that the ion wind continuously blows down the flame, makes large amounts of soot particles [produced by incomplete combustion of hydrocarbons (Dai et al., 2020)] accumulate on the surface of the cathode wire (Figure 9) and shortens the practical wire spacing. Meanwhile, in the electric field, soot particles grow from disorder to high crystallization, and the top of a crystallization block or a soot chain is prominent. This is conducive to inducing the distortion of an electric field and promoting a discharge (Shvedchikov et al., 2010). However, the arc with a high temperature bridges the soot particles, ignites the soot particles very easily, makes them change into gas products through burning and disappear at last. Therefore, the arc moves to the right continuously because the smoke in the middle has been exhausted and the soot concentration in the right is higher than that in the left due to the effect of ion wind.
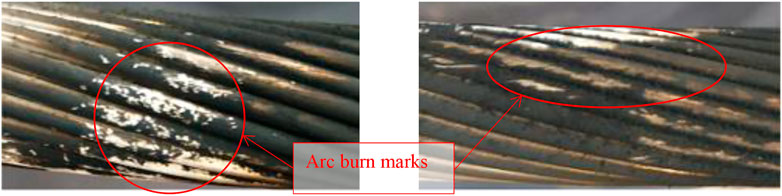
FIGURE 9. Residual traces on surfaces of both two wires surfaces after arc discharge processes (a wire-wire gap of 5.0 cm, a propane gas flow rate of 12 L/min).
From the above analyses, considering the wild fires in practice, since the actual operation voltage of transmission line is usually much higher than the highest voltage in this experiment (70 kV), the effect of ion wind on wild fire flame is thought to be much more obvious. When the size of a stretched or deformed flame can bridge the gaps between three phase conductors, conductors and a tower or conductors and the ground (or a tree canopy), it is easy to induce a possible power line flashover trip.
3.2.2 Morphology characteristics of the surface of wires after experiment
Figure 9 shows that the discharge trace on the surface of the wire. By observing, only the solidified aluminum particles after melting at 660°C have lost the original luster of the fresh wire since a dense aluminium oxide (Al2O3) film is formed outside an aluminum strand at high temperature (Wang et al., 2015). Some carbonaceous soot particles are attached to an aluminum strand due to the incomplete combustion of propane gas. When an arc burns, the uneven distributions of arc temperatures, random displacements and limited contact spots on the surfaces of the wires result in small melting aluminum beads. Some of them are separated from the surfaces of the wires, some of them are solidified or oxidized on the surfaces of the wires. Moreover, high temperature and strong energy of an arc break through the thin layers of oxide films on the surfaces of the wires, the interior of the wires melt and oxidize continuously. After solidification, a new and thick oxide film in dark milky white is formed (Figure 9A).
Meanwhile, an ion wind usually has certain movement rate (Rickard et al., 2005), it blows incompletely solidified alumina particles and unstable attached soot blocks away at local points along the wires. Also, some soot particles are embedded in a molten aluminum bead or an alumina particle, some soot particles are further consumed to produce char, CO2 and H2O by a propane flame. In this way, finally produced discharge traces in a mixture state are left on aluminum strands. This also shows that molten or oxidized aluminum particles with energy on the surfaces of the wires are produced once discharge arcs are generated. Some of them drop into the vegetation combustibles under multiple forces (ion winds, own gravities, ambient winds and mechanical actions, etc.). This also further verifies the results of forest vegetation fires caused by melting wire particles (Xu, 2007; Cui, 2009).
3.3 Breakdown mechanisms of wire-wire gaps induced by propane flames
3.3.1 Breakdown voltage waveform mechanisms of wire-wire gaps
Through experiments, it is known that under a wire-wire gap of 10.0 cm, the breakdown voltages in each flame zone do not exceed the range of the instrument, their differences are more obvious than those under a wire-wire gap of 5.0 cm. The instantaneous time node of the breakdown is recorded as 0 s ‘-50–50 m’ represents the interval of 50 m before and after this time node. Here, breakdown voltage data are selected and the voltage waveform patterns for this period are drawn. In this case, Figure 10 shows the transient (-50–50 m breakdown voltage waveform patterns for a typical wire-wire gap (Δd = 10.0 cm) under propane flames with three gas flow rates (6 L/min, 12 L/min and 18 L/min) at different flame zones (continuous zone 1, continuous zone 2 and intermittent zone) and pure air.
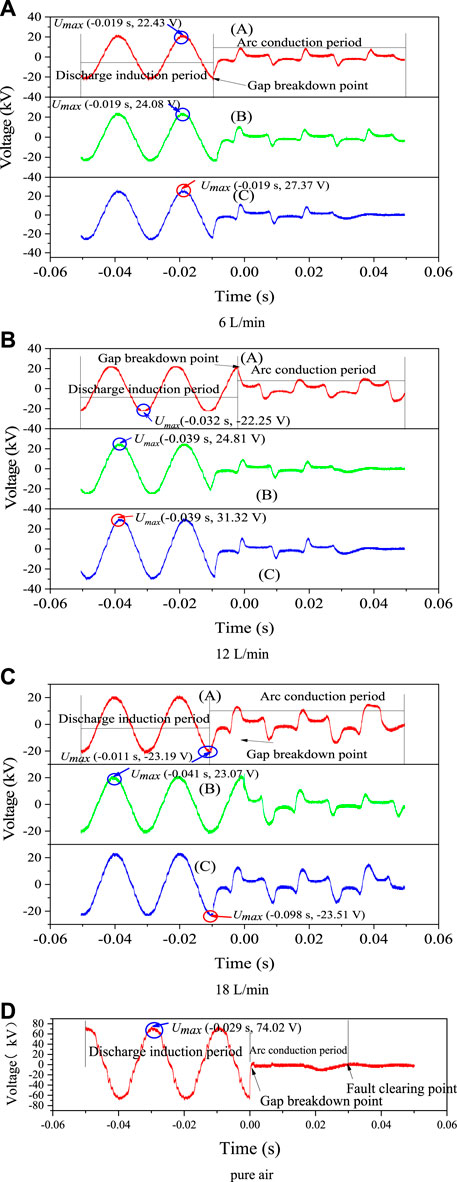
FIGURE 10. Instantaneous breakdown voltage waveform patterns for a typical wire-wire gap (Δd = 10.0 cm) under propane flames with different gas flow rates and pure air. (A) with the gas flow rate of 6 L/min; (B) with the gas flow rate of 12 L/min; (C) with the gas flow rate of 18 L/min; (D) in pure air.
It can be seen in Figure 10 that an average breakdown voltage decreases to the minimum at a gas flow rate of 12 L/min or 18 L/min in each zone of a propane flame (see later Table 2) and it is maximum when the wire-wire gap (10.0 cm) is in the pure air (Figure 10D). The reason is that the flames contain multiple ions like H3O+, C2H3O+, CH5O+ and CH3+ (Prager et al., 2007). These charged particles fill the gap and undergo migration under the action of the electric field, resulting in a significant increase in conductivity. Therefore, compared with pure air, the line under propane flame has a smaller breakdown voltage and breakdown field strength. Meanwhile, the incomplete combustion of propane leads to some soot particles adhering to the surface of aluminum strands (Figure 9). The practical insulation air gap becomes shorter and the thermal effects (Figure 6B) of the flame accelerate the movement of ions (ion wind, Figure 6B) between the wires. As a result, the wire-wire gap is easier to be broken down (Shvedchikov et al., 2010). The voltage suddenly decreases when the gap (10.0 cm) breaks down and the arc appears clearly with an arc conduction period. Under propane flames with flow rates of 6 L/min, 12 L/min and 18 L/min, the durations of the arc conduction periods are 60 m, 50–60 m and 50–60 m, respectively. In the arc conduction period, due to the presence of a large number of moving conductive particles (Figure 6B) in the propane flame, average breakdown voltage between the wires is constantly changing, a sawtooth shape shows on the waveform (Figures 10A–C).
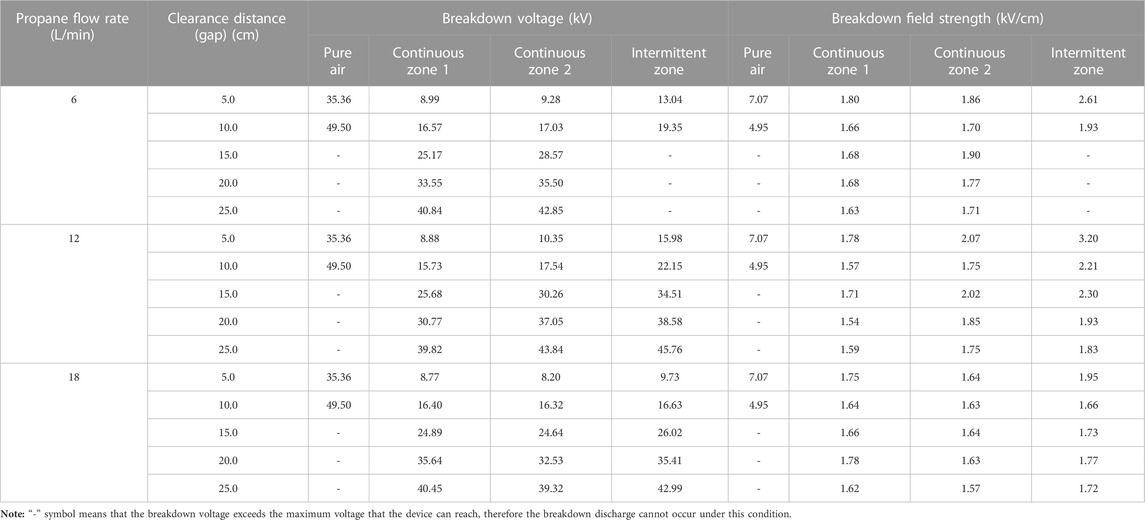
TABLE 2. Breakdown parameters (average values) of wire-wire gaps under different cases of propane gas flames.
3.3.2 Breakdown mechanisms and influencing factors of wire-wire gaps
According to the breakdown voltage waveform patterns (Figure 10), the peak values of breakdown voltages can be read, the effective values of breakdown voltages can be obtained by Eq. 2.
Where Ue represents the effective values of breakdown voltages, kV; Umax represents the peak values of breakdown voltages, kV.
According to (3), the breakdown field strengths of different gaps can be obtained.
Figure 11 shows the trend curves of average breakdown voltages with the wire-wire gap distances under the same gas flow rate and different propane flame zones.
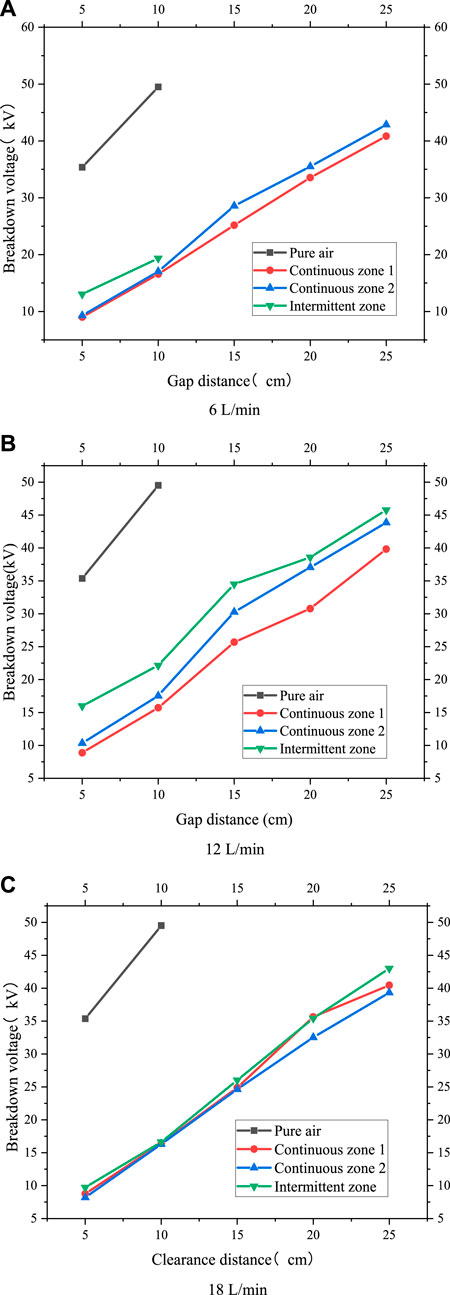
FIGURE 11. Trend curves of average breakdown voltages with gap distances under the same gas flow rate and different flame zones. (A) with the gas flow rate of 6 L/min; (B) with the gas flow rate of 12 L/min; (C) with the gas flow rate of 18 L/min.
In Table 2 and Figure 11, it is obvious that average breakdown voltages in pure air are much larger than those in different zones of propane flames for the same gaps. In Figure 11, in each propane flame zone with a specific gas flow rate, the breakdown voltage increases with the increase of wire-wire gap.
The relationship plots between average breakdown voltages and gaps in each zone show consistent slopes for the propane flames with gas flow rates of 12 L/min or 18 L/min (Figures 11B, C). The reason is that different from the propane flame with a gas flow rate of 6 L/min, each zone of the flames with gas flow rates of 12 L/min (see Figure 8) and 18 L/min is in a relatively uniform and balanced state. It is consistent with the findings of Zake and Barmina. (2001), that is, the increase of hydrocarbon flame intensity has a direct effect on the discharge characteristics of the electrodes. With the increase of the gas flow rate, the width and length of a flame will increase, the stability inside the flame is enhanced (Xi et al., 2018). When the flames are at the flow rates of 12 L/min and 18 L/min, three zones of the flames will be stretched accordingly. This confirms that the flame height will be elongated with the increase of fire power (HySafe, 2008).
It can be seen that when the gas flow rate is 6 L/min and the wire-wire gaps are 15.0 cm, 20.0 cm and 25.0 cm, in the intermittent zone of the propane flame, the gaps can not be broken down. The reason is that in this zone the flame top dispersion is serious due to the combined actions of electric field, air entrainment, thermal buoyancy and convection, and nozzle jet inertia (Figure 6B) and Figure 8) (HySafe, 2008). As a result, the flames are difficult to bridge 15.0 cm and above gaps continuously, the streamers are difficult to exist in the unstable flame zones and breakdown discharges are difficultly triggered.
Figure 12 shows the trend curves of average breakdown field strengths with the wire-wire gaps under the same gas flow rate and different propane flame zones.
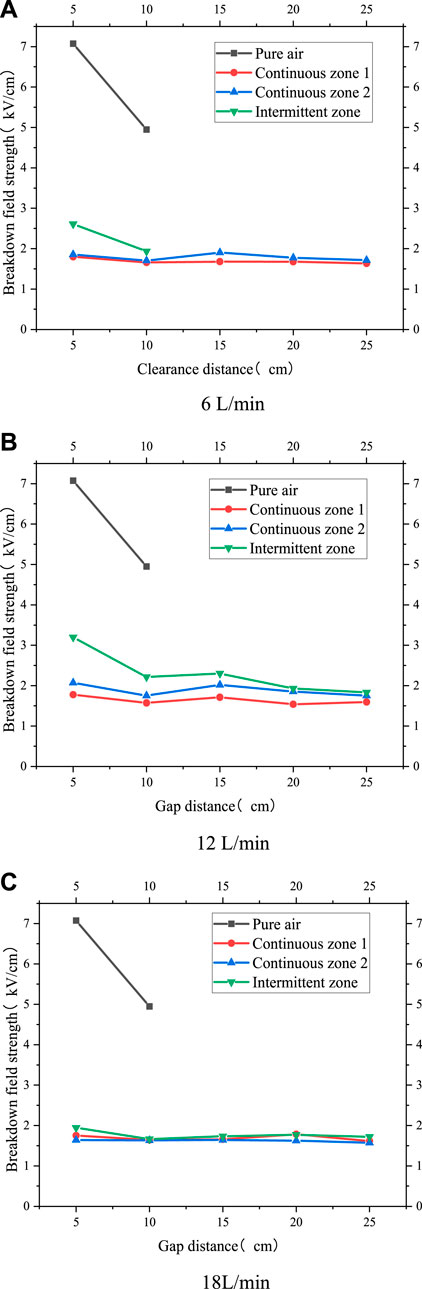
FIGURE 12. Variations of average breakdown field strengths with different wire-wire gaps under the same gas flow rate and different propane flame zone. (A) with the gas flow rate of 6 L/min; (B) with the gas flow rate of 12 L/min; (C) with the gas flow rate of 18 L/min.
It can be seen that when the gas flow rates are 12 L/min and 18 L/min, in three zones of the propane flames, the changes of breakdown field strengths with different wire-wire gaps tend to be minor. This proves the uniformity levels of flame temperature, heat and charged particle density are strengthened, especially for the gas flow rate of 18 L/min.
Meanwhile, when the wire-wire gap is 10.0 cm, the breakdown field strength decreases obviously contrast to that under the gap of 5.0 cm in the intermittent zone of the propane flame in Figure 12. The reason is that the high temperatures [almost 1.45×10⁴ K (Cheng et al., 2010)], heat exchanges and particle densities in the intermittent zone have been greatly reduced, the gap is not much different from that of pure air. Meanwhile, it is also proved that the average breakdown field strength decreases with the increase of distance in air (Fang et al., 2005; Yu-Chien et al., 2019).
In addition, under gas flow rates of 6 L/min and 12 L/min, the average breakdown field strengths both show increasing trends from continuous zone 1 to the intermittent zone, indicating that fire source power (heat release rate of a propane flame), temperature, heat exchange (thermal buoyancy and convection), soot particle, ion wind and polarity effect have obvious effects on a wire-wire gap breakdown (Rickard et al., 2005; Shvedchikov et al., 2010; Borgatelli and Dunn-Rankin, 2012). Different from the above characteristic is that when the gas flow rate is 18 L/min, average breakdown field strengths of three flame zones show little differences. The reason is that in this case, primarily due to the large initial jet momentum, the flame can maintain a long distance (stroke) without dispersing under the blowing force and inertia effect, the width and height of the flame are larger (HySafe, 2008). Comprehensive effects of fire source power, temperature, heat exchange, soot particle, ion wind and polarity (Rickard et al., 2005; Shvedchikov et al., 2010; Borgatelli and Dunn-Rankin, 2012) in the intermittent zone can still be maintained. Therefore, the wire-wire gaps can be bridged. Moreover, the changes of breakdown field strengths in the flame continuous zone are smaller than those in the intermittent zone (Figure 12). Due to the intermittent zone can not bridge the gap sufficiently, the factor inducing a breakdown is mainly the high temperature. As can also be seen from Figure 12 that the breakdown field strengths in the continuous zone are even lower, which indicates that the high temperature flame itself has a greater role in inducing a breakdown (compared with high temperature).
3.3.3 Leakage current mechanisms of corona discharges before wire-wire gap breakdown
It is found that the leakage current waveform is easy to capture when the gas flow rate is 6 L/min. When the gas flow rate is 12 L/min or 18 L/min, the wire-wire gaps are too easy to be broken down in a short time and it is hard to record the leakage currents. In view of this, the characteristics of leakage current under the propane flame with a gas flow rate of 6 L/min are analyzed. Because the breakdown voltage of each gap is different and to make sure the consistency of the experimental scale, the leakage current waveforms of four voltage levels before breakdown in the five gaps in continuous zone 2 are selected in the 0.1 s time period as shown in Figure 13, and they are intercepted in the same time period before and after t = 0 s.
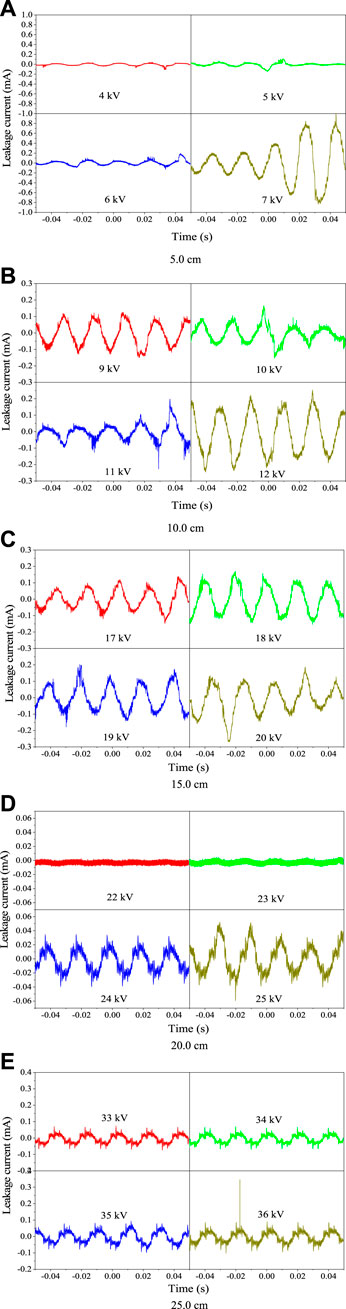
FIGURE 13. Leakage current waveforms before breakdowns of different wire-wire gaps in propane gas flames (continuous zone 2, the gas flow rate of 6 L/min). (A) with the gap of 5.0 cm; (B) with the gap of 10.0 cm; (C) with the gap of 15.0 cm; (D) with the gap of 20.0 cm; (E) with the gap of 25.0 cm.
It can be seen that when the wire-wire gap is 5.0 cm and voltages (power frequency voltages from a power supply) of 4 kV, 5 kV, 6 kV and 7 kV are applied to it respectively, the corresponding maximum leakage current values are 0.11 mA, 0.14 mA, 0.19 mA and 0.98 mA, respectively. With the increase of applied voltage, the leakage current presents a gradually increasing trend. It means that streamers are easier to form with the increase of the voltage. When the applied voltages are less than 7 kV, the generated electric field is not enough to form a stable streamer pilot discharge channel in the wire-wire gap. Therefore, the leakage current value is relatively small.
From the above phenomena, it can be seen that when the gap is becoming larger, the change of leakage current with applied voltage is not as obvious as that when the wire-wire gap is 5.0 cm. The reason is that a thicker discharge channel is more easily and gradually formed for a shorter gap. As a result, the wire-wire gaps are easier to be broken down. In addition, the discharge channel is not only affected by external ionization factors in the formation process, but also by voltage (Wang et al., 2022). Under the continuous action of the electric field, a large number of electrons in the flame collide strongly, and the flame plasma density is continuously enhanced, which provides a stable external ionization factor for the formation and development of the streamer or leader discharge channel. As the electric field intensity increases, the effect becomes more obvious, and a thicker discharge channel is gradually formed, resulting in an increase in the leakage current. For small gaps (such as 5 cm), the streamer leader discharge channel can be formed under low voltage and weak external ionization environment. With the increase of the applied voltage, discharge channels become more and thicker. Positive ions and released electrons migrate more intensely in opposite directions in such discharge channels. Leakage currents are more obvious.
4 Conclusion
In this paper, the temperature distributions of propane jet diffusion flames under three gas flow rates were determined. Based on this, the discharge breakdown behaviors and characteristics of five wire-wire air gaps in propane flames with three zones and gas flow rates were explored. Influences of these three factors on the breakdown characteristics were analyzed. Corresponding mechanisms were deduced. The following conclusions can be obtained.
When the propane flame exists, the change trend of the average breakdown strength is not obvious regardless of the gap in the region of the flame. This indicates that high temperature flame and its intense heat can effectively reduce the field strength required to trigger the discharge, and meanwhile, make the original uneven electric field become nearly uniform and continuous. Moreover, the change of breakdown field strengths in the continuous zone of flame are smaller than those in the intermittent zone.
Due to the intermittent zone can not bridge the gap sufficiently, the factor inducing breakdown in the incomplete bridging zone is the high temperature. It can be seen that the breakdown field strengths in the continuous zone are smaller, which indicates that the high temperature flame itself has a greater role in inducing a breakdown (compared with high temperature). Therefore, when preventing the tripping of a high voltage transmission line, we should try to construct the transmission line over regions with no or less, low-height and disperse vegetation or forest stands. Thus, intense wildfire probabilities are much reduced. Long and intense flames will not occur. They cannot bridge overhead powerlines and trigger a breakdown. Moreover, the transmission line can be constructed over regions with no or less special terrains like valleys, hills, mountains, basins. In such areas, forest stands are usually rich and are inclined to become fuels in an intense wildfire. High and fierce flames can most probably induce a breakdown of a transmission line.
In addition, with the continuous application of a power frequency voltage in the simulated conductors, the leakage current in the conductors will become larger. It will eventually lead to the generation of a high-temperature and high-energy arc to break down and trip the conductors. Therefore, we can strengthen the detection strengths of abnormal currents in practical powerlines in real operations. This is most beneficial to find the hidden danger nodes of the lines before the arc is formed and control an unexpected disaster from the source.
Data availability statement
The original contributions presented in the study are included in the article/Supplementary Material, further inquiries can be directed to the corresponding author.
Author contributions
SC: Conceptualization, Data curation and Original draft preparation; FY: Supervision, Project administration, Funding acquisition, Writing-Reviewing and Editing; JX: Data curation; ZW: Writing-Reviewing and Editing; YUZ: Methodology; YAZ: Software; HY: Software; ZJ: Software.
Funding
This research was funded by the National Natural Science Foundation of China (Grant No. 51376089 and 50906039), and the 2019 Key Project of The Natural Science Foundation of the Jiangsu Higher Education Institutions of China (19KJA520007, A Class).
Conflict of interest
Author YUZ was employed by the company China Southern Power Grid Extra High Voltage Power Transmission Company Wuzhou Branch, Wuzhou, China.
The remaining authors declare that the research was conducted in the absence of any commercial or financial relationships that could be construed as a potential conflict of interest.
Publisher’s note
All claims expressed in this article are solely those of the authors and do not necessarily represent those of their affiliated organizations, or those of the publisher, the editors and the reviewers. Any product that may be evaluated in this article, or claim that may be made by its manufacturer, is not guaranteed or endorsed by the publisher.
References
Aleksandrovy, N., and Bazelyan, E. (1996). Temperature and density effects on the properties of a long positive streamer in air. J. Appl. Phys. 29, 2873–2880. doi:10.1088/0022-3727/29/11/021
Borgatelli, F., and Dunn-Rankin, D. (2012). Behavior of a small diffusion flame as an electrically active component in a high-voltage circuit. Combust. Flame 159, 210–220. doi:10.1016/j.combustflame.2011.06.002
Briels, T., van Veldhuizen, E., and Ebert, U. (2008). Positive streamers in air and nitrogen of varying density: Experiments on similarity laws. J. Phys. D. Appl. Phys. 41 (23), 234008. doi:10.1088/0022-3727/41/23/234008
Briels, T., van Veldhuizen, E., and Ebert, U. (2008). Time resolved measurements of streamer inception in air. IEEE Trans. Plasma Sci. 36 (4), 908–909. doi:10.1109/TPS.2008.920223
Chang, Z., Du, Z., Zhang, F., Huang, F., Chen, J., Li, W., et al. (2020). Landslide susceptibility prediction based on Remote sensing images and GIS: Comparisons of supervised and unsupervised machine learning models. Remote Sens. 12, 502. doi:10.3390/rs12030502
Cheng, M., An, Y., Du, H., Wei, Y., and Fan, D. (2010). Effect of current changes on velocity and temperature profiles of GTAW arc. Trans. China Weld. Inst. 31 (04), 33–37. doi:10.1155/2010/293410
China Plus (2019). New evacuations, power outages near California wildfire. Available at: http://chinaplus.cri.cn/news/world/10/20191027/372480.html [Accessed on November 23 2022].
Cui, H. X. (2009). “Phase-field Method of dendrite growth and microsegregation during solidification,” ([Shenyang (Liaoning)]: Shenyang Polytechnic University). [dissertation/master's thesis].
Dai, W., Yan, F., Xu, L., Zhou, M., and Wang, Y. (2020). Effects of carbon monoxide addition on the sooting characteristics of ethylene and propane counterflow diffusion flames. Fuel 271, 117674. doi:10.1016/j.fuel.2020.117674
Dandaron, G., Dautov, G., and Mustafin, G. (1970). Effect of gas temperature on breakdown potential. J. Appl. Mech. Tech. Phys. 11 (1), 140–143. doi:10.1007/bf01102689
Fang, Y., Liu, J., Liao, G., Xu, Q., and Zhou, X. (2005). Experimental studies on electrical breakdown field strength of electrode with water mist containing MC additives. Chin. Sci. Bull. 50 (23), 2783–2788. doi:10.1360/982005-186
Gao, X. Y., Gao, Z. Q., Du, Z. H., Zhang, H., and He, Z. Q. (2022). Effect of low-frequency alternating-current electric field parameters on laminar and turbulent flames of CH4/air mixture. Fuel 317, 121755. doi:10.1016/j.fuel.2021.121755
Hu, L. H., Wang, Q., Tang, F., Delichatsios, M., and Zhang, X. C. (2013). Axial temperature profile in vertical buoyant turbulent jet fire in a reduced pressure atmosphere. Fuel 106, 779–786. doi:10.1016/j.fuel.2012.10.051
Huang, D., Li, P., Ruan, J., Zhang, Y., and Wu, T. (2015). Review on discharge mechanism and breakdown characteristics of transmission line gap under forest fire condition. High. Volt. Technol. 41 (2), 622–632. doi:10.13336/j.1003-6520.hve.2015.02.040
Huang, D., Lu, W., Yao, T., Xia, J., and Quan, W. (2019). Study on leakage current characteristics of conductor-plane short air gap under vegetation fire condition. Trans. China Electrotech. Soc. 34 (16), 3487–3493. doi:10.19595/j.cnki.1000-6753.tces.181752
Huang, F. M., Cao, Z. S., Guo, J. F., Jiang, S. H., and Guo, Z. Z. (2020c). Comparisons of heuristic, general statistical and machine learning models for landslide susceptibility prediction and mapping. CATENA 191, 104580. doi:10.1016/j.catena.2020.104580
Huang, F. M., Cao, Z. S., Jiang, S. H., Zhou, C. B., and Guo, Z. Z. (2020b). Landslide susceptibility prediction based on a semi-supervised multiple-layer perceptron model. Landslides 17, 2919–2930. doi:10.1007/s10346-020-01473-9
Huang, F. M., Zhang, J., Zhou, C. B., Wang, Y. H., Huang, J. S., and Zhu, L. (2020a). A deep learning algorithm using a fully connected sparse autoencoder neural network for landslide susceptibility prediction. Landslides 17, 217–229. doi:10.1007/s10346-019-01274-9
Huang, L., and Shu, S. Y. (2011). Analysis on fault trips caused by forest fire in CSG in the first quarter of year 2010. Guangdong Electr. Power 24 (3), 95–97. doi:10.3969/j.issn.1007-290X.2011.03.023
HySafe (2008). Free jet laminar and turbulent diffusion flames. Available at: http://www.hysafe.org/wiki/BRHS/FreeJetLaminarAndTurbulentDiffusionFlames [Accessed on November 23 2022].
Jayaratne, E., J-Fatokun, F., and Morawska, L. (2008). Air ion concentrations under overhead high-voltage transmission lines. Atmos. Environ. 42 (8), 1846–1856. doi:10.1016/j.atmosenv.2007.11.017
Jiang, S., Zhu, S., Huang, Z., Feng, B., and Wang, L. (2017). Characteristics and prevention measures of wildfire fault trips of transmission line in guangxi power Grid. Guangxi Electr. Power 40, 49–51. doi:10.16427/j.cnki.issn1671-8380.2017.05.011
Kim, I. (2009). Flashover characteristics of vertical-type model power line in the presence of combustion flame. J. Korean Inst. Illum. Electr. Install. Eng. 23 (5), 58–65. doi:10.5207/JIEIE.2009.23.5.058
Kuhl, J., Seeger, T., Zigan, L., Will, S., and Leipertz, A. (2017). On the effect of ionic wind on structure and temperature of laminar premixed flames influenced by electric fields. Combust. Flame 176, 391–399. doi:10.1016/j.combustflame.2016.10.026
Lanoie, R., and Mercure, H. (1989). “Influence of forest fires on power line insulation,” in Proceedings of the 6th International Symposium on High Voltage Engineering (ISH), Xi'an, China, 21-26 November 2021, 12–18.
Li, P., Huang, D., Ruan, J., Wei, H., and Qin, Z. (2016). Study of influence of voltage application modes on AC gap breakdown characteristic under fire conditions. Power Syst. Technol. 40 (5), 1576–1581. doi:10.13335/j.1000-3673.pst.2016.05.042
Maabong, K. E., Mphale, K., Letsholathebe, D., and Chimidza, S. (2018). Measurement of breakdown electric field strength for vegetation and hydrocarbon flames. J. Electromagn. Anal. Appl. 10, 53–66. doi:10.4236/jemaa.2018.103004
Pancheshnyi, S., Nudnova, M., and Starikovskii, A. (2005). Development of a cathode-directed streamer discharge in air at different pressures: Experiment and comparison with direct numerical simulation. Phys. Rev. E Stat. Nonlinear, Soft Matter Phys. 71 (1), 016407. doi:10.1103/PhysRevE.71.016407
Prager, J., Riedel, U., and Warnatz, J. (2007). Modeling ion chemistry and charged species diffusion in lean methane-oxygen flames. Proc. Combust. Inst. 31 (1), 1129–1137. doi:10.1016/j.proci.2006.07.141
Psarros, E. G., Polykrati, A. D., Karagiannopoulos, C. G., and Bourkas, P. D. (2009). A model for calculating the temperature of aluminium particles ejected from overhead low-voltage lines owing to a short-circuit. Int. J. Wildland Fire 18, 722–726. doi:10.1071/WF08128
Rickard, M., Dunn-Rankina, D., Weinbergb, F., and Carleton, F. (2005). Characterization of ionic wind velocity. J. Electrost. 63, 711–716. doi:10.1016/j.elstat.2005.03.033
Robledo-Martinez, A., Guzman, E., and Hernandez, J. (1991). Dielectric characteristics of a model transmission line in the presence of fire. IEEE Trans. Electr. Insul. 26 (4), 776–782. doi:10.1109/14.83702
Sadurski, K., and Reynders, J. (1989). High voltage AC breakdown in presence of fires. In Proceedings of the 6th International symposium on High Voltage Engineering (ISH). 1–4.28 August - 1 September, 1989, New Orleans, Louisiana, USA.
Shu, Y. B., and Chen, W. J. (2018). Research and application of UHV power transmission in China. High. Volt. 3 (1), 1–13. doi:10.1049/hve.2018.0003
Shvedchikov, A. P., Krasotkina, I. A., Bekeshev, V. G., and Ponizovskii, A. Z. (2010). Formation of soot clusters under the action of electric field of direct-current corona during combustion of natural gas. High. Energy Chem. 44 (4), 337–340. doi:10.1134/s0018143910040144
Sukhnandan, A., and Hoch, D. (2002). Fire induced flashovers of transmission lines: Theoretical models. Proc. IEEE AFRICON 2002, 617–622. doi:10.1109/AFRCON.2002.1159981
Tse, S. D., and Carlos, A. C. (1998). On the flight paths of metal particles and embers generated by power lines in high winds-a potential source of wildland fires. Fire Saf. J. 30, 333–356. doi:10.1016/S0379-7112(97)00050-7
Uhm, H. (1999). Properties of plasmas generated by electrical breakdown in flames. Phys. Plasmas 6 (11), 4366–4374. doi:10.1063/1.873701
Wang, Y., and Yao, Q. (2007). Variation of flame shape and deposits by applying electric fields. J. Eng. Thermophys. 28, 237–239. doi:10.3321/j.issn:0253-231X.2007.z2.063
Wang, Z. H., Huangfu, W. H., Zhao, Y. P., Chen, S. Y., You, F., Zhang, Y., et al. (2022). Breakdown characteristics of rod-plane gap in an ethanol flame. IEEE Trans. Dielectr. Electr. Insul. 29 (1), 206–214. doi:10.1109/TDEI.2022.3146541
Wang, Z. H., You, F., Zhang, Y., and Lai, Y. L. (2015). Analyses on damage behaviors and mechanism of operation properties of typical high-voltage transmission line under intense heat and blaze. Fire Sci. Technol. 34 (06), 714–718. (in Chinese). doi:10.3969/j.issn.1009-0029.2015.06.005
Wu, T., Ruan, J., Chen, C., and Huang, D. (2011). “Field observation and experimental investigation on breakdown of air gap of AC transmission line under forest fires,” in Proceedings of the 2011 IEEE Power Engineering and Automation Conference, Wuhan, China. 8-9 September 2011, 339–343. doi:10.1109/PEAM.2011.6135101
Xi, Z. Y., Fu, Z. G., Hu, X. T., Sabir, S., and Jiang, Y. B. (2018). An investigation on flame shape and size for a high-pressure turbulent non-premixed swirl combustion. Energies 11 (4), 930–1020. doi:10.3390/en11040930
Xu, H. B. (2007). “The applying research of the performance-based fire protection evaluation for large-space buildings,” ([Changsha (Hunan)]: Hunan University). [dissertation/master's thesis].
Yang, H. Y., Shui, K., Wang, Z. H., Chen, S. Y., You, F., and Zhang, Y. (2022). Effects of electrode shape on the gap breakdown characteristics in propane injection flames. J. Tsinghua. Univ. 62 (6), 1094–1101. (in Chinese). doi:10.16511/j.cnki.qhdxxb.2022.22.036
Yang, S., Zhou, W., Zhu, S., Wang, L., Lisha, Y. E., Xia, X., et al. (2019). Failure probability estimation of overhead transmission lines considering the spatial and temporal variation in severe weather. J. Mod. Power Syst. Clean. Energy 7, 131–138. doi:10.1007/s40565-017-0370-4
You, F., Chen, H., Zhang, L., and Zhu, J. (2011). Experimental study on flashover of high-voltage transmission lines induced by wood crib fire. Proc. Chin. Soc. Elect. Eng. 31 (34), 192–197. (in Chinese). doi:10.13334/j.0258-8013.pcsee.2011.34.021
Yu-Chien, C., Escofet-Martin, D., and Dunn-Rankin, D. (2019). Ion current and carbon monoxide release from an impinging methane/air coflow flame in an electric field. Combust. Flame 204, 250–259. doi:10.1016/j.combustflame.2019.03.022
Zake, M., and Barmina, I. (2001). “Electrical control of flame carbon and polluting emissions from fuel combustion,” in Proceedings of the International Scientific Colloquium, University Duisburg, September 3-5,2001, 198–203.
Zeng, M., Peng, L., Fan, Q., and Zhang, Y. (2016). Trans-regional electricity transmission in China: Status, issues and strategies. Renew. Sustain. Energy Rev. 66, 572–583. doi:10.1016/j.rser.2016.08.023
Zhao, Y., You, F., Xu, J., Fu, Z., and Chen, S. (2021). “Characteristics and mechanism of line-line gap breakdowns induced by wood crib fires,” in Proceedings of the 2021 IEEE 4th International Electrical and Energy Conference (CIEEC), Wuhan China, May 28-30 2021, 1–6. doi:10.1109/CIEEC50170.2021.9510211
Keywords: high voltage transmission line, wildfires, propane jet diffusion flame, breakdown voltage, average breakdown strength, leakage current
Citation: Chen S, You F, Xu J, Wang Z, Zhang Y, Zhao Y, Yang H and Jiang Z (2023) Mechanisms of air breakdowns for aluminum conductors steel reinforced wire-wire gaps induced by propane jet flames. Front. Earth Sci. 11:1117199. doi: 10.3389/feart.2023.1117199
Received: 06 December 2022; Accepted: 16 February 2023;
Published: 02 March 2023.
Edited by:
Faming Huang, Nanchang University, ChinaReviewed by:
Saurav Pramanik, Indian Institute of Technology Kharagpur, IndiaRuiyu Chen, Nanjing University of Science and Technology, China
Copyright © 2023 Chen, You, Xu, Wang, Zhang, Zhao, Yang and Jiang. This is an open-access article distributed under the terms of the Creative Commons Attribution License (CC BY). The use, distribution or reproduction in other forums is permitted, provided the original author(s) and the copyright owner(s) are credited and that the original publication in this journal is cited, in accordance with accepted academic practice. No use, distribution or reproduction is permitted which does not comply with these terms.
*Correspondence: Fei You, ZnlvdUBuanRlY2guZWR1LmNu