 Youcun Liu
 Shuyue Yang2
 Lihong Meng
 Tao Liu
 Mingyong Zhu
 David Labat
- 1School of Geography and Tourism & Guangdong Provincial Key Laboratory of Conservation and Precision Utilization of Characteristic Agricultural Resources in Mountainous Areas, Jiaying University, Meizhou, China
- 2School of Computer, Qinghai Minzu University, Xining, Qinghai Province, China
- 3School of Geography and Environmental Engineering, Gannan Normal University, Ganzhou, China
- 4UMR5563 Géosciences Environnement Toulouse (GET), Toulouse, Midi-Pyrénées, France
Water is the source of all life on Earth. Blue water and green water are important for water resource evaluation and are also essential for the efficient use of water resources. By constructing a SWAT model to simulate the spatiotemporal evolution of blue water and green water resources in the Meijiang River Basin from 2008 to 2018, this paper explored the spatiotemporal distribution characteristics of blue water and green water and evaluated the change trend of the green water coefficient. The results showed that: 1) the average amount of blue water resources per unit area in the Meijiang River Basin was 921 mm, accounting for 43% of the total water resources; the amount of green water resources was 1,232 mm, accounting for 57% of the total water resources. 2) blue water quantity and precipitation were highly positively correlated, and the overall change in green water quantity had been relatively stable. Water quantity of green also showed a positive correlation with precipitation within a certain range, while the green water coefficient and precipitation showed a highly negative correlation; 3) precipitation and other climatic conditions were the decisive factors affecting the amount of blue water resources in the basin, whereas the nature of the underlying surface, such as the vegetation or land use, altitude, and topography, was the main factor affecting the green water volume of the watershed.
1 Introduction
The spatial and temporal distribution of the quantity and quality of water resources directly affect the ecological security, economic development, and social stability of a region and the world as a whole, and water resources are the source of all life on Earth (Oki and Kanae, 2006; Liu et al., 2022). The Swedish hydrologist Falkenmark (Rockström and Falkenmark, 2000) first classified water resources as “blue water” and “green water” when evaluating their impact on agricultural production. Blue water includes surface runoff, mid-soil flow, and subsurface runoff and is generally found in rivers, lakes, and aquifers, whereas green water is water for normal plant growth during rainfall and includes green water flow and green water storage. Green water flow is the amount of water present in the atmosphere, and green water storage is the amount of water in the soil (Falkenmark and Rockström, 2006; Engdahl et al., 2013). The concept of blue water and green water closely integrates ecosystem and water cycle processes, reflecting the interaction between hydrological processes and vegetation. This concept has opened up new avenues for water resource evaluation and utilization, which has received wide research attention globally (Kaur et al., 2019; Xie et al., 2020; Li et al., 2022).
Currently, the assessment of blue and green water resources mianly uses hydrological model based on water balance equation (Senay et al., 2011; Enku et al., 2014; Xia et al., 2017; Hoekstra, 2019; Yang et al., 2022a). The commonly used hydrological models are the Astrophysics and Cosmology Research Unit (ACRU) model (Jewitt and Schulze, 1999) for agricultural catchment study units, the Stream model (Seyam et al., 2000), the Hydrological Simulation Program-Fortran (HSPF) model (Liu et al., 2021), and the Soil and Water Assessment Tool (SWAT) model (Pisinaras et al., 2013). Among them, the SWAT hydrological model is more cost-effective to simulate the amount of blue and green water resources, and the measured data are used to calibrate the results of the model, making it used more widely than some other models (Gassman et al., 2014; Jeyrani et al., 2021; Idrees et al., 2022). Cruise et al. (Cruise et al., 1999; Abbaspour et al., 2009) developed a SWAT model of the south eastern United States to analyze water resource conditions under global climate change. It was concluded that runoff in the region will continue to decline over the next 30–50 years, which will severely deteriorate the water quality. Schuol et al. (2008) developed a SWAT model for Africa and used measured data from more than 200 stations for calibration and validation, and assessed the spatial and temporal distribution of blue water flow and green water flow. Faramarzi et al. (2009) combined the SWAT model with the SUFI-2 model to simulate the amount of blue and green water resources at the monthly scale in Iran. The simulation results were calibrated and validated to assess the effects of enhancing wheat yield under different irrigation patterns. Pang et al. (2010) constructed a SWAT distributed hydrological model to simulate runoff in the Chaohe sub-basin of the Miyun Reservoir, and the results showed that the accuracy of SWAT simulated runoff was higher than that of sediments. Zhang and Jia (2013) constructed a SWAT hydrological model of the Huangshui Basin to analyze the spatial and temporal distribution patterns of blue and green water and the degree of change in blue and green water due to human activities over the past 20 years. The study showed a close relationship between green water flow and crop growth in agricultural land, providing basic information for the future rational allocation and effective use of blue and green water. Bal et al. (2021) used the SWAT model to test the impact of land use and land cover change on the runoff of the Budhabalanga River Basin in combination with the sources of catchment parameters driving from remote sensing and geography information system. The results showed that the SWAT model generally performed well in simulating runoff. Assessments of local blue and green water have also been carried out in the Lushi River Basin, the Sanjiang Plain Basin, and the Weihe River Basin (Zhen et al., 2010; Liu et al., 2014). The studies mentioned above provide a scientific and theoretical basis for the inclusive management and planning of water resources in the corresponding regions.
The Meijiang River Basin in Guangdong Province is a typical small mixed watershed in southeastern China, from which more than 3,000,000 people obtain water for their livelihoods (Chen et al., 2019). Since this basin is affected by both frontal rainfall and typhoon rainfall, the spatial distribution of annual precipitation is uneven, resulting in large differences in spatial distribution of water resources and small per capita occupancy, severe soil erosion and high sediment content in some areas. At the same time, the rivers and reservoirs in the lower reaches of the basin are silted up, which is likely to cause flooding and have a bad impact on ships and water conservancy projects. However, there are few studies on blue and green water resources in the Meijiang Basin. Therefore, accurately simulating the hydrological process of the Meijiang River Basin and discussing the temporal and spatial distribution characteristics of blue and green water resources can provide guidance for solving ecological and environmental problems in this river basin. This article simulates the hydrological process of the Meijiang River Basin by establishing a SWAT model, explores the suitability of the SWAT model in the evaluation of water resources in the Meijiang River Basin according to the model verification results, and analyzes the temporal and spatial distribution characteristics of blue-green water resources in the watershed and the impact of different land use types on it. Our research can provide a scientific basis for the rational use of water resources in the basin, the realization of sustainable development and other practical applications. At the same time, our research has reference value for solving water environment and ecological problems in the basin.
2 Study area and data source
2.1 Study area
The Meijiang River Basin is located in northeastern Guangdong Province (115°22′–116°33′E and 23°17′–25°16′N) and is the most important river in Meizhou. The total length of the Meijiang River is 307 km, with a catchment area of 14,061 km2, accounting for 88.3% of the total area of the water system of Meizhou City. The water level ratio of the riverbed is 0.59%. The length of the Meijiang River in Meizhou is 271 km, with a catchment area of 10,424 km2. The altitude of the basin is between 20 and 1311 m, with an average altitude of 666 m. Due to topographic factors, the precipitation in the Meijiang River Basin varies greatly in spatial distribution and annual distribution within a year. The flood season is from April to September (Feng and Hu, 2021), accounting for about 77.5% of the total annual rainfall and 80% of the average annual relative humidity. This research only studied part of the Meijiang River Basin within the city of Meizhou, as shown in Figure 1.
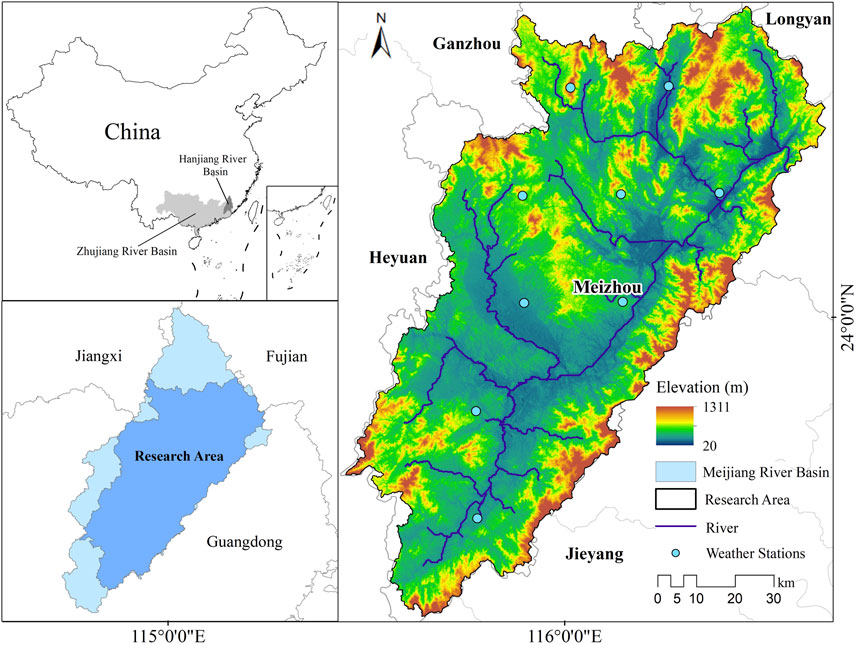
FIGURE 1. Location of the study area.
2.2 Data source
The raster datasets consisted of the Meijiang Basin Digital Elevation Model, the land use data, and the soil type map. The attribute data included soil attribute data, meteorological and hydrological data of the Meijiang River Basin. The Digital Elevation Model (DEM) and land use data collected in this study were obtained from the Chinese Academy of Sciences Geospatial Data Cloud (http://www.gscloud.cn/), both with a spatial resolution accuracy of 30 m. The elevation of Meijiang River basin was from ASTER GDEM V2 data. Based on land use characteristics in the Meijiang River Basin, the land use data were reclassified into four types. Soil data were reclassified into eight soil types from the Harmonized World Soil Database (HWSD) (http://westdc.westgis.ac.cn/), created jointly by the Food and Agriculture Organization of the United Nations (FAO), the International Soil Reference and Information Centre (ISRIC) of the Netherlands, and the International Institute for Applied Systems Analysis (IIASA) of Austria. The above spatial data were preprocessed to match the requirements (such as the same spatial resolution and projection) of SAWT model input. Data on daily precipitation, average wind speed, temperature, relative humidity, and solar radiation in the period of 2008–2018 from nine meteorological stations within the Meijiang River Basin were obtained from the National Meteorological Science Data Sharing Service Platform Network (http://data.cma.cn/). The hydrological station data were from the statistical yearbook of Guangdong Provincial Bureau of hydrology, which were utilized to determine and verify the model accuracy.
3 Methods
3.1 SWAT hydrology model
The SWAT model is a comprehensive hydrological model developed by Dr. Jeff Arnold (Yang et al., 2017; Chordia et al., 2022). It has a strong physical foundation (Rathjens et al., 2015), a distributed structure (Wang et al., 2008), and a continuous spatiotemporal model. This model can be applied to the simulation and evaluation of water pollution, hydrological runoff, sediment transport, water balance, and nutrient salt content in the basin, as well as for predicting the effects caused by various factors in the future. As one of the foundations of the SWAT model, the water balance equation can simulate the water cycle process between the atmosphere, surface, and underground. The calculation formula is as follows:
In the equation, SWt is the final water content of the soil; SW0 is the initial water content of the soil on day i; t is time (days); Rday,i is the precipitation on day i; Qsurf,i is the surface runoff on day i; Ei is the amount of evapotranspiration (ET) on day i; Wseep refers to the infiltration and bypass water flow at the bottom of the vertical section of the soil on day i; and Qgw,i is the amount of water flowing back and forth on day i.
3.2 SWAT-CUP and SUFI-2 algorithms
The study adopted the sequence uncertainty analysis method SUFI-2 provided by the calibration tool SWAT-CUP (SWAT calibration and uncertainty program) to calibrate and validate the SWAT model (Sao et al., 2020; Malik et al., 2022). SUFI-2 is a semi-automatic algorithm, by which the user can understand basin characteristics and manually adjust the range of each parameter, select multiple input parameter values in the input parameter range for simulation calculation, and compare them with the measured data to obtain the change range of the best simulation value. The parameter calibration results were evaluated by the following three indicators.
The coefficient of determination (R2) is a form of curve fitting between simulated data and observed data. The closer R2 is to 1, the better the linear relationship between the simulation result and the observation value, and the better the simulation result. On the contrary, the closer R2 is to 0, the poorer the result. The calculation formula is as follows:
The Nash-Sutcliffe efficiency coefficient (Ens) (Aouissi et al., 2016; Lin et al., 2017) uses the least-square method to fit the simulation results to obtain the deviation between the straight line and y = x. The closer the Ens value is to 1, the higher the reliability of the model results. On the contrary, a value closer to 0 indicates poorer model results. The calculation formula is as follows:
The Re error coefficient refers to the ratio of the absolute error caused by the measurement expressed as a percentage to the true value, indicating the deviation of the simulated value from the true value, expressed as a percentage. Its calculation formula is as follows:
in the equation,
3.3 Blue and green water calculation method
Based on the result of the SWAT model at the sub-basin scale and the concept of blue and green water, the blue water can be expressed by the sum of soil flow (LATQ), underground runoff (GWQ), and surface runoff (SURQ). Green water can be expressed by ET (Bogena et al., 2010; Bailey et al., 2022) and soil water content (SWC). Green water flow refers to ET and green water storage refers to SWC (Quinteiro et al., 2015; Yang et al., 2022b). Green water coefficient (GWC) refers to the proportion of green water resources in the entire water resource of a research basin (Xu, 2015). The calculation formula of blue water, green water, and green water coefficient is as follows (Zang et al., 2012):
In the equations, B is blue water (mm), WYLD is the amount of water produced by the sub-basin within a certain period (mm), and G is green water (mm), including green water flow and green water reserves.
The calculation formula of the relative change rate of water resources in different periods is as follows (Zang et al., 2012):
In the equation, F represents variables, including precipitation, blue water and green water flow, green water storage; i represents the specific value of the variable at stage i and o represents the specific value of the variable at the original stage.
4 Results and discussion
4.1 Calibration and verification of the SWAT model in the Meijiang River Basin
After established the spatial database and attribute database of the SWAT model in the Meijiang River Basin, the SWAT project was built and the data were loaded to divide the Meijiang River Basin into 33 sub-basins and 403 hydrological response units (HRUs). Through the sensitivity analysis method built in the model (Xu et al., 2009; Brouziyne et al., 2017), the monthly runoff data from 2010 to 2013 at the Hengshan Station in Dabu county were used to conduct sensitivity analysis on 22 parameters affecting the runoff simulation results in the Meijiang River Basin, from which CN2 (SCS runoff curve number), ALPHA_BF (base flow recession coefficient α factor), ESCO (soil evaporation compensation factor), CH_K2 (effective hydraulic conductivity of the river), SOL_K (saturation parameter factor), and another 10 parameters with high sensitivity. Then the parameters that significantly impact flow production were selected for optimal calibration. The calibrated parameters were then verified by the monthly runoff data from 2014 to 2018. The results showed that the model index R2 equalled 0.81, Ens equalled 0.73 and Re equalled 2.34% in the calibration period, while during the validation period, the R2 equalled 0.82, Ens equalled 0.77 and the Re equalled 1.52% (Figures 2, 3). This showed that the overall simulation accuracy of the model was high and that the model had good adaptability to the hydrological process of the Meijiang River Basin. Based on the results of the model, the spatial and temporal evolution rule of the blue water and green water resources in the basin could be analysed in depth.
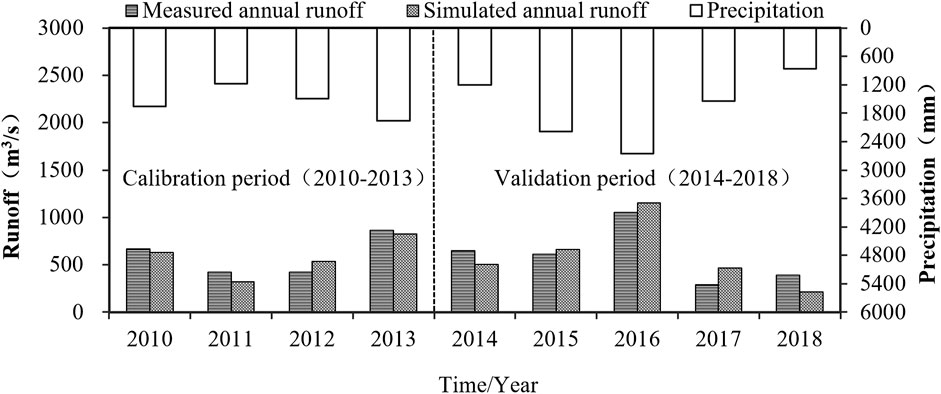
FIGURE 2. Comparison of observed and simulated runoff at annual scale during calibration and validation periods.
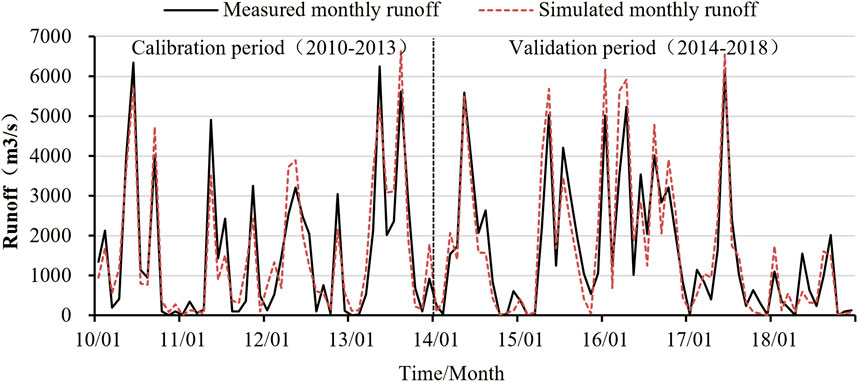
FIGURE 3. Comparison of observed and simulated runoff at monthly scale during calibration and validation periods.
4.2 Time series change trend of blue water and green water in the Meijiang River Basin
Figure 4 shows the time variation of blue water and green water resources in the Meijiang River Basin from 2008 to 2018. The results show that the average annual total water resources of the Meijiang River Basin were 2,153 mm, of which the blue water resources were 921 mm, accounting for 43% of the total water resources. The amount of green water resources was 1,232 mm, accounting for 57% of the total water resources, i.e., the green water coefficient was 57%. Among the green water resources, the green water flow was 671 mm, accounting for 54% of the total green water resources. The reserve of green water was 561 mm, accounting for 46% of the total green water resources. The main green water resources in the river basin were green water flows. It can be seen that the total amount of green water resources in the Meijiang River Basin was 1.34 times higher than the blue water resources, and the green water resources were mainly composed of green water flows. From 2008 to 2018, there was no significant change in green water resources in the Meijiang River Basin, while precipitation and blue water resources increased or decreased significantly, reaching their peak values in 2016 in nearly 11 years.
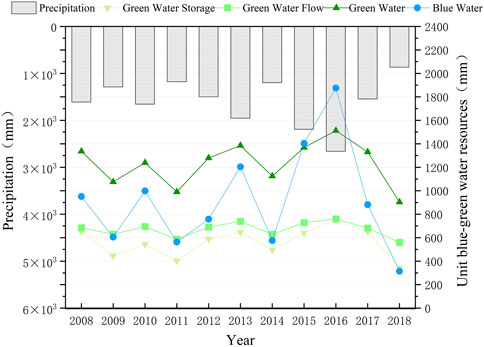
FIGURE 4. Blue and green water resources in the Meijiang River Basin from 2008 to 2018.
The amount of green water resources in the Meijiang River Basin was higher than the amount of blue water resources in the simulated year, which is similar to many other river basins. Green water resources are the main components of water resources in most watersheds of China. For example, the Lushi River Basin, located in the temperate mountainous climate zone on the right bank of the Yellow River, had a green water coefficient of 89% between 1991 and 1997 (Zhen et al., 2010). In fact, this strongly correlates with the climatic conditions of the research catchment. The climate of the Meijiang catchment belongs to a subtropical monsoon climate, with a long summer, short winter, and high precipitation, with the high precipitation occurring concurrently with high temperatures. Therefore, more precipitation is converted into actual evaporation, and the amount of green water in the catchment is more than the blue water resources.
As shown in Table 1, the average total amount of blue-green water in the growing season of the Meijiang River Basin is 1871.66 mm, indicating that the total amount of water resources in this region is relatively rich, of which blue water and green water resources account for 42% and 58% respectively. In each growing season (spring, summer, autumn), the amount of green water resources is significantly greater than the amount of blue water resources. The amount of water resources is the largest in summer, which is related to the large precipitation, high temperature and strong evaporation in summer. With global warming, a large amount of precipitation will be evaporated as the temperature rises and transformed into green water flow, making the Meijiang River Basin more green water resources than blue water resources. However, the reduction of blue water resources will inevitably exacerbate the contradiction between supply and demand of water resources and the deterioration of ecological environment.
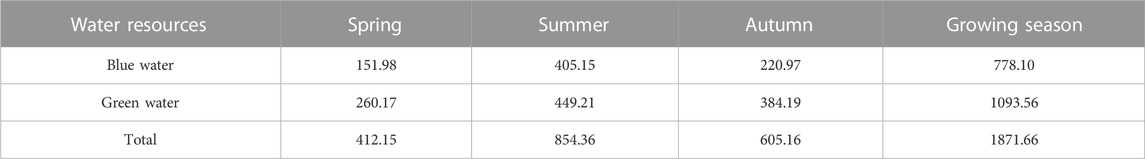
TABLE 1. Multi-year average blue and green water resources (mm) in the Meijiang River Basin during the growing season 2008–2018.
4.3 Spatial distribution and change pattern of blue and green water in the Meijiang River Basin
In this study, the Meijiang River Basin was studied in three periods (2008–2010, 2011–2014, 2015–2018) from 2008 to 2018 to explore the characteristics of the spatial distribution of water resources in the Meijiang Basin in different periods and the relative change rate (RCR) between each period (where I represents 2008–2010, II represents 2011–2014, and III represents 2015–2018).
As can be seen from Figure 5A, from the perspective of space, the precipitation in the three periods of the Meijiang River Basin was relatively greater in the north, being generally greater than 1,400 mm, and relatively lower in the middle and east, being generally less than 1,300 mm. The precipitation generally showed a decreasing trend from north to east. In terms of the RCR of precipitation, the annual average precipitation of the Meijiang River Basin from 2011 to 2014 significantly increased in southwest compared with 2008–2010 (II vs. I), while it significantly decreased in the north and south. Compared with 2011–2014 and 2015–2018 (III vs. II), the RCR of precipitation in the southern region was < −2%, showing a decreasing trend, while the RCR of precipitation in the central and northern region was >2%, showing an increasing trend. Compared with 2008–2010 (III vs. I), precipitation in the central region remained stable as a whole from 2015 to 2018, decreased significantly in the southern region, and increased significantly in the northern region. Precipitation in the catchment showed a spatial distribution pattern of being greater in the north and west and lower in the south and east. Precipitation in the northern region showed an increasing trend, with the final precipitation increasing significantly. In the south, there has been a decreasing trend, with the final precipitation being significantly reduced.
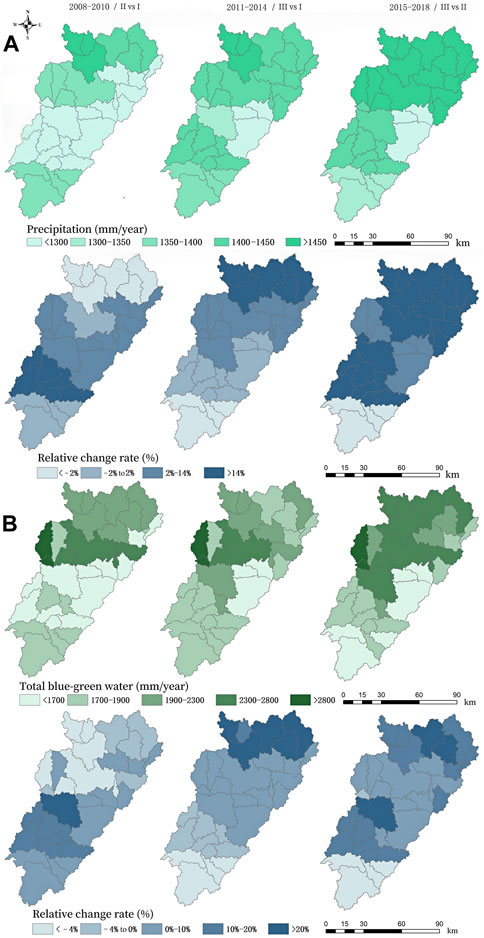
FIGURE 5. Spatial distribution of precipitation, total blue and green water, and relative rates of change in the Meijiang River Basin. (A) Precipitation and relative rates of change; (B) Total blue water and green water and relative rates of change.
From Figure 5B, the total amount of blue and green water in the Meijiang River Basin showed a general trend of decreasing spatially from the northwest to east, which is basically consistent with the change rule of decreasing precipitation in the Meijiang River Basin from north to east. Due to the spatial distribution differences in precipitation, the total amount of blue and green water in the Meijiang River Basin was greater in the north compared to the south and greater in the west and lower in the east. In terms of time (this study is based on the multi-year average per unit area), the total amount of blue water and green water resources in the Meijiang River Basin from 2008 to 2010 was the lowest, and the multi-year average of blue and green water in the Meijiang River Basin was 1983 mm. The total amount of blue and green water in the catchment is in the middle from 2011 to 2014, and the annual average value of blue water and green water in the catchment was 2029 mm. The largest amount of blue water and green water was detected from 2015 to 2018. The average annual value of blue water and green water in the watershed was 2,143 mm. In terms of the RCR, the total amount of blue water and green water in the middle and west of the basin increased by more than 10% in 2011–2014 compared with 2008–2010 (II vs. I), which is relevant to the change trend of blue water (Figure 4). Precipitation had a greater impact on blue water. An increase in precipitation resulted in an increase in the amount of blue water, thus resulting in a higher total amount of blue water and green water in the watershed. Compared with 2011–2014 (III vs. II), the RCR in the southwest and northeast of the river basin was more than 10% from 2015 to 2018, thereby exhibiting great change. Water resources in the southern region decreased with an RCR of < −4%. Overall, over the past 11 years (III vs. I), the blue and green water resources in the Meijiang River Basin have shown a growing trend, with an RCR of more than 10% in the north, 0%–10% in the middle, and −4% in the south.
The spatial and temporal variation of blue water resources in the Meijiang River Basin is shown in Figure 6. Spatially, the distribution of blue water resources generally coincides with that of precipitation, which also shows a decreasing trend from north to east, with more in the north and less in the south and more in the west and less in the east. This trend remained largely stable from 2011 to 2014 and from 2015 to 2018, with no significant abrupt changes. The minimum amount of blue water was observed in the east-central part of the basin at 467 mm (2008–2010), and the maximum was observed in the north-western part of the basin at 1,119 mm (2015–2018). In terms of RCRs, the amount of blue water in the northwestern part of the Meijiang Basin showed a trend of first decreasing (<−0.1%) and then increasing (>20%) from 2008 to 2018. By contrast, the blue water resources in the southern upstream region changed less (<−0.1%) due to the seasonal variation of decreasing precipitation from upstream to downstream. In addition to climate change, changes in land use types due to human activities also have an impact on surface runoff, which in turn affects blue water resources.
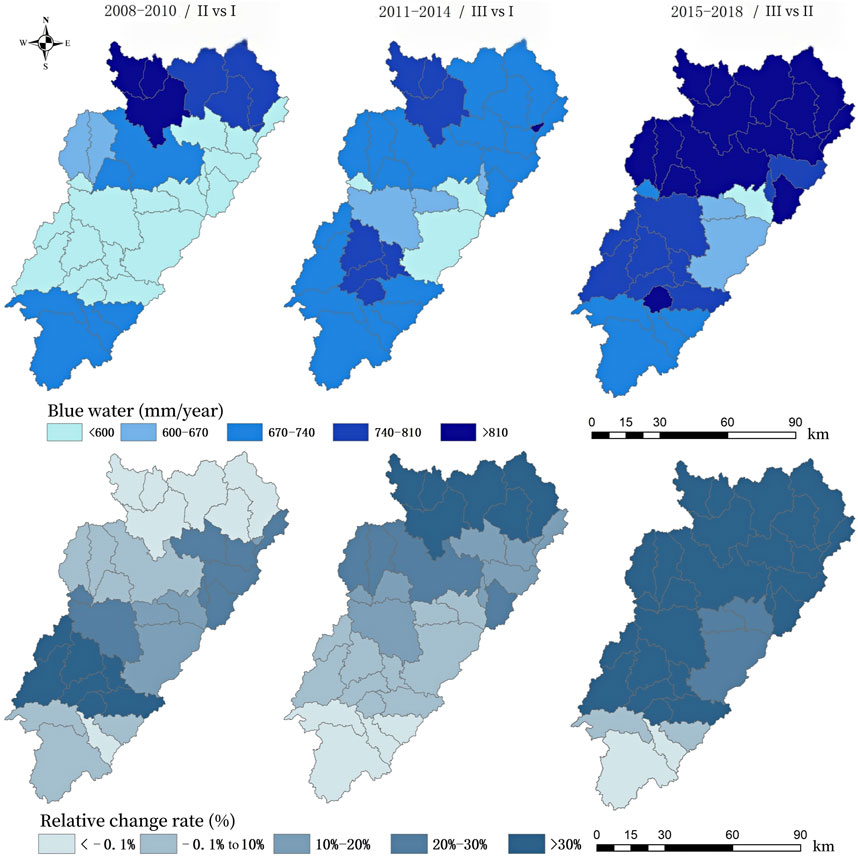
FIGURE 6. Spatial distribution of blue water volume and relative rate of change in the Meijiang River Basin.
From Figure 7A, spatially, in 2008–2010, the Meijiang River Basin showed an overall trend of more green water flow around the west and east and less in the south, which is related to the different vegetation types and land use types in the basin. The lower part of the basin (i.e., the Meijiang River) has the highest green water resources due to its large surface area, low elevation, higher temperatures, strong surface evaporation, and high potential green water flow. Green water flows tend to be abundant in the vast majority of the other areas due to the high woodland cover and strong vegetation ET in the Meijiang River Basin. In terms of RCRs, the Meijiang River Basin showed an overall decreasing trend in green water flow from 2008 to 2018, with a more pronounced decrease in the south and east (>−4%). This was mainly caused by less precipitation and more human activities in the basin, leading to a decrease in green water flow resources in the context of rapid urbanisation, reduced vegetation cover, and relatively low ET. More rainfall can indirectly contribute to the growth of green water flows, and vegetation type/land use may also contribute as a result of more human activity.
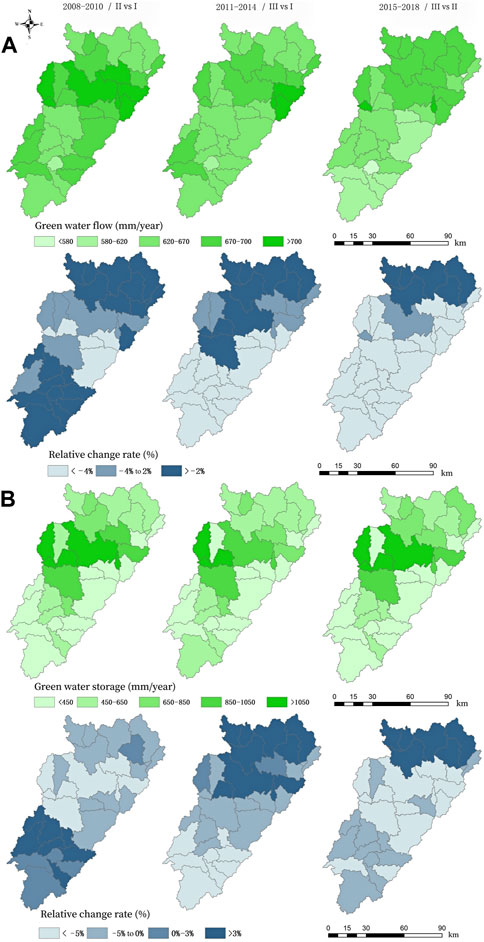
FIGURE 7. Spatial distribution of green water flow, green water storage and relative change rate in the Meijiang River Basin. (A) Green water flow and relative rates of change; (B) Green water storage and relative rates of change.
As can be seen from Figure 7B, most green water storage resources were in the range of 400–650 mm in the Meijiang River Basin from 2008 to 2018. Spatially, green water storage in all three periods showed the characteristic of being greater in the west and central-east and lower around the south, especially along the Meijiang River, where green water storage was the most abundant. This is closely related to the topography and geomorphology of the basin. The southern part of the Meijiang River Basin is surrounded by mountains and ridges as barriers, and although the vegetation cover is extensive, it is difficult to store more water than that absorbed by the roots of the vegetation for long due to the topography. In this context, water will eventually converge in the form of a loamy mid-stream to the middle and lower reaches, thus forming blue water, resulting in little green water storage. By contrast, the east-central part of the Meijiang River Basin is located in the lower part of the basin where the terrain is flat, and so, water flows are not easily dispersed. In terms of RCRs, 2011–2014 showed a significant decrease in green water storage in the northeastern part of the Meijiang Basin compared to 2008–2010, while the southwestern part showed an increasing trend. Compared to 2011–2014, the vast majority of the basin showed a decreasing trend in green water storage from 2015 to 2018, with only the northern region showing an increasing trend in green water storage.
4.4 Spatial variation distribution of the green water coefficient in the Meijiang River Basin
The green water coefficient of the Meijiang River Basin from 2008 to 2018 is shown in Figure 8. According to the above study, it is clear that the green water coefficient in the Meijiang River Basin is large, with a multi-year average green water coefficient of 57%, which is a major component of the water resources in the Meijiang River Basin. Spatially, the green water coefficient decreases from the centre to the north and south. Influenced by the Meijiang River, the green water coefficient is over 65%, and a few sub-basins reach 75% in the central part of the basin, while the green water coefficient in the southern and northern parts ranges between 60% and 65%, and the green water coefficient in the southern part of the upper reaches is the lowest, with a green water coefficient <60%. Figure 6 shows that the overall green water coefficient in the Meijiang Basin has not changed significantly and is relatively stable.
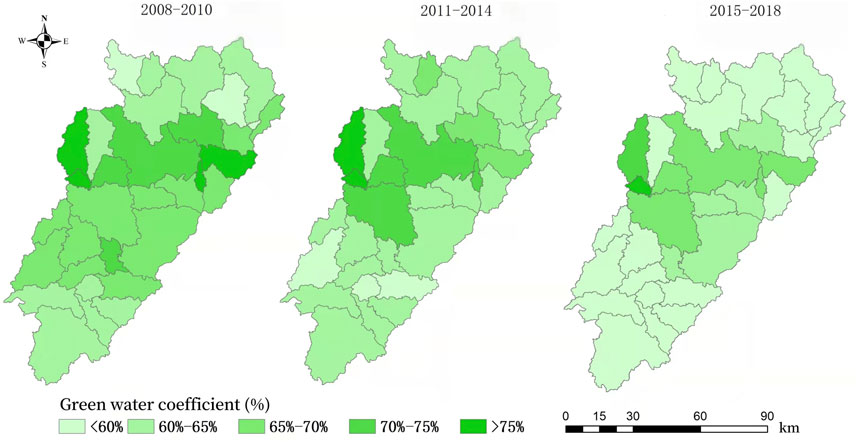
FIGURE 8. Spatial distribution of green water coefficient in the Meijiang River Basin.
Through correlation analysis, we found that the correlation coefficient between blue water resources and rainfall in the Meijiang River Basin is as high as 0.94, showing a highly positive correlation, indicating that precipitation has a greater impact on blue water. An increase in precipitation will lead to an increase in the amount of blue water, thereby increasing the total amount of blue water and green water in the basin. The correlation coefficient between green water resources and rainfall is 0.72, which also shows a weak positive correlation trend, and the overall change of green water is relatively stable. The green water coefficient has a significant negative correlation with rainfall, and the correlation coefficient is −0.81. Because the greater the precipitation, the greater the total amount of water resources, and the source of green water is mainly tree canopy interception, plant roots and soil storage, which will not increase indefinitely with the increase of precipitation. Therefore, the green water coefficient will decrease with the increase of rainfall after the green water resources reach saturation.
4.5 Changes in the amount of blue and green water resources under different land use types
Based on the collected land use data of the Meijiang River Basin for many years, we found that the change of land use type between different years is not obvious. Therefore, the land use data of 2018 were used to analyze the blue and green water in different land use from 2008 to 2018. It can be seen from Table 2 that the total land area of the study area is 112,059 km2, of which agriculture land (AGRC), urban (URBN), forest (FRST) and pasture (PAST) accounted for 19.9%, 2.2%, 65.7% and 12.2% to of the basin in 2018, respectively. By calculating the amount of blue and green water resources (mm) in each land use, the annual average water resources are shown in Figure 9. There are obvious differences in the amount of blue and green water resources under different land use, with AGRC being the largest, URBN being the smallest, and other land use in the middle. This shows that the influence of the underlying surface on hydrological processes and water resources is closely related to human activities. Although the area of agriculture land accounts for only 19.9% of the total area, compared with other land use, the contribution of agriculture land to the total amount of blue and green water in the Meijiang River Basin is the highest (blue water resources account for 44.9%, green water resources accounted for 48.5%). This is because agriculture land has a good aggregate structure, can quickly drain water, and has a strong water storage capacity, as well as irrigation also replenishes water. These indicates that agriculture land is extremely important to regional water resource allocation. Changes in the blue-green water resources of agriculture land also indirectly reflect the trend of irrigation demand and ecological service value of agriculture land. The proportion of blue water resources in urban is 6.3%, and the proportion of green water resources is 5.1%; the proportion of forest in blue water resources and green water resources is 28.9% and 27.2% respectively; the proportion of pasture blue water resources 20.0%, and green water resources accounted for 19.2%. According to the principle of water balance, when evapotranspiration increases, runoff will decrease. Forest and pasture have strong evapotranspiration capacity, which shows that forest and pasture can regulate runoff and effectively prevent soil erosion. Therefore, in the process of watershed management in the future, more stringent water and soil conservation measures should be taken to convert more rainfall into green water, which will be more conducive to the restoration of the ecosystem in the Meijiang River Basin.
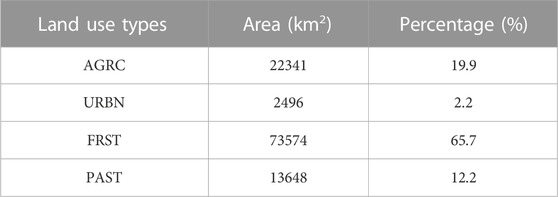
TABLE 2. Statistic result of the area and percentage of land use types in 2018.
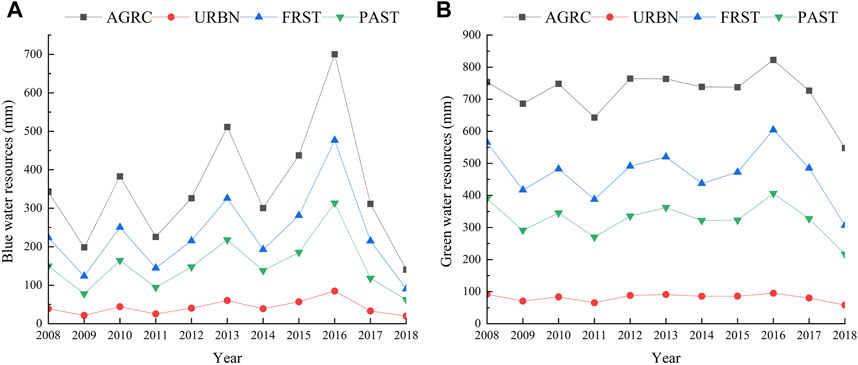
FIGURE 9. Average annual blue (A) and green (B) water resources under different land use from 2008 to 2018.
5 Discussion
Many studies have suggested that land use change and climate change significantly change the regional water cycle, thereby affecting allocation of water resource and water security from local to regional scales (Chen et al., 2015; Du et al., 2018; Veettil and Mishra, 2018; Liang et al., 2020; Zhang et al., 2020). Hence, it is essential for water resource management to make quantitative analysis of temporal and spatial changes in water resources and their components, and to discuss the impacts of climate and land use changes on it. Many researchers used SWAT and other hydrological models to study areas with similar conditions to ours. Consistent with our conclusions, in recent decades, many watersheds located in humid subtropical regions have also saw a decrease trend in blue water resources (Chen et al., 2015; Zhang et al., 2020) which are mainly affected by climate change, especially precipitation (Du et al., 2018; Veettil and Mishra, 2018; Zhang et al., 2020). However, there are some differences in changes of green water resources. For example, from studies of Zhang et al. (2020) on the upper reaches of the Ganjiang River adjacent to the Meijiang River Basin, green water resources are increasing in the area. In many cases, the change trend of green water resources varies greatly from different river basins, which is probably because green water resources are influenced by complex factors including the combined effect of climate change and land use change and are particularly sensitive to land use changes (Du et al., 2018; Veettil and Mishra, 2018; Liang et al., 2020; Jiang et al., 2021). We drew a similar conclusion from the analysis on the Meijiang River Basin.
It is worth noting that with the rapid development of urbanization and economy, water intake has increased significantly, while ecological water demand has decreased obviously. The blue and green water is increasingly scarce in many river basins, which has a negative impact on the sustainable development. Liang et al. (2020) suggested that the scarcity of green water resources is significantly affected by agricultural production and urbanization in Xiangjiang basin, which is located in a humid subtropical region and enjoyed a rapid economy growth. The Meijiang River Basin has urbanized rapidly in recent years, coupled with the uncertainty of global climate change and the increase in the frequency of extreme weather events. Thus, it is also worth attending the potential scarcity of blue water and green water resources in the basin. Future research should focus more on integrating human activities in the watershed to obtain scientific water resource assessment results, including land use change, urbanization and production activities with a greater impact on the water cycle. In this way, a better decision support can be provided for the sustainable development of the watershed.
There are also some uncertainties in the results of this study. Depending on the accuracy of the input data and model simulation to a large extent, the accuracy of the output results of this model is limited by factors such as model parameters and the difficulty of obtaining daily scale data. As a result, the model results inevitably deviate from the actual observation data. In future research, the research time span should be extended, and data from as many meteorological stations as possible should be obtained, so as to obtain more accurate SWAT model simulation results. In addition, in order to promote the sustainable development of the ecological environment, we must attach great importance to the role of green water in water management. We suggest applying comprehensive 3S technologies to change unreasonable agricultural production methods and optimize agricultural production structure to foster the conservation and protection of water resources.
6 Conclusion
Based on the results from the SWAT model for the Meijiang River basin, this paper analyzes the spatiotemporal evolution of blue and green water resources from 2008 to 2018. In accordance with the data from SWAT model shown in ArcGIS, this paper discussed the space-time distribution characteristics of blue water and green water, and the evaluated trend of green water coefficient. The main conclusions were as follows:
(1) The model was validated based on long series runoff data from the Hengshan hydrological station, with the model indexes R2 = 0.81, Ens = 0.73 and Re = 2.34% in the calibration period at the monthly scale and indexes R2 = 0.82, Ens = 0.77 and Re = 1.52% in the validation period. The overall simulation accuracy was high, indicating that the constructed SWAT model for the Meijiang River Basin was a good simulation and was applicable to the study of the Meijiang River Basin.
(2) During the period 2008–2018, the total multi-year average water resources per unit area of the Meijiang River Basin was 2,153 mm, with 921 mm of blue water resources and 1,232 mm of green water resources. The green water resources accounted for 57% of the total water resources, i.e., a green water coefficient of 57%. The Meijiang Basin has a major share of green water resources that is 1.37 times greater than blue water resources. This is closely related to the climatic conditions of the study basin, which has a subtropical monsoon climate with long summers and short winters. Accompanied by high temperatures, this abundant precipitation is typically converted into actual ET, and thus, the basin has more green water resources than blue water resources.
(3) In terms of spatial distribution, the total amount of blue and green water in the basin, the overall amount of blue water, and the spatial distribution of precipitation largely coincides, showing a decreasing trend from north to east, with more in the north and less in the south and more in the west. The overall variation of green water was relatively stable and showed a positive correlation with precipitation within a certain range, while the green water coefficient showed a highly negative correlation with precipitation. Precipitation and other climatic conditions were found to be the decisive factors dictating the amount of blue water in the basin, with vegetation or land use type, elevation topography, and other substrate properties being the main factors influencing the amount of green water in the basin.
Data availability statement
The datasets presented in this study can be found in online repositories. The names of the repository/repositories and accession number(s) can be found below: http://www.gscloud.cn.
Author contributions
Conceptualization, YL and TL; Methodology, YL; Software, SY; Validation, LM, SY, and TL; Formal analysis, LM; Investigation, SY; Resources, LM; Data curation, MZ; Writing—original draft preparation, YL and SY; Writing—review and editing, YL and LM; Visualization, XO and YX; Supervision, DL; Project administration, YL; Funding acqui-sition, YL and LM. All authors have read and agreed to the published version of the manuscript.
Funding
This research was funded by the Key Research Foundation of Education Department of Guangdong Province, China (2021ZDZX4046), the Natural Science Foundation of Guangdong Province, China (2022A1515012010), the Social Science Funds of Jiangxi Province (22GL26), the National Natural Science Foundation of China (41861002), the Ordinary University Characteristic Innovation Project of Guangdong Province, China (2020KTSCX140), and the Research ability improvement project of key construction disciplines in Guangdong Province, China (2021ZDJS073).
Conflict of interest
The authors declare that the research was conducted in the absence of any commercial or financial relationships that could be construed as a potential conflict of interest.
Publisher’s note
All claims expressed in this article are solely those of the authors and do not necessarily represent those of their affiliated organizations, or those of the publisher, the editors and the reviewers. Any product that may be evaluated in this article, or claim that may be made by its manufacturer, is not guaranteed or endorsed by the publisher.
References
Abbaspour, K. C., Faramarzi, M., Ghasemi, S. S., and Yang, H. (2009). Assessing the impact of climate change on water resources in Iran. Water Resour. Res. 45. doi:10.1029/2008wr007615
Aouissi, J., Benabdallah, S., Chabaane, Z. L., and Cudennec, C. (2016). Evaluation of potential evapotranspiration assessment methods for hydrological modelling with SWAT—application in data-scarce rural Tunisia. Agric. Water Manag. 174, 39–51. doi:10.1016/j.agwat.2016.03.004
Bailey, R. T., Bieger, K., Flores, L., and Tomer, M. (2022). Evaluating the contribution of subsurface drainage to watershed water yield using SWAT+ with groundwater modeling. Sci. Total Environ. 802, 149962. doi:10.1016/j.scitotenv.2021.149962
Bal, M., Dandpat, A. K., and Naik, B. (2021). Hydrological modeling with respect to impact of land-use and land-cover change on the runoff dynamics in Budhabalanga river basing using ArcGIS and SWAT model. Remote Sens. Appl. Soc. Environ. 23, 100527. doi:10.1016/j.rsase.2021.100527
Bogena, H. R., Herbst, M., Huisman, J. A., Rosenbaum, U., Weuthen, A., and Vereecken, H. (2010). Potential of wireless sensor networks for measuring soil water content variability. Vadose Zone J. 9, 1002–1013. doi:10.2136/vzj2009.0173
Brouziyne, Y., Abouabdillah, A., Bouabid, R., et al. (2017). SWAT manual calibration and parameters sensitivity analysis in a semi-arid watershed in North-western Morocco[J]. Arabian J. Geosciences 10 (19), 1–13.
Chen, C., Hagemann, S., and Liu, J. (2015). Assessment of impact of climate change on the blue and green water resources in large river basins in China. Environ. Earth Sci. 74 (8), 6381–6394. doi:10.1007/s12665-014-3782-8
Chen, Y., Zhang, Z., and Yang, C. (2019). Analysis of landscape pattern spatial scale in middle and upper reaches of Meijiang River Basin//Geoinformatics in sustainable ecosystem and society. Springer, Singap., 54–67.
Chordia, J., Panikkar, U. R., Srivastav, R., and Shaik, R. U. (2022). Uncertainties in prediction of streamflows using SWAT model—role of remote sensing and precipitation sources. Remote Sens. 14 (21), 5385. doi:10.3390/rs14215385
Cruise, J. F., Limaye, A. S., and Al-Abed, N. (1999). Assessment of impacts climate change on water quality in the southeastern United States. J. Am. Water Resour. Assoc. 35, 1539–1550. doi:10.1111/j.1752-1688.1999.tb04236.x
Du, L., Rajib, A., and Merwade, V. (2018). Large scale spatially explicit modeling of blue and green water dynamics in a temperate mid-latitude basin. J. Hydrology 562, 84–102. doi:10.1016/j.jhydrol.2018.02.071
Engdahl, N. B., Ginn, T. R., and Fogg, G. E. (2013). Using groundwater age distributions to estimate the effective parameters of fickian and non-fickian models of solute transport. Adv. Water Resour. 54, 11–21. doi:10.1016/j.advwatres.2012.12.008
Enku, T., Tadesse, A., Yilak, D., Gessesse, A. A., Addisie, M. B., Abate, M., et al. (2014). Biohydrology of low flows in the humid Ethiopian highlands: The Gilgel Abay catchment. Biologia 69, 1502–1509. doi:10.2478/s11756-014-0462-9
Falkenmark, M., and Rockström, J. (2006). The new blue and green water paradigm: Breaking new ground for water resources planning and management. J. water Resour. Plan. Manag. 132 (3), 129–132. doi:10.1061/(asce)0733-9496(2006)132:3(129)
Faramarzi, M., Abbaspour, K. C., Schulin, R., and Yang, H. (2009). Modelling blue and green water resources availability in Iran. Hydrol. Process 23, 486–501. doi:10.1002/hyp.7160
Feng, Y. Y., and Hu, M. C. (2021). Study on the spatial and temporal distribution characteristics of extreme hydrological events in the Han River basin. Northwest Hydropower 3, 1–9.
Gassman, P. W., Sadeghi, A. M., and Srinivasan, R. (2014). Applications of the SWAT model special section: Overview and insights. J. Environ. Qual. 43, 1–8. doi:10.2134/jeq2013.11.0466
Hoekstra, A. Y. (2019). Green-blue water accounting in a soil water balance. Adv. Water Resour. 129, 112–117. doi:10.1016/j.advwatres.2019.05.012
Idrees, M., Ahmad, S., Khan, M. W., Dahri, Z. H., Ahmad, K., Azmat, M., et al. (2022). Estimation of water balance for anticipated land use in the potohar plateau of the indus basin using SWAT. Remote Sens. 14 (21), 5421. doi:10.3390/rs14215421
Jewitt, G. P., and Schulze, R. E. (1999). Verification of the ACRU model for forest hydrology. Water 25, 483–489.
Jeyrani, F., Morid, S., and Srinivasan, R. (2021). Assessing basin blue–green available water components under different management and climate scenarios using SWAT. Agric. Water Manag. 256, 107074. doi:10.1016/j.agwat.2021.107074
Jiang, J., Lyu, L., Han, Y., and Sun, C. (2021). Effect of climate variability on green and blue water resources in a temperate monsoon watershed, northeastern China. Sustainability 13 (4), 2193. doi:10.3390/su13042193
Kaur, B., Shrestha, N. K., Daggupati, P., Rudra, R. P., Goel, P. K., Shukla, R., et al. (2019). Water security assessment of the grand river watershed in Southwestern Ontario, Canada. Sustainability 11 (7), 1883. doi:10.3390/su11071883
Li, W., Yang, X., Ren, L., Lin, Q., Zhou, X., and Gu, Y. (2022). Interactive influence of climate variability and land-use change on blue and green water resources: A case study from the Ganjiang River Basin, China. J. Water Clim. Change 13 (1), 158–174. doi:10.2166/wcc.2021.268
Liang, J., Liu, Q., Zhang, H., Li, X., Qian, Z., Lei, M., et al. (2020). Interactive effects of climate variability and human activities on blue and green water scarcity in rapidly developing watershed. J. Clean. Prod. 265, 121834. doi:10.1016/j.jclepro.2020.121834
Lin, F., Chen, X., and Yao, H. (2017). Evaluating the use of Nash-Sutcliffe efficiency coefficient in goodness-of-fit measures for daily runoff simulation with SWAT. J. Hydrologic Eng. 22, 05017023. doi:10.1061/(asce)he.1943-5584.0001580
Liu, G. H., Luan, Z. Q., and Yan, B. X. (2014). Runoff simulation of swampy rivers in the Sanjiang Plain based on SWAT model. Hydrology 34, 46–51.
Liu, H. Y., Liu, Y. C., Meng, L. H., Jiao, K. Q., Zhu, M. Y., Chen, Y. K., et al. (2022). Research progress of entropy weight method in water resources and water environment assessment. J. Glaciol. Geocryol. 44 (1), 299–306.
Liu, Y. C., Zou, J. P., Yin, X. L., Meng, L. H., Chen, M., Zeng, J. F., et al. (2021). Review on HSPF model in watershed hydrology and water environment research. J. Glaciol. Geocryol. 43, 225–232.
Malik, M. A., Dar, A. Q., and Jain, M. K. (2022). Modelling streamflow using the SWAT model and multi-site calibration utilizing SUFI-2 of SWAT-CUP model for high altitude catchments, NW Himalaya's. Model. Earth Syst. Environ. 8, 1203–1213. doi:10.1007/s40808-021-01145-0
Oki, T., and Kanae, S. (2006). Global hydrological cycles and world water resources. Science 313, 1068–1072. doi:10.1126/science.1128845
Pang, J. P., Liu, C. M., and Xu, Z. X. (2010). Effects of land use changes on streamflow and sand production in Miyun Reservoir watershed. J. Beijing Normal Univ. Nat. Sci. Ed. 46, 290–299.
Pisinaras, V., Petalas, C., Tsihrintzis, V. A., and Karatzas, G. P. (2013). Integrated modeling as a decision-aiding tool for groundwater management in a Mediterranean agricultural watershed. Hydrol. Process 27, 1973–1987. doi:10.1002/hyp.9331
Quinteiro, P., Dias, A. C., Silva, M., Ridoutt, B. G., and Arroja, L. (2015). A contribution to the environmental impact assessment of green water flows. J. Clean. Prod. 93, 318–329. doi:10.1016/j.jclepro.2015.01.022
Rathjens, H., Oppelt, N., Bosch, D., Arnold, J. G., and Volk, M. (2015). Development of a grid-based version of the SWAT landscape model. Hydrol. Process. 29, 900–914. doi:10.1002/hyp.10197
Rockström, J., and Falkenmark, M. (2000). Semiarid crop production from a hydrological perspective: Gap between potential and actual yields. Crit. Rev. Plant Sci. 19 (4), 319–346. doi:10.1080/07352680091139259
Sao, D., Kato, T., Tu, L. H., Thouk, P., Fitriyah, A., and Oeurng, C. (2020). Evaluation of different objective functions used in the SUFI-2 calibration process of SWAT-CUP on water balance analysis: A case study of the pursat River Basin, Cambodia. Cambodia. Water. 12, 2901. doi:10.3390/w12102901
Schuol, Jürgen, Abbaspour, K. C., Yang, H., Srinivasan, R., and Zehnder, A. J. B. (2008). Modeling blue and green water availability in Africa. Water Resour. Res. 44. doi:10.1029/2007wr006609
Senay, G. B., Leake, S., Nagler, P. L., Artan, G., Dickinson, J., Cordova, J. T., et al. (2011). Estimating basin scale evapotranspiration (ET) by water balance and remote sensing methods. Hydrol. Process. 25, 4037–4049. doi:10.1002/hyp.8379
Seyam, I., Savenije, H. H. G., Aerts, J., and Schepel, M. (2000). Algorithms for water resources distribution in international river basins. Phys. Chem. Earth 25, 309–314. doi:10.1016/s1464-1909(00)00020-4
Veettil, A. V., and Mishra, A. K. (2018). Potential influence of climate and anthropogenic variables on water security using blue and green water scarcity, Falkenmark index, and freshwater provision indicator. J. Environ. Manag. 228, 346–362. doi:10.1016/j.jenvman.2018.09.012
Wang, Z. G., Zhu, X. J., and Xia, J. (2008). Construction of a distributed SWAT model for the haihe River Basin. Adv. Geogr. Sci. 27, 1–6.
Xia, L., Song, X. Y., Fu, N., Li, H., and Li, Y. (2017). Study on the response of green water to land use and climate change in the loess plateau gully area: The case of nanxiaohegou watershed. J. Water Resour. 48, 678–688.
Xie, P., Zhuo, L., Yang, X., Huang, H., Gao, X., and Wu, P. (2020). Spatial-temporal variations in blue and green water resources, water footprints and water scarcities in a large river basin: A case for the Yellow River basin. J. Hydrology 590, 125222. doi:10.1016/j.jhydrol.2020.125222
Xu, J. X. (2015). Changes in the green water coefficient in the middle reaches of the Yellow River and its ecological significance. J. Ecol. 35, 7298–7307.
Xu, Z. X., Zhao, F. F., and Li, J. Y. (2009). Response of streamflow to climate change in the headwater catchment of the Yellow River Basin. Quat. Int. 208, 62–75. doi:10.1016/j.quaint.2008.09.001
Yang, H., Ni, F. Q., and Deng, Y. (2022). Spatial and temporal variability of blue and green water resources in the Jialing River basin based on the SWAT model. J. Water Resour. Water Eng. 33, 18–26.
Yang, L., Feng, Q., Yin, Z., Wen, X., Si, J., et al. (2017). Identifying separate impacts of climate and land use/cover change on hydrological processes in upper stream of Heihe River, Northwest China. Hydrol. Process. 31 (5), 1100–1112. doi:10.1002/hyp.11098
Yang, L., Feng, Q., Zhu, M., Wang, L., Alizadeh, M. R., Adamowski, J. F., et al. (2022). Variation in actual evapotranspiration and its ties to climate change and vegetation dynamics in northwest China. J. Hydrology 607, 127533. doi:10.1016/j.jhydrol.2022.127533
Zang, C. F., Liu, J., Van Der Velde, M., and Kraxner, F. (2012). Assessment of spatial and temporal patterns of green and blue water flows under natural conditions in inland river basins in Northwest China. Hydrology Earth Syst. Sci. 16, 2859–2870. doi:10.5194/hess-16-2859-2012
Zhang, J., and Jia, S. F. (2013). Study on difference of blue-green water in Huangshui basin and green water under different types of land use based on SWAT model. J. Water Resour. Water Eng. 24, 7–11.
Zhang, Y., Tang, C., Ye, A., Zheng, T., Nie, X., Tu, A., et al. (2020). Impacts of climate and land-use change on blue and green water: A case study of the upper Ganjiang River Basin, China. Water 12 (10), 2661. doi:10.3390/w12102661
Keywords: blue water resource, green water flow, green water storage, SWAT model, spatio-temporal evolution, Meijiang River Basin
Citation: Liu Y, Yang S, Meng L, Liu T, Zhu M, Ou X, Xiong Y and Labat D (2023) How did blue and green water resource evolute spatially and temporally in the Meijiang River Basin, China?. Front. Earth Sci. 11:1130520. doi: 10.3389/feart.2023.1130520
Received: 23 December 2022; Accepted: 30 January 2023;
Published: 10 February 2023.
Edited by:
Aref Shokri, Jundishapur Research Institute, IranReviewed by:
Zhixiang Lu, Northwest Institute of Eco-Environment and Resources (CAS), ChinaLinshan Yang, Northwest Institute of Eco-Environment and Resources (CAS), China
Zhenliang Yin, Northwest Institute of Eco-Environment and Resources (CAS), China
Jun Wu, Harbin Engineering University, China
Copyright © 2023 Liu, Yang, Meng, Liu, Zhu, Ou, Xiong and Labat. This is an open-access article distributed under the terms of the Creative Commons Attribution License (CC BY). The use, distribution or reproduction in other forums is permitted, provided the original author(s) and the copyright owner(s) are credited and that the original publication in this journal is cited, in accordance with accepted academic practice. No use, distribution or reproduction is permitted which does not comply with these terms.
*Correspondence: Lihong Meng, bWxoODE1OEAxNjMuY29t; Tao Liu, dGFvamxyQG91dGxvb2suY29t