 Yudong Cui
 Bailu Teng
 Wanjing Luo1*
 Yingfang Zhou
- 1School of Energy Resources, China University of Geosciences, Beijing, China
- 2Center of Oil and Natural Gas Resource Exploration, China Geological Survey, Beijing, China
- 3National Engineering Research Center of Gas Hydrate Exploration and Development, Guangzhou, China
- 4Guangzhou Marine Geological Survey, Guangzhou, China
- 5School of Engineering, University of Aberdeen, Aberdeen, United Kingdom
Studies of the hydrate cores have shown that natural fractures can be frequently observed in hydrate reservoirs, resulting in a fracture-filled hydrate. Therefore, it is highly necessary for industries to predict the gas well productivity of fracture-filled hydrate reservoirs. In this work, an embedded discrete fracture model is applied to characterize the natural fractures of fracture-filled gas-hydrate reservoirs. The non-linear mass and energy conservation equations which are discretized with the finite-difference method are solved by the fully implicit approach, and the proposed model is justified by a commercial simulator. On the basis of the proposed model, we investigate the influences of natural fractures, fracture conductivity, and hydrate dissociation rate on the gas well productivity and the distributions of pressure, temperature, and hydrate saturation. The simulation results show that hydraulic and natural fractures exert significant impacts on the gas well productivity of the fracture-filled hydrate reservoirs, and the cumulative gas production is increased by 45.6% due to the existence of the connected natural fractures. The connected natural fractures can impose a more important influence on the gas well productivity than the unconnected natural fractures. The cumulative gas production is increased by 6.48% as Nnf is increased from 2 to 50, whereas the increase is 43.38% as Nf_con is increased from 0 to 4. In addition, A higher hydraulic fracture conductivity can be more favorable than a higher natural fracture conductivity for improving the gas well productivity, and a higher hydrate dissociation rate can lead to a lower temperature along fractures due to a more noticeable reduction of solid hydrate. This study provides a theoretical basis for developing fracture-filled hydrate reservoirs efficiently in the future.
1 Introduction
Natural gas hydrate (NGH) is formed from gas and water under particular pressure and temperature (Sloan et al., 2007), and 150–180 m3 of gas can be approximately released from one volume of NGH at standard conditions (Carroll, 2020). At present, four different classes of gas hydrate reservoirs have been found in nature (Moridis, 2003; Moridis, 2004; Moridis et al., 2005). Class 1–2 hydrate reservoirs are composed of the overburden layer, gas hydrate layer, gaseous hydrocarbon or water layer, and under burden layer. Class 3 hydrate reservoir distinguishes from Classes 1 and 2 hydrate reservoirs due to the absence of the underlying mobile fluid layer. Class 4 hydrate reservoir is characterized by a low hydrate saturation (<10%) and disperse hydrate distribution (Moridis, 2003; Moridis, 2004; Moridis et al., 2005). Abundant natural gas hydrate resources have been observed in ocean margins and permafrost regions, and the estimated global technically recoverable gas hydrate is approximately 1015–1018 m3 (Carroll, 2020; Li et al., 2021b). At present, the depressurization method has been widely applied for developing gas hydrate (Liu et al., 2017). Numerous studies have been conducted to evaluate the potential of developing hydrate reservoirs ascribing to the fact that gas hydrates are known as one of the most promising clean energies (Boswell et al., 2012).
Developing gas hydrate is complicated which involves multiphase flow (gas-water) and hydrate phase transition. Moreover, thermal convection and hydrate decomposition occur during the development of gas-hydrate which can significantly affect temperature distribution and gas well productivity. Therefore, a comprehensive insight into the effect of hydrate phase transition on multi-phase mass and heat transfer of gas-hydrate reservoirs is one of the key issues for optimizing hydrate development. The kinetic model proposed by Kim et al. (1987) was widely used to calculate the hydrate decomposition rate caused by depressurization. In their model, the hydrate decomposition rate is related to hydrate surface area, gas fugacity, and temperature; Pooladi-Darvish and Hong. (2004)compared the effect of thermal conduction and thermal convection on the productivity of gas hydrate wells. Their simulation results showed that thermal conduction has a more significant influence in affecting heat transfer than thermal convection; Sun et al. (2005); Esmaeilzadeh et al. (2008) both established a numerical model considering the one-dimensional fluid flow to evaluate gas well productivity in developing gas-hydrate reservoirs by depressurization method, and the results of their studies showed fluid enthalpy and heat transfer coefficient are the most sensitive parameters in developing gas hydrate. Moridis, (2003), Moridis, (2004), Moridis et al. (2005). developed a new numerical submodule named Tough+Hydtate to study the mass and heat transfer of different types of hydrate reservoirs excluding Class 4. They claimed that Class 1 and Class 2 hydrate reservoirs hold significant promise as potential energy sources. Tonnet and Herri (2009) investigated the gas production and dissociation kinetics of hydrate using experimental and numerical methods. Their studies demonstrated that the mass transfers of gas and water impose a remarkable influence on hydrate decomposition for low permeability gas hydrate reservoirs. Zhao et al. (2014) developed a two-dimensional numerical model to analyze the effects of sensible heat transfer on gas well productivity of hydrate reservoirs. The calculated results of their works showed that the hydrate will dissociate rapidly at a high value of thermal conductivity in the early developing stage.
In all the aforementioned studies, the gas-hydrate reservoirs are assumed as a mono-porous media where the gas hydrate can only be observed in the pore space. However, the most recent studies show that natural fractures commonly exist in gas-hydrate reservoirs (Wang et al., 2011; Wang et al., 2019; Ning et al., 2020). Since natural fractures can significantly influence the gas well productivity of hydrate reservoirs, it is highly necessary for industries to develop a mathematical model to predict the gas well performance of the fracture-filled gas hydrate reservoirs considering the effect of natural fractures.
As one of the most applicable and economical method, numerical simulation has been widely used for evaluating the effect of the complex natural fracture network on gas well productivity. However, in terms of capturing the geometries of natural fractures, the traditional numerical simulator requires applying the local grid refinement (LGR) technique or unstructured grids, which can be inconvenient. In order to overcome the deficiencies of the traditional numerical methods, the embedded discrete fracture model (EDFM) method has been introduced to describe complex fractures (Lee et al., 2001). Compared to the methods of LGR and unstructured grids, the EDFM method characterizes the complex natural fractures with unrefined and structured grids. In recent studies, numerous EDFMs have been proposed to investigate the mechanism of mass and heat transfer in various naturally fractured reservoirs.
AlTwaijri et al., 2018 explicitly modeled complex fracture geometries by use of the EDFM method, and their simulation results confirmed that the complexity of the fracture network imposes a considerable influence in estimating gas and water recoveries. Li et al. (2021) combined an extended finite element method (XFEM) and EDFM to model the geothermal systems. The simulation results justified the application of EDFM for modeling fluid mass and heat transfer. Sangnimnuan et al., 2021 upgraded their numerical model by considering the geomechanics effects to model water-oil two-phase flow based on the EDFM. The calculated results indicated that the stress distribution and mass transfer are mainly affected by hydraulic fracture geometries; Shi, (2021) combined the EDFM method with the boundary element method (BEM) to investigate the temperature change considering water-oil two-phase flow. Their calculated results showed that it is highly necessary to consider the temperature field effect on developing fractured geothermal system.
Although the EDFM was used widely to characterize the natural fracture in conventional oil/gas reservoirs, it has not been hitherto applied in gas-hydrate reservoirs to predict the gas well performance (Yan et al., 2016; Yan et al., 2018; Xu et al., 2017; Xu et al., 2018; Xu et al., 2021; Xu et al., 2022). For the scenarios of gas-hydrate reservoirs, multiphase flow, heat transfer, and hydrate dissociation all raise stringent barriers for one to build the EDFM model to evaluate the gas well productivity of the gas-hydrate reservoirs. Therefore, in this work, taking the effect of the natural fractures into consideration, we develop an EDFM model to characterize the gas well performance of the fracture-filled hydrate reservoirs. This proposed model is validated against a commercial simulator. Furthermore, with the aid of the proposed model, we analyze the influences of the complex fracture network, fracture conductivity, number of connected natural fractures, and hydrate dissociation rate on the gas well productivity and the distributions of pressure, temperature, and hydrate saturation.
2 Methodology
2.1 Model assumptions
This study considers a fractured vertical well in a two-dimension (2D) naturally fractured gas hydrate reservoir. In order to consider heat transfer and to characterize the complex fractures, we make the following assumptions to simulate gas-water flow in hydrate reservoirs.
(1) hydrate is treated as an immobile solid phase;
(2) the compressibility of rock and fluids are considered to characterize porosity change;
(3) the reservoir is homogeneous and the flow of water and gas conforms to Darcy’s law;
(4) the capillary pressure is neglected in the model;
(5) the effects of hydrate saturation changes, hydrate occurrence state, and pore structure on the relative permeability of gas and water are neglected;
(6) only thermal conduction and thermal convection in the reservoir are considered, and the influence of thermal radiation is neglected.
2.2 Mass conservation equations
For the matrix system, the mass conservation equation of the gas and water can be expressed as (Hong and Pooladi-Darvish, 2003):
For the intersecting fracture system, the mass conservation equation of the gas and water can be expressed as:
where νl is volumetric flow rates, which can be expressed as:
For hydrate, the mass conservation equations of the matrix and fracture systems are (Hong and Pooladi-Darvish, 2003):
In Eqs 1–4, subscript l represents gas or water; subscript h represents hydrate; the superscripts m and f represent the matrix and the fracture, respectively; k represents absolute permeability; krl represents fluid relative permeability; P represents pressure; μl represents viscosity; ρl represents density; ml represents the mass accumulation of gas and water due to hydrate dissociation; mh represents the mass of hydrate dissociation; Vv represent void pore volume; Sl represents gas and water saturation; Sh represents hydrate saturation; ql,mf represents volumetric flow rates between matrix and fracture; ql,ff represents volumetric flow rates between fracture and fracture; ql,w represents volumetric flow rates between fracture and well.
For the EDFM method, unrefined and structured grids are generally used to characterize complex natural fractures, and the finite difference method can be used as the numerical method to discretize mass conservation equations (Yan et al., 2014). For the right-hand-side of Eqs 1, 2, we can have the following discrete form:
where cs represents rock compossibility coefficient; cl represents fluid compossibility coefficient.
The discrete form of fluid flow between matrix grids in Eq. 1 can be written as:
Likewise, the discrete form of fluid flow between fracture grids in Eq. 2 can be written as:
The discrete form of mass transfer between matrix grid and fracture grid in Eqs 1, 2 can be written as:
The discrete form of mass transfer between intersecting fracture grids in Eq. 2 can be written as:
The discrete form of mass transfer between the wellbore and fracture grid in Eq. 2 can be written as:
In Eq. 10, rw is the wellbore radius, and re is the equivalent wellbore radius which can be calculated with the Peaceman formulation (Peaceman, 1978), and the details for calculating ml in Eqs 1, 2 can be found in Supplementary Appendix SA.
In Eqs 6–9, the terms Tm, Tf, Tmf, and Tff represent the transmissibility factors between different connections of matrix and fracture grids. Figure 1 presents the schematics of different connections of matrix and fracture grids. Three different types of non-neighbor connections (NNCs) in addition to the connections between neighboring matrix grids can be found in Figure 1, including 1) type #1 NNC, the connections between the embedded fracture segments and matrix grids; 2) type #2 NNC: the connections between neighboring fracture segments of a single fracture; and 3) type #3 NNC: the connections between intersected fractures segments. For the fluid flow between matrix grids, taking x-direction as an example, the transmissibility factor between neighboring matrix grid i and j can be written as:
where
In Eq. 12, the km represents matrix grid permeability; ∆x represents x-direction matrix grid size; ∆y represents y-direction matrix grid size; ∆z represents z-direction matrix grid size.
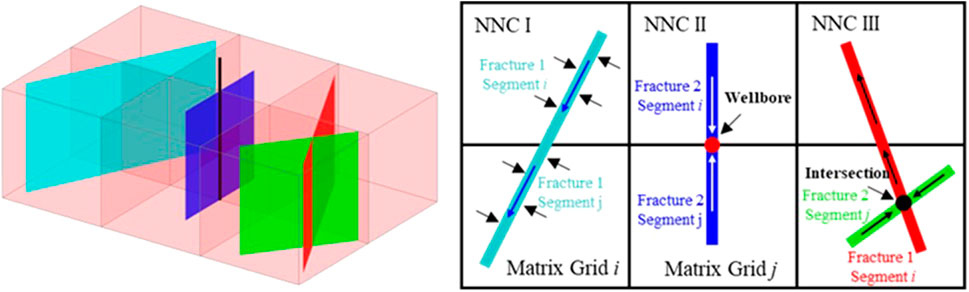
FIGURE 1. Schematic of the EDFM model for fractured hydrate reservoirs.
For type #1 NNC, the matrix-fracture transmissibility factor can be expressed as (Lee et al., 2001):
In Eq. 13, the Af is the area of the cross section between matrix grid and fracture segment, and dfm is the average normal distance between the embedded fracture segment and matrix grid. For type #2 NNC, the transmissibility factor of fluid flow between neighboring fracture segments of a single fracture is calculated as (Lee et al., 2001):
In Eq. 14, the kfi is permeability of ith fracture segment; ∆lfi, ∆hi, and wi represent the length, height, and width of ith fracture segment, respectively. For type #3 NNC, the transmissibility factor of fluid flow between segment i of fracture 1 and segment j of fracture 2 can be expressed as (Lee et al., 2001):
In Eq. 15, dseg is the distance from the fracture segment to the intersection.
The residual mass conservation equations in terms of the finite difference method can be expressed as (Song and Liang, 2009):
For the hydrate, we can have:
2.3 Energy conservation equations
For the matrix system, the energy conservation equation can be expressed as (Hong and Pooladi-Darvish, 2003):
In addition, the energy conservation equation for the fracture system is:
In Eqs 18–21, Um and Uf represent internal energy of matrix and fracture system; Umf represents energy exchange between matrix and fracture system; Uff represents energy exchange between different fractures; Ufw represents energy exchange between fracture and well; Udiss represents heat absorbed by hydrate decomposition; Ul represents internal energy of gas and water; Uh represents internal energy of hydrate; Ur represents internal energy of rock; Hl represents enthalpy of gas and water; T represents temperature; λeff represents effective thermal conductivity; Vr represents rock volume.
The effective thermal conductivity λeff and enthalpy of the water and gas Hl are given as follows (Hong and Pooladi-Darvish, 2003; Esmaeilzadeh et al., 2008):
In Eqs 22, 23, ϕv represents void porosity; Sw, Sg, and Sh represent water, gas, and hydrate saturation respectively; λw, λg, and λh represent water, gas, and hydrate thermal conductivity respectively; Tref represents reference temperature; Cpl represents fluid heat capacity.
The internal energy Ul is accumulated energy which neglects the mechanical work of a fluid phase. For gas and water, the relationship between Ul and Hl is (Esmaeilzadeh et al., 2008),
In Eq. 24, Pl is phase pressure and ρl is density. Energy exchange Umf between jth matrix and the ith fracture can be expressed as (Shi, 2021):
In Eq. 25, CI is the connectivity index between the matrix and fractures (CI = Af/dfm); λmf is the average thermal conductivity between the matrix and the fractures.
Energy exchange Uff between ith segments of fracture 1 and the jth segments of fracture 2 can be expressed as (Shi, 2021):
In Eq. 26, λff is the average thermal conductivity between different fractures; TIff is the transmissivity factor between different fractures which can be expressed as (Shi, 2021):
Energy exchange Ufw between well and the ith fracture can be expressed as:
In general, the discrete form for the energy conservation equation of matrix and fracture grids can be expressed as (Song and Liang, 2009):
For Eqs 16, 17, 29, values of krl, μl, ρl, and Hl are taken from the phase upstream region and can be solved with a fully implicit coupling (see Supplementary Appendix SB).
3 Model validation
In order to examine the accuracy of the proposed model, we validate the proposed model against a commercial simulator CMG STARS. As the pressure is decreased in the reservoirs, the gas and water can be gradually released from the hydrate. To illustrate the fluid flow of different phases, we utilize the Brooks-Corey equation (Brooks, 1964) to characterize the relative permeability of water and gas which is expressed as:
In this work, krw,max=0.9, krg,max=0.7, Swc=0.2, Sgc=0.05, nw=ng=2. The other benchmark values of the parameters used in the simulation are listed in Table 1.
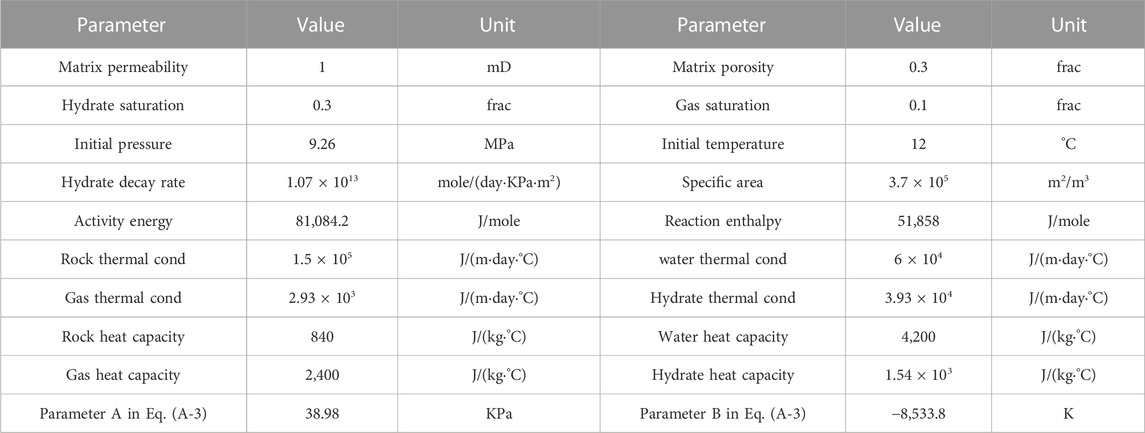
TABLE 1. Benchmark values of the parameters used for validation.
3.1 Hydrate reservoir with single fracture
In this case, we established a 155×155×30 m3 hydrate reservoir with a single fracture to conduct the validation. Figure 2 gives a top view of the global grid system used to simulate the production of the established model. As shown in Figure 2, the local grid refinement (LGR) was used to simulate the hydraulic fracture. The reservoir domain is discretized into 31 × 31 = 961 matrix grids in the EDFM model. The bottom-hole pressure (BHP) of the fractured vertical gas well which locates at the center of the hydrate reservoir is set to be a constant value of 5 MPa. The fracture length is 35 m, and the fracture conductivity, which is 1,000 mD∙m, used in CMG STARS is consistent to that used in the EDFM model.
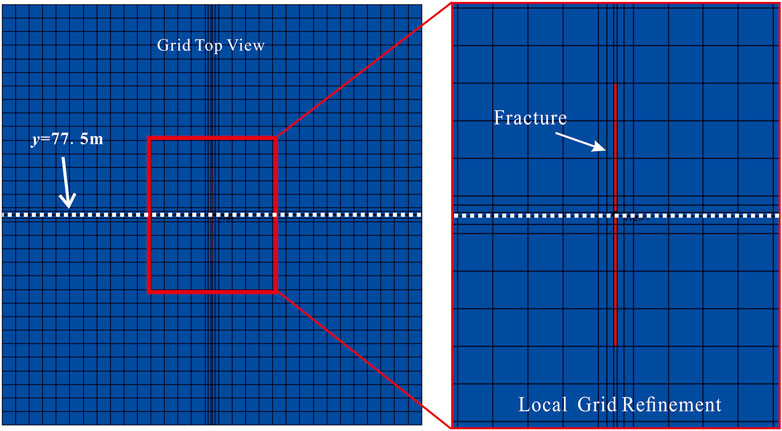
FIGURE 2. Top view of the grid system used in CMG STARS.
Figure 3 compares the calculated results from the proposed EDFM model to those from CMG STARS. Figures 3A,B illustrate the gas production rates and water production rates, respectively. Figure 3C shows the temperature distribution along the x-direction at y=77.5 m (see the dotted white line in Figure 3) on the 1800th production day. Figure 3D presents the average temperature of the global reservoir model. Figures 3E,F compare the pressure and temperature distribution between LGR and EDFM at 60-day production respectively. As one can see from Figure 3, the results of the proposed model agree well with the results of CMG STARS.
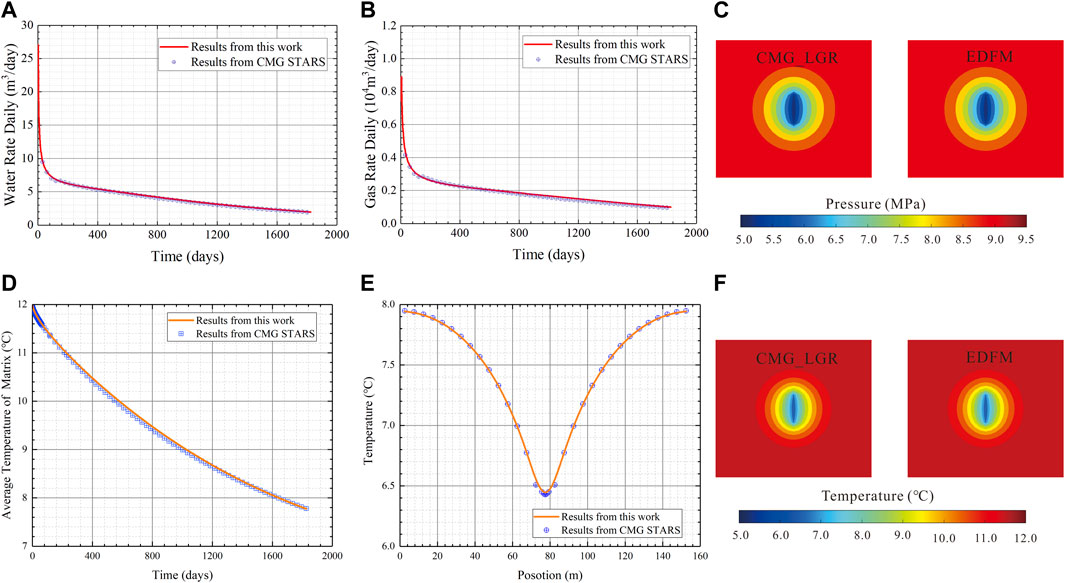
FIGURE 3. Validation of the single fracture model: (A) daily gas rate; (B) daily water rate; (C) matrix average temperature; (D) temperature distribution along the x-direction at y=77.5 m; (E) pressure distribution of LGR and EDFM solutions; (F) temperature distribution of LGR and EDFM solutions.
3.2 Hydrate reservoir with complex fracture network
In addition to the single fracture case, the validation was conducted on a complex fracture network model (see Figure 4). As shown in Figure 4, there are 10 natural fractures as well as a hydraulic fracture in the hydrate reservoir model. The conductivity of the natural fractures used both in CMG and EDFM is 1,000 mD∙m.
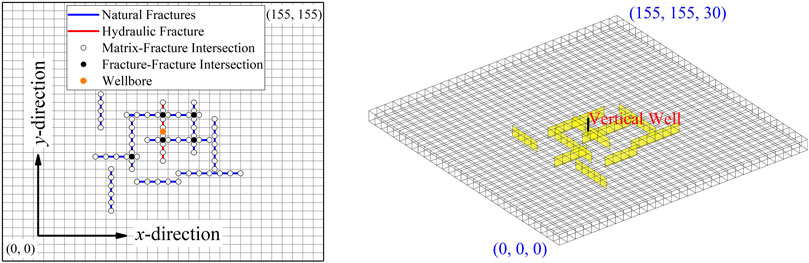
FIGURE 4. Schematic diagram of complex fracture network model used for validation.
Figure 5 compares the results obtained from EDFM against the results from CMG STARS, including gas production rate (Figure 5A), water production rate (Figure 5B), temperature distribution at y=77.5 m on the 1800th production day (Figure 5C), and the average temperature of the global reservoir model (Figure 5D). In addition, Figure 5e∼5F shows a comparison between LGR and EDFM on pressure and temperature distribution at 60-day production respectively. As shown in Figure 5, the results of the proposed model show slight differences from the results of CMG STARS.
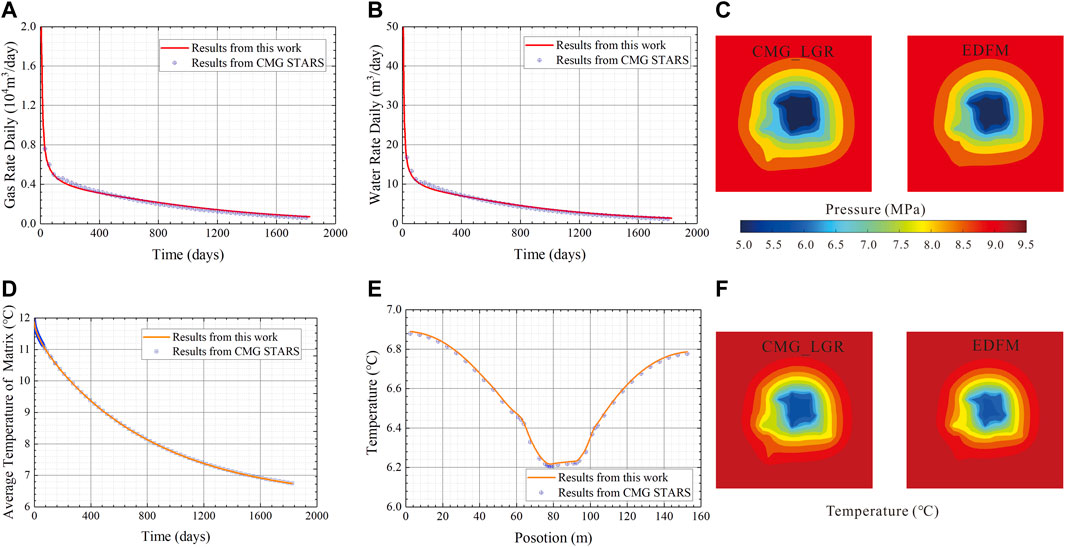
FIGURE 5. Validation of complex fracture model: (A) daily gas rate; (B) daily water rate; (C) matrix average temperature; (D) temperature distribution along the x-direction at y=77.5 m; (E) pressure distribution of LGR and EDFM solutions; (F) temperature distribution of LGR and EDFM solutions.
Based on the results shown in Figure 3 and Figure 5, one can find that the proposed EDFM model is reliable in simulating the production of gas-hydrate reservoirs considering complex fracture networks and heat transfer. Thus, in this work, the authors will carry out a comprehensive study of the well production of fracture-filled hydrate reservoirs on the basis of this proposed EDFM model.
4 Results and discussion
With the aid of the proposed EDFM model, the authors studied the effects of natural fractures and heat transfer on the production of gas-hydrate reservoirs. The dimension of the reservoir is 310 × 310 × 30 m3 which is discretized into 31 × 31 × 1 grids. The values of the other reservoir and fluid parameters are the same as those in Table 1.
4.1 Effect of complex fracture network
In order to explore the effect of fracture networks on the performance of gas-hydrate production well, three scenarios were investigated: Scenario #1 which considers 30 natural fractures and 1 hydraulic fracture; Scenario #2 which only considers 1 hydraulic fracture; and Scenario #3 which contains no fracture. Figure 6 shows the top view of three scenarios in this section. It is worth noting that, there are 2 natural fractures (green line in Figure 6A) connected with hydraulic fracture (red line in Figure 6A) for scenario#1. The hydraulic fracture length is 50 m, and the conductivity is 1,000 mD∙m for natural fractures and 2000 mD∙m for hydraulic fracture. The BHP is set to be a constant of 5 MPa.
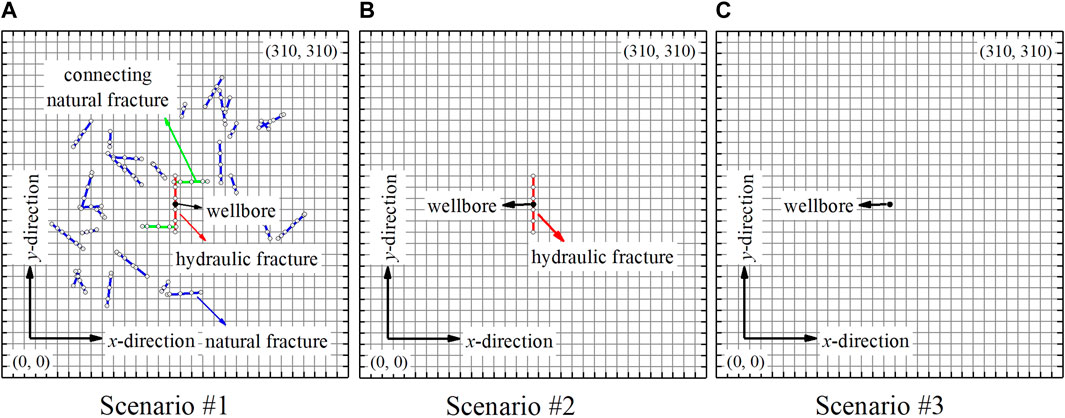
FIGURE 6. Schematics of the different scenarios to investigate the effect of fracture networks: (A) scenario with natural fractures and hydraulic fracture; (B) scenario with hydraulic fracture; (C) scenario without natural fractures and hydraulic.
Figure 7A compares the gas production rates of the three scenarios. In Figure 7A, one can find that the daily gas production rate (qg) and cumulative gas production (Qg) with natural and hydraulic fractures (scenario #1) are both higher than those only with one hydraulic fracture (scenario #2) and those without fractures (scenario #3). Comparing the cumulative production of scenario #2 to that of scenario #3, one can find that the hydraulic fracturing treatment can significantly improve gas well productivity. In addition, the existence of the natural fracture increases the cumulative production from 4.39 × 10⁶ m3 (scenario #2) to 6.39 × 10⁶ m3 (scenario #1). This indicates that both hydraulic fracture and natural fractures play important roles in influencing the performance of gas-hydrate wells.
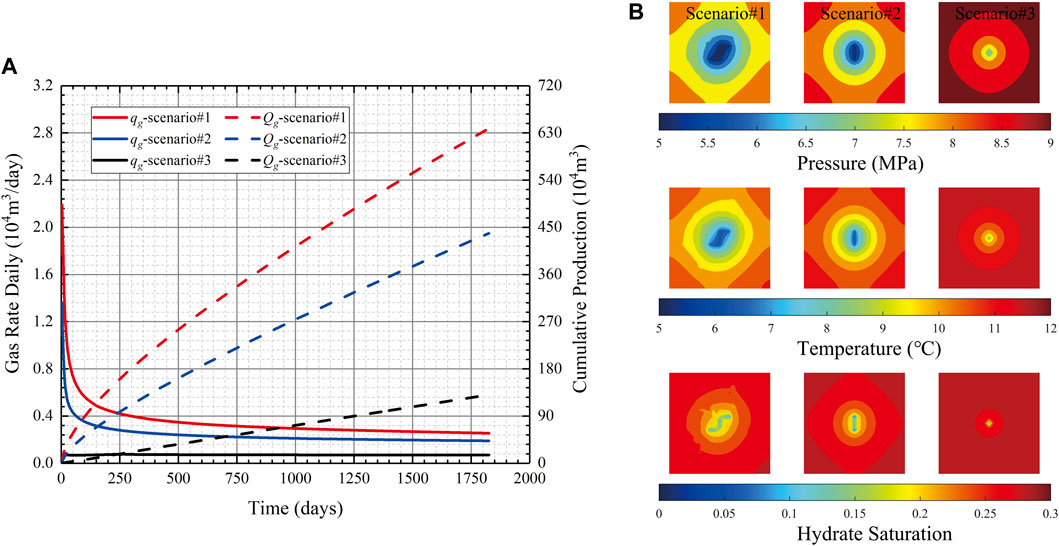
FIGURE 7. Simulation outputs of different scenarios: (A) Comparison of the production rates (B) pressure, temperature, and hydrate saturation field maps at the 1800th production day.
Figure 7B shows simulation results of different scenarios at the end of the simulation. As shown in pressure map, a higher pressure drop can be observed along the hydraulic fracture and along the connected natural fractures (see scenario#1). This implies that natural fractures can noticeably increase the expanding speed of the drainage area of the production well due to its connection to hydraulic fractures, thus, leading to the highest well productivity among the three studied scenarios. Besides, a heterogeneous distribution can be observed in temperature field maps affected by natural and hydraulic fractures. The low-temperature zone gradually spreads over time along the fractures for the scenario with natural and hydraulic fractures (scenarios #1 and #2) while it gradually spreads along the radial direction for the scenario without fractures (scenario #3). In addition, the existence of natural and hydraulic fractures increases the hydrate dissociation rate. The maximum hydrate dissociation rate occurs near the hydraulic fracture, connected natural fractures, and the position of the wellbore.
4.2 Effect of number of natural fractures
In this section, different numbers of natural fractures (Nnf =2, 10, 30, and 50) and different numbers of connected natural fractures (Nf_con=0, 1, 2, 4) were examined to explore their influence on pressure and temperature distribution. As shown in Figure 8A, 0, 8, 28, and 48 natural fractures (blue lines in Figure 8A) are randomly generated in the hydrate reservoir, respectively. In addition to the randomly generated fractures, in all four cases, two natural fractures are deliberately generated to intersect with the hydraulic fracture. In addition, we further investigated the well productivity with different numbers of connected natural fractures (Nf_con) to explore the effect of connected natural fractures on gas well productivity. The connected natural fractures indicate a natural fracture that is connected to the hydraulic fracture. As shown in Figure 8B, in the four studied reservoir models, the distribution and number of the randomly generated unconnected natural fracture (blue lines) remain unchanged through the four studied cases, whereas the number of the connected natural fracture (green lines) is increased from 0 to 4.
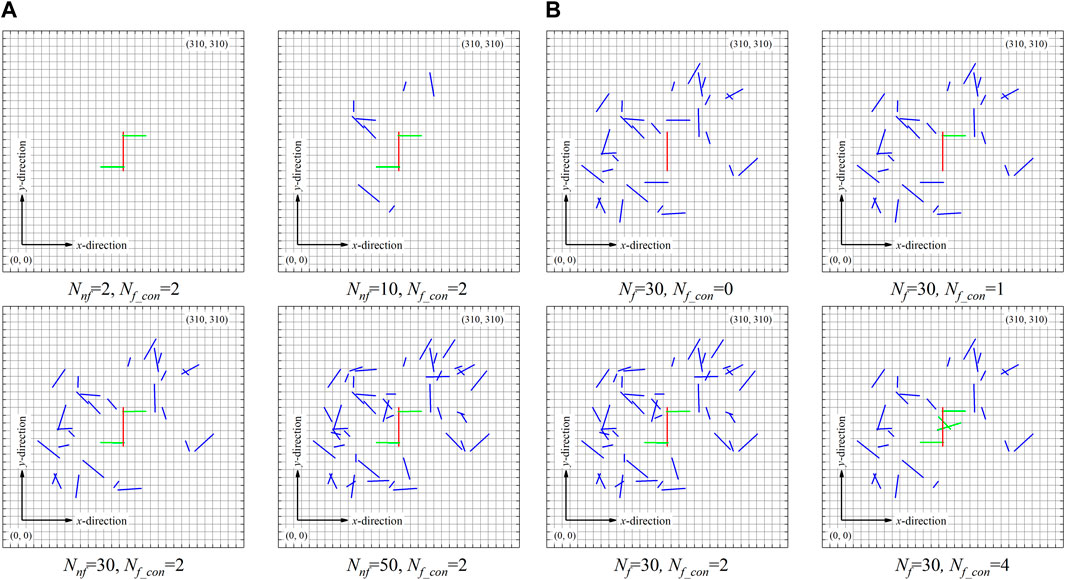
FIGURE 8. Schematics of the different scenarios to investigate the effect of the number of natural fractures: (A) different values of Nnf with constant value of Nf_con (B) constant value of Nnf with different values of Nf_con.
Table 2 summarizes the cumulative gas production of the different scenarios. As we can see in Table 2, the cumulative gas production rates are slightly increased as the Nnf is varied from 10 to 50. For example, the cumulative gas production is increased by 6.48% as Nnf is increased from 2 to 50. However, the cumulative gas production rate is significantly increased as the value of Nf_con is increased. In addition, the well productivity is more likely to be improved with less connected natural fractures. For example, the cumulative gas production is increased by 95.76 × 10⁴ m3 as Nf_con is increased from 0 to 1, whereas the increase is only 16.84 × 10⁴ m3 as Nf_con is increased from 2 to 4.
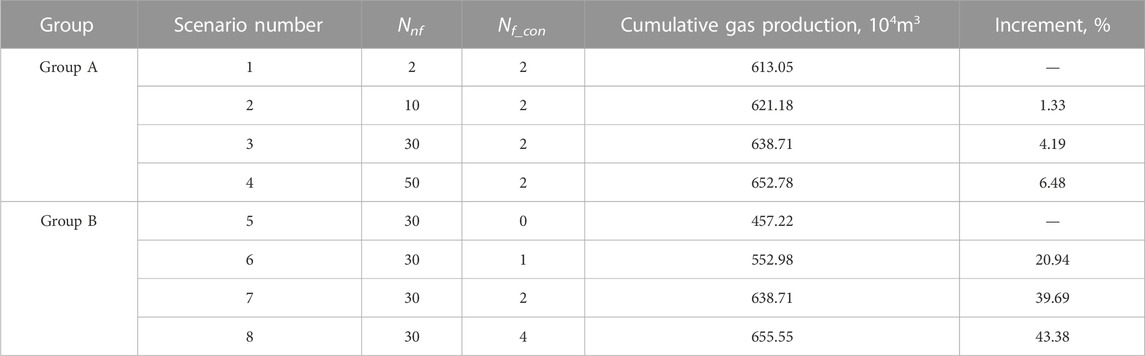
TABLE 2. Comparison of cumulative gas production of different scenarios with different values of Nnf and Nf_con.
A comparison of pressure, temperature, and hydrate saturation after 1800 days of production with different values of Nnf and Nf_con is shown in Figure 9. It can be observed in Figure 9A that, although the natural fractures are increased from 2 to 50, the pressure, temperature, and hydrate saturation fields illustrate a negligible difference. This denotes that the natural fractures, which are not connected to the hydraulic fracture, exert a small influence on the productivity of the gas-hydrate well. In Figure 9B, one can find that the connected natural fractures can induce remarkable expansions of the drainage area. The expansion can be more significant as Nf_con is increased from 0 to 1 than that as Nf_con is increased from 2 to 4. The results in Table 2 and Figure 9 imply that the connected natural fractures improve the well productivity by increasing the drainage areas of the production well. The calculated results represent that the connected natural fractures can exert a more important influence on the well productivity than the unconnected natural fractures.
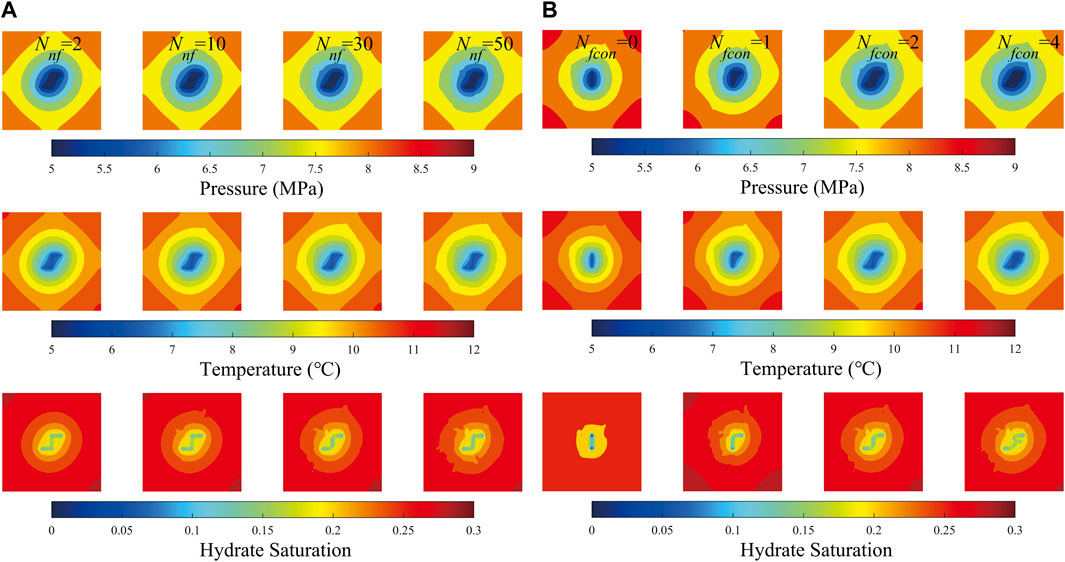
FIGURE 9. Pressure, temperature, and hydrate saturation field maps of different scenarios at the 1800th production day: (A) different values of Nnf with constant value of Nf_con (B) constant value of Nnf with different values of Nf_con.
4.3 Effect of fracture conductivity
In this section, the authors discussed the impacts of dimensionless hydraulic fracture conductivity (CfD) on the productivity of a fractured vertical gas well. The dimensionless hydraulic fracture conductivity can be described as (Cinco et al., 1978):
In Eq. 32, kf and km is hydraulic fracture permeability and matrix permeability, respectively; xf and wf is hydraulic fracture half length and width, respectively.
Figure 10A displays the gas production rates of a fractured vertical well that is calculated with the proposed numerical model with different dimensionless hydraulic fracture conductivity. As we can see from Figure 10A, A larger dimensionless fracture conductivity leads to higher well productivity, which is attributed to a lower flow resistance in the fracture. One also can find that the qg and Qg express a slight difference if the dimensionless fracture conductivity exceeds 100. This is because the fracture can be regarded as infinite-conductive if the dimensionless fracture conductivity exceeds 100, and the flow resistance in the fracture can be ignored.
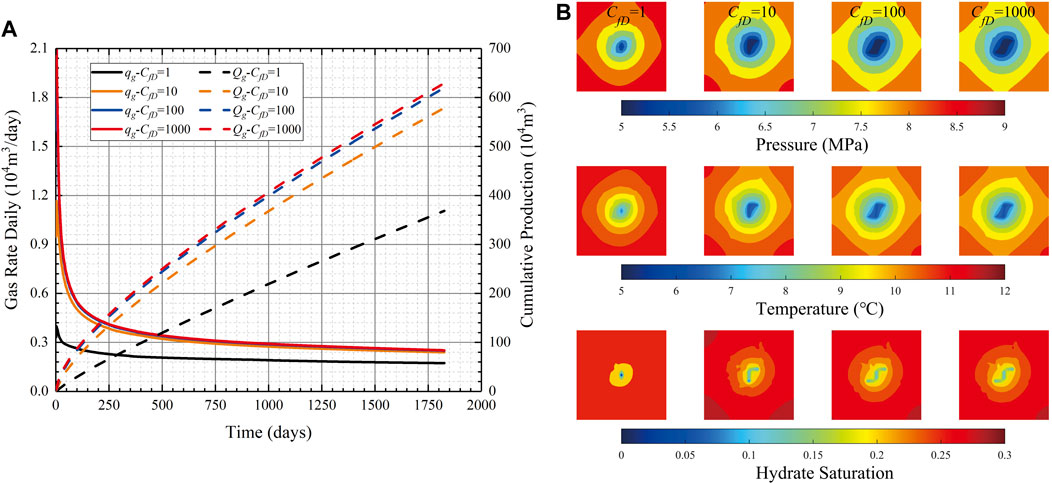
FIGURE 10. Simulation outputs of different scenarios with different values of hydraulic fracture conductivity: (A) Comparison of the production rates (B) pressure, temperature, and hydrate saturation field maps at the 1800th production day.
Figure 10B compares the field maps at the end of the 1800th day with different values of CfD. As we can see from pressure maps in Figure 10B, the maximum pressure drop occurs at the center of the gas hydrate reservoir. As the fracture conductivity is increased, the expanding speed of the drainage area becomes higher (e.g., the yellow area of CfD = 100 is larger than that of CfD = 1 at the end of the 1800th day in pressure field maps). In addition, for a higher conductivity fracture, the temperature drops more rapidly near the fractures (see temperature field maps). This is attributed to the fact that the temperature is mainly influenced by thermal convection and solid-hydrate dissociation. Since the gas and water dissociated from solid hydrate is more readily to be produced through the fracture with a higher conductivity, more solid hydrate will be dissociated near the fracture. The solid-hydrate dissociation is endothermic which can result in a reduction of temperature. In hydrate saturation field maps, one can find that the hydrate saturation near the fracture is lower with higher fracture conductivity, which indicates that more solid-hydrate is dissociated near the fracture.
Moreover, the authors varied the conductivity of natural fractures together with the conductivity of the hydraulic fracture to compare their effects on well productivity. Table 3 summarizes the cumulative gas production for different hydraulic fracture conductivity and different natural fracture conductivity at the end of the simulation. In Table 3, both the natural fracture conductivity and the hydraulic fracture conductivity are varied from 25 mD∙m to 250 mD∙m. The calculated results show that the cumulative gas production is increased both as the hydraulic fracture conductivity and the natural fracture conductivity are increased. Besides, hydraulic fracture conductivity exerts a more significant influence on gas well productivity than natural fracture conductivity. For example, the maximum increase of the cumulative gas production that is induced by varying the natural fracture conductivity occurs with Chf = 250 mD∙m, and the relative increase is 15.14% which is from 506.07 × 10⁴ m3 with Cnf=25 mD∙m to 582.69 × 10⁴ m3 with Cnf=250 mD∙m. However, with Cnf = 250 mD∙m, the relative increase of the cumulative production by varying the hydraulic fracture conductivity is 58.15% which is from 368.43 × 10⁴ m3 with Chf=25 mD∙m to 582.69 × 10⁴ m3 with Chf=250 mD∙m.
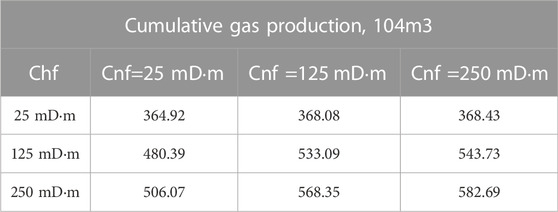
TABLE 3. Comparison of cumulative gas production of a vertical well with different values of hydraulic fracture and natural fracture conductivity.
4.4 Effect of hydrate dissociation rate
Hydrate dissociation rate also imposes a significant influence on the mass and heat transfer in developing gas hydrate. The kinetic model of Kim et al. showed that the hydrate decomposition rate is related to decomposition rate constant (KD), hydrate surface area (Adec), and pressure difference which can be expressed as,
The decomposition rate constant KD is defined as,
where Kd represents the intrinsic hydrate dissociation rate constant, mole/(day·KPa·m2). As we can see from Eqs 33, 34, the hydrate dissociation rate is a time-varying parameter in developing gas-hydrate. To quantitatively examine the effect of hydrate dissociation rate on the gas well productivity of fracture-filled hydrate reservoir, the different values of intrinsic hydrate dissociation rate constant (Kd) were considered, including 0, 1.07 × 10⁴, 1.07 × 10⁹, and 1.07 × 10¹³ mol/(day·KPa·m2). It is noted that an intrinsic hydrate dissociation rate of 0 indicates that the hydrate dissociation is ignored, and the initial hydrate decomposition is more rapid as the increase of Kd with the same values of hydrate surface area and pressure difference. The gas production rates with different values of Kd are illustrated in Figure 11A. As we can see from Figure 11A, the plots show that the gas well productivity is increased as the hydrate dissociation rate is increased, indicating that hydrate dissociation is favorable for the production of gas-hydrate reservoirs.
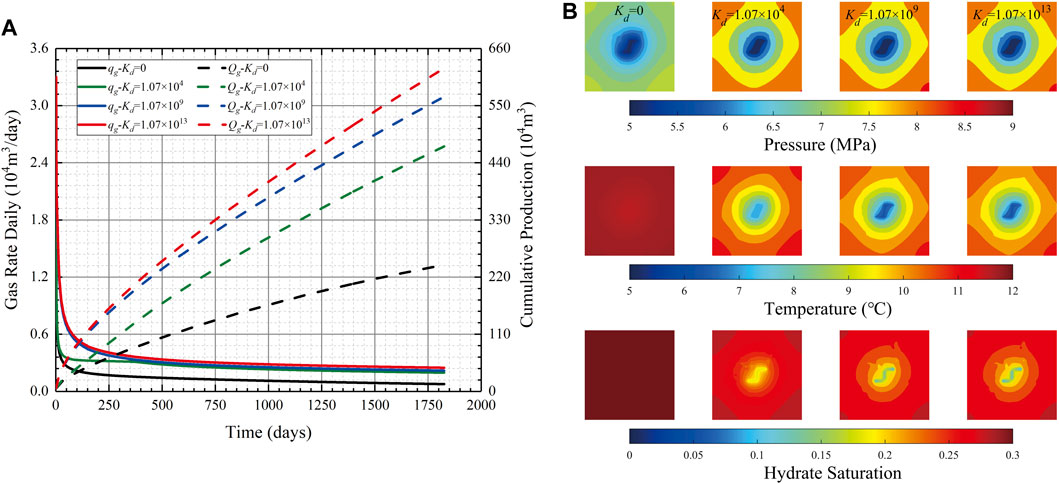
FIGURE 11. Simulation outputs of different scenarios with different values of Kd: (A) comparison of the production rates (B) pressure, temperature, and hydrate saturation field maps at the 1800th production day.
Figure 11B shows the field maps with different values of Kd. An interesting observation is that the pressure drop is most noticeable with the smallest value of Kd = 0, which implies that the drainage area expands most rapidly without hydrate dissociation rate, whereas the temperature is reduced most significantly with the largest value of Kd = 1.07 × 10¹³ mol/(day·KPa·m2) (see temperature field maps in Figure 11B). It is worth noting that, in Sections 4.1–4.4, the highest well productivity comes together with the largest rate of drainage area expansion and the largest rate of temperature reduction. The calculated results in Figure 11B denote that the temperature change can be more highly related to the hydrate dissociation than the drainage area expansion. In addition, the hydrate dissociation rate can lead to a reduction of solid hydrate, thus, one can see that the hydrate saturation is lower near the fracture with a higher hydrate dissociation rate. The minimum matrix temperature along the natural fracture is around 6.3°C with the value of Kd = 1.07 × 10¹³ mol/(day·KPa·m2), whereas the temperature is 7.1°C with the value of Kd = 1.07 × 10⁴ mol/(day·KPa·m2). Furthermore, the thermotactic habit of hydrate nucleation may play a role in the secondary hydrate formation process which would be important in temperature distribution (Yang et al., 2023).
5 Conclusion
In this work, we developed an embedded discrete fracture model to study the gas well productivity in fracture-filled gas hydrate reservoirs. By using a finite-difference scheme and a fully implicit method to solve the non-linear equations, we validated the proposed model against a commercial simulator. In addition, we investigated the influences of natural fractures, fracture conductivity, and hydrate dissociation rate on mass and heat transfer of fracture-filled gas hydrate reservoir. The calculated results lead us to draw the following conclusions.
(1) This proposed numerical model is reliable for evaluating the gas well productivity of fracture-filled hydrate reservoirs considering the effect of natural fractures and heat transfer, and the research results are of great significance to guide the efficient development of fracture-filled hydrate reservoirs.
(2) Both hydraulic fractures and natural fractures can increase gas well productivity. Moreover, the connected natural fractures can exert a more important influence on the well productivity than the unconnected natural fractures. The cumulative gas production is increased by 6.48% as Nnf is increased from 2 to 50, whereas the increase is 43.38% as Nf_con is increased from 0 to 4.
(3) The gas well production rate is increased by increasing fracture conductivity, and the conductivity of hydraulic fracture exerts a more significant influence on the gas well productivity than that of natural fracture. The relative cumulative gas production increment is 15.14% and 58.15% as Chf and Cnf are increased from 25 mD to 250 mD, respectively.
(4) The well productivity is increased as the hydrate dissociation rate is increased. Besides, a higher hydrate dissociation rate can lead to a lower temperature along fractures due to a larger reduction of solid hydrate. The minimum temperature along natural fractures is around 6.3°C with the value of Kd = 1.07 × 10¹³ mol/(day·KPa·m2).
Data availability statement
The original contributions presented in the study are included in the article/Supplementary Material, further inquiries can be directed to the corresponding author.
Author contributions
YC: methodology, conceptualization, writing original draft, review, and editing. BT: conceptualization, reviewing, and editing. WL: conceptualization, reviewing, and editing. CL: investigation, reviewing. YZ: reviewing.
Acknowledgments
The authors are grateful to the National Natural Science Foundation of China (51991365), China Geological Survey Project (No. DD20211350), and Guangdong Major Project of Basic and Applied Basic Research (No. 2020B0301030003).
Conflict of interest
The authors declare that the research was conducted in the absence of any commercial or financial relationships that could be construed as a potential conflict of interest.
Publisher’s note
All claims expressed in this article are solely those of the authors and do not necessarily represent those of their affiliated organizations, or those of the publisher, the editors and the reviewers. Any product that may be evaluated in this article, or claim that may be made by its manufacturer, is not guaranteed or endorsed by the publisher.
Supplementary material
The Supplementary Material for this article can be found online at: https://www.frontiersin.org/articles/10.3389/feart.2023.1132970/full#supplementary-material
References
AlTwaijri, M., Xia, Z., Yu, W., Qu, L., Hu, Y., Xu, Y., et al. (2018). Numerical study of complex fracture geometry effect on two-phase performance of shale-gas wells using the fast EDFM method. J. Pet. Sci. Eng. 164, 603–622. doi:10.1016/j.petrol.2017.12.086
Boswell, R., Collett, T. S., Frye, M., Shedd, W., McConnell, D. R., and Shelander, D. (2012). Subsurface gas hydrates in the northern Gulf of Mexico. Mar. Pet. Geol. 34, 4–30. doi:10.1016/j.marpetgeo.2011.10.003
Brooks, R. H. (1964). Hydraulic properties of porous media. Fort Collins: Colorado State University.
Carroll, J. (2020). Natural gas hydrates: A guide for engineers. Burlington: Gulf Professional Publishing.
Cinco, L., H., Samaniego, V., F., and Dominguez, A., N. (1978). Transient pressure behavior for a well with a finite-conductivity vertical fracture. Soc. Pet. Eng. J. 18, 253–264. doi:10.2118/6014-PA
Esmaeilzadeh, F., Zeighami, M. E., and Fathi, J. (2008). 1-D modeling of hydrate decomposition in porous media. Int. J. Chem. Mol. Eng. 2, 45–51.
Hong, H. N., and Pooladi-Darvish, M. (2003). “A numerical study on gas production from formations containing gas hydrates,” in Canadian international Petroleum conference (Calgary, Alberta: Petroleum Society of Canada). doi:10.2118/2003-060
Kamath, V. A., and Holder, G. D. (1987). Dissociation heat transfer characteristics of methane hydrates. AIChE J. 33, 347–350. doi:10.1002/aic.690330228
Kim, H. C., Bishnoi, P. R., Heidemann, R. A., and Rizvi, S. S. H. (1987). Kinetics of methane hydrate decomposition. Chem. Eng. Sci. 42, 1645–1653. doi:10.1016/0009-2509(87)80169-0
Lee, S. H., Lough, M. F., and Jensen, C. L. (2001). Hierarchical modeling of flow in naturally fractured formations with multiple length scales. Water Resour. Res. 37, 443–455. doi:10.1029/2000WR900340
Li, T., Han, D., Yang, F., Li, J., Wang, D., Yu, B., et al. (2021a). Modeling study of the thermal-hydraulic-mechanical coupling process for EGS based on the framework of EDFM and XFEM. Geothermics 89, 101953. doi:10.1016/j.geothermics.2020.101953
Li, Y., Liu, L., Jin, Y., and Wu, N. (2021b). Characterization and development of marine natural gas hydrate reservoirs in clayey-silt sediments: A review and discussion. Adv. Geo-Energy Res. 5, 75–86. doi:10.46690/ager.2021.01.08
Liu, L., Lu, X., Zhang, X., Liu, C., and Du, B. (2017). Numerical simulations for analyzing deformation characteristics of hydrate-bearing sediments during depressurization. Adv. Geo-Energy Res. 1, 135–147. doi:10.26804/ager.2017.03.01
Moridis, G. J., Kowalsky, M. B., and Pruess, K. (2005). “Depressurization-induced gas production from class-1 hydrate deposits,” in All days (Dallas, Texas: SPE). SPE-97266-MS. doi:10.2118/97266-MS
Moridis, G. J. (2004). Numerical studies of gas production from Class 2 and Class 3 hydrate accumulations at the mallik site, mackenzie delta, Canada. SPE Reserv. Eval. Eng. 7, 175–183. doi:10.2118/88039-PA
Moridis, G. J. (2003). Numerical studies of gas production from methane hydrates. SPE J. 8, 359–370. doi:10.2118/87330-PA
Ning, F. L., Liang, J. Q., Wu, N. Y., Zhu, Y. H., Wu, S. G., Liu, C. L., et al. (2020). Reservoir characteristics of natural gas hydrates in China. Nat. Gas. Ind. 40, 1–24.
Peaceman, D. W. (1978). Interpretation of well-block pressures in numerical reservoir simulation(includes associated paper 6988). Soc. Pet. Eng. J. 18, 183–194. doi:10.2118/6893-PA
Pooladi-Darvish, M., and Hong, H. (2004). “Effect of conductive and convective heat flow on gas production from natural hydrates by depressurization,” in Advances in the study of gas hydrates. Editors C. E. Taylor, and J. T. Kwan (Boston: Kluwer Academic Publishers), 43–65. doi:10.1007/0-306-48645-8_4
Sangnimnuan, A., Li, J., and Wu, K. (2021). Development of coupled two phase flow and geomechanics model to predict stress evolution in unconventional reservoirs with complex fracture geometry. J. Pet. Sci. Eng. 196, 108072. doi:10.1016/j.petrol.2020.108072
Shi, J. (2021). A modified embedded discrete-fracture model to study oil-water two-phase heat and mass transfer in the complex fracture network. Int. J. Heat. Mass Transf. 19.
Sloan, E. D., Koh, C. A., and Koh, C. A. (2007). Clathrate hydrates of natural gases. 3rd ed. Boca Raton: CRC Press. doi:10.1201/9781420008494
Song, Y., and Liang, H. (2009). 2-D Numerical simulation of natural gas hydrate decomposition through depressurization by fully implicit method. Chin. Ocean. Eng. Soc. 23, 529–542.
Sun, X., Nanchary, N., and Mohanty, K. K. (2005). 1-D modeling of hydrate depressurization in porous media. Transp. Porous Media 58, 315–338. doi:10.1007/s11242-004-1410-x
Tonnet, N., and Herri, J.-M. (2009). Methane hydrates bearing synthetic sediments—experimental and numerical approaches of the dissociation. Chem. Eng. Sci. 12.
Wang, P., Zhu, Y., Lu, Z., Bai, M., Huang, X., Pang, S., et al. (2019). Research progress of gas hydrates in the qilian mountain permafrost, qinghai, northwest China: Review. Sci. Sin. Phys. Mech. Astron. 49, 034606. doi:10.1360/sspma2018-00133
Wang, P., Zhu, Y., Lu, Z., Guo, X., and Huang, X. (2011). Gas hydrate in the Qilian Mountain permafrost and its distribution characteristics. Geol. Bull. China 30, 1839–1850.
Xu, S., Feng, Q., Wang, S., Javadpour, F., and Li, Y. (2018). Optimization of multistage fractured horizontal well in tight oil based on embedded discrete fracture model. Comput. Chem. Eng. 117, 291–308. doi:10.1016/j.compchemeng.2018.06.015
Xu, S., Feng, Q., Wang, S., Zha, M., Cui, R., Gao, F., et al. (2017). “A stochastic permeability model for shale formations based on embedded discrete fracture model,” in SPE/AAPG/SEG Unconventional Resources Technology Conference (OnePetro).
Xu, S., Guo, J., Feng, Q., Ren, G., Li, Y., and Wang, S. (2022). Optimization of hydraulic fracturing treatment parameters to maximize economic benefit in tight oil. Fuel 329, 125329. doi:10.1016/j.fuel.2022.125329
Xu, S., Ren, G., Younis, R. M., and Feng, Q. (2021). Revisiting field estimates for carbon dioxide storage in depleted shale gas reservoirs: The role of geomechanics. Int. J. Greenh. Gas. Control 105, 103222. doi:10.1016/j.ijggc.2020.103222
Yan, X., Huang, Z., Jun, Y. A. O., and Huang, T. (2014). The embeded discrete fracture model based on mimetic finite difference method. Sci. Sin. Technol. 44, 1333–1342.
Yan, X., Huang, Z., Yao, J., Li, Y., and Fan, D. (2016). An efficient embedded discrete fracture model based on mimetic finite difference method. J. Pet. Sci. Eng. 145, 11–21. doi:10.1016/j.petrol.2016.03.013
Yan, X., Huang, Z., Yao, J., Li, Y., Fan, D., and Zhang, K. (2018). An efficient hydro-mechanical model for coupled multi-porosity and discrete fracture porous media. Comput. Mech. 62, 943–962. doi:10.1007/s00466-018-1541-5
Yang, L., Guan, D., Qu, A., Li, Q., Ge, Y., Liang, H., et al. (2023). Thermotactic habit of gas hydrate growth enables a fast transformation of melting ice. Appl. Energy 331, 120372. doi:10.1016/j.apenergy.2022.120372
Zhao, J., Liu, D., Yang, M., and Song, Y. (2014). Analysis of heat transfer effects on gas production from methane hydrate by depressurization. Int. J. Heat. Mass Transf. 13.
Nomenclature
Ac Contact area, m2
Adec Hydrate decomposition surface area, m2/m3
Ahs Specific area, m2/m3
Af Contact area of matrix and fracture segments, m2
cs Rock compossibility coefficient, MP-1
cl Gas and water compossibility coefficient, MP-1
Cp Heat capacities of gas, water and hydrate, J/(kg·°C)
dfm Average normal distance between matrix and fracture grid, m
dseg Average normal distance from the fracture to the intersection, m
E Reaction activation energy, J/mole
H Enthalpy of the water and gas, J
Hh Reaction enthalpy, J
k Matrix and fracture permeability, mD
km, kf Matrix and fracture permeability, mD
kr Relative permeability
KD Hydrate decomposition rate constant, mole/(m3·KPa·day)
Kd Intrinsic reaction rate constant, mole/(m3·KPa·day)
mh Mass of hydrate dissociation, kg
ml Mass accumulation due to hydrate dissociation, kg
Mw, Mg, Mh Molecular weight of water, gas, and hydrate, kg/gmole
Nh Hydrate number
P Pressure, MPa
Pe Equilibrium pressure of hydrate, KPa
Pwf Well bottom-hole pressure, MPa
ql,ff Volumetric flow rates between intersecting fractures, m3/day
ql,mf Volumetric flow rates between matrix and fracture, m3/day
ql,w Volumetric flow rates between fracture and well, m3/day
R Gas constant, J/mole-K
re Equivalent wellbore radius, m
rw Wellbore radius, m
Sw, Sg, Sh Water, gas, and hydrate saturation
T Temperature, °C
Te Equilibrium temperature of hydrate, °C
Tref Reference temperature, °C
Tf Transmissibility between fracture segments in same fracture
Tff Fracture-fracture transmissibility
Tm Matrix-matrix transmissibility
Tmf Matrix-fracture transmissibility
Tref Reference temperature, °C
U Internal energy, J
Um Internal energy of matrix system, J
Uf Internal energy of fracture system, J
Ul Internal energy of gas and water, J
Uh Hydrate internal energy, J
Ur Rock internal energy, J
Udiss Heat absorbed by hydrate decomposition
Uff Energy exchange between different fracture, J
Ufw Energy exchange between fracture and well, J
Umf Energy exchange between matrix and fracture system, J
vl Volumetric flow rates, m3/day
Vr Rock volume, m3
Vv Void pore volume, m3
λ Thermal conductivity, J/(m·day·°C)
λeff Effective thermal conductivity, J/(m·day·°C)
λg, λw, λh Water, gas, and hydrate thermal conductivity, J/(m·day·°C)
λff Average thermal conductivity between fractures, J/(m·day·°C)
μ Gas and water viscosity, mPa·s
ρh Hydrate density, kg/m3
ρl Fluid density, kg/m3
ϕ Porosity
ϕv Void porosity
∆l, ∆w, ∆h Length, width, and thickness of fracture grids
∆x, ∆y, ∆z Length, width, and thickness of matrix grids
Superscripts
m Matrix
f Fracture
Subscripts
l Gas and water
h Solid hydrate
Keywords: embedded discrete fracture model, mass and heat transfer, fracture-filled hydrate, natural fractures, numerical simulation
Citation: Cui Y, Teng B, Luo W, Lu C and Zhou Y (2023) A new study of multi-phase mass and heat transfer in natural gas hydrate reservoir with an embedded discrete fracture model. Front. Earth Sci. 11:1132970. doi: 10.3389/feart.2023.1132970
Received: 28 December 2022; Accepted: 01 February 2023;
Published: 13 February 2023.
Edited by:
Jiazheng Qin, Southwest Petroleum University, ChinaReviewed by:
Shiqian Xu, Southwest Petroleum University, ChinaJiafei Zhao, Dalian University of Technology, China
Copyright © 2023 Cui, Teng, Luo, Lu and Zhou. This is an open-access article distributed under the terms of the Creative Commons Attribution License (CC BY). The use, distribution or reproduction in other forums is permitted, provided the original author(s) and the copyright owner(s) are credited and that the original publication in this journal is cited, in accordance with accepted academic practice. No use, distribution or reproduction is permitted which does not comply with these terms.
*Correspondence: Wanjing Luo, bHVvd2FuamluZ0BjdWdiLmVkdS5jbg==